
Abstract
This paper presents a method for reverse engineering landlords’ local strategies, applied to Akelius, a global corporate landlord whose French housing portfolio has been reconstructed by cross-referencing open administrative datasets. The procedure combines a two-component count model identifying spatial investment choices with a fixed-effects model analysing rental pricing practices. Results show that Akelius market entry is structurally constrained by the availability of single-owner buildings and driven by recent price growth, while investment intensity concentrates in areas where housing prices are decoupled from household incomes, signalling strong appreciation expectations. Akelius ranks among the top 10% of most expensive rental managers in its areas of operation, quasi-systematically ‘gaming’ the rent control framework through rent supplements that justify rents exceeding legal caps. This case study illustrates how an investor emblematic of the second wave of financialisation has penetrated a market characterised by low corporate ownership and generally perceived as highly regulated.
Introduction
The private rental sector has grown in many countries over the last two decades (Aalbers et al., 2021; Byrne, 2020), driven either by massive purchases of distressed properties by corporate landlords (Beswick et al., 2016; Christophers, 2022) or by households becoming multiple property owners (Kadi et al., 2020).
In France, households dominate ownership of both single and multifamily housing (Casanova Enault et al., 2025). Large-scale corporate ownership has been marginal since the exit of institutional investors from the residential market in the 1990s–2000s (Nappi-Choulet, 2012), and the relative stability of housing prices during the Global Financial Crisis (GFC) further discouraged financialised investors from entering the market (Le Goix et al., 2021).
Corporate ownership is not entirely absent, however. Signs of increasing financialised investment emerged during the low-interest rate period of the late 2010s (Guironnet et al., 2024). Moreover, large-scale landlords often operate behind the opacity provided by Sociétés Civiles Immobilières (SCIs) — ownership vehicles that, like Limited Liability Companies (LLCs) in the United States (Hangen and O’Brien, 2025), obscure holdings of corporate landlords, large multi-property owners, and international investors (Alstadsæter et al., 2024; Transparency International, 2023), biasing estimates of housing wealth concentration (André and Meslin, 2021; Lei et al., 2024).
Journalistic investigations (Godin, 2022; Rey-Lefebvre, 2024) and a prior study on real-estate portfolio transactions (Guironnet et al., 2024) have drawn attention to Akelius in the Paris region. This investor is emblematic of Global Corporate Landlords (GCLs): it owns and manages large housing portfolios across multiple markets and jurisdictions, including Paris, London, and major Canadian and American cities. Taking this GCL as its starting point, this study maps Akelius’s portfolio and analyses its local investment and management strategies, with the aim of understanding how it has penetrated a market characterised by low corporate ownership.
The article adopts a case study approach using quantitative methods, drawing mostly on external sources rather than the firm’s internal reports. Public data on corporate ownership, company beneficiary registers, real estate transaction deeds, and online rental listings are merged for analysis. A two-component count model explains the spatial distribution of investments, while a fixed-effects model assesses Akelius’s rental pricing policy. This work builds on recent quantitative studies on financialisation that emphasise methodological transparency (Hangen and O’Brien, 2025; Shelton and Seymour, 2024; St-Hilaire et al., 2024).
The results derived from this methodological framework provide new insights into the spatial and pricing strategies of a GCL operating in a housing regime characterised by low corporate ownership and a regulatory framework that, despite France’s reputation for strong tenant protections in the eyes of investors (Gustafsson and Vogt, 2025), leaves significant room for rent extraction. The analysis shows that the availability of single-owner buildings acts as a structural constraint on market entry, fundamentally shaping the geography of investment. Within this constrained opportunity set, Akelius systematically targets areas exhibiting recent price growth and strong appreciation potential. On the rental side, a comparison with other market actors reveals that Akelius consistently lists properties at above-market prices, with rents almost systematically exceeding legal caps through the use of rent supplements, a pricing behaviour that appears to exploit regulatory ambiguities.
The article proceeds as follows. The first section provides a theoretical framework on corporate landlords and their spatial strategies. The second details the datasets and matching method. The third outlines the analytical protocol for examining Akelius’s investment and rental pricing strategies. The fourth presents the results, and the final section offers discussion and conclusions.
Strategies of corporate landlords and adaptation to local context
Characterisation and identification of corporate landlords
The growing corporate ownership of residential real estate is a key manifestation of the broader trend of financialisation (Aalbers, 2019). Rental housing has increasingly been viewed as an asset class by institutional entities (such as investment funds, real estate investment trusts, asset managers, etc.) that own and manage large-scale residential property portfolios. The category of corporate landlords remains somewhat ambiguous and challenging to define, requiring further empirical clarification. It encompasses a variety of legal forms and ownership structures, which may be either direct or indirect (Christophers, 2024). Moreover, this complexity is amplified by a certain opacity in holding structures, largely due to the widespread use of LLCs (Hangen and O’Brien, 2025). For this reason, most approaches to this type of landlord remain top-down. They rely on the analysis of firms’ reports or interviews with stakeholders, and rarely map the extent of a firm’s portfolios. Historically, a comprehensive quantitative understanding of the financialisation of rental housing has been limited by two key factors. First, quantitative analysis has been less prevalent within the field of financial geography (Wójcik, 2022). Second, and critically, the necessary geolocated datasets, linking property ownership to specific locations, have been scarce.
However, this situation is now changing. Recent advances in the availability of cadastral and corporate data are enabling more thorough investigation of property ownership structures. Researchers are increasingly employing methodologies that rely on database linkages, combining cadastral and corporate data to connect property owners to parcels, addresses, or housing units, thereby allowing for more detailed mapping and analysis. Studies in the United States and Canada have mapped the holdings of corporate landlords by uncovering interconnected networks of LLCs at the metropolitan level (Hangen and O’Brien, 2025; Shelton and Seymour, 2024; St-Hilaire et al., 2024), revealing the presence of large-scale property owners in local housing markets. Similar datasets and methods have also revealed complex ownership structures related to institutional investors and indirect housing ownership, extending even to limited-profit housing, as demonstrated by research in Vienna (Kadi, 2025). While the precise techniques for identifying these corporate networks vary, they generally rely on grouping entities with similar naming patterns, registered addresses, or tracing ownership chains to ultimately identify institutional actors.
Strategies of entry and value extraction
Despite the challenges in mapping the financialisation of rental housing, a vast body of urban studies literature, often employing qualitative analysis of corporate reports and interviews, has documented the strategies used by private institutional landlords to both enter and exploit rental markets.
Several well-defined pathways have been identified to explain the influx of these actors. The earliest and most extensively documented is the privatisation of social housing and the deregulation of rent-stabilised parts of the housing stock, directly benefitting large-scale private investors. Notable examples of this trend can be found in Germany, particularly in cities like Berlin (Aalbers and Holm, 2008) and throughout post-reunification Eastern Germany with the marketisation of the municipal housing stock (Bernt et al., 2017). This trend also extends to Sweden, which progressively privatised its social housing sector (Grander and Westerdahl, 2025). Another significant, and often later, route has been ‘accumulation by dispossession’, emerging in the wake of the GFC. This involved the large-scale involvement of ‘vulture funds’ acquiring properties tied to toxic assets, capitalising on market devaluation to purchase them at discounted prices (Beswick et al., 2016). This happened for example in the United States (Fields, 2018), Spain (García-Lamarca, 2021) and Ireland (Byrne, 2015). Finally, a less documented avenue for entry involves acquiring equity in public or regulated entities, resulting in indirect and more discreet ownership (Bigorgne and Le Corre, 2021; Kadi, 2025).
Once established, private institutional landlords utilise strategies that can range from short-term tactical interventions to long-term, strategic investments. A notable strategy is the ‘Buy-it, Fix-it, Sell-it’ model (Christophers, 2022), which involves acquiring properties, making targeted improvements, and selling them for profit, often within a relatively short time frame. Targeted improvements are key elements of gentrification strategies, frequently tied to the exploitation of a rent gap (Boulay, 2022). In these cases, investors acquire properties in areas where current rents are below potential market rates and subsequently increase rents to close that gap (Fields and Uffer, 2016; Wijburg et al., 2018). A particularly aggressive tactic within this category is ‘renoviction’, which describes renovations undertaken to significantly raise rents and displace existing tenants (Baeten et al., 2017). Landlords may also pursue strategies focussed on longer-term value accumulation. These include creating local-scale monopolies through concentrated ownership (Shelton and Seymour, 2024; Tapp and Peiser, 2023) and investing in stable, high-demand properties within established markets (Wijburg et al., 2018). Crucially, these strategies are not mutually exclusive and can be used in combination depending on the local context. Fields and Uffer (2016) documented a case where an investor simultaneously upgraded buildings in central areas to increase rents while reducing maintenance costs in low-income housing estates on the city’s periphery. The target demographic can vary considerably. While gentrification strategies often aim to attract more affluent residents, some investors actively target vulnerable populations. This was demonstrated in Eastern Germany, where investors acquired properties at low cost during a period of local economic decline and rented them to tenants reliant on state welfare programmes (Bernt et al., 2017).
Financialisation in low corporate ownership context
France has been characterised as an ‘extreme case’ of low rental housing financialisation (Gustafsson and Vogt, 2025). Estimating the precise share of corporate landlords remains difficult due to households’ widespread use of SCIs as tax and wealth optimisation vehicles, but two approaches bracket the phenomenon: a restrictive estimate of 0.02% based on Gecina’s holdings (Holm et al., 2023), and a maximalist estimate of 6% accounting for all housing units owned by private legal entities (Casanova Enault et al., 2025). In either case, the vast majority of both single and multifamily housing remains household-owned.
There are three main reasons for the relatively low importance of corporate landlords in France. First, institutional investors exited the residential market in the 1990s and 2000s, selling their portfolios as separate lots (Nappi-Choulet, 2012). Second, in comparison to Spain, Ireland or the United States, the French real-estate market resisted the GFC better because of stricter lending policies (Le Goix et al., 2021). As a result, there was no large supply of distressed properties available for large-scale acquisition. Finally, since the 1980s successive governments have allocated significant portions of their budgets to tax incentives aimed at encouraging wealthy households to invest in the private rental market (Le Brun, 2026). These three phenomena have led to a fragmented property structure, which has, to a certain extent, discouraged large financialised property owners from investing massively in the market.
However, the variegated nature of financialisation cautions against a simplistic dichotomy between financialised and non-financialised markets. Even in Vienna, perceived as highly regulated, commodification progresses through mechanisms that introduce market elements into existing frameworks, such as ‘location bonuses’ within rent control or the demolition of the regulated housing stock (Kadi, 2025). In this city, complex corporate structures furthermore obscure the presence of financialised actors (Kadi et al., 2026). These dynamics merit examination in the French context, which experienced a marked increase in institutional investment between the mid-2010s and the interest rate rise of 2022 (Guironnet et al., 2024). While much of this investment involves state-affiliated funds (Bigorgne and Le Corre, 2021), these have encouraged private capital through profitability-driven fundraising (Wijburg et al., 2024). More broadly, private companies represent the ownership group with the fastest-growing market share in French housing between 2011 and 2020 (Lei et al., 2024).
Data
Main datasets used
The analysis of Akelius’s strategy required the integration of various sources. Three sources were used to map the firm’s portfolio, while two others were used to analyse its rental practices.
The analysis of the acquisition strategy relies on the integration of three public datasets. The first one is the Fichier des Locaux et des Parcelles des Personnes Morales 1 (FLPPM), which provides the cadastral references of built and unbuilt properties owned by legal entities (corporations, public and private institutions, non-profit organisations, etc.), along with their name, unique identification number and the address of the property. This data source provides a snapshot of property holdings as of 1 January each year and is available from 2019 onwards. In this work, the year 2022 is used. The second one is the French company register (Registre National des Sociétés— RNE 2 ) enabling the retrieval of information about companies such as their sector of activity, registered address, managers, and ultimate beneficial owners. 3 Finally, transactions associated with the properties were retrieved from DVF+, 4 an open dataset on transaction deeds, which provides information on selling prices, build-up surface, unit types as well as cadastral references. Significant data work was necessary to link Akelius’s various companies in order to map its internal organisation, asset locations, and related transactions. The method used shares elements with the work of Shelton and Seymour (2024), who identified clusters of companies holding housing units by analysing their names and registered addresses. However, a key difference is that the approach adopted here prioritises identifying parent companies and the private individuals who control them. These steps were enabled by interoperability keys between the databases (specifically, the enterprise identification codes and cadastral references). These steps are described in section A.1 of the Online Supplemental Appendix.
The analysis of the rental pricing strategy required the collection of rental listings both from Akelius and from other managers operating in the same areas. All rental listings from areas where Akelius is active were scraped on 16 January 2022, from SeLoger, one of the two leading real estate listing platforms in France. The resulting database consisted of 8471 listings, of which 7747 contained complete information. The rental manager associated with each listing was then identified, yielding 1018 distinct managers posting between one and 191 listings each. Among them 35 managers had more than 20 listings, including Akelius France Management with 30. Private individuals directly letting their properties were grouped into a separate reference category. In the analysis that used this dataset, only managers with more than five listings in the sample were retained, in order to ensure sufficient observations for reliable coefficient estimation. Descriptive statistics of these listings are presented in Table A6 of the Online Supplemental Appendix.
Finally, in order to better understand the rent setting policy, an additional analysis was carried out using 102 listings posted by Akelius on its website. 5 These listings are more detailed that those published on real estate listing sites with further information about comfort elements and rent supplements. Descriptive statistics of these listings are presented in Table A8 of the Online Supplemental Appendix.
Collected rental listings, both from SeLoger and Akelius’s website, dates from periods following the introduction of rent control in Paris and neighbouring municipalities.
Methods
Modelling the spatial distribution of acquisitions
In the first phase of the study, a regression framework is used to model the count of properties purchased by Akelius in a given area, 6 using a set of local market characteristics as predictors. This first model addresses the following question: what local market conditions predict the location of Akelius’s acquisitions across Greater Paris area?
However, as Akelius is absent from 84% of areas, the dependent variable exhibits a large excess of zero counts that standard Poisson models are not designed to accommodate. Zero-augmented models have been specifically developed to address this issue, of which the two main implementations are hurdle and zero-inflated specifications (Zeileis et al., 2008). A hurdle negative binomial specification is adopted here because its two-stage structure better reflects the sequential nature of the investment decision. The first stage models the decision of whether to enter an area:
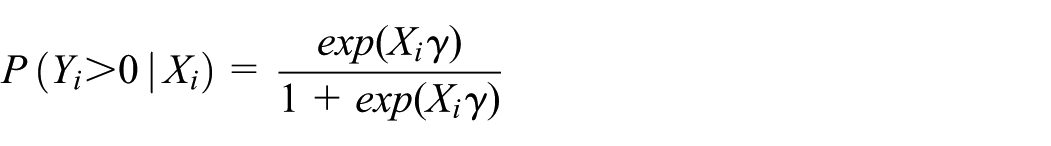
where

with
This sequential approach is both theoretically and statistically grounded, as it reflects two distinct decision-making logics that need not be driven by the same factors. Statistically, the hurdle negative binomial specification substantially outperforms simpler count models (AIC: 323 versus 1878 for the Poisson equivalent; see section A.5 of the Online Supplemental Appendix for full model selection procedure), and the separation of the two equations is supported by the fact that several predictors prove significant in one stage but not in the other.
The selection of explanatory variables was based on previous literature looking at GCLs’ spatial strategies (Beswick et al., 2016; Christophers, 2022; St-Hilaire et al., 2024; Wijburg et al., 2018) as well as on reports published by the firm (Akelius, 2014). They can be grouped into four main categories: variables related to local house prices, variables describing local populations, variables describing the housing stock and variable describing the accessibility and amenities of the different areas. 7 A complete description of the candidate variables can be found in Online Supplemental Table A2. Several of these variables had to be discarded because of multicollinearity resulting from the strong centre-periphery structure of the Paris region. Our variable selection procedure consisted of three steps: analysing the bivariate relationship with the dependent variable, diagnosing multicollinearity, and performing variance inflation factor (VIF) checks on the resulting models (see Section A.4 of the Online Supplemental Appendix for details). Among the groups of highly collinear variables, those that correlated the most with the dependent variable were kept. The final set of explanatory variables is presented below.
Price-to-income rank gap (price_income_gap): difference between the percentile rank of a neighbourhood’s average house price and that of its median household income. This indicator, proposed by Bunten et al. (2024), captures the forward-looking signal embedded in property values: when a neighbourhood’s price percentile exceeds its income percentile, market participants are implicitly anticipating future socio-economic upgrading. It can be connected to the notion of rent gap and also allows the information contained in housing prices and median income (which are strongly correlated) to be combined into a single synthetic measure.
Single-owner buildings (singlown_buildings): number of multifamily buildings owned by a single group of owners. Large corporate landlords mostly focus on whole-building purchases. The availability of such buildings might influence investors’ activity. This variable is of particular theoretical interest as it directly operationalises the concept of property fragmentation discussed in the literature review.
Price change 2011–2013 (price_change_ 2011_2013): signals the (de)valuation dynamic preceding Akelius’ investment period.
Evolution of median household income between 2012 and 2014 (income_ change_ 2012_2014) 8 : indicates pre-investment gentrification dynamics.
Share of vacant housing units (share_vacant_units): indicates lower housing demand locally, which could influence negatively investments.
Share of small dwellings (share_small_ dwellings): indicates the presence of specific building typologies.
The modelling approach started from a fully saturated specification, in which all six candidate variables were included in both the binary and the count equations. Each variable was then removed sequentially, starting with the least significant. The final model was retained on the basis of both goodness of fit (AIC = 323) and parsimony (Online Supplemental Table A5). The resulting specification is asymmetric: single-owner buildings and price change were retained in the binary equation only, while the price-to-income rank gap and the share of vacant units were retained in the count equation. This asymmetry is not imposed a priori but emerged from the data, and is itself a finding on the logics governing market entry and investment intensity, a point explored further in the results section.
Modelling rental pricing strategy
The second part of the empirical strategy addresses the following question: do Akelius’s listed rents systematically deviate from those of other rental managers operating in the same areas, and if so, by how much? To answer this, we compare rental prices across managers using a hedonic fixed-effects model that controls for the physical characteristics of dwellings and their location. The model predicts the log-transformed rents as follows:
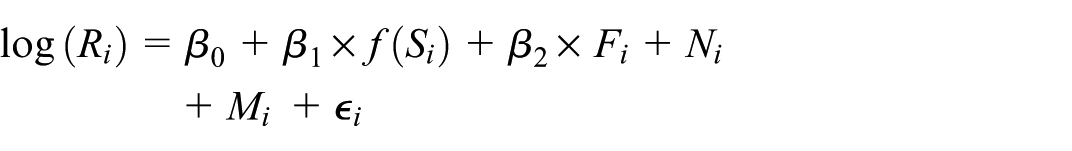
where
To further interpret the rent premium identified in the model, a complementary descriptive analysis is conducted using the 102 listings posted directly on Akelius’s website. This analysis simply compares observed rents with the applicable rent cap regulations in Paris, 9 Est Ensemble, 10 and Plaine Commune. 11
Results
Description of the firm and its portfolio
Once built, the network of the identified companies and private persons is composed of a single connected component (Figure 1(A)). Akelius’s housing and commercial units are owned by 63 different SCIs. 12 They are connected to two parent companies (Akelius France Holding and Akelius France Management). All these companies have the same six beneficial owners. The SCIs own between two and 163 units, with a median of 36 units.
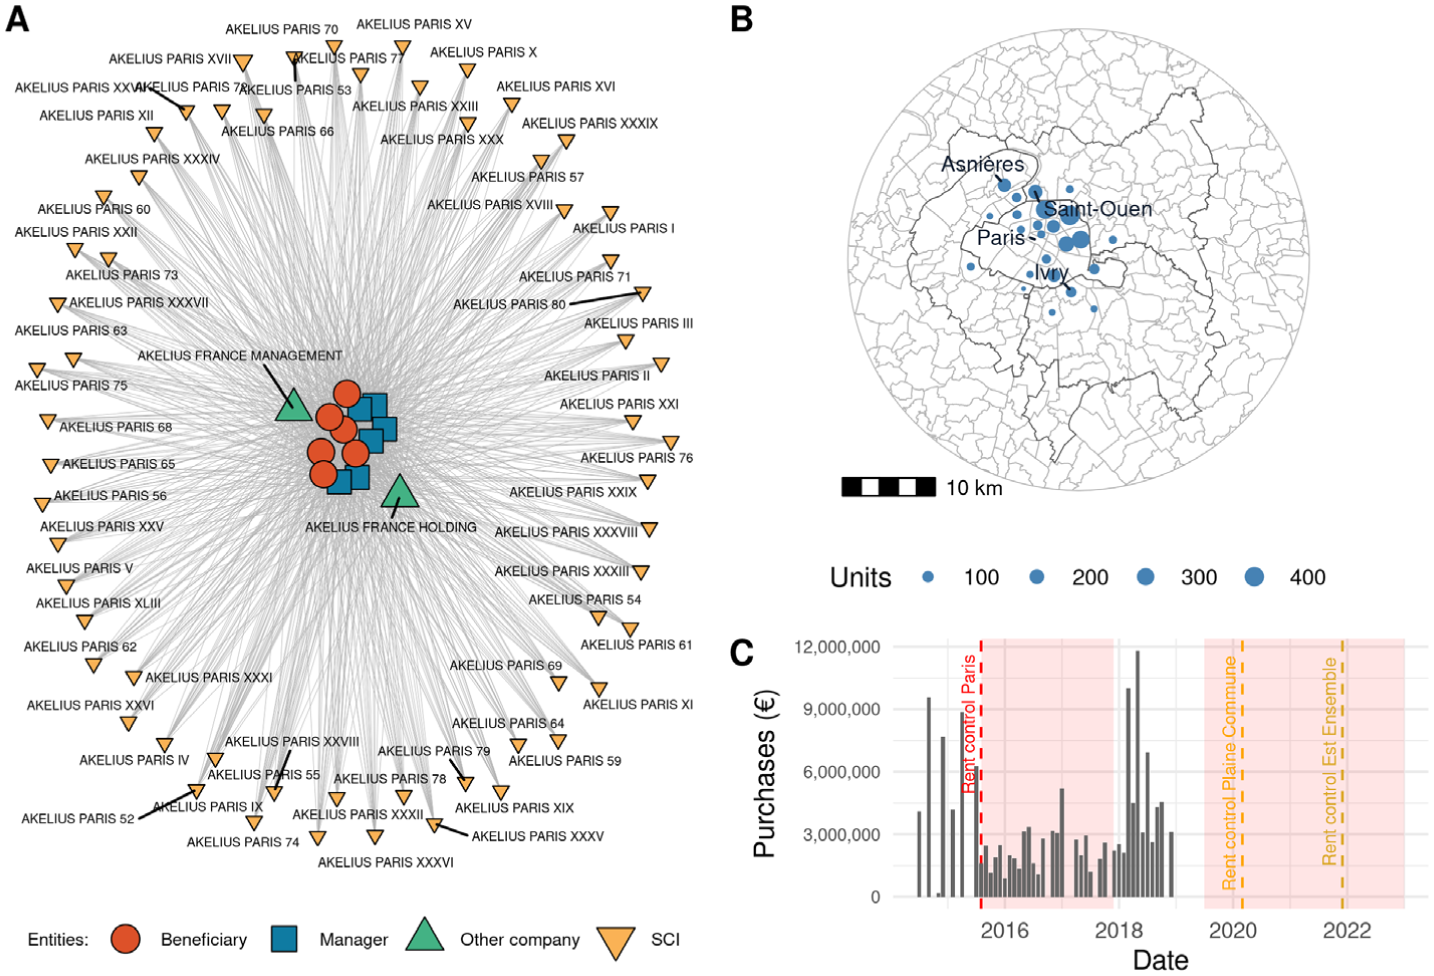
Corporate structure of Akelius (A), geographical distribution of its portfolio in the Paris metropolitan area (B), and timing of acquisitions relative to the introduction of rent control regulations in municipalities where the firm operates (C).
Figure 1(B) maps the portfolio of Akelius. The firm’s investments are all concentrated in or around Paris. This element is a first result as the data work was not restricted to this area. It can be connected to the global strategy of Akelius, which first owned residential properties in Swedish and German cities, before turning to investment in large North American cities and in the top of the European urban hierarchy (London and Paris) in the early 2010s, and then exiting the Swedish and German markets in the early 2020s. The majority of purchased units are located in the northern and eastern parts of Paris and in the inner ring around Paris (Saint-Ouen, Asnières-sur-Seine, Ivry and Montreuil).
Akelius invested approximately €344 million between 2014 and 2018 (Table A1 in the Online Supplemental Appendix). The temporal distribution of investments is shown in Figure 1(C), alongside the dates of introduction of rent control regulations in Akelius’s areas of operation. No clear association between the two is apparent. These transactions led to the purchase of about 1600 apartments and 150 business premises (which probably correspond to the ground floors of residential buildings). The average price per square metre paid by the company over the period was €5602. As a comparison, in 2018, the average price of apartments in the 18th arrondissement of Paris, the area where Akelius invested the most, was €8538/m2, while the average price of business premises was €6295/m2. The price paid by the company is significantly below what households or small business owners would have paid in these neighbourhoods during the same period.
Zone selection and intensity of investments
Table 1 presents the results of the model which aims to reveal Akelius’ local investment strategy. It shows the results of the final hurdle negative binomial model as odds ratios (binary equation) and incidence rate ratios (count equation). The first result of this modelling approach is the asymmetry of the equations, showing that the factors governing Akelius’s decision to enter a given area are distinct from those driving the intensity of investment once entry has occurred.
Result of the model on local investment strategy.
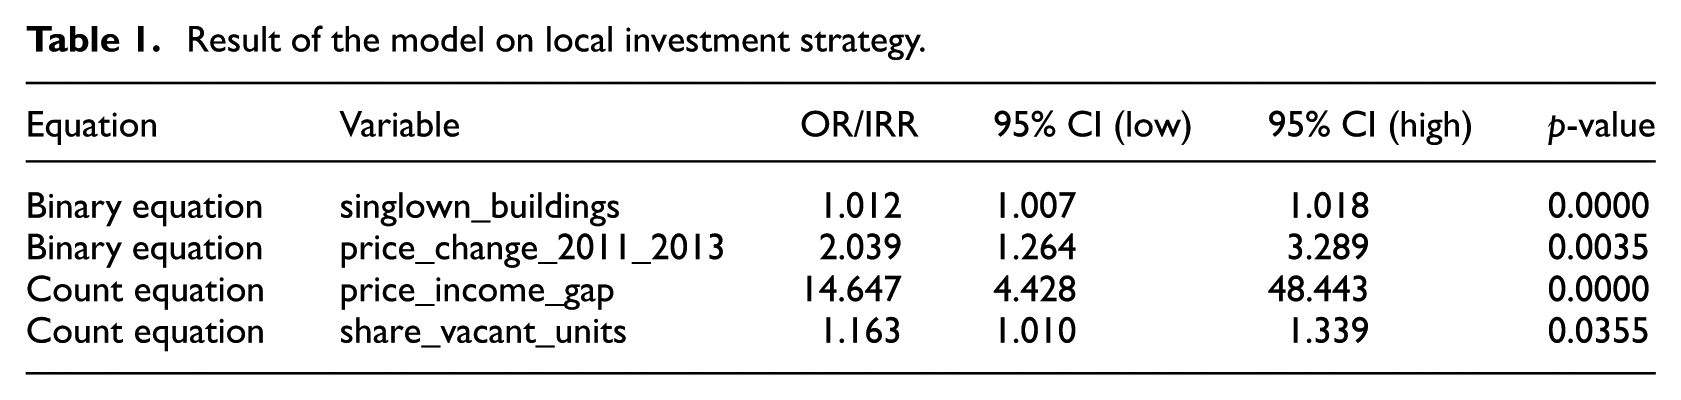
Market entry is shaped by two distinct forces. The first is the availability of single-owner buildings (OR = 1.012, p < 0.001), which operates as a structural precondition rather than a strategic choice: Akelius exclusively targets whole-building purchases and can therefore only operate where such assets exist. Moving from the 25th to the 75th percentile of the stock distribution increases the probability of entry from 0.7% to 2.9%, a fourfold increase. Extending the comparison to the 95th percentile raises this probability to 43.7%, suggesting a non-linear relationship that was further explored through GAM diagnostics (see Online Supplemental Appendix A5). The second driver of market entry is recent price growth (OR = 2.04, p = 0.004). Among areas where the structural constraint is met, Akelius consistently targets those where property values are already rising: moving from the lowest to the highest quartile of price dynamics increases the probability of entry from 0.5% to 15%, a 33-fold increase. Rather than pioneering valorisation, the firm follows existing trends, a behaviour consistent with a ‘momentum’ strategy that bets on the continuation of market dynamics rather than their anticipation.
Once a market has been entered, the intensity of investment is governed by a different set of factors. The dominant one is the price-to-income rank gap (IRR = 14.64, p < 0.001): areas where property prices are structurally decoupled from household incomes, signalling strong market expectations of future appreciation, attract disproportionately more investment. This finding connects directly to the rent gap framework: Akelius concentrates its capital where future rent extraction potential is greatest. A secondary factor is the local vacancy rate (IRR = 1.16, p = 0.036). This result may appear counter-intuitive, as one might expect the firm to invest more heavily in areas of high housing demand. However, in a metropolitan context such as Paris, where rental demand is structurally high throughout, vacancy rates may not signal weak demand but rather areas where the market is undergoing recomposition. Higher vacancy may also reflect greater liquidity, facilitating acquisition for investors whose strategy involves renovating purchased buildings prior to re-letting.
To summarise, the two-component model reveals an investment logic that articulates structural constraints and strategic preferences. Akelius targets markets where prices are already rising and where further appreciation is anticipated. However, its investments can only be made in areas where single-owner properties are available. This supply constraint makes it highly likely that Akelius’s strategy has intersected with that of other actors targeting the same relatively rare property structures, particularly the City of Paris, which seeks similar properties to expand its social housing stock. This may explain the use of pre-emption rights on certain properties targeted by Akelius (Rey-Lefebvre, 2024).
It should be noted, however, that the limited number of invested areas constrains the complexity of the model that can be reliably estimated, a limitation that calls for caution in interpreting finer-grained effects, and that future research covering longer time periods or multiple corporate landlords could help to address.
Rent extraction strategy
The second part of the empirical analysis focuses on Akelius’s rental pricing strategy. Figure 2 plots the coefficients associated with each rental manager from the hedonic fixed-effects model, capturing the premium (or discount) relative to landlords, net of dwelling characteristics and location. Full regression results are reported in Table A7 and Figure A6 of the Online Supplemental Appendix.
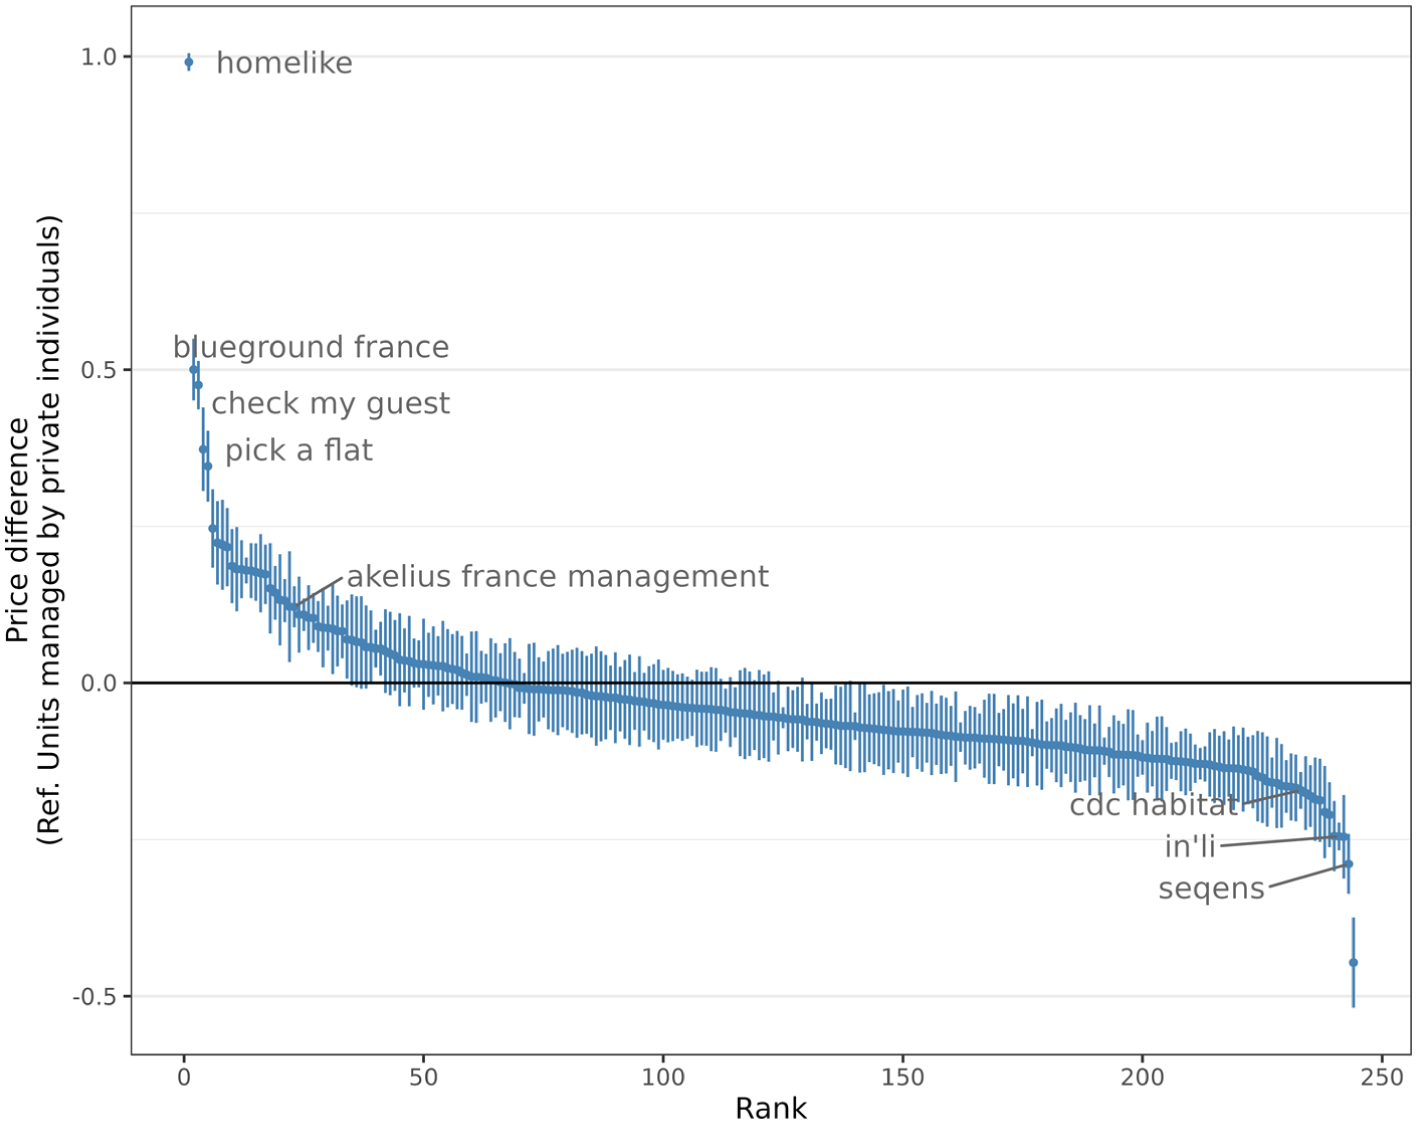
Price differences in rental ads depending on managers.
Figure 2 indicates that Akelius lists its properties at prices 12% (±3%) higher than private individuals renting directly (who are themselves associated with high rental prices). The firm ranks 23rd among the group of 244 studied rental managers. Although this rent premium is positive and statistically significant, it is below those of a group of rental managers composed of Homelike, Blueground France, CheckmyGuest and Pick A Flat (with price premiums ranging from +37% to +99%). These are intermediation platforms that manage rental properties on behalf of third parties and provide furnished apartments for medium-term rentals. At the other end of the spectrum, subsidiaries of large social landlords involved in intermediary housing show significant rent discounts compared to individuals renting directly. It is the case for CDC Habitat (−17%), In’li (−24%) and Sequens (−29%).
Although the hierarchy of price premiums and discounts reflects expected trends among players charging higher or lower rents, these figures alone are not sufficient to conclude that Akelius engages in excessive rent extraction. Our analysis does not account for the actual quality of the properties, which may explain the heterogeneity in the rents observed.
To gain a better understanding of Akelius’s rental pricing practices, a set of 102 listings published directly on the firm’s website was analysed in light of the applicable rent control regulations. The results of this analysis are presented in Figure 3.
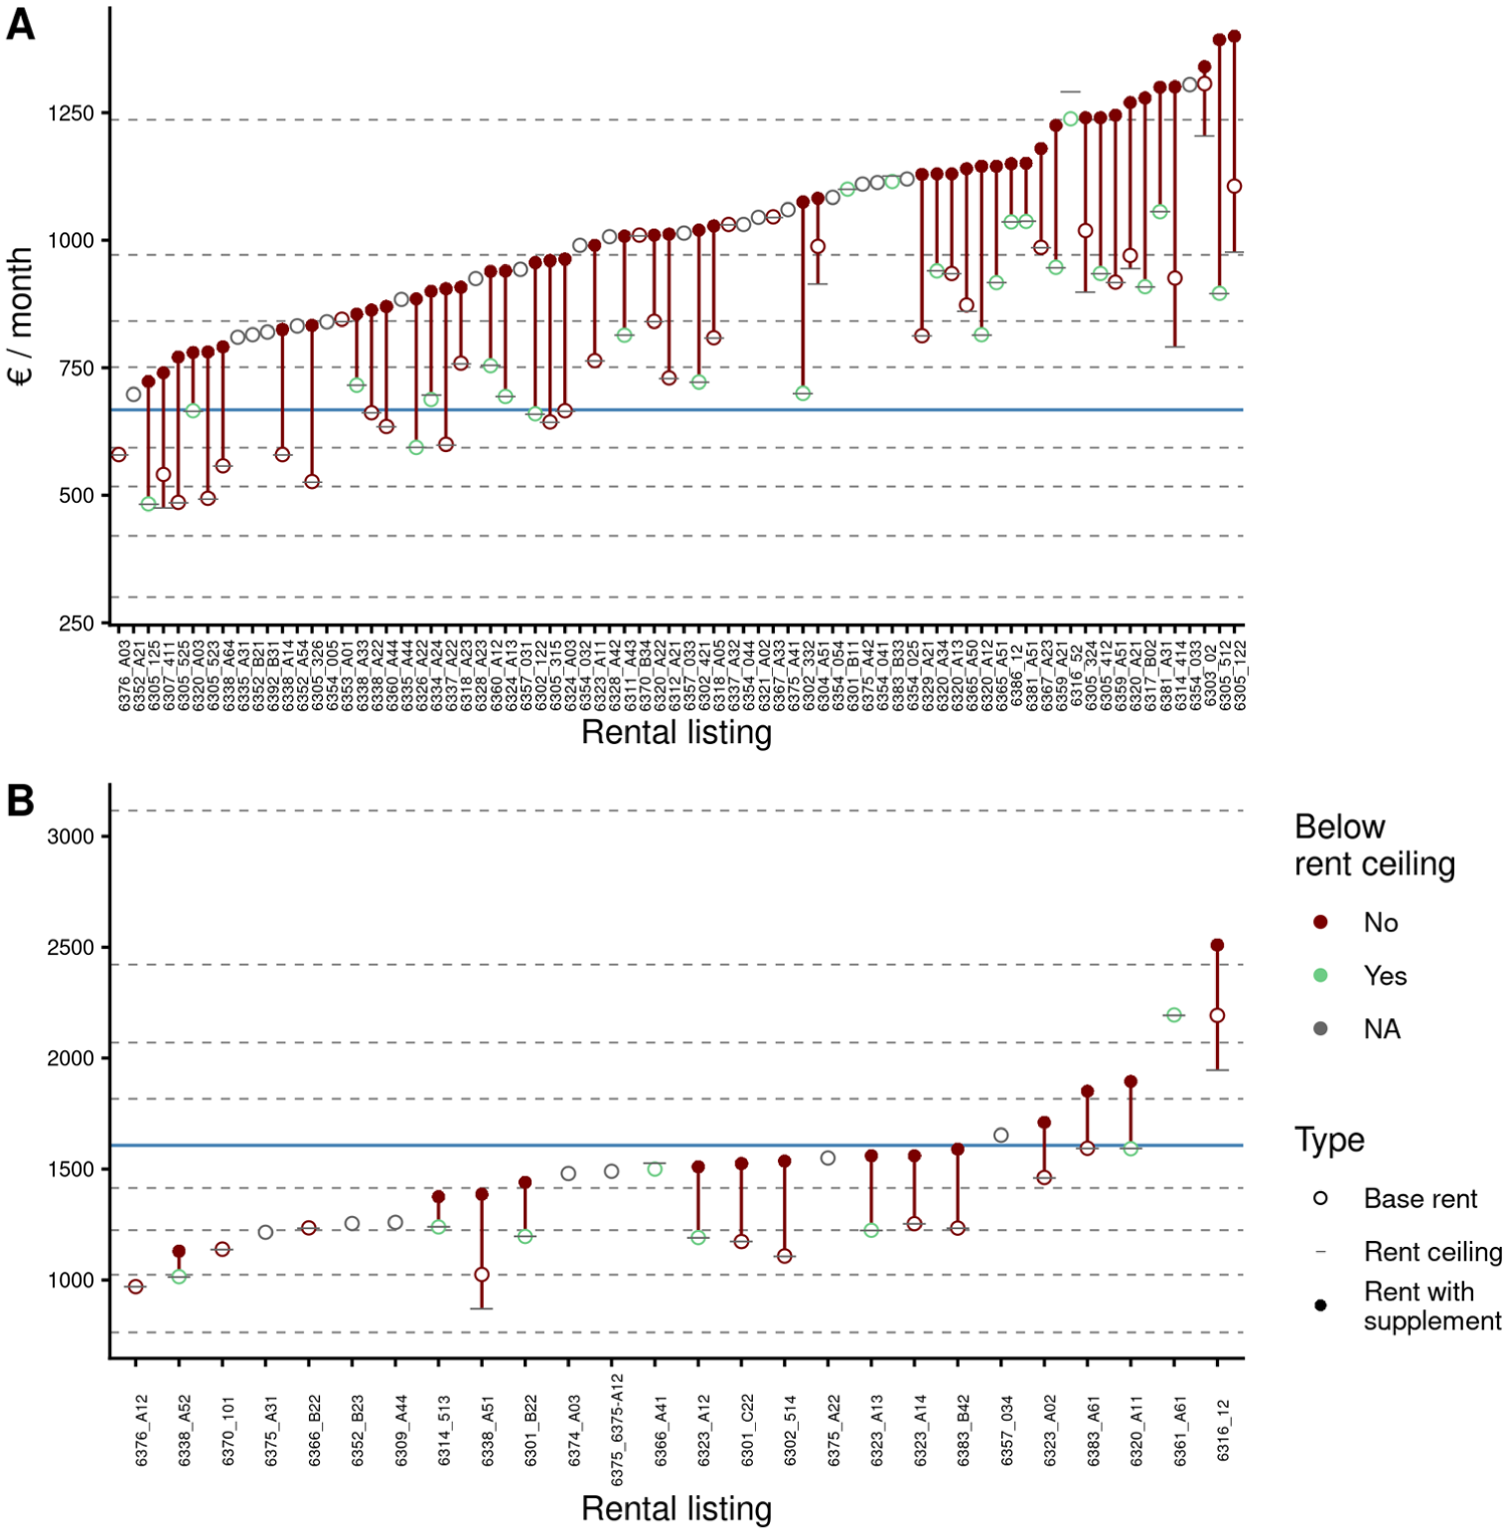
Decomposition of rental prices on studied ads. The figure is divided between one-person apartments (A) and two-person or more apartments (B).
In France, rent control regulation impose a cap based on a reference rent varying by dwelling type, room count, location, and construction year. The ‘upper reference’ rent serves as the legal ceiling. Figure 3 shows that Akelius systematically uses this maximum as a benchmark for setting base rents. Rents are calculated to the nearest square decimetre and rounded up to the nearest whole number, causing some to marginally exceed the cap (likely within the 5% measurement error margin permitted by law). More problematic are six listings where the upper reference rent was computed using a typology with one fewer room than the actual dwelling. Since reference rents per m2 are higher for smaller apartments, this results in base rents significantly above the legal ceiling. An example is shown in Online Supplemental Figure A7.
Under current regulations, landlords can add a rent supplement (‘complément de loyer’) for properties with exceptional characteristics such as a remarkable view, high-end amenities, or architectural uniqueness. Of the 75 listings in rent-controlled perimeters, 62 (83%) apply such a supplement, ranging from €33 to €497 per month (average: €256.6) and representing on average a third of the base rent. Based on Akelius’ 2024 report (Akelius, 2024), the firm owns 1409 units in Greater Paris, 13 approximately three-quarters of which fall within rent-controlled zones. Accounting for the 9.2% vacancy rate published that year, some 959 units were potentially subject to rent supplements. Assuming an average supplement of €212 ± 125 per month (see Online Supplemental Figure A9(A)), Akelius France Management collects an estimated 1 to 3.8 million euros annually through this mechanism, a sum that not only inflates rental revenues but also increases the book value of its properties and, by extension, the firm’s overall valuation.
The question of the ‘exceptional’ characteristics of the properties justifying a rent supplement is difficult to assess with the information available. The analysis of the comfort elements present in the detailed listings (Online Supplemental Table A8 and Supplemental Figure A9) revealed that the two most common energy efficiency ratings of the advertised housing units are D and E (on a scale ranging from A to G), indicating an average to below-average energy efficiency and potentially high heating costs. Among the listings, one even has an energy efficiency of F (very poor insulation) and yet applies a rent supplement, which is not allowed under the regulation. The most common comfort elements described by the listings are the presence of a built-in-kitchen (81%), of parquet flooring (78%), and of basic household items such as a washing machine (48%), a clothes drier (31%), or a dishwasher (30%). Only 2% of units have a terrace. Although the available information does not allow a firm conclusion as to the absence of exceptional characteristics in the advertised ads, a large proportion of the dwellings described seems to have fairly standard features. In any case, after three months following the lease signature, it is no longer possible to challenge the rent supplement.
The outcome of this pricing policy is a very low affordability of most advertised units. Figure 3 displays the affordability thresholds for households in the Île-de-France region across different income groups. For apartments suitable for a single person 14 (n = 76), only one unit is affordable for a household earning below the median income, while 45 (59%) are affordable for households in the 9th and 10th income deciles. For larger apartments suitable for two or more people, affordability is higher, with three-quarters of the units priced below the median income threshold for a couple.
Conclusions and discussions
This study provides insights into the mechanisms of area selection and investment choices by a GLC into a low corporate ownership housing regime, analysed through a model of localised investment strategy. It has revealed that one of the key constraints shaping Akelius’s strategy is the presence of single-ownership buildings. Our findings complement those of St-Hilaire et al. (2024), who emphasise the role of building typology in shaping the spatial strategy of financialised landlords. The relative scarcity of single-owner buildings in France is a well-known feature among institutional investors (Gustafsson and Vogt, 2025), rooted in the historical breakup of residential complexes by institutional landlords (Nappi-Choulet, 2012). This structural fragmentation may partly explain the limited extent of rental market financialisation in France compared to countries where large portions of the social housing stock were privatised, creating large-scale acquisition opportunities for institutional investors (Bernt et al., 2017; Grander and Westerdahl, 2025). This further underscores the importance of path dependency in shaping financialisation processes (Guironnet et al., 2024), which may account for why much of the ongoing financialisation of the French housing market is taking place through build-to-rent.
Despite this acquisition constraint, Akelius has nonetheless tended to invest preferentially in areas with appreciation potential. The fact that it selects areas experiencing recent price growth and concentrates most of its investments in areas with strong market expectations suggests that the firm is not a first mover and limits its risk exposure. Properties purchased by Akelius are renovated before being re-let, connecting its approach to a classic rent gap strategy. However, the analysis of detailed property listings revealed that, given the proportion of apartments with average to below-average energy ratings, these renovations are not profound. The firm pursues ‘concept renovations’ focussing on internal upgrades rather than structural improvements. According to Kadıoğlu and Listerborn (2026), this approach was pioneered by Akelius in Sweden. A full analysis of Akelius’s exit strategy falls outside the scope of this paper, as the firm has only recently begun divesting its Parisian properties. It is nonetheless worth noting that a small number of sales occurred in 2023 and 2024, with one of the firm’s recent reports justifying such disposals on the grounds that the buildings required ‘large capital investment’ (Akelius, 2024). Akelius’s strategy is thus best understood as a rent gap approach without deep structural investment: rather than upgrading buildings, the firm seems to capture appreciation potential through market timing and cosmetic renovation. This strategy is further reinforced by its pricing behaviour: Akelius systematically lists properties at rents above those of most long-term rental market players. Taken together, these two dimensions position the firm as benefitting from (and contributing to) ongoing rental gentrification dynamics (Van Criekingen, 2010), securing a stable stream of above-market rents consistent with the long-term value extraction logic associated with the second wave of financialisation (Wijburg et al., 2018).
The detailed analysis of its rental listings also revealed that the company almost systematically applies rent supplements to justify rents exceeding the legal caps. An analysis of the amenities associated with these properties did not reveal any exceptional features that would normally justify such surcharges. This case illustrates how the French rent control law remains ambiguous regarding the justification of rent supplements, an ambiguity that can be exploited in a context of information asymmetry between landlords and tenants. Akelius’ approach to rent control can be put in perspective with the tendency of corporate landlords to challenge existing rental regulations. In a recent study on the Swedish rental market, Kadıoğlu and Listerborn (2026) have shown that corporate landlords challenge existing norms, for example, by renegotiating rents several times in the year, while the standard practice is to do it once. The quasi-systematic use of rent supplements by Akelius in France can be understood in a similar light.
More broadly, the existence of rent supplements within the rental regulation framework might explain why roughly a third of rental listings in Paris do not comply with rent control ceilings and why this proportion has not shown any clear trend towards a decrease since the law was implemented in 2019 (Breuillé et al., 2024). Closing this loophole should be given particular attention as part of the renewal of the rent control law, which is scheduled for 2026. Such practices raise concerns, particularly regarding the increasing residential displacement affecting lower-income households in the Paris region (Guibard and Le Goix, 2024).
Finally, this study has demonstrated the effectiveness of using two-component models to analyse a landlord’s investment strategy, an approach with potential for broader applications in studying the spatial strategies of different categories of market players. Further methodological development is nonetheless needed to integrate disinvestment dynamics into this framework, as the exit strategies of financialised landlords become increasingly observable and relevant to understanding the full lifecycle of corporate real estate investment. A related open question concerns the extent to which such strategies reflect systematic, data-driven decision-making or a more intuitive, experience-based assessment of market conditions. Both attitudes are documented in the literature (Fields, 2018; Le Brun, 2023). The use of a fixed-effects model based on property management has also proven effective in highlighting differentiated pricing strategies across market players. Beyond the case of Akelius, it has incidentally revealed exorbitant price levels set by medium-term rental intermediaries, recent and relatively unknown players in the Parisian market whose practices and impact on local housing markets warrant further investigation.
Supplemental Material
sj-docx-1-usj-10.1177_00420980261457835 – Supplemental material for Slipping through the gap: Modelling Akelius investment strategy in the Paris region
Supplemental material, sj-docx-1-usj-10.1177_00420980261457835 for Slipping through the gap: Modelling Akelius investment strategy in the Paris region by Antoine Peris in Urban Studies
Footnotes
Acknowledgements
The author thanks Laure Casanova Enault, Rémi Lei, Guilhem Boulay and Christ Raphaël Biawa Diegamounoua for the comments and feedback throughout this research. The author would also like to thank the two anonymous reviewers whose careful reading and insightful comments contributed greatly to improving this paper.
Funding
The author disclosed receipt of the following financial support for the research, authorship, and/or publication of this article: This work was funded by the FR Agorantic [24-DON-1] and the Chaire Geodata Immobilier Foncier (GIF) of Avignon Université.
Declaration of conflicting interests
The author declared no potential conflicts of interest with respect to the research, authorship, and/or publication of this article.
Data availability statement
Data is available upon request.
Supplemental material
Supplemental material for this article is available online.
Notes
References
Supplementary Material
Please find the following supplemental material available below.
For Open Access articles published under a Creative Commons License, all supplemental material carries the same license as the article it is associated with.
For non-Open Access articles published, all supplemental material carries a non-exclusive license, and permission requests for re-use of supplemental material or any part of supplemental material shall be sent directly to the copyright owner as specified in the copyright notice associated with the article.