
Abstract
Depression is a significant psychological concern affecting adolescent development, yet research on latent subgroups and symptom interactions remains limited. Guided by an individual-centered approach and psychopathological network theory, this study surveyed 3,704 Chinese adolescents (Mage = 16.19, SD = 0.44) to explore latent subgroups of depression and their symptom networks using latent profile and network analysis. Three profiles emerged: normal, latent pathological, and pathological, with gender significantly predicting membership. Core symptoms included upset and low mood (normal and latent pathological) and poor appetite and low mood (pathological). Network comparisons revealed significant group differences. Findings highlight the need to monitor male students’ mental health and target core symptoms like upset, low mood in interventions.
Keywords
Introduction
In recent years, depression has garnered significant attention as a major psychological concern affecting adolescent growth and development. According to the World Health Organization (WHO), approximately 1.1% of adolescents aged 10 to 14 and 2.8% of those aged 15 to 19 experience depressive symptoms globally (WHO, 2021). The China National Mental Health Development Report (2021-2022) indicates that approximately 14.8% of adolescents are at risk for depression, with 4.0% of this group facing a high risk of severe depression (Fu & Zhang, 2023). Adolescence is a turbulent yet critical developmental period. The rapid physical and psychological changes during this stage make adolescents particularly vulnerable to mental health issues (Shorey et al., 2021), and their mental well-being at this time is crucial to their long-term. Studies have shown that adolescents with depression often face declines in self-esteem (Orth & Robins, 2013), social isolation (Alsadoun et al., 2023), and academic difficulties (Fröjd et al., 2008), and these negative impacts may persist into adulthood, affecting overall quality of life (Copeland et al., 2021). Furthermore, adolescent depression is closely linked to increased suicide risk (Thapar et al., 2012). It is evident that adolescent depression has become an urgent global public health concern.
Although a large body of research on the epidemiology and clinical characteristics of depression, studies on subgroups within depression among adolescents remain limited. Previous studies have mainly focused on examining the relationship between adolescent depression and other factors, such as individual factors (e.g., gender, age, personality traits) (Hyde & Mezulis, 2020), parental phubbing (X. Wang et al., 2019), and social support (Scardera et al., 2020). However, these studies based on a variable-centered perspective have not distinguished the heterogeneity within depression among adolescents, a limitation that may affect the specificity of interventions targeted at this group. In recent years, person-centered approaches have been increasingly applied to uncover the heterogeneity of depression, particularly in identifying the symptom characteristics of latent subgroups (C. L. Wang et al., 2018). For example, Chen et al. (2021) used latent profile analysis to identify distinct subgroups of adolescent depressive symptoms, finding significant differences in emotional stability and cognition across groups (Chen et al., 2021). Additionally, studies by Y. Wang et al. (2021) and Herman et al. (2007) applied latent profile analysis to identify various subgroups among adolescents and further explored differences in mental health outcomes, such as sleep and somatic symptoms, among these subgroups (Herman et al., 2007; Y. Wang et al., 2021). Most of these studies have highlighted complex external factors contributing to adolescent depression, such as family environment, school atmosphere, and interpersonal relationships. Notably, beyond external causes, the interactions among internal symptoms of psychological disorders (i.e., depression) may be even more direct influences (Borsboom & Cramer, 2013). Therefore, while latent profile analysis can reveal heterogeneity in depression among adolescents, it does not support symptom-level examination of depression, limiting a comprehensive understanding and clinical application for depression among adolescents.
Psychopathological network theory offers a novel perspective by conceptualizing mental disorders as complex networks of interacting symptoms (Fried et al., 2017), rather than isolated entities for classification or analysis of causal links with external variables. This theory challenges traditional classification systems. It emphasizes the direct causal links and dynamic interactions among symptoms. These insights provide new approaches to the research and treatment of mental disorders (Borsboom, 2017; Borsboom & Cramer, 2013). Based on the psychopathological network theory, depression is considered as a dynamic causal network formed by the interactions among various depressive symptoms. The research method corresponding to psychopathological network theory is network analysis. When applied to the study of a single disorder (e.g., depression), it enables the identification of core symptoms and relationships among symptoms within the disorder (Epskamp & Fried, 2018), thereby revealing key pathological features of adolescent depression. Core symptoms are those most closely linked to other symptoms within a network, and identifying and intervening with these core symptoms can help weaken the pathological connections in the overall depressive symptom network. In clinical practice, core symptoms are thus often considered effective intervention targets for preventing mental disorders (Borsboom & Cramer, 2013; Cramer & Borsboom, 2015). Furthermore, evidence supports the view that adolescent depression exhibits high heterogeneity, suggesting that targeted prevention and intervention strategies for adolescent depression may be more effective than universal approaches (Thapar et al., 2022). However, to our knowledge, no studies have yet examined the symptom network characteristics of latent subgroups within the depression among adolescents. By examining the core symptoms of these latent subgroups, this approach enhances our understanding of different depression subtypes and strengthens the specificity and effectiveness of interventions. Additionally, by comparing symptom network characteristics across different depression subtypes in adolescent populations, we aim to provide empirical evidence for personalized prevention and intervention strategies, contributing to the overall improvement of adolescent mental health.
The Current Study
In summary, this study combines an individual-centered perspective with psychopathological network theory. It first uses Latent Profile Analysis (LPA) to identify latent classes of depression among adolescents, and then conducts a network analysis within each class. Based on relevant theories and existing empirical studies, we hypothesize that: (1) there are different latent classes within the depression among adolescents; (2) the core symptoms in the symptom networks differ across latent classes; and (3) the three latent classes differ significantly in
Methods
Participants
This study conducted a survey of adolescents using convenience sampling, with participants primarily from three public schools in eastern China. The study was approved by the Human Research Ethics Committee of South China Normal University. (approval no. SCNU-PSY-2023-417) on Month December, 2023. Data were collected in June 2024, with a total of 3,847 participants. All participants signed informed consent forms. After data collection, missing data were deleted listwise, resulting in a final valid sample of 3,704 participants. The age of adolescents ranged from 15 to 19 years (Mage=16.19, SD = 0.44). Among them, 1,900 were male (51.3%) and 1,804 were female (48.7%); 652 were only-child (17.6%) and 3,052 non-only-child (82.4%); 92% of fathers (n = 3,406) and 85% of mothers (n = 3,147) maintained stable employment.
Measures
Depression
In this study, adolescent depressive symptoms were assessed using the Center for Epidemiological Studies Depression Scale (CES-D), developed by Radloff in 1977 (Radloff, 1977), which has been widely used internationally (Zhang et al., 2010) and is well-suited for adolescent depression screening. The CES-D comprises four dimensions: depressed affect, positive affect, somatic symptoms, and interpersonal distress. This scale contains 20 items, each rated on a 4-point Likert scale (1 = rarely or none of the time, 4 = most or all of the time). The total score is calculated by averaging all item scores, with higher scores indicating greater depressive symptom severity. The scale demonstrated high internal consistency, with a Cronbach’s α of 0.910 in this study.
Covariates
The study included several covariates, primarily age, gender, whether the participant is an only child, parental occupational stability, and parents’ education level, ranging from 1 (never attended school) to 8 (doctoral degree). More details about these variables can be found in Section participants.
Data Analysis
SPSS 26.0 was used for reliability calculation (Cronbach’s alpha). Next, latent profile analysis (LPA) of depressive symptoms was conducted in Mplus 8.6, with model selection guided by information criteria (AIC, BIC, aBIC), entropy, and likelihood ratio tests (LMR, BLRT) (Peugh & Fan, 2013). Demographic variables (e.g., gender, age, only-child status, and parental job stability) were subsequently included in multinomial logistic regression to examine predictors of latent class membership. Then, network analysis was conducted in R 4.4.1 for each latent class to identify core symptoms and compare symptom networks across classes. Networks were estimated using the Graphical Least Absolute Shrinkage and Selection Operator (GLASSO) algorithm, producing regularized partial correlation networks (Epskamp & Fried, 2018). Edge weights represent regularized partial correlation coefficients between symptoms, controlling for all others, reflecting unique associations rather than mere co-occurrence. Network visualization and centrality metrics were computed using the qgraph package in R (Epskamp et al., 2012). Centrality indices identify the most influential symptoms, which may trigger or maintain others and serve as intervention targets (Borsboom & Cramer, 2013). Core symptoms were selected by ranking the top four according to betweenness, closeness, and strength (Mullarkey et al., 2019; S. S. Huang et al., 2022). Furthermore, to ensure the reliability of network analysis results, we employed the R package bootnet for case-dropping bootstrap stability analysis (Epskamp & Fried, 2018) and assessed the accuracy of edge weights using non-parametric bootstrap estimation (1,000 repetitions). NetworkComparisonTest was applied to assess Network Invariance, Global Strength, and Centrality Invariance across classes using 5,000 permutations (S. Huang et al., 2021; S. S. Huang et al., 2022).
Results
Latent Profile Analysis of Depression Among Adolescents
To identify the optimal model for latent classes of depression among adolescents, a latent profile analysis was conducted using the four dimensions of adolescent depression as indicators, with models ranging from one to five classes (see Table 1).
Fit Indices for Latent Profile Analysis of Depression Among Adolescents (N = 3704).
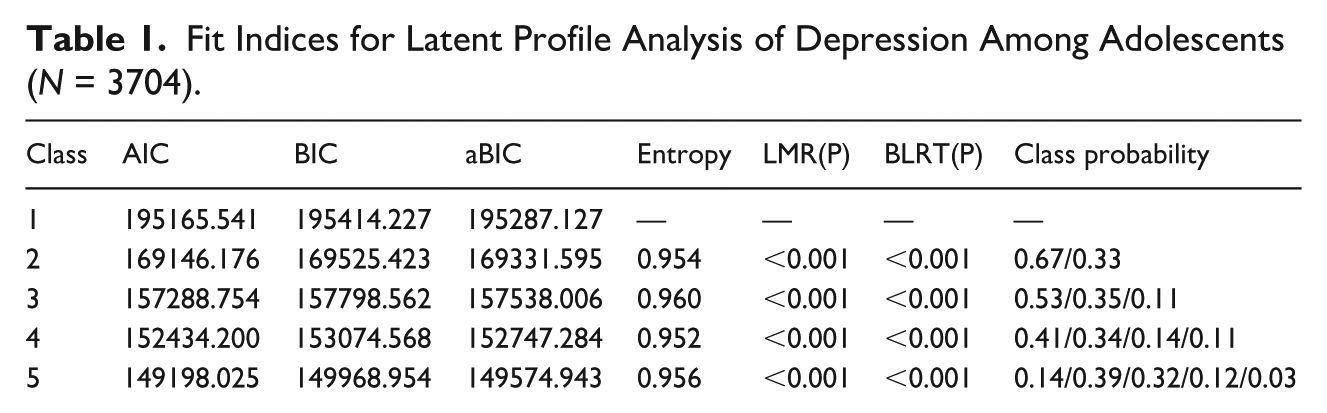
As shown in Table 1, model selection was based on multiple criteria, including information indices (AIC, BIC, aBIC), entropy, and likelihood ratio tests (LMR and BLRT). With increasing class numbers, AIC, BIC, and aBIC progressively decreased, reaching their minimum in the five-class model, indicating improved relative model fit; Entropy (0–1) reflects classification clarity, with higher values indicating better separation. The LMR and BLRT compare k-class and k–1-class models, where a significant p-value (typically < 0.05) suggests that the k-class model fits significantly better. According to Table 1, Although the 4- and 5-class models showed slightly lower information criteria, they produced small class proportions and reduced classification precision. In contrast, the 3-class model demonstrated clearer and more accurate classification (entropy = 0.960). Therefore, the 3-class solution was selected as the optimal model.
A graph was created based on the scores of the three latent classes of depression among adolescents across four dimensions (see Figure 1). The Class 1 group had the highest proportion and the largest number of participants (1,982), showing almost no depressive symptoms, and was labeled as the “Normal group.” The Class 2 group had a moderate proportion (1,304 participants) and exhibited mild depressive symptoms, thus named the “Latent pathological group.” The Class 3 group had the smallest proportion and the fewest participants (418), displaying the most severe depressive symptoms, and was referred to as the “Pathological group.”
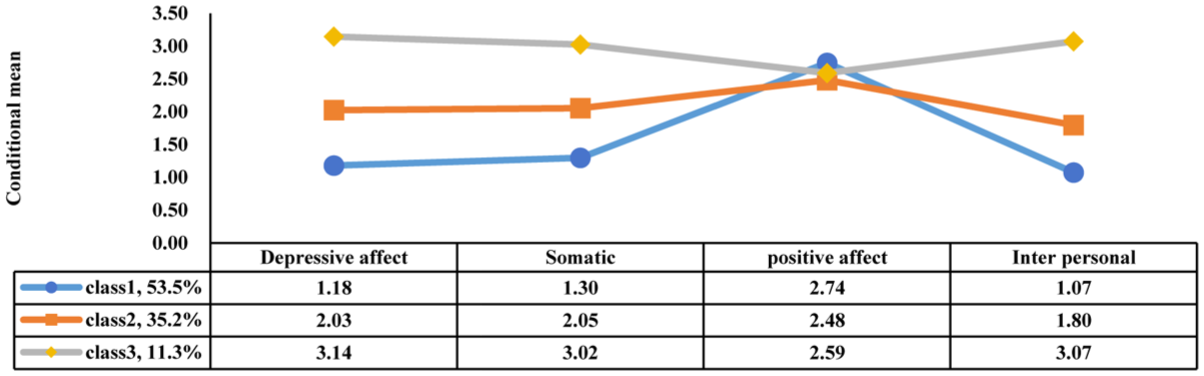
Scores of three latent classes of adolescent depression across 4 dimensions.
The Influence of Demographic Variables on the Latent Classes of Depression Among Adolescents
Based on the results of latent profile analysis, a multinomial logistic regression analysis was conducted to examine the influence of demographic variables on the latent classes of depression among adolescents. The three latent classes were used as outcome variables (with Class 3, the pathological group, as the reference category), while gender (male as reference), age, only-child status (no-only-child as reference), parental job stability (unstable as reference), and parental educational level were included as predictors.
The results indicated that, compared to the pathological group, older adolescents were less likely to be classified into the latent pathological group (OR = 0.71, 95% CI [0.54, 0.93], p = .012), but age showed no significant effect on classification into the normal group (OR = 0.85, p = .185). Regarding gender, females were significantly more likely than males to be classified into both the normal group (OR = 1.44, 95% CI [1.15, 1.79], p = .001) and the latent pathological group (OR = 1.50, 95% CI [1.18, 1.89], p = .001), indicating that males were more likely to experience severe depression. All other demographic variables significantly predicted class membership, including only-child status, parental employment stability, and parental educational levels (all p < .05).
Symptom Network and Comparison of Latent Classes of Depression Among Adolescents
Symptom Network of Latent Classes of Depression Among Adolescents
The results indicated that the estimated networks showed acceptable stability and accuracy based on bootstrap analyses. Figure 2 illustrates the symptom networks for the three latent classes of depression among adolescents. In Class 1, strong connections are observed between symptoms 12 and 16, 6 and 7, as well as between symptoms 4 and 8. In Class 2, the strongest connection is noted between symptoms 12 and 16. Additionally, symptoms 5 and 7, along with symptoms 15 and 19, show close interconnections. Class 3 exhibits numerous strong connections, particularly between symptoms 15 and 19, 12 and 16, 6 and 7, and 18 and 19.
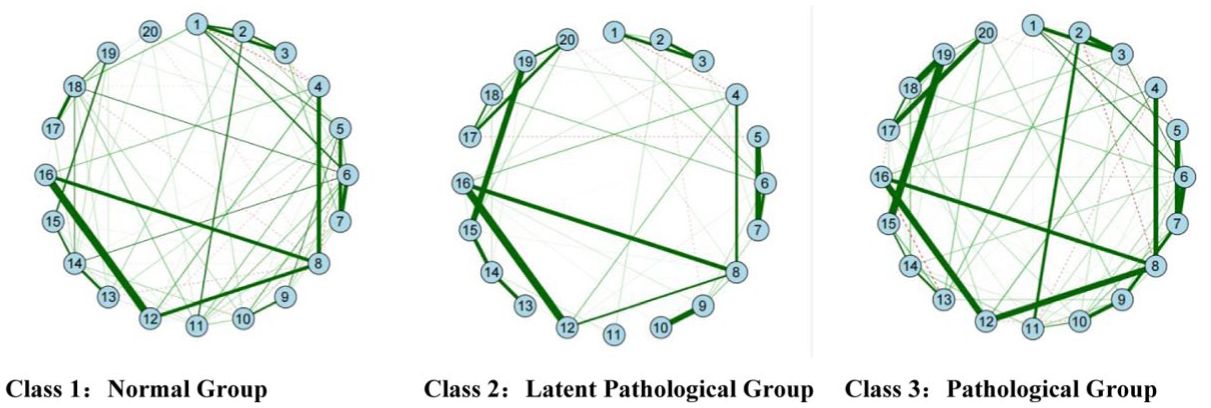
GLASSO networks of the three latent classes of depression among adolescents.
Centrality Indicators of the Symptom Networks of Depression Among Adolescents
As shown in Table 2, the core symptoms of the normal group were 1 = upset (Betweenness = 46, Closeness = 0.00321, Strength = 0.900), 6 = low mood (Bet = 43, Clo = 0.00321, Str = 0.997), 8 = hopeful about the future (Bet = 38, Clo = 0.00215, Str = 1.077), and 18 = feeling sad (Bet = 34, Clo = 0.00277, Str = 0.875). In the latent pathological group, the most central symptoms were 1 = upset (Bet = 51, Clo = 0.00217, Str = 0.470), 6 = low mood (Bet = 63, Clo = 0.00236, Str = 0.630), 18 = feeling sad (Bet = 44, Clo = 0.00207, Str = 0.413), and 19 = feeling unloved (Bet = 46, Clo = 0.00190, Str = 0.709). For the pathological group, the core symptoms included 2 = poor appetite (Bet = 30, Clo = 0.00439, Str = 0.856), 6 = low mood (Bet = 21, Clo = 0.00385, Str = 1.077), 8 = hopeful about the future (Bet = 26, Clo = 0.00378, Str = 1.090), and 13 = talking less (Bet = 26, Clo = 0.00418, Str = 0.879). Notably, the highly central symptoms did not fully overlap with those involved in strong edges across the three symptom networks (see Table 2 and Figure 2). This pattern will be discussed further in the Discussion.
Centrality Indicators of the Symptom Networks for Latent Classes of Depression Among Adolescents.
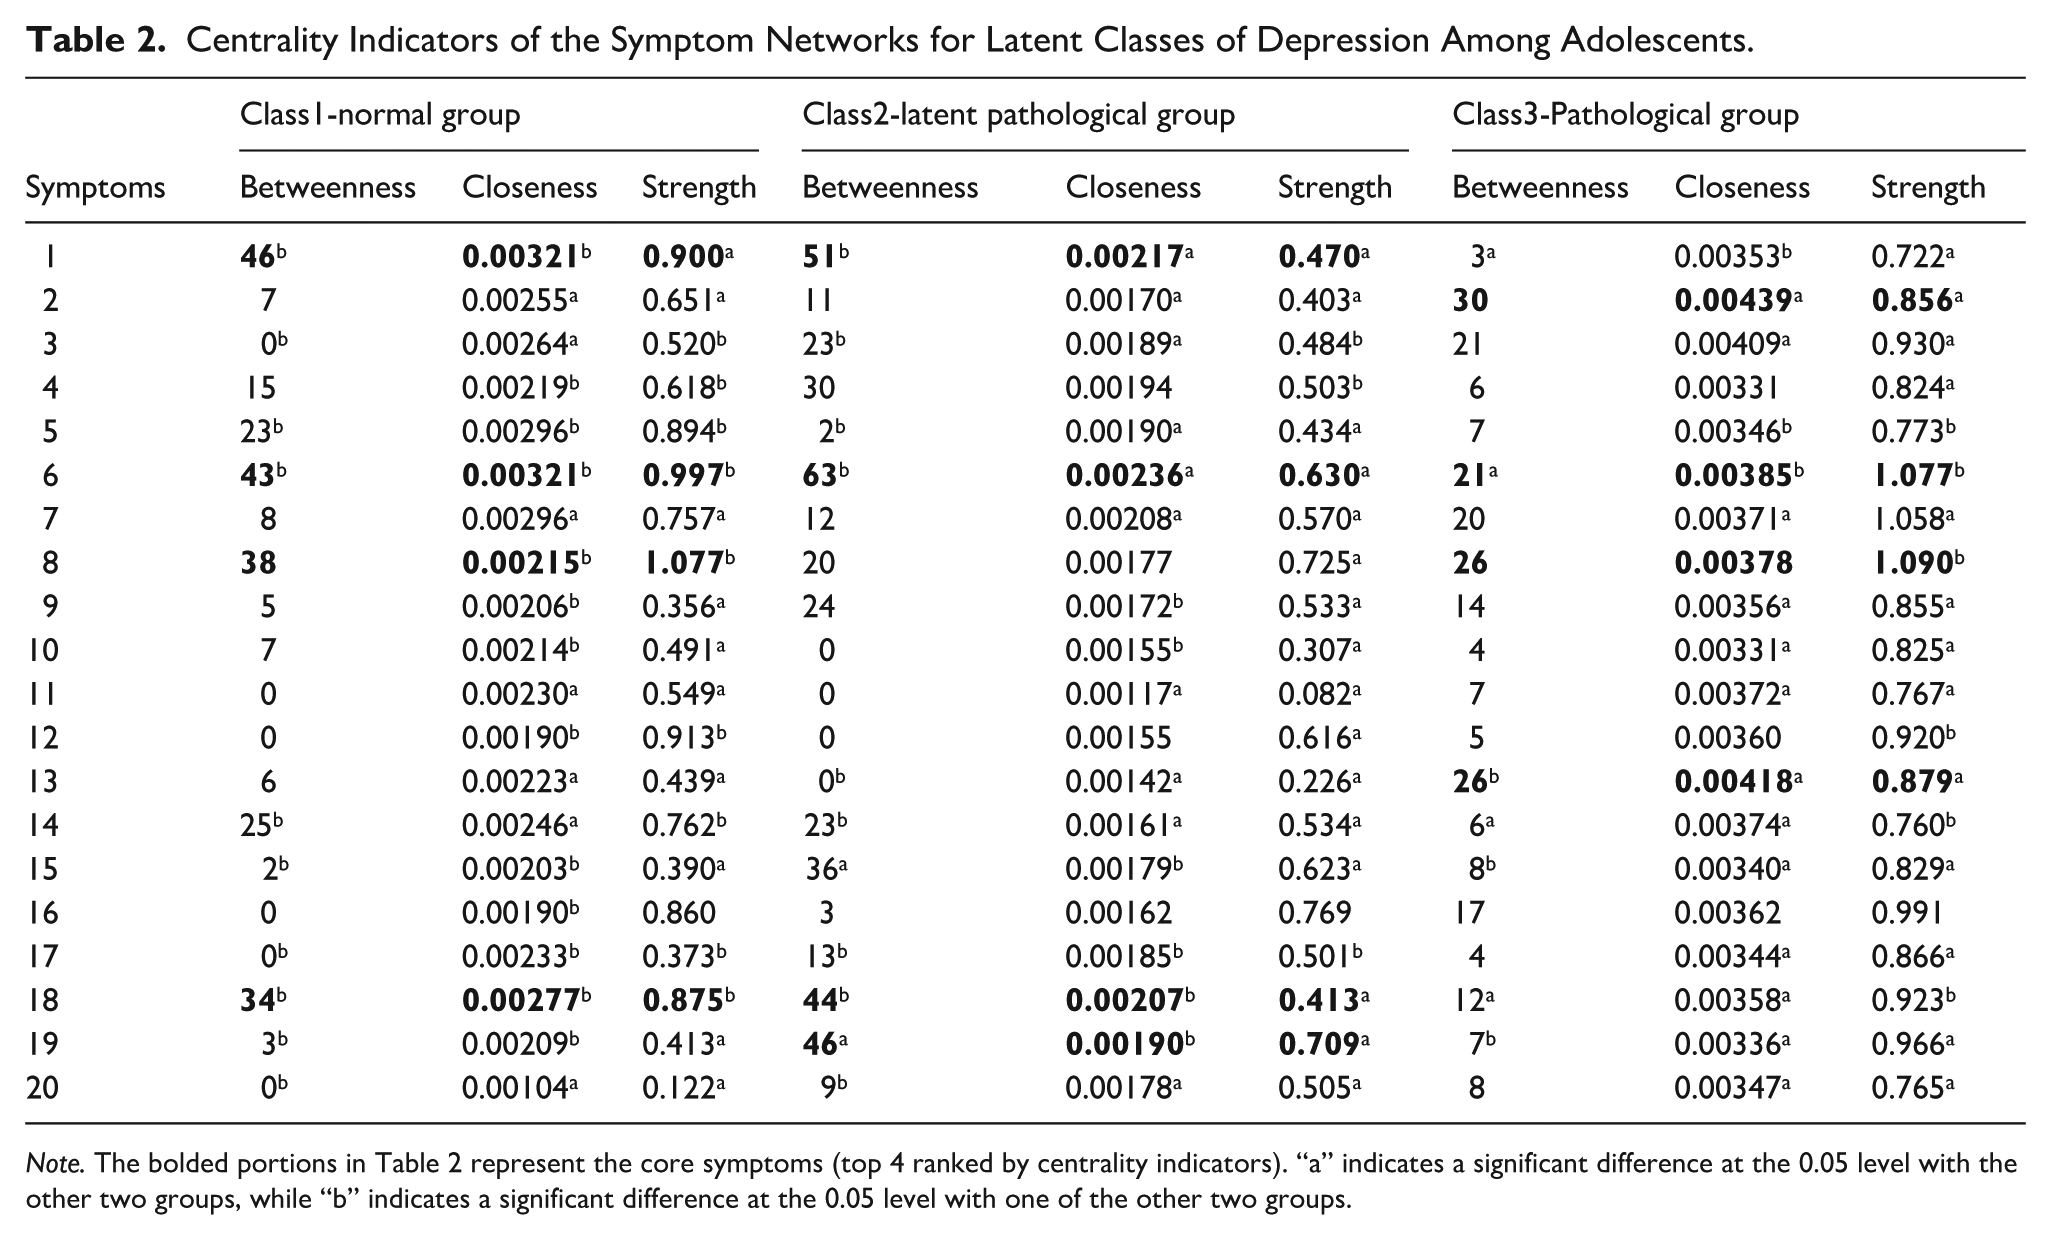
Note. The bolded portions in Table 2 represent the core symptoms (top 4 ranked by centrality indicators). “a” indicates a significant difference at the 0.05 level with the other two groups, while “b” indicates a significant difference at the 0.05 level with one of the other two groups.
Comparison of the Symptom Networks for Latent Classes of Depression Among Adolescents
The results of this study indicate that comparison of symptom networks among latent depression classes revealed significant differences. Network Invariance Tests showed significant differences between all class pairs (Class 1 vs. Class 2: M = 0.198, p = .002; Class 1 vs. Class 3: M = 0.286, p = .007; Class 2 vs. Class 3: M = 0.243, p = .004). Global Strength Invariance indicated that Class 3 had the highest network connectivity (Class 1: GS = 6.48; Class 2: GS = 5.02; Class 3: GS = 8.84; all p < .01). Centrality Invariance tests identified the core symptoms of each class, with Class 1 comprising symptoms 1, 6, 8, and 18; Class 2 comprising symptoms 1, 6, 18, and 19; and Class 3 comprising symptoms 2, 6, 8, and 13. Comparisons of betweenness, closeness, and strength across classes revealed varying centrality patterns for these core symptoms, with several significant differences between classes, indicating distinct symptom importance in each subgroup.
Discussion
Adolescent depression is a serious mental health problem, and although numerous studies have focused on this problem, the pattern of interaction between symptoms in depressive subgroups and subgroups of adolescents is still limited. Based on the individual-centric perspective and psychopathology network theory, this study explored the subgroups of depression and its core symptoms in adolescents by combining latent profile and network analysis. The study found that there are three latent classes (normal group, latent pathological group, and pathological group), the distribution of latent classes is affected by age and gender. “Low mood,” “feeling sad,” and “upset” can be used as the key target of clinical intervention. Moreover, there were significant differences between symptom networks in network invariality, global strength and centrality invariality.
Limitations
Although this study has made significant contributions to exploring the latent classes of depression and their network characteristics among Chinese adolescents, there are several limitations. First, the cross-sectional research design may limit a deeper understanding of the development and changes in depressive symptoms in adolescents, future studies could track the evolution of symptoms through longitudinal research designs. Second, this study did not control for the effects of school type, academic ranking, or other related factors on adolescent depression, which may confound the predictive role of demographic variables on depression class membership. Future research should more comprehensively examine these factors in order to more precisely identify adolescents at risk for depression. In addition, the self-report method may have reporting biases, future studies should adopt clinical diagnoses and more physiological indicators. Furthermore, convenience sampling may limit the generalizability, future studies should use probabilistic sampling to improve representativeness.
Conclusion
Previous studies have shown that depression is a major obstacle to healthy adolescents development. However, research on identifying subgroups and symptom interacts within this population remains limited. By combining latent profile analysis and network analysis, this study reveals latent classes of depression among Chinese adolescents and identifies core symptoms within each subgroup. The findings indicate that depression among adolescents population is not homogeneous but consists of different subgroups (i.e., normal group, latent pathological group, pathological group). Moreover, these subgroups exhibit significant differences in the manifestation and severity of depressive symptoms. Furthermore, network analysis uncovers the mechanisms of interaction among depressive symptoms within the adolescent population, revealing that the core symptoms vary across latent classes, such as symptom “hopeful about the future” in the normal group, symptom “feeling unloved” in the latent pathological group, and symptoms “poor appetite” and “talking less” in the pathological group. These key symptoms can serve as targets for intervention, suggesting the need for tailored interventions for the heterogeneity of depression among adolescents. Overall, these findings provide empirical evidence for the psychopathology network theory and offer clinical support for the early identification, classification, and subsequent tiered intervention of depression among adolescents. Future research should further explore the intervention effects and dynamic development of these latent subgroups.
Footnotes
Acknowledgements
We wish to thank for the assistance of schools and students who participated in this study. We also thank the many members of our research team involved in the data collection.
Ethical Considerations
This study was approved by the Human Research Ethics Committee, South China Normal University. (approval no. SCNU-PSY-2023-417) in December, 2023.
Consent to Participate
Informed consent was obtained from all participants and their parents or legal guardians.
Consent for Publication
Consent for publication was obtained from all authors.
Author Contributions
Funding
The authors received no financial support for the research, authorship, and/or publication of this article.
Declaration of Conflicting Interests
The authors declared no potential conflicts of interest with respect to the research, authorship, and/or publication of this article.
Data Availability Statement
The data that support the findings of this study are available from the corresponding author upon reasonable request.