
Abstract
We sought to identify factors associated with social interactions, critical to ameliorating social isolation, while also considering the COVID-19 timeline. Surveys (online, Texas, n = 925) asked about activities in a typical week immediately prior to and within the most recent pandemic, allowing for a dual benefit of providing findings unrelated to the pandemic that may be more relevant to current times, but also to provide insights into pandemic-related changes in social isolation. The major outcome of interest was social interaction with neighbors (SIWN). Longitudinal analyses were employed to account for repeated measures and to simultaneously consider multiple variables in adjusted analyses. Analyses identified that neighborhood walkability, marital status, age, and the interaction of time and race and ethnicity were all significantly (P < .05) related with whether or not one reported SIWN. There was also evidence of a significant effect of time, suggesting SIWN were less likely within the COVID-19 pandemic. Sociodemographic factors and neighborhood features such as walkability (measured via Walk Score), may play a role in social isolation. This study holds importance for multiple sectors, including public health, urban planning and neighborhood design, and as such can provide intelligence for continued work by multiple key partners and decision makers.
Keywords
Introduction
Social interactions can play an important role in one’s overall wellbeing.1 -3 This may be especially true in times of severe disruption and challenges, such as with the COVID-19 pandemic,1,4 but this broader public health issue remains relevant today and into the future. 5 Socially connected individuals may receive multiple positive benefits, including but not limited to, a supportive social network that can help mitigate negative situations in difficult times. 6 Some evidence has also indicated that social interactions and strong social support could help people in older ages (eg, aged 50 and older) effectively cope with pandemic-induced stress. 7 In addition, some work in the earlier stages of the pandemic, identified that those with more or higher quality contact (face-to-face or phone/video contact) had less depressive symptoms, 8 making investigations into factors that may serve as a barrier or facilitator to social interactions, also relevant to the COVID-19 timeline. Furthermore, with the release of the Surgeon General’s report, Our Epidemic of Loneliness and Isolation, 5 analyses seeking to better understand differential health patterns, namely social and structural determinants of health inequities related to social isolation, continue to be a timely public health issue both today and into the future.
Identifying factors that may facilitate or deter social interactions and/or factors that may be associated with inequities in social interactions, is timely even absent a pandemic. Thus, studies seeking to examine potential evidence of inequities in social interactions across the COVID-19 pandemic timeline, may be especially helpful for understanding similar national emergencies. Additionally, evidence suggests that investigations into potential health inequities should consider not only individual-level risk factors such as race and ethnicity, but also contextual factors such as the built environment.9,10 For example, a proxy measure of neighborhood walkability would be relevant, given that neighborhood walkability has been shown to encourage social interactions in other work. 11 While walkability itself is not assumed to capture all relevant measures of the level of support for one’s likelihood to be physically active in one’s neighborhood, higher levels of walkability have been shown to be linked to higher levels of moderate-to-vigorous physical activity (MVPA) in a national cohort of adults over age 45 years, 12 but also in Texas, the focus of the current study, where higher MVPA was found in areas with higher levels of walkability (measured via Walk Score) among adults more broadly, 13 and also among middle-aged and older adults.12,14 This is relevant, as city design, including, but not limited to walkability, is a modifiable item, and that the age-friendliness of cities (which includes having pedestrian-friendly features), has been suggested as an important consideration in facilitating social interactions and combating social isolation by the World Health Organization (WHO) in their Age-friendly Cities Framework. 15 Additionally, previous work has suggested that a 15-min buffer may be largely indicative of walking distance, yet variation in what may be considered a walkable distance may vary based on the individual’s characteristics related to, for example, impaired mobility. 16 Furthermore, a recent study found that higher levels of social isolation were related to more sedentary time and lower physical activity among middle aged and older adults. 17 Therefore, neighborhood walkability, which is relevant for a broad range of ages, may be an important component to increasing social interactions.
Aim
We aimed to identify factors associated with social interactions immediately prior to and within the COVID-19 pandemic. To accomplish these aims, we recruited a sample of adults from Texas, USA to complete an online survey comparing health-related outcomes, regular and/or daily activities, social interactions, and other sociodemographic items prior to and within the pandemic, prior to widespread vaccine availability within the US. Therefore, the aims of the current study are meant to be applicable to a pre-pandemic timeline, mirroring today’s society more so, but also times of public health emergencies similar to the pandemic.
Theoretical Framework
The World Health Organization (WHO) Framework for Action on the Social Determinants of Health 9 and the National Institute on Aging (NIA) Health Disparities Research Framework 10 guided the development of the major aims and informed the statistical analyses including model building. These frameworks emphasize the importance of considering both individual-level factors and contextual factors in analyses of potential health inequities and led to the inclusion of key variables such as race and ethnicity, sex, household composition, income, physical ability, age, and a measure of neighborhood context (walkability) that are highlighted in detail in the Methods.
Significance for Public Health
This study provides insights into both a pre-pandemic timeline that may be closer to today’s society in terms of human behavior and social interactions as well as making comparisons from this timeline to that of a major public health emergency. The significance of work examining social interactions, among other relevant outcomes such as social isolation, was reinforced with the US Surgeon General’s report, Our epidemic of loneliness and isolation. The US Surgeon General’s Advisory on the Healing Effects of Social Connection and Community 2023. 5 Thus, this study provides public health insights for several interested partners seeking to ameliorate inequities related to social interactions more generally and also those seeking to understand the initial impacts of the global public health pandemic, in a large southern state. Furthermore, the consideration of neighborhood walkability, which is both an urban planning-related item and also a major public health-related item, provides insight that can be utilized in fields beyond public health.
Methods
Design and Data
The analytical sample (n = 925) was recruited using various methods, including, but not limited to, electronic mail (email) from a nonprofit foundation, various social media outlets, and email invitation from one of the largest universities in the state of Texas to employees (faculty, staff, students) and non-employees (students, not otherwise working for the university). Respondents came from both major metropolitan areas such as Houston, Austin, San Antonio, and Dallas and smaller cities such as Galveston, Corpus Christi, College Station, Bryan, Fort Worth, Navasota, and Round Rock. Additional inclusion criteria included agreeing to participate in the survey (after reviewing written informed consent), being 18 years or older at the time of completing the survey, and also residing in Texas.
All respondents completed an online retrospective survey 18 with data collection from approximately May to August of 2020 using the online survey package Qualtrics™. The analytical sample included 925 respondents without missing responses for key variables that agreed to participate in this University-affiliated and Institutional Review Board (IRB) approved study.
Dependent Variable
The major outcome of interest was social interaction with neighbors. This was operationally defined as a dichotomous variable of having 0 days versus at least 1 day per month during which they had social interaction with neighbors. Neighbors were defined using the following prompt: “These questions are about your neighbors, defined as those living within a 10-15 minute walk from your home. Please do not count people living with you.” The use of the 10 to 15 min buffer, is consistent with what some have considered “walking distance,” albeit variations in what might be considered a walkable distance may exist. 16 Social interaction included whether or not one reported yes to any of the following questions–How many days in a month do you: Say hello to a neighbor in-person; stop and talk with a neighbor in-person; socialize with a neighbor at your home, your neighbor’s home, or someplace else (eg, restaurant, shopping, ball game); ask for help, seek advice, or borrow things from, or exchange favors with a neighbor; and contact neighbors by phone, computer, or tablet. This was treated as: no social interaction versus at least some regular social interaction with neighbors.
Key Variables
Given the major aim of identifying individual-level and neighborhood indicators associated with the dependent variable of whether or not one engaged in any social interactions with neighbors, we considered Walk Score as a measure of neighborhood walkability and multiple individual-level sociodemographic variables such as age, sex, race and ethnicity, marital status, and income. Walk Score is a widely used and destination-oriented indicator of neighborhood walkability for studies covering large areas where other localized walkability measures are not readily available. Individual-level variables were selected based on the key domains of variables shown to influence health inequities guided by our theoretical frameworks,9,10 to an extent, while realizing this timeline included a novel global pandemic not seen previously in this same way making this somewhat exploratory in nature.
Timeline
Time was included to test for change over multiple time points. The time variable in this study was treated binarily, as time 1 (a typical time immediately prior to the COVID-19 pandemic) and time 2, representing a time within the pandemic, but prior to the widespread availability of the COVID-19 vaccines (approximately May to August of 2020).
Neighborhood Exposure Items
Walk Score was used as an indicator of neighborhood activity-friendliness that focuses on walkability to destinations. Walk Score ranges from 0 to 100, with different categorical ranges provided for interpretability. Car-dependent areas range from 0 to 49, with 0 to 24 being described as “almost all errands require a car” operationally defined as very car-dependent, and 25 to 49 described as “most errands require a car” operationally defined as mostly car-dependent. Somewhat to highly walkable areas include a range of 50 to 100, where the level of “walkability” increases with increasing score (50-69 described as “some errands can be accomplished on foot,” 70-89 described as “most errands can be accomplished on foot,” 90-100 described as “daily errands do not require a car” as described via the Walk Score Methodology documentation 19 ).
For interpretability and based on the relative sample distribution (see Table 1), this variable was treated as: (1) Very Car-dependent (Walk Score 0-24); (2) Mostly Car-dependent (Walk Score 25-49); and (3) Somewhat-to-highly Walkable (Walk Score 50-100). In addition, the number of years that respondents resided in their current address was included to account for the duration of neighborhood exposure with categories of <1 year, 1 to <2 years, 2 to <5 years, 5 to <10 years, and 10 years or more.
Distribution of Sample by Key Characteristics Immediately Prior to the COVID-19 Pandemic.
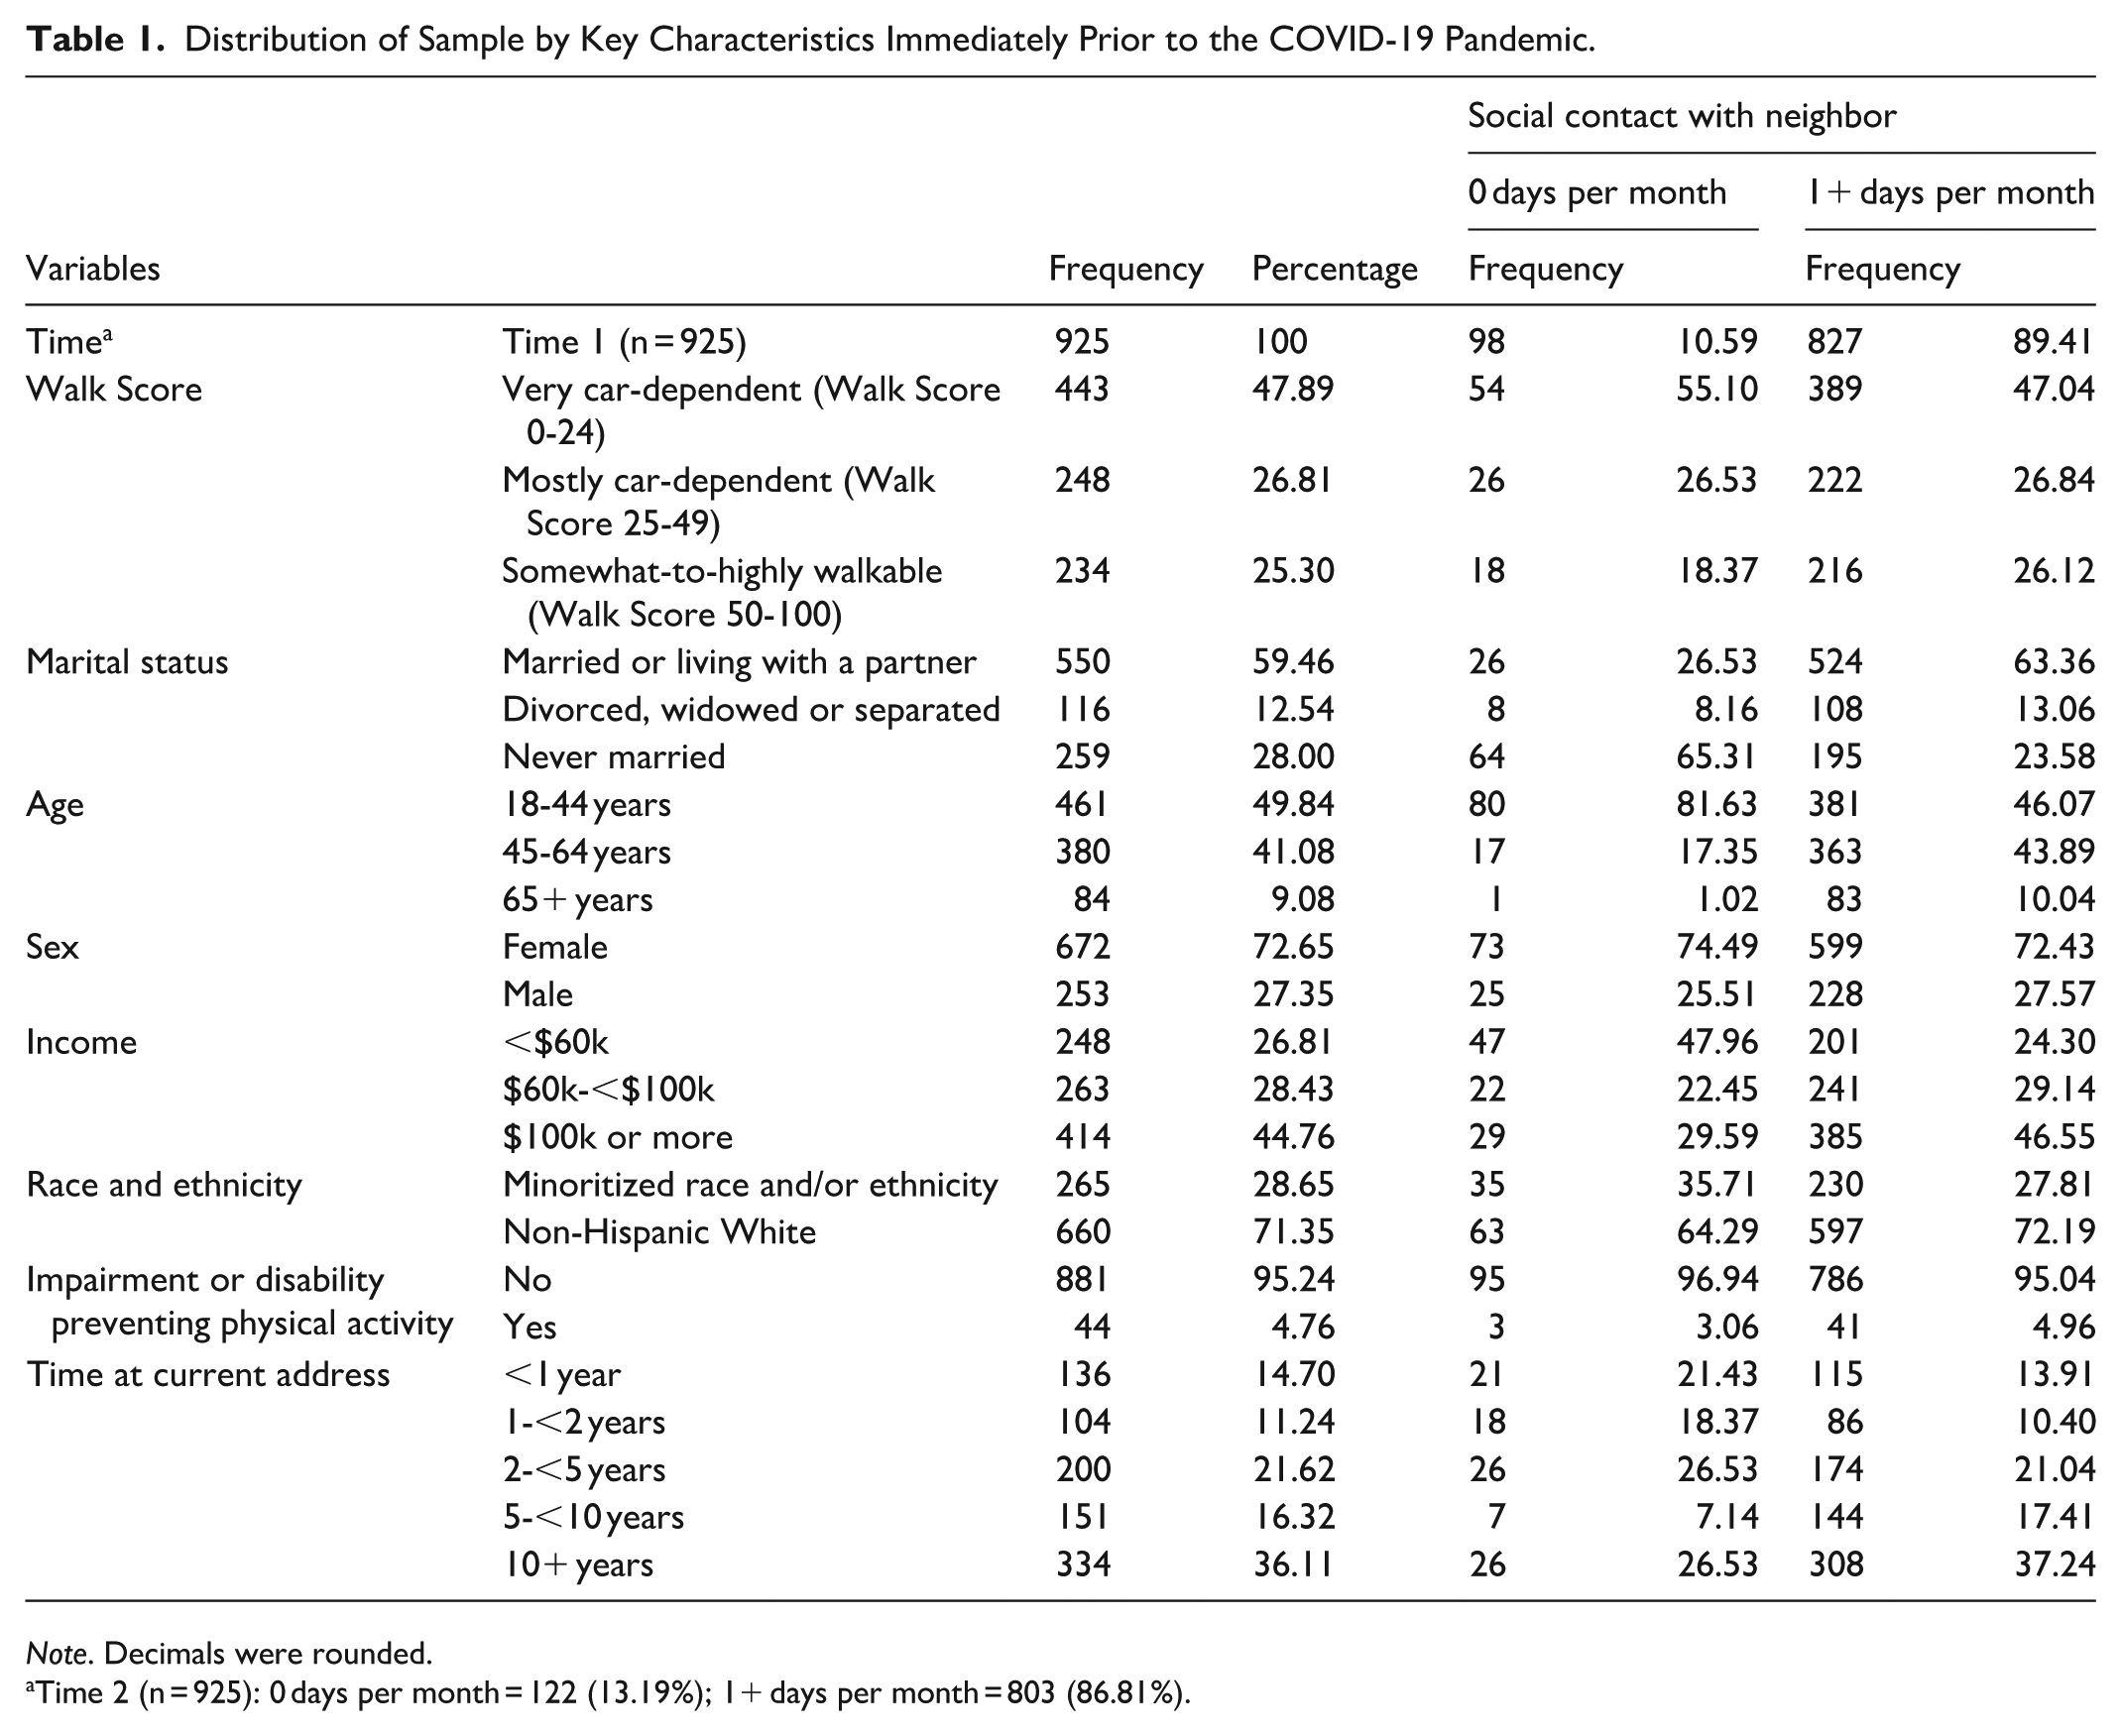
Note. Decimals were rounded.
Time 2 (n = 925): 0 days per month = 122 (13.19%); 1+ days per month = 803 (86.81%).
Individual-Level Items
Given the dependent variable of social interaction, we included several individual-level indicators including a measure of household composition (marital status), multiple other sociodemographic variables (age, sex, income, race, and ethnicity), and health status in the form of whether or not one reported a physical impairment or disability preventing physical activity (this variable was restricted to descriptive analyses, given limited distribution in each category – see Table 1).
Marital status included 3 categories including: married or living with a partner; divorced, widowed or separated; and never married. Age included: younger adulthood with 18 to 44 years; middle-age with 45 to 64 years,20,21 and older adulthood with 65 years and older. 21 Age was dichotomized in the fully adjusted models, given the limited distribution among those aged 65 and older (see Table 1). Sex included female or male. Annual household income included 3 categories based on the distribution of the sample (see Table 1): less than $60,000, which was roughly below the median income13,22; $60 000 to under $100 000; and at/above $100 000. Race and ethnicity were included to assess potential variability across this combined variable and considered as: Non-Hispanic White; and a single collapsed category (due to the limited distribution) referred to as Minoritized Race and/or Ethnicity including individuals responding indicating being Asian, Black or African American, American Indian or Alaska Native, and Native Hawaiian or other Pacific Islander.
Whether one had a physical impairment or disability preventing physical activity was also included, given social interaction within one’s neighborhood and/or contact with neighbors may include physical movement in and around one’s home. This variable was restricted to descriptive analyses given the limited distribution of this variable in our sample (see Table 1).
Statistical Analyses
SAS v9.4 (Cary, NC) and STATA v18.0 (College Station, TX) were used for all statistical analyses. For longitudinal 18 models with a binary dependent variable, with repeated measurements at time 1 and time 2; analyses accounted for the correlation of individuals nested within time using the genmod procedure 23 in SAS 9.4 and the xtlogit procedure in STATA. Odds ratios (OR) and 95% confidence intervals (CI) are presented for adjusted analyses that accounts for several variables simultaneously including: binary time (pre/within the COVID-19 pandemic); Walk Score category; marital status; age category; sex; income category; race and ethnicity; and time at current address; and the interaction of time and race and ethnicity. Furthermore, the predicted probabilities from the interaction are presented using STATA’s margins coding. Additional detail is available in the STROBE checklist 24 for the current study.
Results
Frequency Distribution
Overall, analyses included 925 individuals, without missing data for key variables (see Table 1). The largest percentage of the sample resided in areas that were very car-dependent (48%) with a Walk Score of 0 to 24, followed by mostly car-dependent areas (27%) with a Walk Score of 25 to 49, and somewhat-to-highly walkable (25%) with a Walk Score of 50 to 100.
In terms of sociodemographics, most of the sample was married (~60%), aged 18 to 44 years (50%), female (73%), with the highest percentage reporting incomes of $100 000 or more (45%), and with most reporting as being Non-Hispanic White (71%). The majority of the sample reported no physical impairment or disability preventing physical activity (95%).
In addition, the largest percentage of the sample reported residing in their current home for 10 years or more (36%), in comparison to the lowest percentage at 1 to less than 2 years (11%) and less than 1 year (15%).
Overall, the percentage reporting no social interactions with neighbors was less than 14% for both time points, at less than 11% in a typical time prior to the pandemic as compared to over 13% for the corresponding measure within the COVID-19 pandemic, respectively (see Table 1).
Adjusted Analyses
Overall, when testing for the main effect of time in a nearly identical model as presented in Table 2, except for removing the interaction term, there was an effect (P = .0025) of time for the likelihood of reporting social interactions with neighbors (OR = 0.756, 95% CI = 0.631-0.906 comparing time 2 to time 1). This indicated that having social interactions with a neighbor(s) become less likely within the pandemic, after considering all other terms in the model (not including the interaction term). All other adjusted analyses are presented in Tables 2 and 3, with models that include the interaction of time and race and ethnicity.
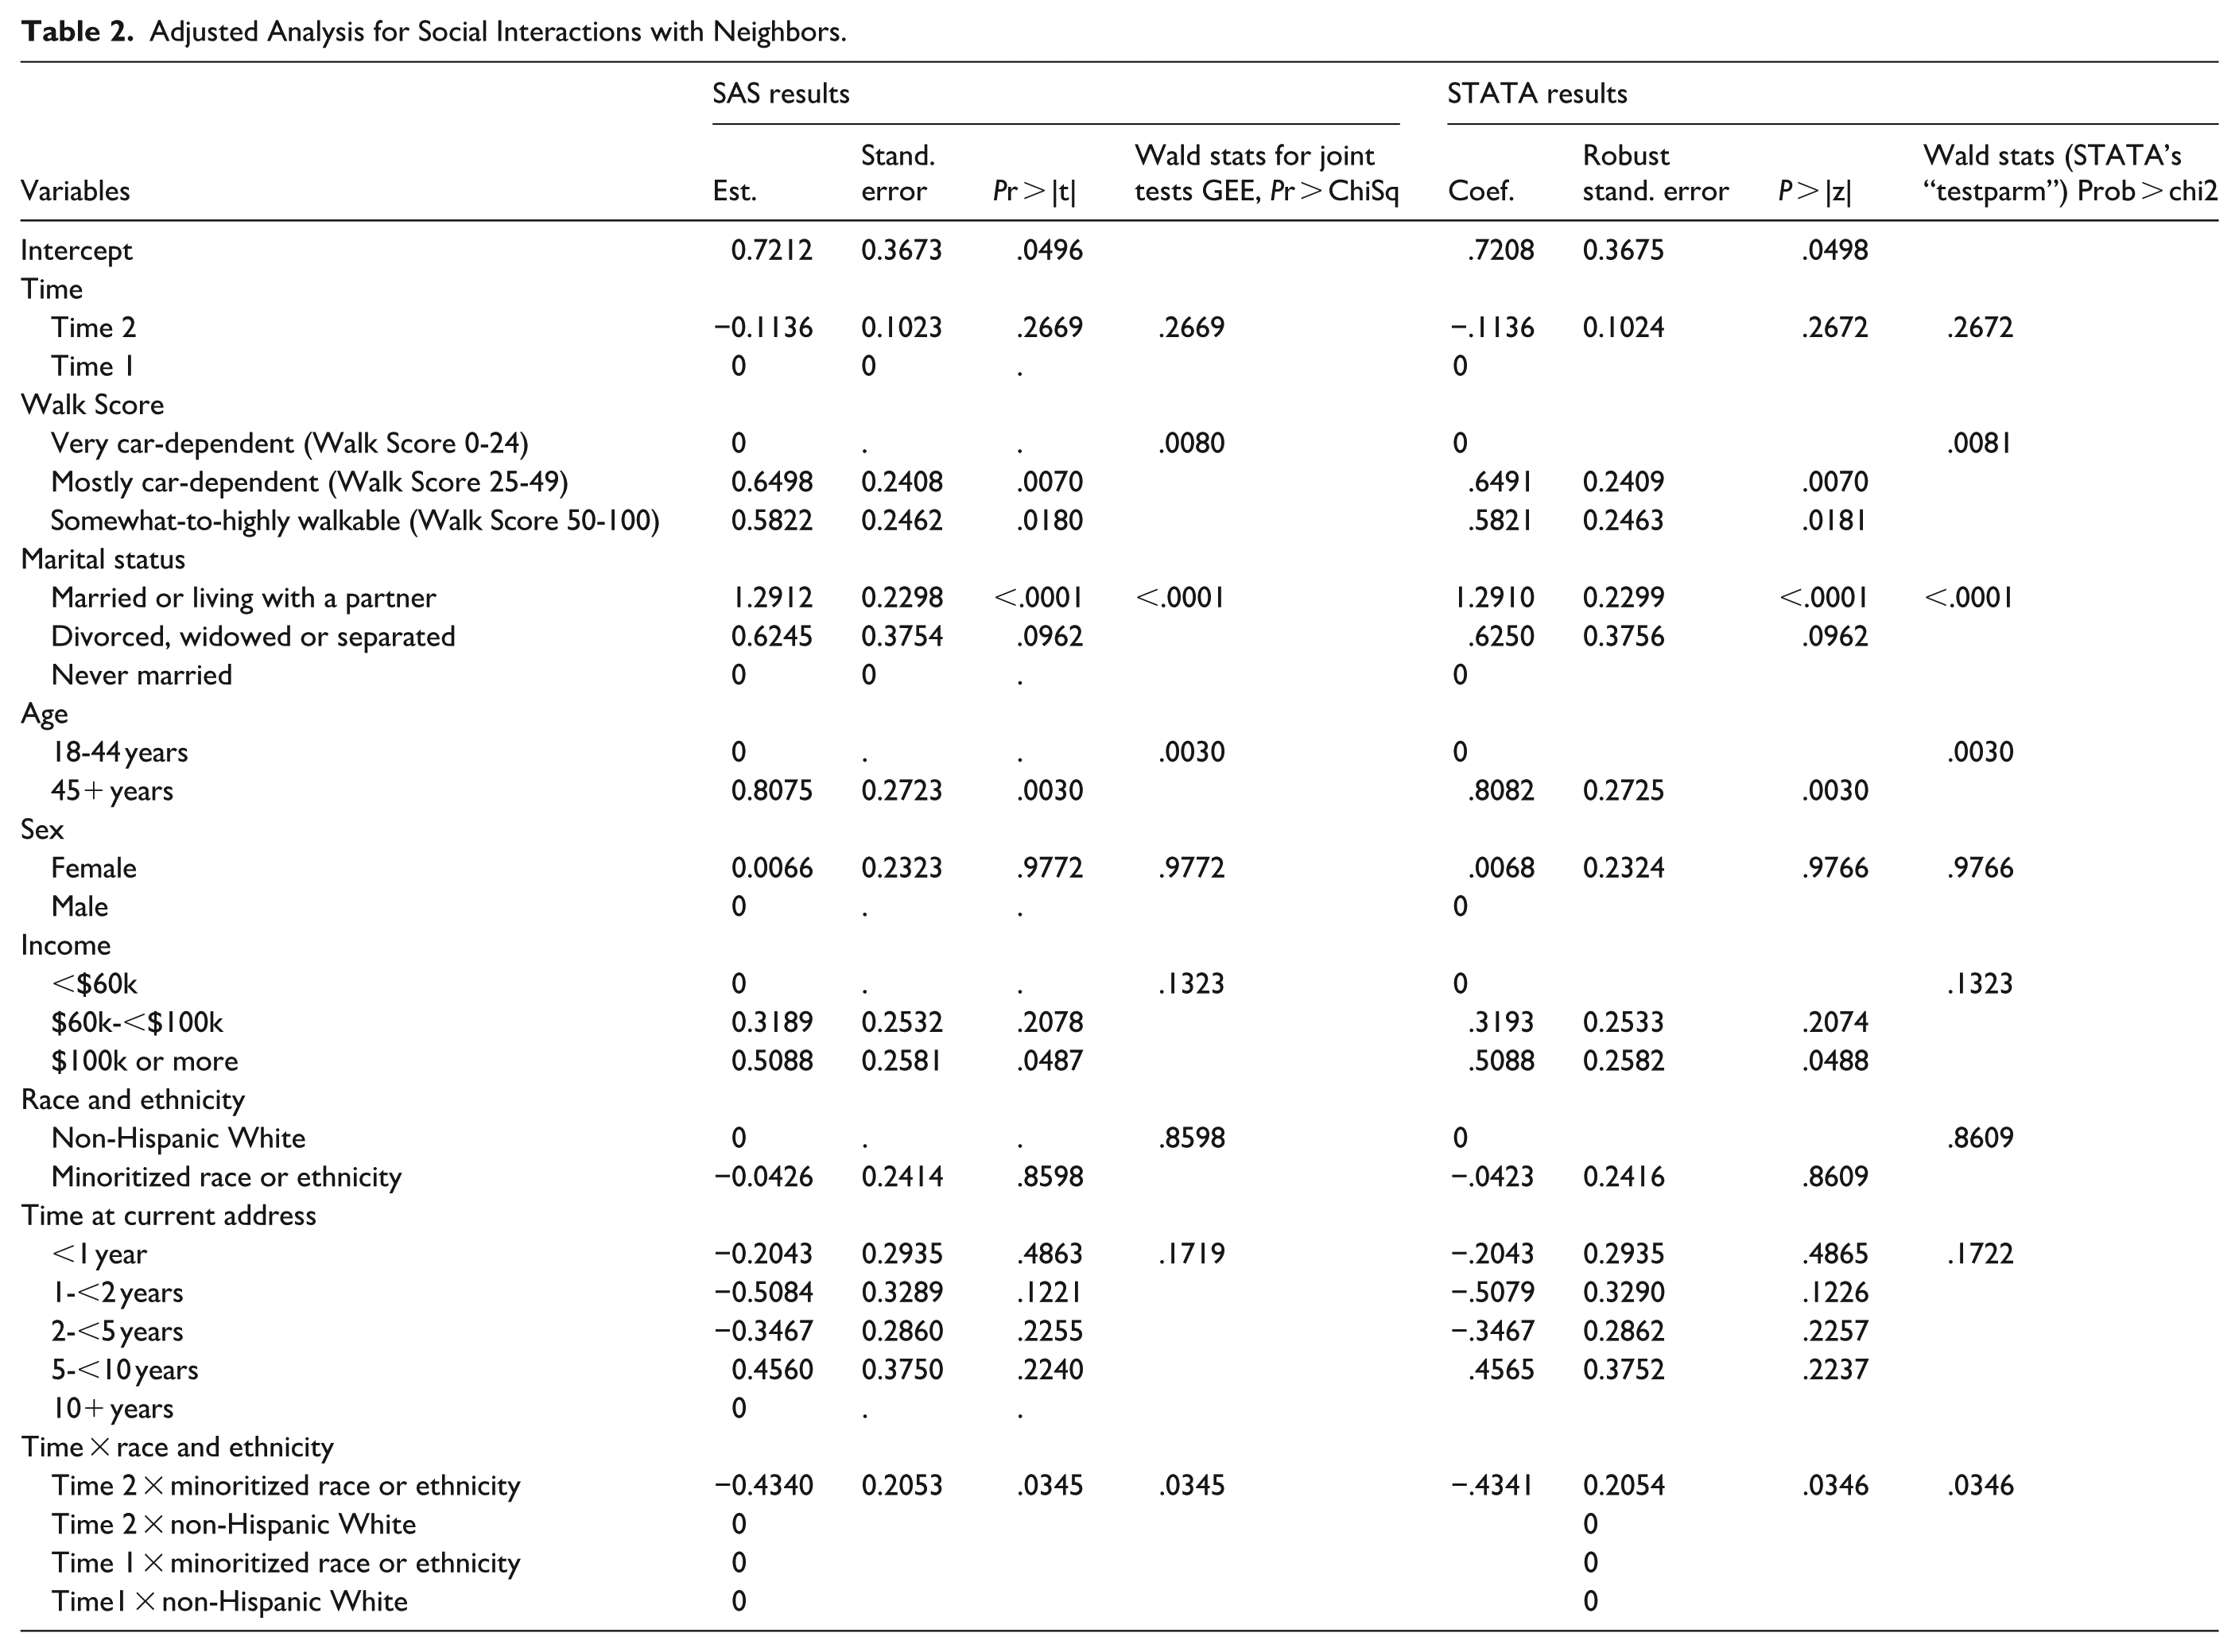
Adjusted Analysis for Social Interactions with Neighbors.
Adjusted Analyses for Social Interactions with Neighbors – Odds Ratios – for Main Effects with Wald STATS P < .05.
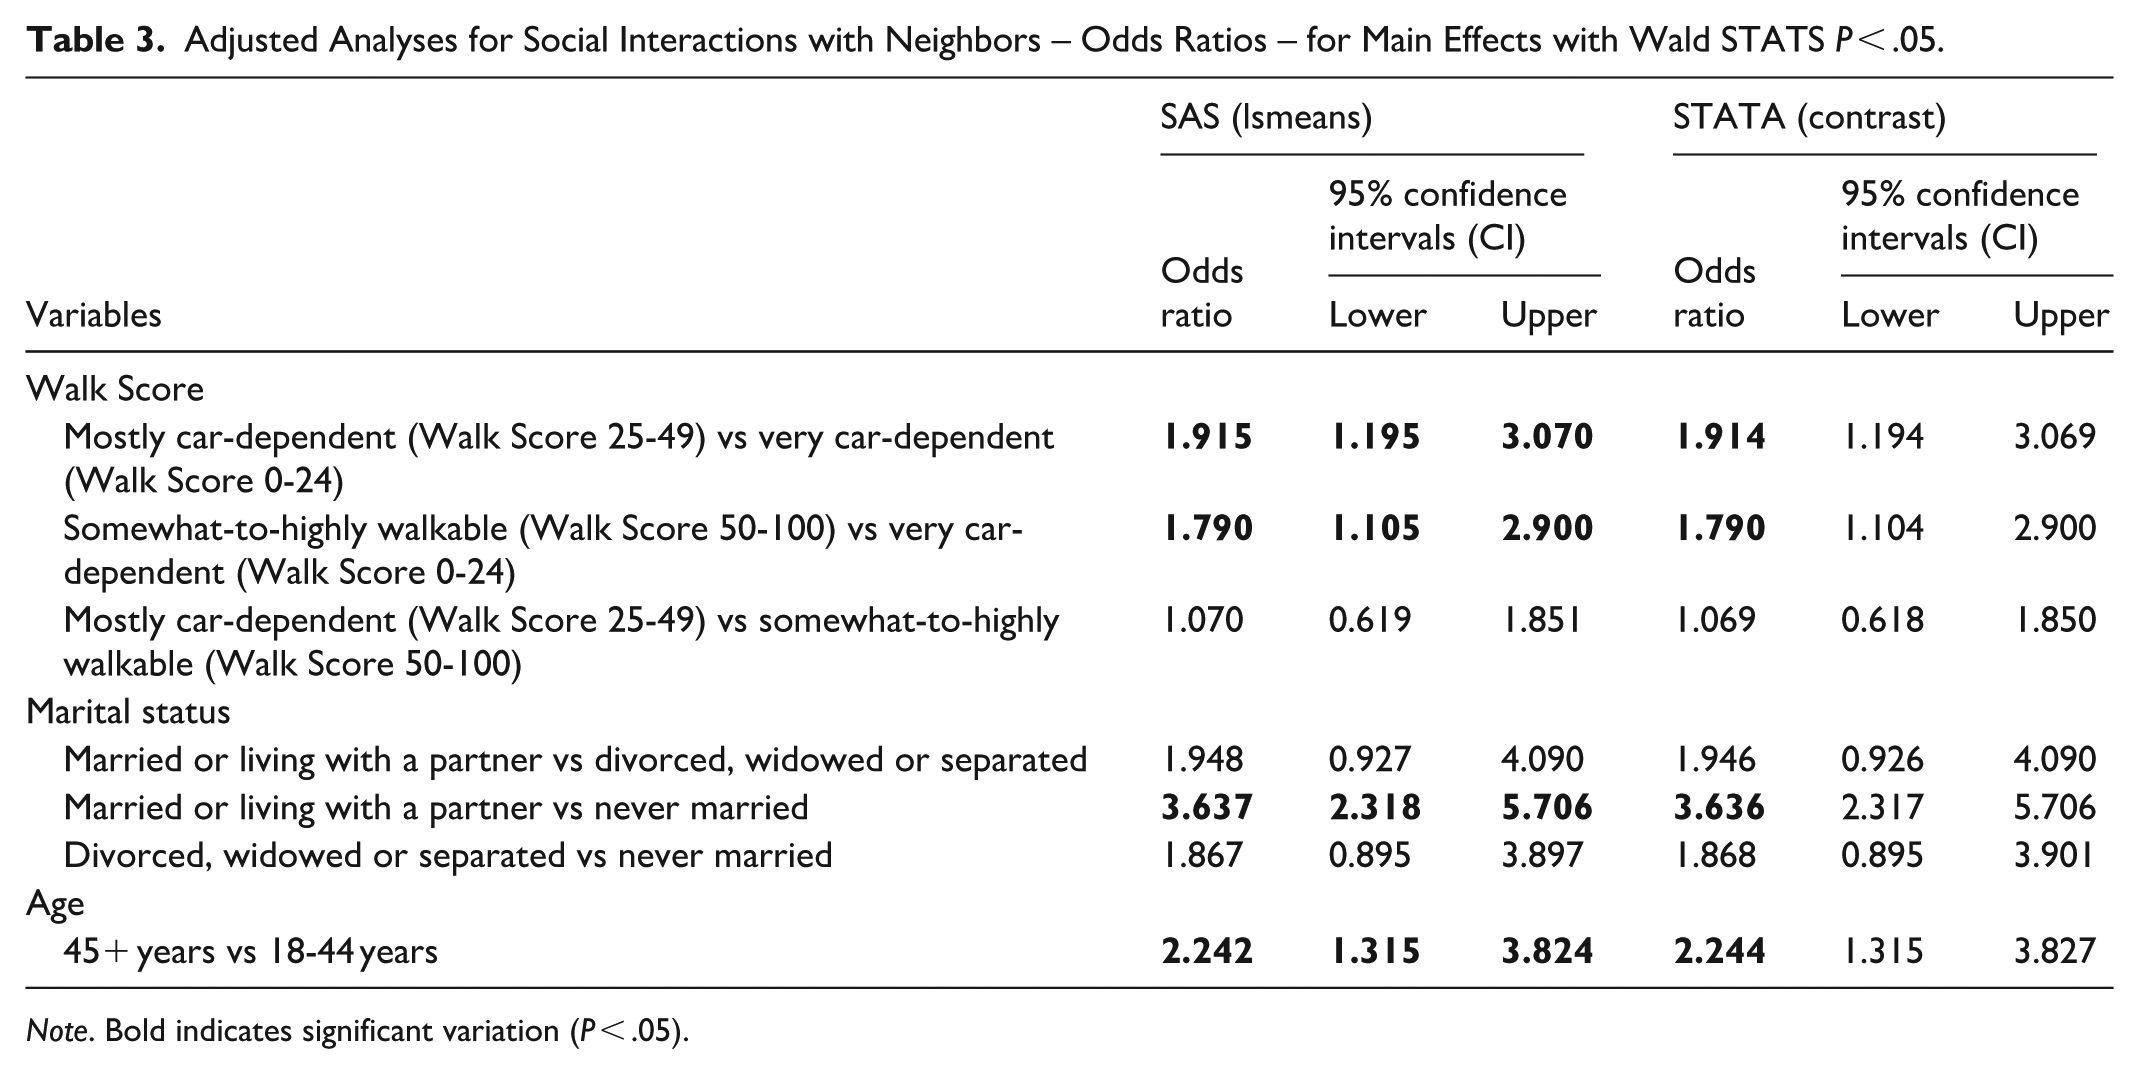
Note. Bold indicates significant variation (P < .05).
In the fully adjusted model with the interaction term (using SAS); there were multiple significant differences identified, including by walkability (P = .0080), marital status (P < .0001), and age (P = .0030). More specifically, the likelihood of reporting social interactions with neighbors was higher among those living in more walkable areas; with comparisons including Mostly Car-dependent (Walk Score 25-49) versus Very Car-dependent (Walk Score 0-24) with OR = 1.915, 95% CI = 1.195 to 3.070; and Somewhat-to-highly Walkable (Walk Score 50-100) versus Very Car-dependent (Walk Score 0-24) with OR = 1.790, 95% CI = 1.105 to 2.900. Additionally, the likelihood of reporting contact with neighbors (social interactions) was higher among those reporting being married or living with a partner versus never married (OR = 3.637, 95% CI = 2.318-5.706); and amongst those aged 45 years and older versus 18 to 44 years (OR = 2.242, 95% CI = 1.315-3.824).
Predicted Probabilities From the Interaction of Time and Race and Ethnicity
The predicted probability (using the result from STATA, with the “margins” coding) of having social interactions with neighbors ranged from ~0.85 to 0.91 (see Figure 1) within the comparisons of the interaction of time and race and ethnicity. The probability was ~.91 for both groups immediately prior to COVID-19 (time 1) with no significant differences (P = .8618) between the 2 groups. However, a significant reduction in the probability of social interactions was found for individuals identifying as a minoritized race or ethnicity into the pandemic (P = .0043), with no change among those reporting as non-Hispanic White (P = .2733). The probability of social interactions dropped to ~.85 for individuals reporting minoritized race or ethnicity within COVID-19; in contrast the probability remained relatively constant at ~.90 for individuals reporting non-Hispanic White within COVID-19. There was also evidence of significant variation when comparing individuals reporting minoritized race or ethnicity at time 2 versus those reporting non-Hispanic White at time 1 (P = .0204). Within COVID-19, the comparison of probabilities of ~0.85 for individuals reporting minoritized race or ethnicity and ~0.90 for individuals reporting non-Hispanic White had a P-value of .0523. All other comparisons of probabilities within the interaction indicated a P-value ranging from .2733 to .8618. Figure 1 presents these probabilities visually, where in terms of change over time, there was a decrease over time for individuals identifying as a minoritized race or ethnicity, in contrast to no change over time for those identifying as non-Hispanic White.
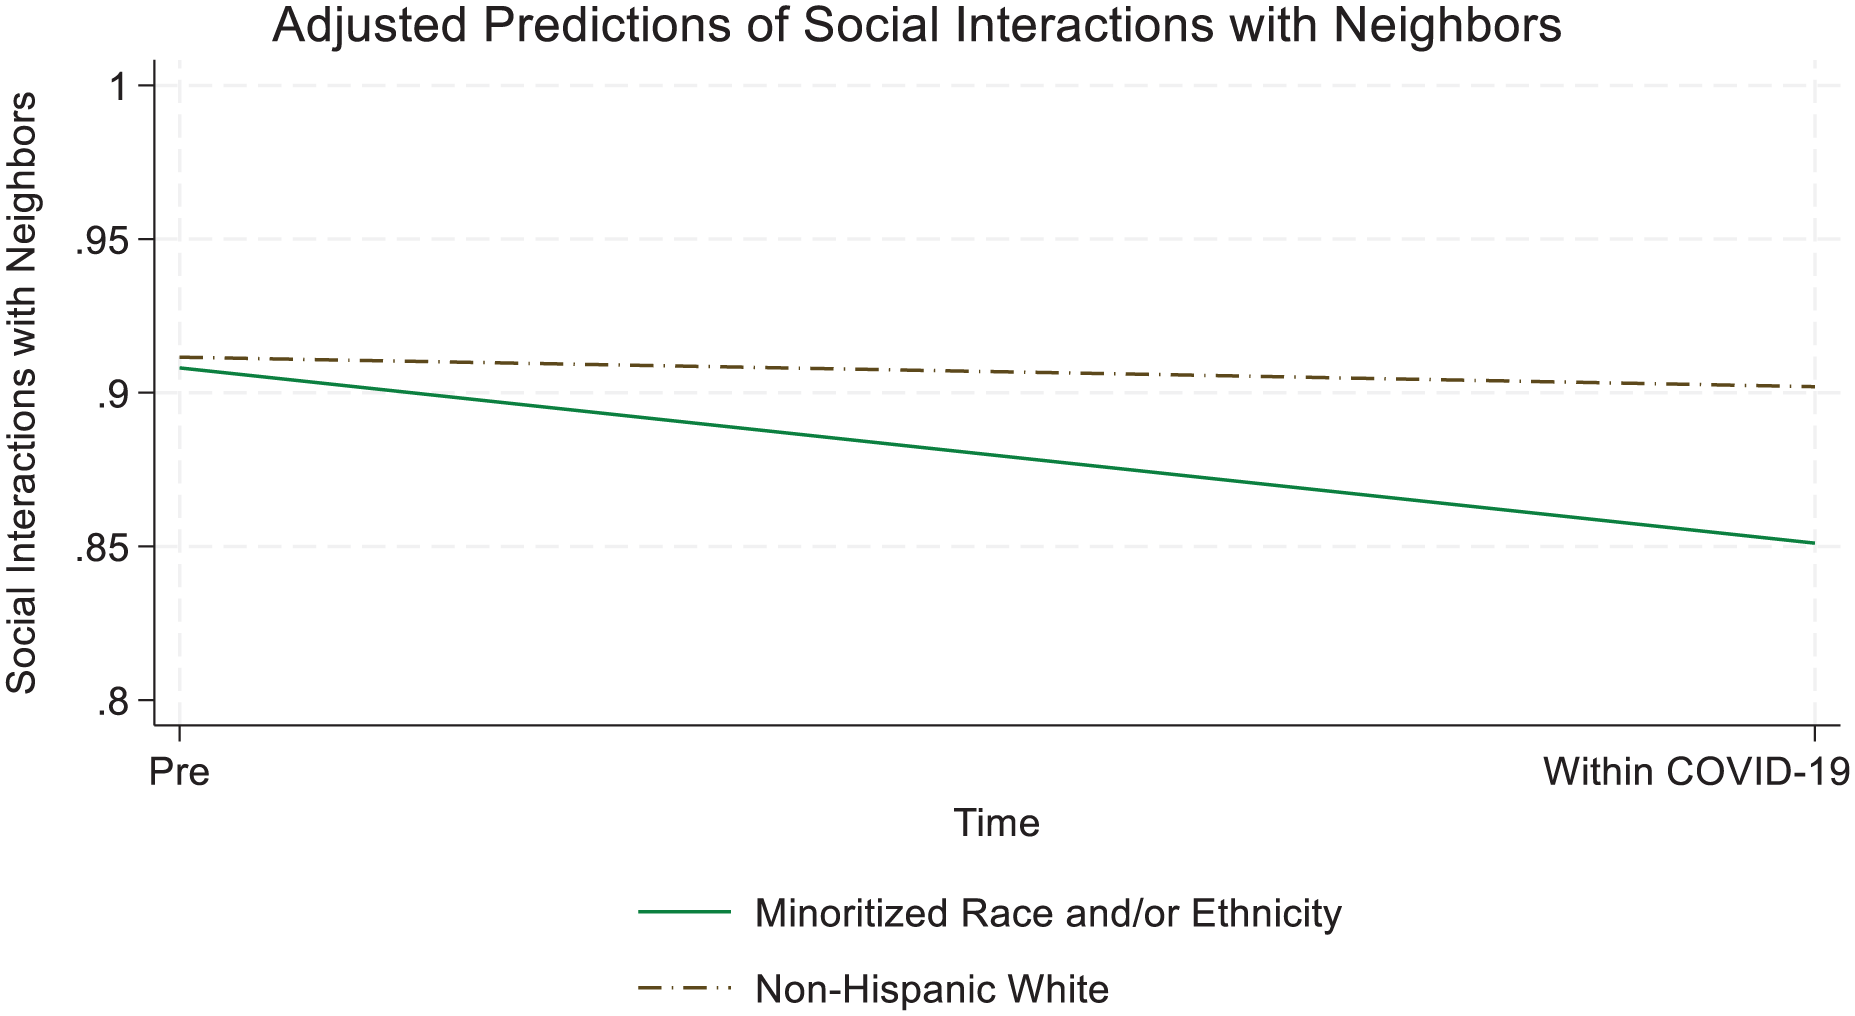
Interaction plot of race and ethnicity and time.
Discussion
We found significant variation in the likelihood of social interactions with neighbors by individual-level factors (ie, age, race and ethnicity, marital status), neighborhood factors (ie, neighborhood walkability), and time. Further, consistent with other work that forecasted negative impacts of the COVID-19 pandemic on social isolation, especially for older adults, 25 we did see significant decreases in social interactions within the pandemic in this study. Other work has explored this topic qualitatively, finding that in some cases there was limited change from prior to the pandemic in terms of the frequency of communication with friends, 26 and that digital interaction may have been essential for maintenance of social networks, 26 which is not identical to the current study, but does offer some additional context.
Additionally, we identified several key factors as having significant variation when modeling the likelihood of having any social interactions with neighbors or not. First, there was significant variation across a measure of neighborhood walkability, indicating that individuals residing in areas that were more walkable were also more likely to report social interactions with neighbors. Our inclusion of Walk Score, an accessibility metric of sorts, based on the number and proximity of amenities within walking distance from a given location,27,28 provides an opportunity to focus on clearly modifiable (assuming resources available to make modifications, etc.) aspects that can impact population health. According to the posted methodology, available at www.walkscore.com/methodology, for a given location (eg, address) points are assigned across categories of amenities (eg, grocery stores, restaurants, retail, schools, parks, entertainment). In terms of point values, maximum points are assigned to those locations that are closer (to the address of interest), within a quarter mile distance (roughly equivalent to a 5 min walk), versus less points for those amenities located further away, with no points awarded for those locations that may require a walk longer than ~30 min. In other words, proximity is key, hence our focus on the 10 to 15 min buffer, incorporated into the survey item used in the current study, along with our use of Walk Score. The algorithm also considers population density, road metrics, intersections, etc. While not without limitation, neighborhood walkability provides a significant metric(s) for public health research, including studies focused on COVID-19,29 -35 that can also consider critical aspects of social interaction, 33 also identified in the current study. Consistent with other research, 11 a major study finding is that communities with more walkable destinations are also likely to benefit residents in terms of increasing the opportunity of social interactions. Social interactions are key to successfully aging-in-place for adults 36 and as such can inform a wide range of community leaders and other interested parties, including but not limited to urban planners, landscape architects, public health experts, and residents themselves.
The finding that an indicator of household composition also saw significant variation across the likelihood of social interaction was not surprising, but nonetheless useful in planning interventions in that those unmarried, may be more at-risk of social isolation. This is a finding that is consistent with past research indicating that married adults may have some health benefits over those unmarried, though this may not be consistent across all measures. 37 Additionally, pandemic-related work among those aged 50 and older suggested that those living with a spouse or partner experienced stabilized isolation stress (less drastic shifts in isolation stress over time) and that older adults with stronger family relationships experienced lower isolation stress. 7 Thus, we recommend taking into account household composition in similar studies, given its role in the current analyses and in light of past evidence on the topic.
The finding that middle-aged and older adults were more likely to communicate with their neighbors was also of interest when considering social isolation’s role in aging-in-place. This is important in light of past work, as the neighborhood can serve as a mechanism for neighborhood networks for successfully aging in place. 38 Additionally, the role of intergenerational interactions for older adults has been shown to have many positive benefits, 36 which further highlights the relevance of this finding in light of past work. Future research would benefit from a better documentation of whether contacts were of the same generation or tended to be intergenerational.
Finally, the identification of a differential effect of significant variation over time among individuals identifying as being of a minoritized race or ethnicity, but not for those identifying as non-Hispanic White, presents evidence of health inequities that demand continued surveillance efforts into the future. Considering our theoretical frameworks,9,10 this finding is consistent with evidence of differential health patterns, where a combination of complex factors may work in tandem to lead to health inequities and that these already existing inequities can further be intensified and/or negatively impact other outcomes (social interactions), as the pandemic and related public health safety measures intensified. Further, we recommend that future work on this topic that seeks to assess inequities considers both structural and social determinants9,10 aligned with a theoretically informed approach.
In summary, this is yet another example of the role of public policy and other community design principles in health-related outcomes, supporting the concept of health in all policies. 39 For example, given the recent recognition of the importance of nature for health outcomes, 40 encouraging outdoor social interactions with neighbors can be seen as having multiple benefits. Furthermore, implementing community design principles that support opportunities for physical activity for all ages and also intergenerational interaction between middle-aged and older adults and younger individuals may carry a dual benefit, given the critical need for social interactions among all ages and the benefits of intergenerational interaction. 36
Limitations
While the design of this study did examine self-reported change over time, the results may not represent causal inference, given, among other things, we were unable to assess longer term prior trends 41 over time leading up to the study timeline. However, as seen in Figure 1, there was some evidence of similarity in the outcome of interest at baseline (eg, no differences in social interactions between race and ethnicity comparisons prior to the pandemic), in addition to limited if any anticipation of the pandemic, and that within group definitions were stable over time (either defined based on individual-level characteristics such as self-reported race and ethnicity or for place-based factors such as residence in more vs less walkable areas, etc.). The recruitment of the sample, while strategic to include Texas residents throughout the state in diverse geographic areas, was without random sampling. As a result, the findings may not be generalizable to all areas of the state or other states and areas outside the US, more generally. This is critical in terms of interpreting the implications of the current work. Furthermore, recall bias is another significant limitation, albeit, we expect the directionality of the results of this finding (higher, lower, or no change relative comparisons over time) to be relatively accurate. Furthermore, while time at current address was not a significant predictor of variation in social interactions, conceptually this variable is an important one. However, given the COVID-19 timeline measured in the current study was relatively short, this is potentially reflective of the fact that there was little, if any, change in locations among the vast majority of respondents with more than 85% reporting being in their current home a year or more. While the measure of social interactions did account for multiple types of social interactions (inclusive of in-person and digital interactions), this may not be fully inclusive of every type of social interaction (eg, written letters or post cards sent using the US Postal Service). In addition, a major strength was that the variable of walkability included was objectively measured and as such is likely to be measured similarly for all, rather than, for example, use of a subjective measure for which the meaning may change based on a given individual’s interpretation. However, as discussed, this measure does not capture all relevant items related to walkability and is limited in this way. In addition, while we did find evidence of change over time in this sample, it is possible that with a larger sample, across multiple states, and using different time points, we may have found different outcomes. Thus, we recommend continued surveillance of these and other similar outcomes in future work and suggest that these findings be used in combination with other studies, to suggest areas of future work.
Conclusions
Neighborhood design mattered in whether or not one reported any social interaction with their neighbors. The role of marital status, age, and time interacted with race and ethnicity also highlight key sociodemographic variables that may allow for targeted outreach efforts, including clinical interventions (providers inquiring about social isolation, etc.) and broader public health campaigns. For example, with variation in social interactions by age group where younger individuals experienced a lower likelihood of social interactions, targeting evidence-based strategies to increase social interactions among all ages, including younger individuals is encouraged. Additionally, tailoring these evidence-based strategies to individuals identifying as a minoritized race or ethnicity may carry significant benefit. Continued public health surveillance, building upon this and other related work, of potential health inequities and relevant solutions are needed, especially when considering the potentially modifiable nature of the built environment and its relative sustainability as an intervention in and of itself.
Supplemental Material
sj-docx-1-inq-10.1177_00469580261443122 – Supplemental material for Longitudinal Analyses of Social Interactions by Neighborhood Walkability, Marital Status, Age, and Differential Effects of a Global Public Health Emergency by Race and Ethnicity
Supplemental material, sj-docx-1-inq-10.1177_00469580261443122 for Longitudinal Analyses of Social Interactions by Neighborhood Walkability, Marital Status, Age, and Differential Effects of a Global Public Health Emergency by Race and Ethnicity by Samuel D. C. Towne, Xuemei Zhu, Marcia G. Ory, Minjie Xu, Zhipeng Lu, Sungmin Lee and Chanam Lee in INQUIRY: The Journal of Health Care Organization, Provision, and Financing
Footnotes
Ethical Considerations
Ethical approval provided from Texas A&M University Institutional Review Board (IRB). IRB Number: IRB2015-0541D. IRB Approval Date: 09/08/2015.
Consent to Participate
Informed consent was provided to participants as approved by the Texas A&M University IRB.
Author Contributions
All authors contributed substantially to the manuscript. SDTJ led the conception, design, analysis, and interpretation of the data, and drafted the manuscript. MX and SL assisted with data cleaning, interpretation of the data, and critically reviewed the manuscript. ZL, XZ, MGO, and CL critically reviewed the manuscript which included interpretation of the data.
Funding
The authors disclosed receipt of the following financial support for the research, authorship, and/or publication of this article: Support for the current study, in part, was provided using funds from NIH (NIH Award Number: R01CA197761). No sponsor had any role in study design; in the collection, analysis, and interpretation of data; in the writing of the articles; or in the decision to submit it for publication.
Declaration of Conflicting Interests
The authors declared no potential conflicts of interest with respect to the research, authorship, and/or publication of this article.
Data Availability Statement
The data that support the findings of this study are protected in accordance with the Texas A&M University Institutional Review Board for the current study and so are not publicly available.
Supplemental Material
Supplemental material for this article is available online.
References
Supplementary Material
Please find the following supplemental material available below.
For Open Access articles published under a Creative Commons License, all supplemental material carries the same license as the article it is associated with.
For non-Open Access articles published, all supplemental material carries a non-exclusive license, and permission requests for re-use of supplemental material or any part of supplemental material shall be sent directly to the copyright owner as specified in the copyright notice associated with the article.