
Abstract
Background
Medicaid administrative spending funds core program operations such as fraud and waste detection and prevention, technological infrastructure, and eligibility determination. Though typically lower than private insurance administrative costs, such spending varies across states and may respond to policy and economic shocks.
Purpose
This study examined trends in Medicaid administrative expenditures before and during the federal maintenance of effort (MOE) policy enacted during the COVID-19 Public Health Emergency (PHE).
Methods
Using state-level panel data from 2018–2022 for all 50 states and the District of Columbia, we regressed Medicaid administrative spending outcomes (percent changes in dollar amount, per-enrollee, and per capita spending) on a binary indicator for MOE period and controlled for unemployment rates, enrollment changes, and managed care characteristics using linear regression models with state fixed effects. We also estimated models stratified by administrative burden tertiles.
Results
Percent change in Medicaid administrative spending (amount in United States dollars) remained stable during the MOE period relative to pre-MOE years. Per-enrollee administrative spending declined by 9.1 percentage points.
Conclusions
Despite record enrollment under MOE policies, Medicaid administrative spending did not significantly increase. The findings suggest that states maintained administrative cost stability, potentially achieving economies of scale, and that administrative burden levels and other time varying state characteristics did not meaningfully influence these trends.
Keywords
Introduction
Since its creation in 1965, Medicaid has grown to be the largest health insurance program in the United States—covering approximately one in five individuals and accounting for 18% of national health expenditures.1-3 State and federal governments jointly finance Medicaid through a mechanism by which the federal government transfers matching funds to states to cover a proportion expenses incurred from coverage of healthcare services and from administering the program. The federal share of matching funds for coverage of healthcare services ranges from 50% to 83% and is determined by a Federal Medical Assistance Percentage (FMAP) formula that is inversely proportional to the state’s per capita income.4,5 In contrast, the federal share of matching funds to support states in administering Medicaid is not determined by FMAP and is set at 50% for all states. However, some administrative activities such as fraud control, certifying nursing homes, updating claims and eligibility information systems, and incentive payments to providers for adoption of electronic health records receive higher matching rates. 6 Regardless of the federal contribution amount, Medicaid spending is often the largest category of state spending.7,8
As healthcare expenditures continue to rise, Medicaid programs are not immune from budget strains and scrutiny over how public dollars are spent.9,10 Fluctuating economic conditions and exogenous events such as the COVID-19 pandemic can reduce revenues while exposing states and federal governments to acute spending increases.11,12 Informing budget decisions requires knowledge of mechanisms that drive Medicaid spending. A plurality of scholarship in Medicaid spending has focused on identifying high-need and high-resource utilizing enrollees and piloting case management interventions to shift utilization from high cost or acute care services to lower cost outpatient settings.13-17 Other scholars have also linked economic factors, such as unemployment and recessions to greater number of Medicaid enrollees and therefore increased spending.18-20 However, less attention has been paid to drivers and correlates of Medicaid administrative expenditures, which constitute approximately five percent of total Medicaid expenditures. 21
The joint federal-state structure of Medicaid leaves states flexibility to experiment with how to administer Medicaid, yet there is limited understanding of the consequences of program design on administrative spending. Choices surrounding program design may be driven by states’ varying tolerance for how much administrative burden to expose Medicaid enrollees to. Administrative burden, defined in the literature as “an individual’s experience with policy implementation” and the demands “placed on citizens to access resources,” 22 subjects individuals to compliance costs (time and effort to follow rules), learning costs (awareness of available services and their participation requirements), and psychological costs (positive and negative experiences interacting with public services).23,24 One way states minimize administrative burdens in Medicaid is by streamlining enrollment through express lane eligibility, which is the use of one’s eligibility status from other programs (e.g., Supplemental Nutrition Assistance Program or Temporary Assistance for Needy Families) to facilitate Medicaid enrollment. States with express lane eligibility experienced an increased administrative expenditures, yet had lower overall administrative expenditures than states without express lane eligibility. 25 Another approach to minimizing administrative burden is the implementation of ex parte renewals, which shift substantial documentation burden from enrollees back to states by requiring states to use available data to initiate or complete renewals prior to contacting enrollees for information—resulting in automated Medicaid renewal for many individuals and households and less documentation for enrollees. 26
Although states may have existing processes in place to reduce administrative burden, they may also prioritize personal responsibility and containment of fraud, waste, and abuse which often result in policies that shift administrative burden towards eligible individuals and existing enrollees. For example, states might make Medicaid eligibility contingent on participation in job training, volunteering, and/or working, or other personal responsibility requirements. 27 In some cases, states might impose administrative burdens by limiting modalities by which eligible people can enroll or renew coverage (e.g., not offering ex parte renewals or requiring in-person interviews but not offering telephone or online options).28,29 These variations, which collectively increase the cost of transacting with Medicaid programs, have consequences for participation in Medicaid but may also affect Medicaid administrative spending. Administrative burdens may incur cost savings by restricting enrollment or they might incur administrative expenses due to the cost to monitor compliance with certain rules. Estimates for implementing one type of administrative burden ranged between several million to several hundred million dollars in administrative costs, while another analysis suggested that any potential savings would amount to less 0.1% of overall Medicaid spending.30,31 Together, these studies suggest that changes to Medicaid enrollment or program design may have consequences for administrative burden, but their impact on administrative spending are not well-understood.
Other sources of state-level variation that could be reflected in differential administrative spending include how states contract with private insurance firms to provide services to enrollees. In managed care models, states pay managed care organizations (MCOs) capitated amounts to provide services to beneficiaries as opposed to reimbursing providers directly using a fee-for-service payment model. 32 While managed care may reduce Medicaid spending due to incentives to manage utilization of health services and coordinate care, managed care may also increase administrative spending depending on complexity of the managed care environment (e.g., number of programs, number of insurers states contract with, number of plans, etc.). States with extensive managed care programs may have to invest more heavily in enforcement and regulation of managed care entities than states that choose not to offer managed care at all or for just limited populations of enrollees. To date and to our knowledge, researchers have not found evidence of a significant relationship between managed care and administrative spending, 21 but a study by Duggan and Hayford indicated that shifting from fee-for-service to managed care increased overall Medicaid spending. 33
The COVID-19 PHE offers a unique opportunity to further study Medicaid administrative expenditures. Pandemic-related closures led to high unemployment and record enrollment.34-37 To help states manage greater-than-usual demand for Medicaid, the United States Congress passed the Families First Coronavirus Relief Act and enclose (FFCRA), which temporarily enhanced states’ FMAP by 6.2 percentage points contingent on states adhering to MOE policy. 38 To adhere with MOE policy, states relaxed administrative burdens by pausing eligibility redetermination—a major administrative function of Medicaid agencies. 39 Early analyses post-policy change have shown overall Medicaid spending increases, but whether rule changes in enrollment and eligibility resulted in changes to administrative expenditures is not known.40,41
Therefore, the purpose of this study was to assess the relationship between MOE policy and administrative spending. We hypothesized that administrative spending might decrease due to states experiencing savings from pausing eligibility redeterminations. Alternatively, total administrative spending could have increased, at least in the first year of the MOE period, due to an influx of new enrollment applications that had to be processed. Additionally, continuous eligibility may have induced demand-side moral hazard, especially among enrollees who have traditionally struggled to maintain coverage. If new and existing enrollees utilized more healthcare services during the MOE, then we might also see an increase in per-enrollee administrative spending due to a higher volume of claims to process and adjudicate; however, literature has suggested lower service utilization during this time. 42 We hypothesized that states with higher unemployment rates would see an increase in administrative expenditures due to a larger pool of individuals eligible for and potentially enrolling in Medicaid. We also expected states with greater administrative burden to experience a steeper decline in administrative spending because states with greater administrative burden may have stricter eligibility and enrollment rules that are costly to implement. Thus, when federal law paused eligibility determination, states incurred cost savings that would have otherwise been allocated towards enforcing and monitoring compliance with eligibility and enrollment rules. Because prior studies did not show a relationship between Medicaid expansion (increased enrollment) and managed care penetration, we did not expect to see a strong relationship between managed care and administrative spending, but considered that more complex managed care arrangements could result in increased administrative spending. Furthering knowledge of drivers of administrative spending can assist governments in forming more accurate budget forecasts and consequently making more informed decisions around Medicaid spending.
Methods
Design and Data Sources
We used a pre-post panel study design with state fixed effects to examine the relationship between the MOE policy and administrative spending. To create our panel dataset, we compiled publicly available data for 50 states and the District of Columbia from 2017 through 2022 to build an analytic data set with change in administrative spending for years 2018 through 2022. We sourced Medicaid expenditure and managed care plan data from the CMS’s Medicaid Budget and Expenditure System (MBES) and data sets.43,44 Since 1980, state Medicaid agencies have been required to submit information about program benefit and administrative expenses via form CMS-64 to inform federal Medicaid budget appropriations. 43 CMS then collates quarterly reports into annual financial reports, which we used for this study. We obtained unemployment rates from the Bureau of Labor Statistics, 45 enrollment data from CMS, managed care penetration rate from KFF, 46 state population counts from the American Community Survey’s one-year estimates, and state administrative burden scores from the State Safety-net Generosity Index website. 47
Dependent Variables
Our study had six primary outcomes of interest: total percentage changes in administrative spending, per-enrollee administrative spending, per capita administrative spending, and state-level percentage changes in administrative spending, per-enrollee administrative spending, and per capita administrative spending. The selected outcome measures were consistent with prior literature and expert guidance.21,48 We derived the spending measures from form CMS-64 data and analyzed the measures at total (i.e. federal and state) and state levels. We opted to measure relative spending (i.e. percentage change) over time rather than absolute change to account for the extent to which prior year spending influences current year spending. Our decision to use per-enrollee administrative spending factored in program size (i.e. enrollment) and complexity and was a measure of purchasing efficiency. However, because per-enrollee spending is a function of states’ enrollment, it was potentially endogenous to enrollment fluctuations—constraining the interpretation of our findings. Thus, to address possible endogeneity, we also considered per capita administrative spending, which serves as a measure of societal efficiency and is not sensitive to enrollment fluctuations, assuming that each state’s pool of Medicaid-eligible individuals is stable over time. Finally, we isolated state administrative spending from total administrative spending because, unlike FMAP rates, which vary state-by-state and year-by-year depending on states’ economic conditions, the federal matching rates that states claim to cover administrative expenditures is relatively static (usually 50%) across years. Thus, any fluctuations in spending might be more apparent in state budgets than federal budgets.
All expenditure data were adjusted to 2022 United States dollars using the Consumer Price Index. To calculate percentage change in administrative spending, we used the following calculation:

We divided spending by number of enrollees to get per-enrollee administrative spending and applied the above formula to compute percentage change in per-enrollee spending. For per capita administrative spending, we used states’ yearly population estimates as the denominator for per capita administrative spending and the above formula to compute percentage change in per capita spending.
Independent and Control Variables
Our independent variable was a binary indicator for pre-MOE and post-MOE declaration. We considered all observations occurring in 2020 through 2022 as post-MOE declaration while data prior to 2020 were considered pre-MOE. This designation approximates the actual date that the Secretary of the Department of Health and Human Services declared a COVID-19 PHE and when MOE policy in the FFCRA was enacted. 49
To address confounding bias, we used a fixed effects model that controlled for time invariant characteristics specific to each state, and we adjusted for time-varying confounding by controlling for states’ unemployment rates, MCO penetration, expansion status, and change in enrollment (except for per-enrollee models). Unemployment rates served as a proxy for the size of the pool of eligible Medicaid individuals and were collected from the Bureau of Labor Statistics’ annual state level estimates. During the COVID-19 pandemic, efforts to contain the spread of coronavirus prompted businesses to close or suspend operations—causing extensive temporary layoffs and permanent job loss. 50 Many of these individuals also lost employer-sponsored health insurance or became newly eligible for Medicaid coverage. Consequently, Medicaid enrollment grew approximately 32.4% between February 2020 and early 2023. 51 Prior literature has linked higher unemployment rates to increased Medicaid enrollment, which could impact Medicaid administrative expenditures due to agencies having to process a larger than usual volume of applications.19,20 Other controls such as MCO penetration reported as percentages, number of managed care plans, and expansion proxied measures of state Medicaid program complexity that could contribute to variable administrative spending.
Empirical Approach & Statistical Analyses
The final analytic sample contained 255 observations with complete data for all 50 states and the District of Columbia spanning years 2018 through 2022. In our main analyses, we regressed our dependent variables on a binary indicator for the MOE in our crude (unadjusted) models, then incorporated controls in subsequent adjusted models. We fitted linear regression models for panel data to assess percentage changes in total administrative spending, per-enrollee administrative spending, and per capita administrative spending.
To study whether trends were consistent across states of varying levels of administrative burden, we also stratified our models by baseline administrative burden tertile. We derived administrative burden quartiles from averaging Fox et al.’s administrative burden index scores for years 2018 through 2020. The index has not been updated since 2020, thus we treated baseline administrative burden tertile as a time invariant characteristic. The administrative burden index assigned scores to states based on state-level rules around asset tests, eligibility screenings, applications, and renewals.52,53 In this index, states could score between 0 and 100, with higher scores indicating more generous enrollment and renewal policies and lower scores indicating stricter or more burdensome rules. Using Stata’s tertile command, we assigned states to equally sized (n = 17) tertiles, with Tertile 1 (High Burden) ranging between scores of 48.6 and 61.1, Tertile 2 (Moderate Burden) ranging between 62.5 and 71.8, and Tertile 3 (Low Burden) ranging between 72.2 and 88.9.
Sensitivity Analyses
We estimated an additional three sets of sensitivity analyses to further assess the robustness of our primary model specifications. The first set of sensitivity analyses added an additional managed care control: number of managed care plans and conducted a pairwise correlation test to ensure that managed care penetration and number of managed care plans was not collinear. The second set of sensitivity analyses interacted MOE policy with administrative burden tertiles and estimated stratified models by administrative burden tertile. The last set of sensitivity analyses operationalized managed care penetration a categorical variable with three levels (low, moderate, and high penetration) instead of modeling managed care penetration as a percentage. Full results for the third and final sets of sensitivity analyses can be found in the Supplement (Supplements 2 through 5).
MC Plans, tertiles/joint test (tertiles in Supplement), MCO tertiles instead of percentages.
Results
Summary Statistics
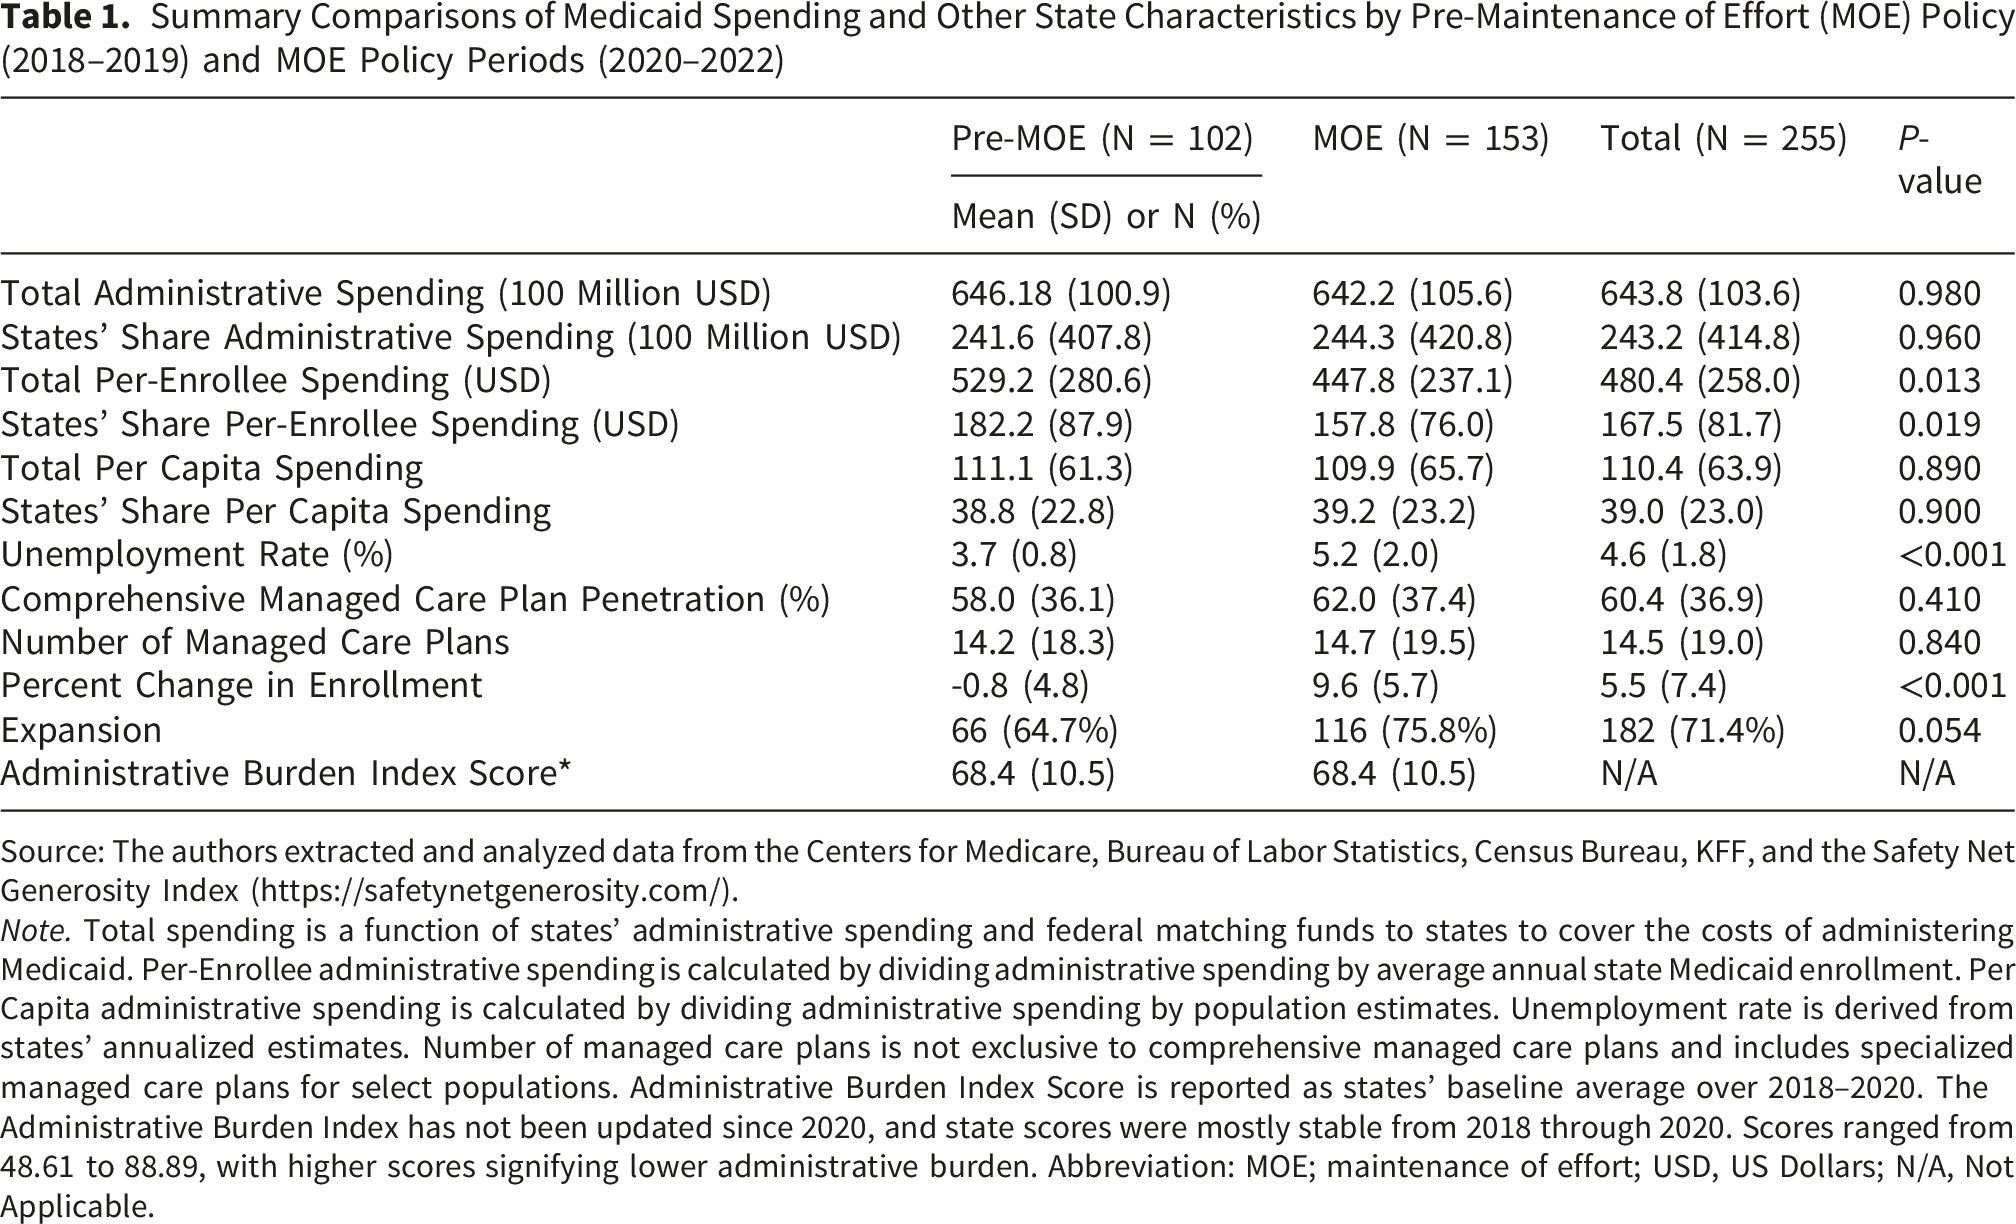
In our sample of 50 states and District of Columbia, administrative expenditures and per capita administrative expenditures remained relatively static during the study period, while per-enrollee administrative spending declined post-2020 during the MOE (Figure 1). Prior to the MOE policy, state and federal governments combined to spend on average $646.1 million administering Medicaid, and this declined to $642.3 million during the MOE period. Administrative spending averaged $584 per enrollee prior to MOE enactment and declined by nearly $100 per enrollee during the MOE period (Table 1). Per capita spending pre-MOE was approximately $111 and declined by about a dollar post-MOE. Trends in Medicaid Administrative Spending, 2018-2022. Summary Comparisons of Medicaid Spending and Other State Characteristics by Pre-Maintenance of Effort (MOE) Policy (2018–2019) and MOE Policy Periods (2020–2022) Source: The authors extracted and analyzed data from the Centers for Medicare, Bureau of Labor Statistics, Census Bureau, KFF, and the Safety Net Generosity Index (https://safetynetgenerosity.com/). Note. Total spending is a function of states’ administrative spending and federal matching funds to states to cover the costs of administering Medicaid. Per-Enrollee administrative spending is calculated by dividing administrative spending by average annual state Medicaid enrollment. Per Capita administrative spending is calculated by dividing administrative spending by population estimates. Unemployment rate is derived from states’ annualized estimates. Number of managed care plans is not exclusive to comprehensive managed care plans and includes specialized managed care plans for select populations. Administrative Burden Index Score is reported as states’ baseline average over 2018–2020. The Administrative Burden Index has not been updated since 2020, and state scores were mostly stable from 2018 through 2020. Scores ranged from 48.61 to 88.89, with higher scores signifying lower administrative burden. Abbreviation: MOE; maintenance of effort; USD, US Dollars; N/A, Not Applicable.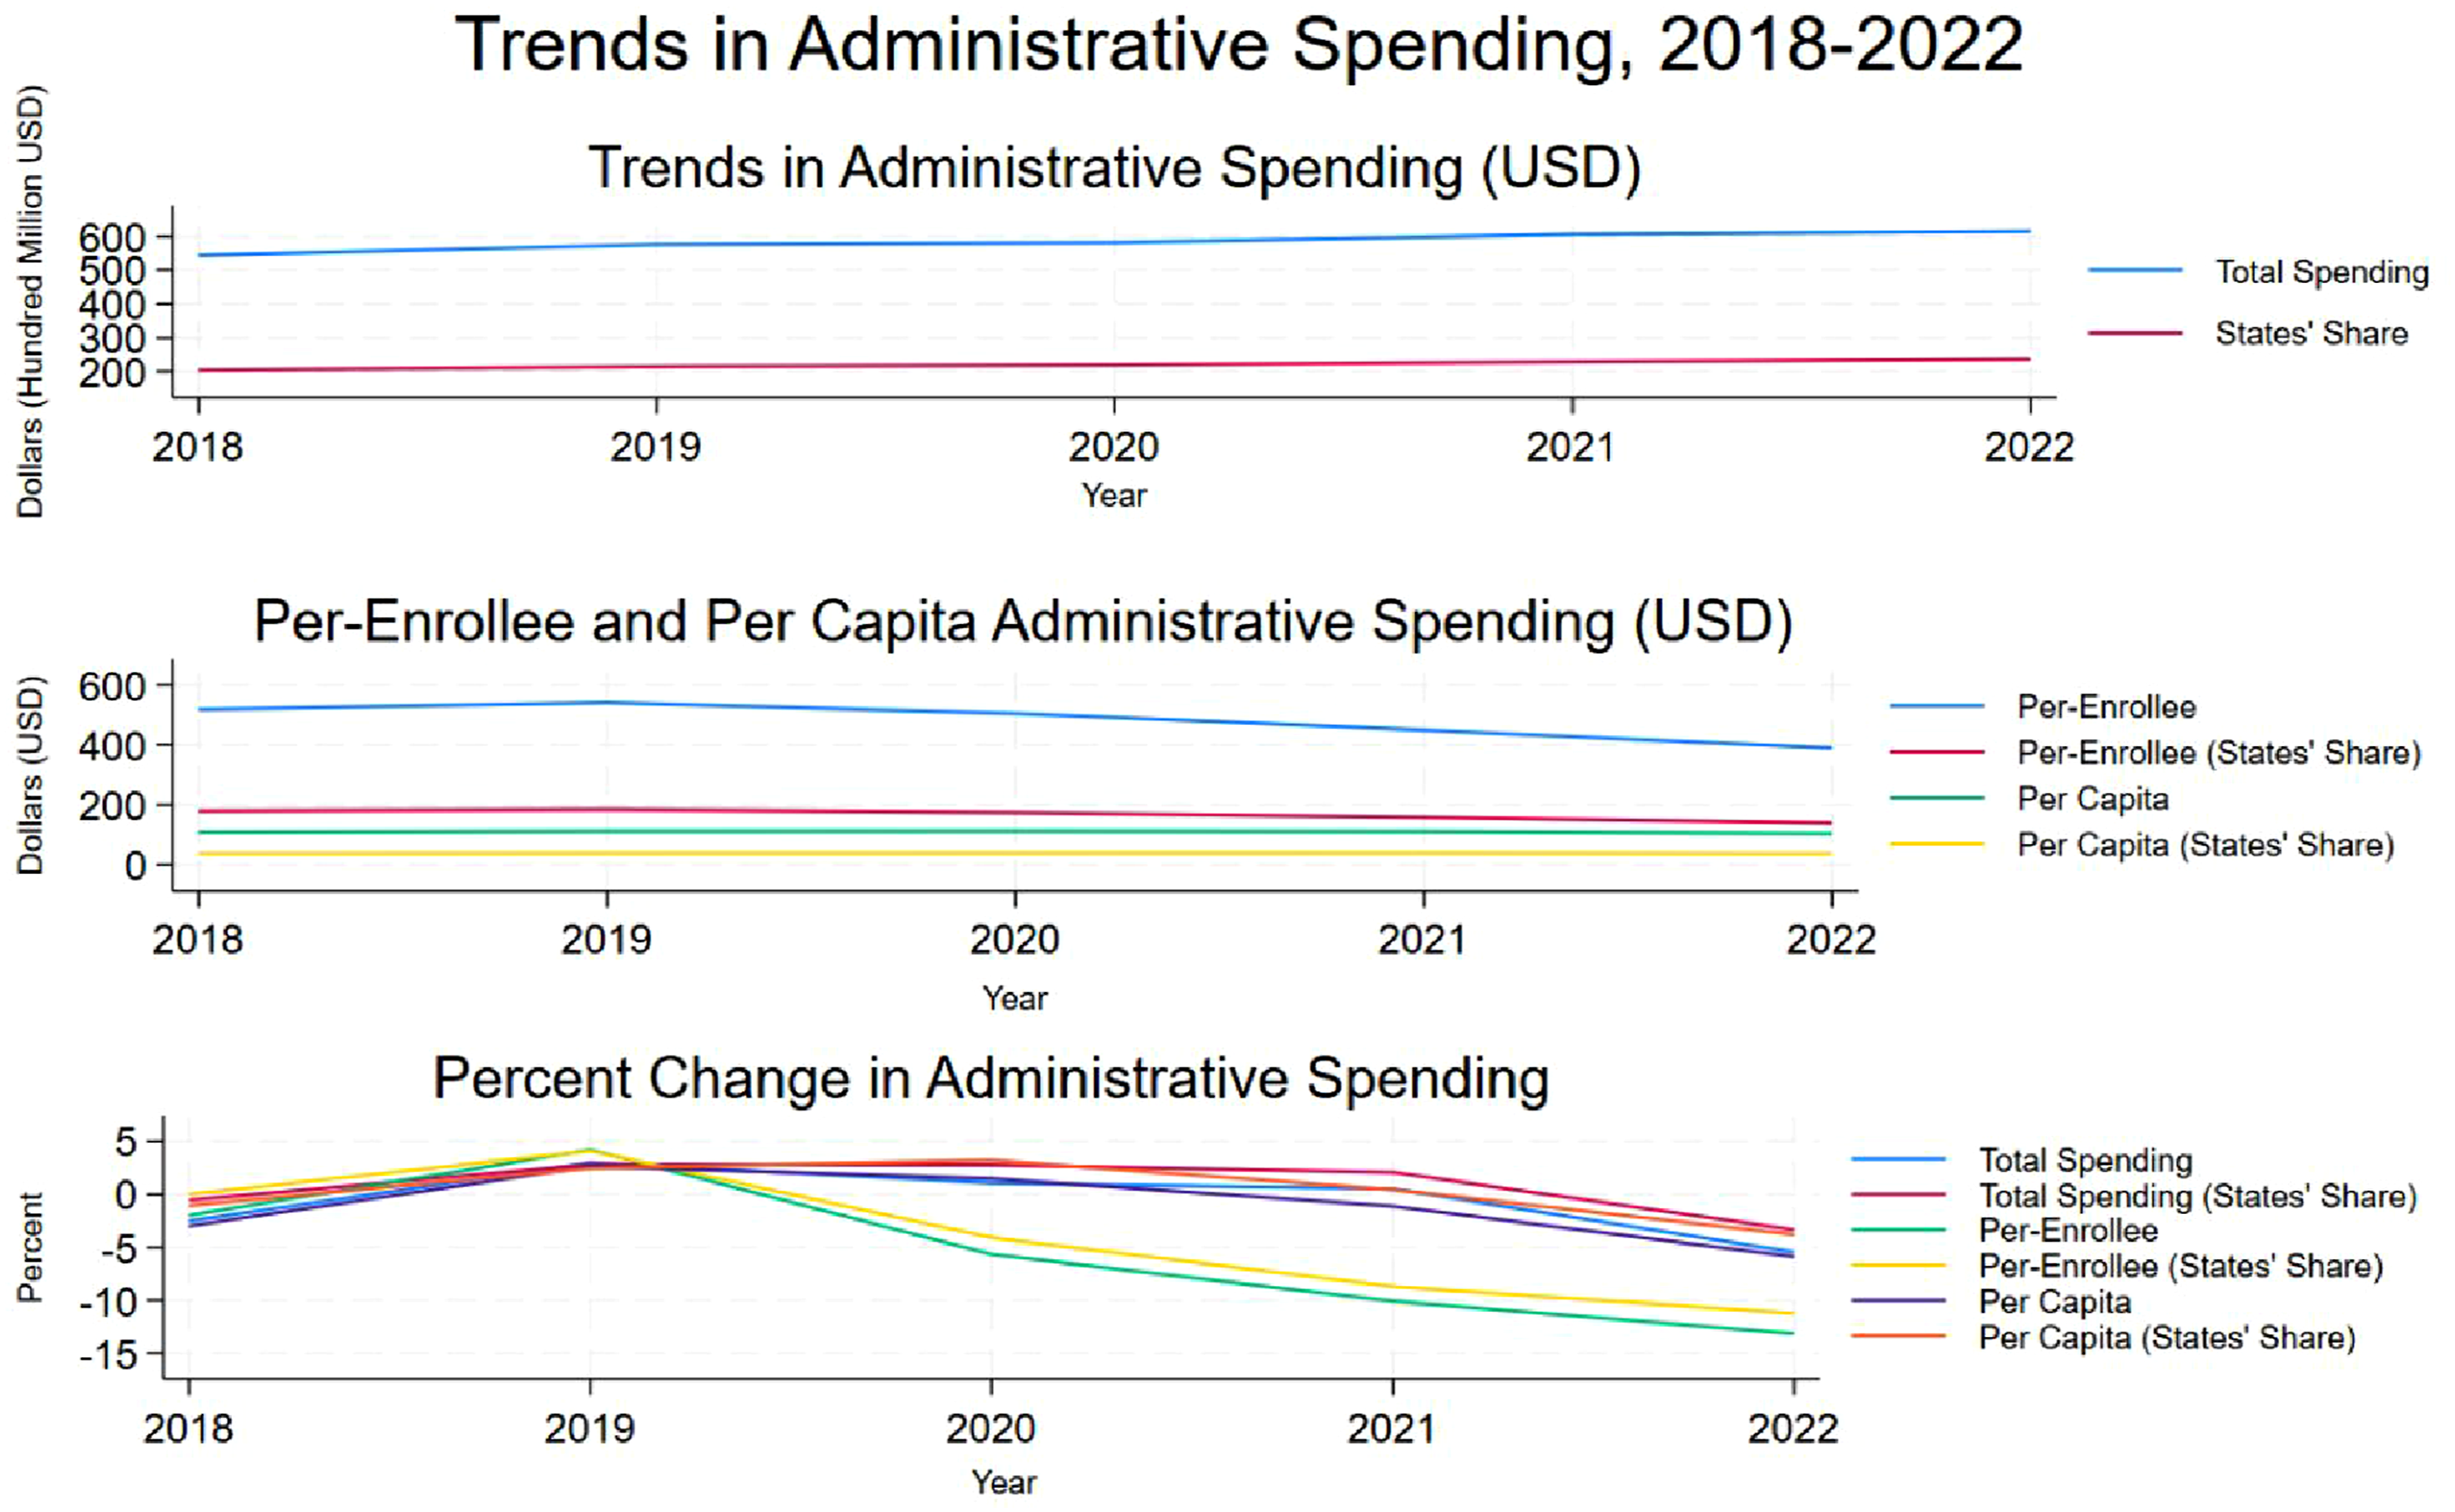
Crude and Adjusted Models
Crude (Unadjusted) Estimates for MOE-Related Percent Changes in Administrative Spending, Per-Enrollee Spending, and per Capita Spending
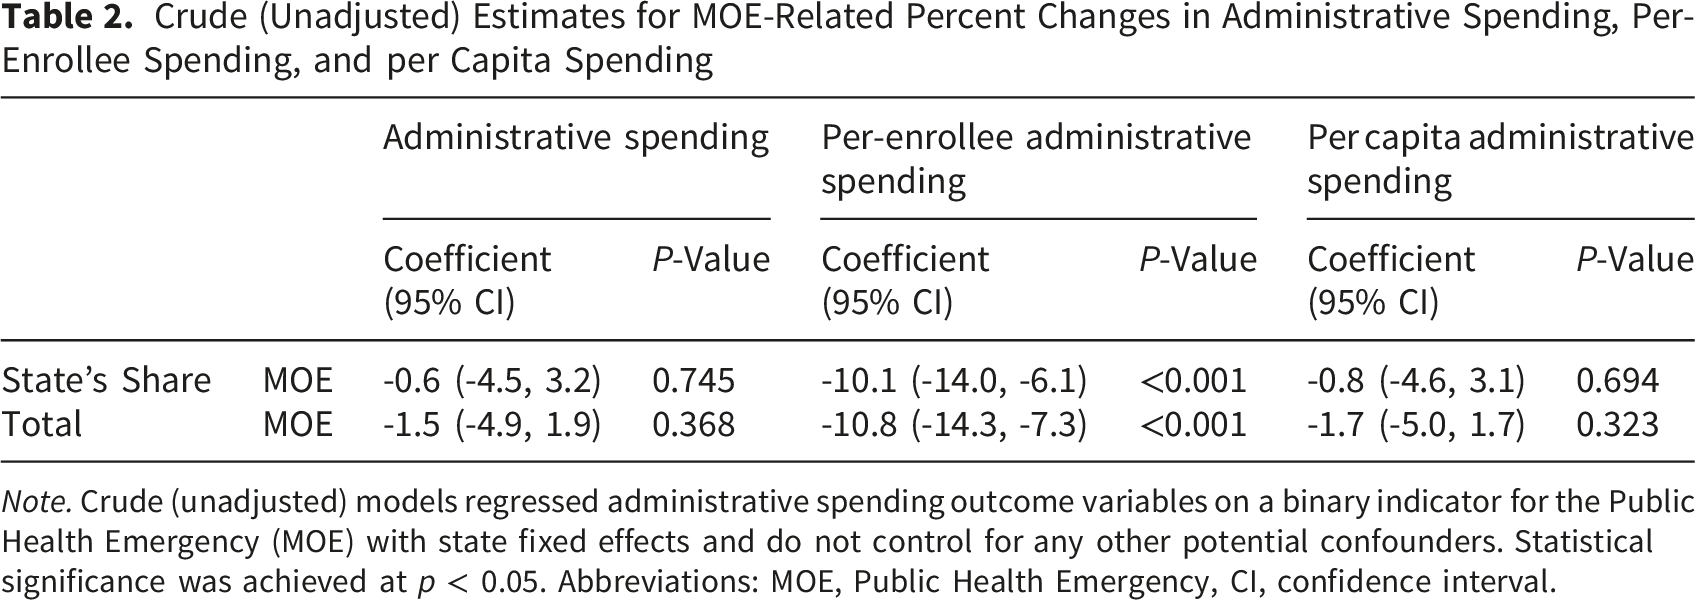
Note. Crude (unadjusted) models regressed administrative spending outcome variables on a binary indicator for the Public Health Emergency (MOE) with state fixed effects and do not control for any other potential confounders. Statistical significance was achieved at p < 0.05. Abbreviations: MOE, Public Health Emergency, CI, confidence interval.
The relationships between MOE policy and administrative spending, per-enrollee administrative spending, and per capita administrative spending remained robust to alternative model specifications despite small differences in effect sizes.
Adjusted Estimates for MOE-Related Percent Changes in Administrative Spending, Per-Enrollee Spending, and per Capita Spending
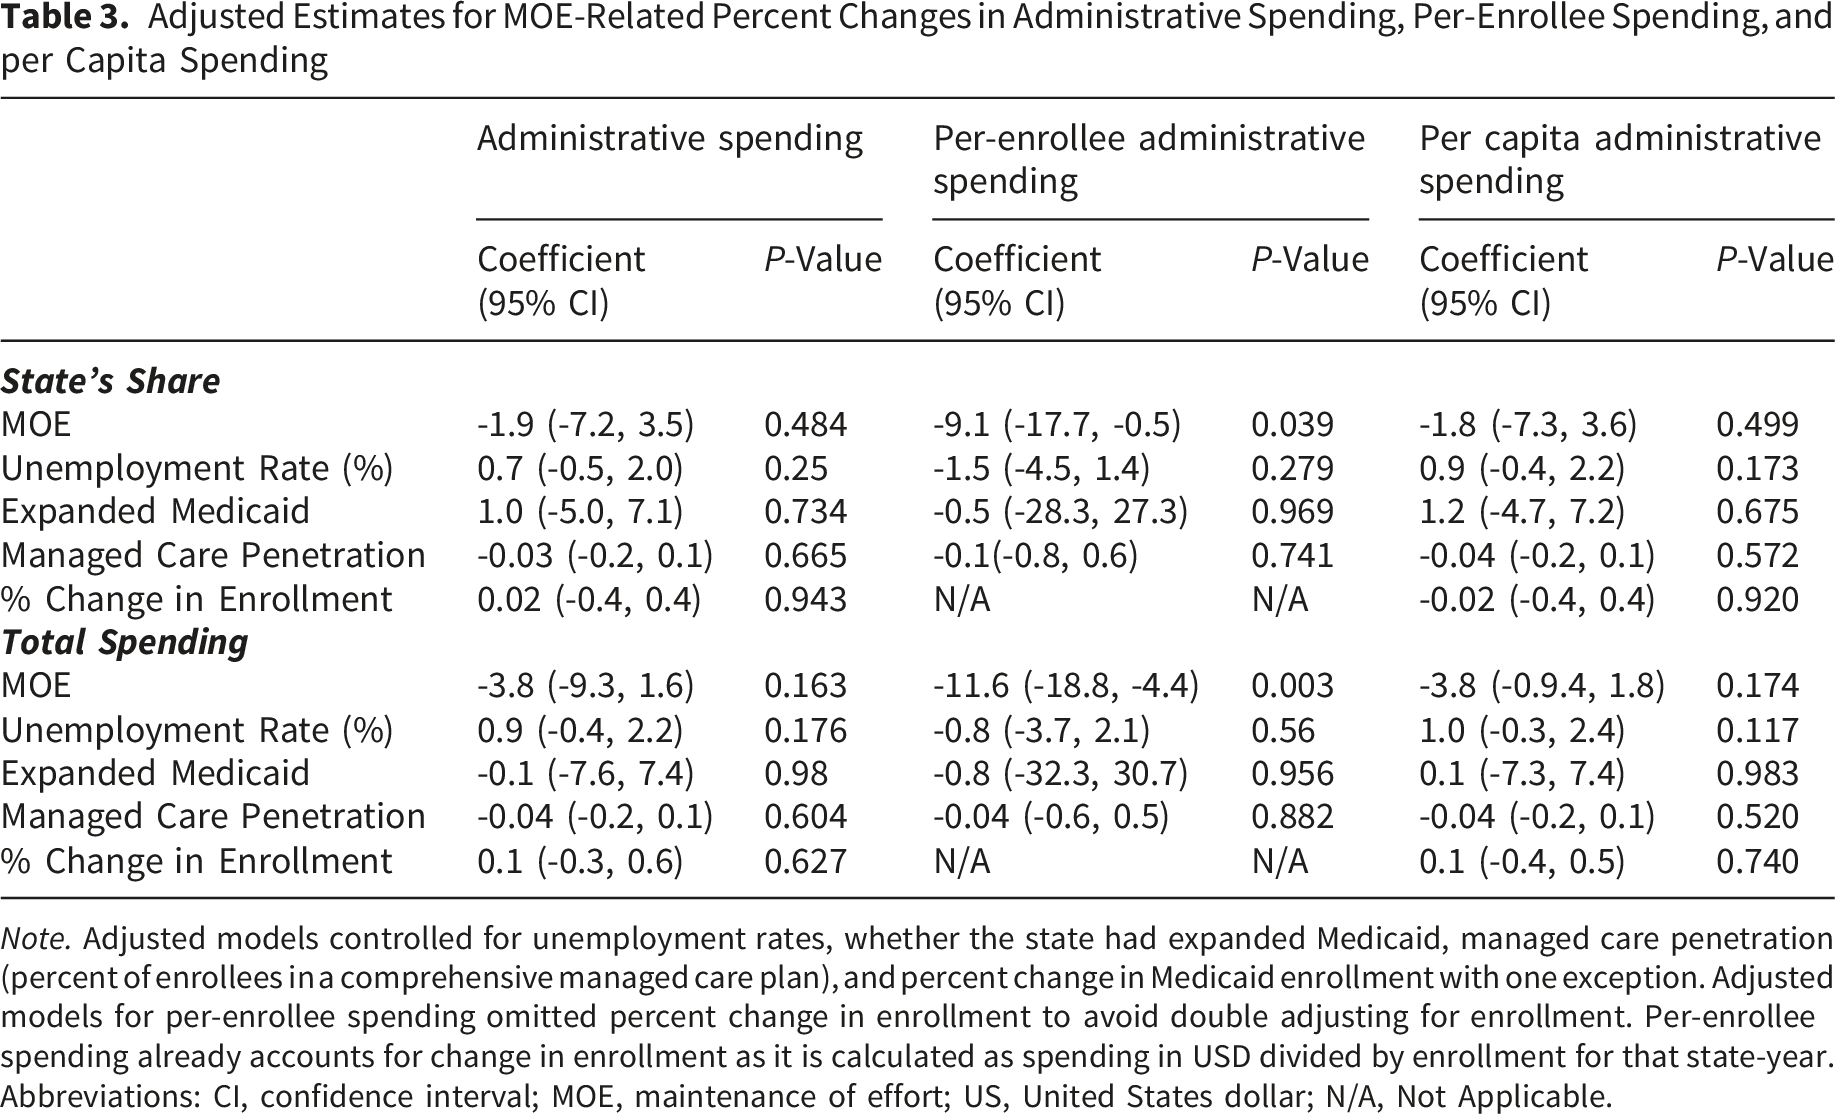
Note. Adjusted models controlled for unemployment rates, whether the state had expanded Medicaid, managed care penetration (percent of enrollees in a comprehensive managed care plan), and percent change in Medicaid enrollment with one exception. Adjusted models for per-enrollee spending omitted percent change in enrollment to avoid double adjusting for enrollment. Per-enrollee spending already accounts for change in enrollment as it is calculated as spending in USD divided by enrollment for that state-year.
Abbreviations: CI, confidence interval; MOE, maintenance of effort; US, United States dollar; N/A, Not Applicable.
Sensitivity Analysis 1: Adding Number of Managed Care Plans as an Additional Control
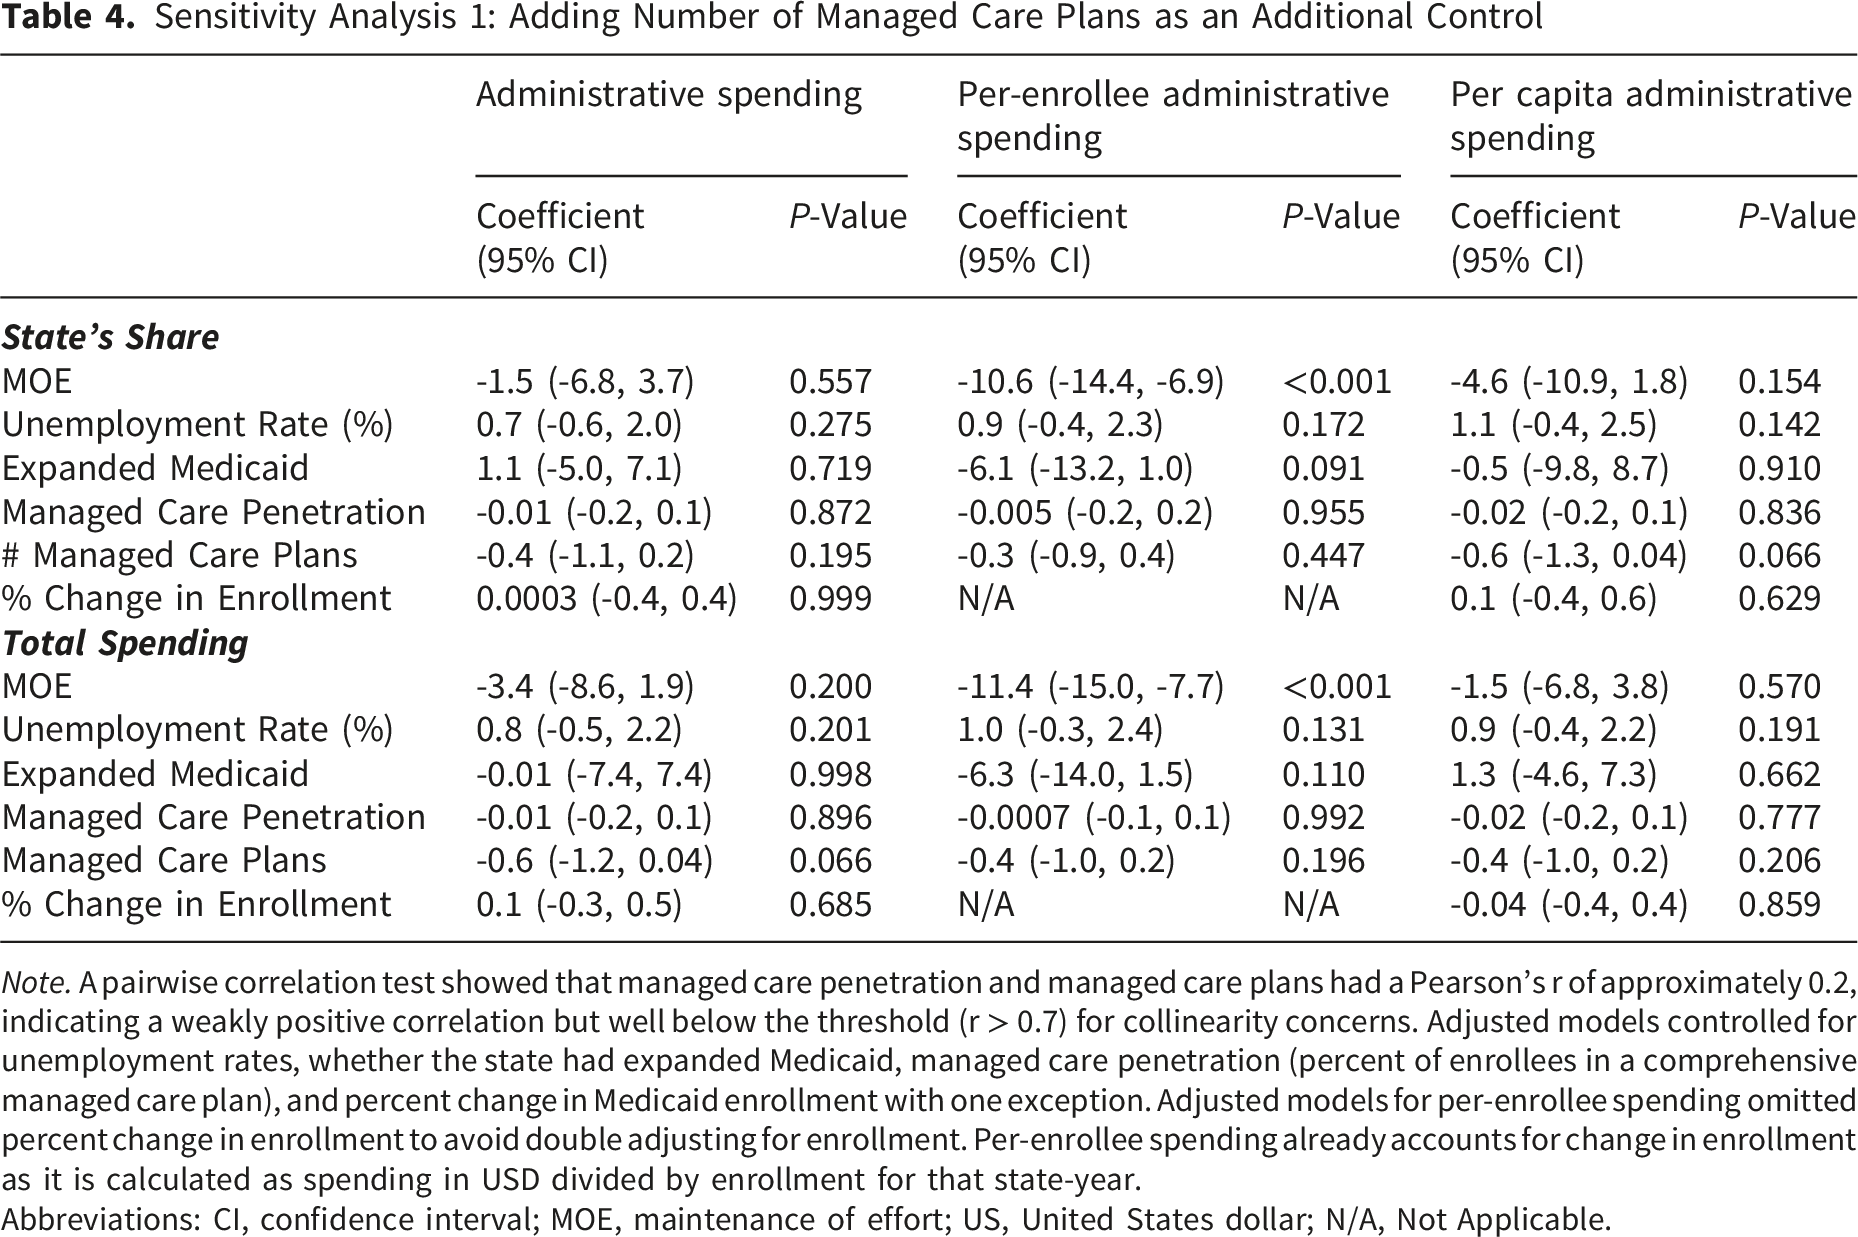
Note. A pairwise correlation test showed that managed care penetration and managed care plans had a Pearson’s r of approximately 0.2, indicating a weakly positive correlation but well below the threshold (r > 0.7) for collinearity concerns. Adjusted models controlled for unemployment rates, whether the state had expanded Medicaid, managed care penetration (percent of enrollees in a comprehensive managed care plan), and percent change in Medicaid enrollment with one exception. Adjusted models for per-enrollee spending omitted percent change in enrollment to avoid double adjusting for enrollment. Per-enrollee spending already accounts for change in enrollment as it is calculated as spending in USD divided by enrollment for that state-year.
Abbreviations: CI, confidence interval; MOE, maintenance of effort; US, United States dollar; N/A, Not Applicable.
Joint Test Results for Adjusted Models Assessing Effect Modification by Administrative Burden Tertile
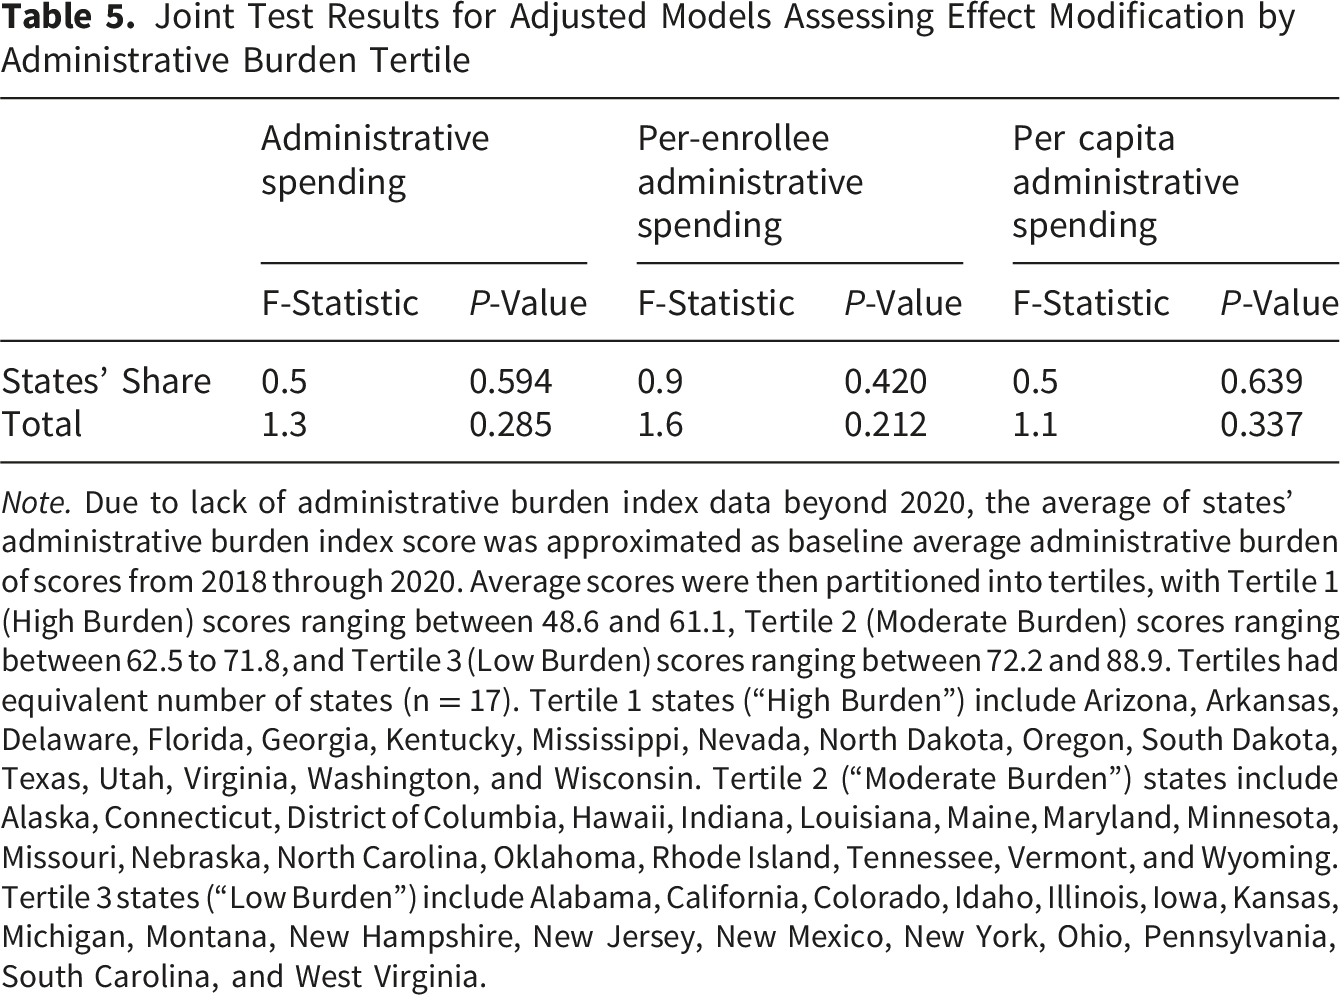
Note. Due to lack of administrative burden index data beyond 2020, the average of states’ administrative burden index score was approximated as baseline average administrative burden of scores from 2018 through 2020. Average scores were then partitioned into tertiles, with Tertile 1 (High Burden) scores ranging between 48.6 and 61.1, Tertile 2 (Moderate Burden) scores ranging between 62.5 to 71.8, and Tertile 3 (Low Burden) scores ranging between 72.2 and 88.9. Tertiles had equivalent number of states (n = 17). Tertile 1 states (“High Burden”) include Arizona, Arkansas, Delaware, Florida, Georgia, Kentucky, Mississippi, Nevada, North Dakota, Oregon, South Dakota, Texas, Utah, Virginia, Washington, and Wisconsin. Tertile 2 (“Moderate Burden”) states include Alaska, Connecticut, District of Columbia, Hawaii, Indiana, Louisiana, Maine, Maryland, Minnesota, Missouri, Nebraska, North Carolina, Oklahoma, Rhode Island, Tennessee, Vermont, and Wyoming. Tertile 3 states (“Low Burden”) include Alabama, California, Colorado, Idaho, Illinois, Iowa, Kansas, Michigan, Montana, New Hampshire, New Jersey, New Mexico, New York, Ohio, Pennsylvania, South Carolina, and West Virginia.
Discussion
We sought to examine the relationship between MOE policy and Medicaid administrative spending. Despite year-to-year fluctuations, we did not observe statistically significant changes in the dollar amount spent and per capita spending. Our study only showed that per-enrollee administrative spending significantly declined after MOE policy was enacted. Our primary adjusted model yielded the most conservative estimates, showing that per-enrollee spending declined by 9.1 pp from 2020 through 2022 while estimates from crude and sensitivity analyses ranged between -10.1 and -10.6 pp. On average, states spent about $529 per-enrollee on administrative costs prior to the MOE period and spent about $447.8 per enrollee during the MOE period. In comparison, other scholars have estimated administrative spending in commercial insurance to range between $472 to $800 per-enrollee.54,55 While we find that per-enrollee Medicaid administrative spending is comparable to or lower than some commercial health programs, more research is needed to ascertain Medicaid’s administrative efficiency relative to other payers. Declines in per-enrollee administrative spending could be due to state agencies saving on staffing or payroll by not having to conduct redeterminations. Observed declines in per-enrollee spending during the MOE period also reflect the spreading of fixed administrative costs over a larger population of enrollees, suggesting possible economies of scale.
This study did not detect significant MOE-related changes in administrative spending (percentage changes in dollar amounts), suggesting that overall administrative spending varies little year-to-year because many administrative functions, if not most, may have fixed costs. Overhead and operational expenses such as salaries, 56 which grow more slowly in the public sector than private sector, may be stable over long periods of time. Consequently, our study period of five years was not broad enough to detect those changes. Variable costs such as modernizing state Medicaid Management Information Systems may substantially increase administrative spending 57 ; however, information technology (IT) modernization efforts may be rare and a majority of states during our study period may not have invested in IT modernization. Future investigation of specific administrative functions may reveal further insights into what administrative functions are typically fixed as opposed to variable. Another explanation for null findings might be that while the Medicaid may have incurred cost savings from not having conduct redeterminations, some of the cost savings were offset by administrative costs associated with enrolling an influx of new enrollees or unmeasured changes in service utilization during the study period.
MOE policy ended on March 31, 2023—prompting states to return to normal operations. Consequently, states resumed eligibility renewals and terminated coverage for individuals not meeting eligibility criteria. Since then, researchers estimate that state Medicaid agencies have disenrolled between 12% and 57% of enrollees.39,58 Because our analyses demonstrated generally static administrative spending trends pre-MOE and during the MOE period, we expect that administrative spending would also remain stable during the MOE unwinding period as enrollees are disenrolled. However, it is possible that media campaigns (e.g., digital, print, or radio advertising), increasing workforce capacity to conduct renewals, and other targeted outreach activities may have contributed to higher administrative spending, at least in the early stages of unwinding. Alternatively, states might also not experience noticeable changes in administrative spending if they outsource many administrative functions such as eligibility and redetermination functions to community health centers and federally-qualified health centers, which often employ navigators to help patients enroll in and renew Medicaid coverage.59,60 Further analysis of forthcoming and later years of Medicaid expenditure reports could reveal the effects of unwinding on administrative spending.
We selected a list of controls for adjusted models that we believed could theoretically contribute to changes in administrative spending (e.g., unemployment and managed care). Although the inclusion of controls and fixed effects likely reduced omitted variable bias, none of the controls achieved statistical significance in our adjusted models. Our study did not find substantial evidence that administrative burden impacted administrative spending or changes in administrative spending. We stratified our models by administrative burden tertile with the assumption that differential state priorities and program design might alter spending behavior. For example, states might invest more resources towards personal responsibility guardrails such as more frequent income or citizenship tests, with the intention of reducing waste.28,61,62 Such mechanisms could be costly for the state to operate and monitor, therefore increasing administrative spending. However, investment into these administrative burdens may also result in lower spending by reducing the number of enrollees and curbing healthcare utilization.53,63,64 When legislation incentivized states to pause redetermination in 2020, we expected to observe a dose-dependent response. We hypothesized that states with higher administrative burden would experience a more dramatic decrease in administrative spending, but small sample sizes wide and overlapping confidence intervals in our stratified models suggest that administrative burdens do not significantly add to or reduce Medicaid administrative spending.
During the MOE, all states abided by requirements that effectively resulted in continuous eligibility for enrollees in order to claim the 6.2 percentage point FMAP increase. 65 With the exception of declines in per-enrollee spending, our study did not find a relationship between this MOE policy and changes to state administrative spending. This infusion of federal dollars likely helped stabilize state budgets and manage record enrollment.11,66 However, to curb national health spending, legislators have recently proposed a variety of federal Medicaid spending cuts such as reducing FMAP rates, reducing federal dollars for Medicaid expansion, capping federal spending on Medicaid, and block granting federal funds.67,68 These changes would shift the burden of financing Medicaid towards states and could induce some states to reverse Medicaid expansion. 69 How states might prepare for such changes through budget cuts or experimenting with different administrative burdens and their implications for administrative spending remain unclear.
Limitations
Our study is subject to several limitations. First, our study design does not allow us to draw causal inferences from observed changes in administrative spending in the pre-MOE and MOE periods. Second, our study period is limited to 2018 through 2022 data, so we did not observe any changes in administrative spending during MOE unwinding. The short study period may also have been insufficient to detect changes in administrative spending caused by pricey variable costs (e.g., technology modernization) or long-run costs incurred by Medicaid. Third, we did not specifically examine subcategories of administrative spending such as design and implementation of eligibility systems, utilization reviews or prior authorizations, cost of employing eligibility determination staff, and the extent to which enrollment and eligibility tasks are performed in-house or contracted out. It is possible that while overall administrative spending did not change, some categories of administrative spending that are more sensitive to federal continuous eligibility rules would have experienced more pronounced changes during the PHE. Fourth, our models did not account for any state policy or rule changes during the PHE that could have an impact on administrative spending (e.g., suspension of cost sharing). Fifth, we lacked national-level data to determine whether administrative spending was related to fluctuations in health care service utilization or demand for healthcare utilization during the study period. Sixth, we opted to use Fox et al.’s administrative burden index as it has been validated in prior studies, but the index primarily focuses on enrollment and eligibility tasks while omitting other administrative functions. Thus, the index does not fully capture administrative burden. Finally, we lacked reliable or complete state-year data on program design choices that might contribute to variation in administration costs such as number and types of waivers and proportion of enrollees in each state who are pregnant, disabled, aged, or dually enrolled in Medicare.
Generalizability
This study is limited in generalizability to the United States public insurance system, specifically Medicaid, and findings likely do not apply to administrative spending patterns in private insurance or Medicare. MOE policy guaranteeing continuous Medicaid eligibility for a brief amount of time was also an unprecedented policy change that may not occur again. To our knowledge, there has not been similar policies enacted at the federal level, but a recent rule change by the Department of Health and Human Services requiring all states to provide at 12 months of continuous eligibility to children enrolled in Medicaid could yield similar spending trends, especially because children account for nearly half of all Medicaid enrollment. 70 The result of MOE policy was rapid enrollment surge, which could somewhat be comparable to historical Medicaid expansion efforts that also resulted in a rapid surge in enrollment.
Conclusion
Government spending on means-tested programs such as Medicaid receives heightened scrutiny due to expectations surrounding prudent allocation of public dollars.71-74 The results of this study suggest that Medicaid oversaw atypically high Medicaid enrollment without experiencing an increase administrative spending. State characteristics such as level of administrative burden and managed care penetration were not associated with differential administrative spending, perhaps suggesting that states can tinker with their Medicaid programs with low risk of adverse financial repercussions. Despite limitations, our work contributes evidence of the MOE policy’s impact on Medicaid administrative spending. To address some of the limitations, future work ought to consider qualitative methods or survey approaches to better understand how Medicaid agency leaders and staff responded to the MOE requirements. Furthering scholarship in administrative spending within public programs such as Medicaid can promote transparency and increase public trust in these programs.
Supplemental Material
Supplemental Material - Trends in Medicaid Administrative Expenditures During the COVID-19 Public Health Emergency
Supplemental Material for Trends in Medicaid Administrative Expenditures During the COVID-19 Public Health Emergency by Yvette H. Tran, PhD, Ann M. Holmes, PhD, Joshua R. Vest, PhD, Timothy D. McFarlane, Justin Blackburn, PhD in The Journal of Health Care Organization, Provision, and Financing
Footnotes
Acknowledgements
The authors thank Casey Balio, PhD for helpful insights and valuable guidance regarding Medicaid administrative spending data.
Ethical Considerations
None. Not a human subjects research study.
Funding
The authors received no financial support for the research, authorship, and/or publication of this article.
Declaration of Conflicting Interests
The authors declared no potential conflicts of interest with respect to the research, authorship, and/or publication of this article.
Data Availability Statement
All data used are publicly available. Analytic and script files may be shared upon request.
Supplemental Material
Supplemental material for this article is available online.
References
Supplementary Material
Please find the following supplemental material available below.
For Open Access articles published under a Creative Commons License, all supplemental material carries the same license as the article it is associated with.
For non-Open Access articles published, all supplemental material carries a non-exclusive license, and permission requests for re-use of supplemental material or any part of supplemental material shall be sent directly to the copyright owner as specified in the copyright notice associated with the article.