
Abstract
Introduction
Financial toxicity is an important but insufficiently synthesized dimension of cardiovascular disease burden, reflecting the economic hardship caused by out-of-pocket payments, indirect costs, medical debt, and affordability-related barriers to care.
Methods
A systematic review and Bayesian meta-analysis were conducted in accordance with Preferred Reporting Items for Systematic Reviews and Meta-Analyses guidelines. PubMed, Embase, Scopus, and Web of Science were searched up to May 2025 for studies evaluating financial toxicity among patients with cardiovascular diseases. Random-effects meta-analysis and Bayesian hierarchical models were used to estimate pooled prevalence, credible intervals, heterogeneity, and determinants of financial toxicity.
Results
Thirty studies including 1,087,594 patients were analyzed across diverse healthcare systems and cardiovascular conditions. Catastrophic health expenditure exceeding 40% of out-of-pocket spending affected 28% of patients in frequentist analysis and 34% in Bayesian analysis, while the 20% threshold affected 15%. Difficulty paying medical bills was reported by 46% of patients, and 16–17% were unable to meet medical expenses. Heterogeneity was substantial across outcomes, reflecting differences in healthcare financing, disease severity, and socioeconomic context. Consistent determinants of financial toxicity included lack of insurance, low income, rural residence, younger age, longer hospitalization, private-sector care, and procedurally intensive treatment.
Conclusion
Financial toxicity is highly prevalent among patients with cardiovascular diseases and is shaped by both socioeconomic vulnerability and healthcare system structure. Integrating financial risk screening, expanding insurance protection, reducing out-of-pocket expenditure, and targeting support toward high-risk groups are essential for improving equitable cardiovascular care.
Keywords
Introduction
Cardiovascular diseases (CVDs) remain the leading cause of morbidity and mortality globally, accounting for approximately 17.9 million deaths annually, according to the World Health Organization. 1 These conditions, encompassing coronary artery disease, heart failure, stroke, and other vascular disorders, impose a significant burden on healthcare systems and patients alike. 2 Beyond the physical and emotional toll, the economic impact of CVDs has garnered increasing attention, particularly the concept of financial toxicity.3,4 Financial toxicity refers to the economic hardship and distress patients experience due to the direct and indirect costs of medical care, including out-of-pocket expenses, lost income, and other financial strains. In the context of CVDs, financial toxicity is a critical yet understudied issue that can profoundly affect patients’ quality of life, treatment adherence, and clinical outcomes. 3
The costs associated with CVD management are substantial. Diagnostic procedures, such as cardiac imaging and catheterization, coupled with long-term pharmacological therapies, surgical interventions, and frequent hospitalizations, contribute to escalating healthcare expenditures. 5 For instance, the American Heart Association has estimated that the direct medical costs of CVDs in the United States alone are projected to exceed $400 billion annually by 2030. 6 Global estimates suggest that the total cost of CVD including both direct healthcare expenditures and indirect productivity losses is expected to rise to approximately $1.04 trillion USD by 2030. 7 According to the World Health Organization, over 80% of CVD-related deaths occur in low- and middle-income countries (LMICs), where health systems often lack the financial protections found in high-income nations. 8 For patients, particularly those with limited financial resources or inadequate insurance coverage, these costs translate into significant out-of-pocket expenses. Such economic burdens can lead to difficult choices, such as prioritizing healthcare payments over basic needs like housing or food, or even forgoing essential treatments due to unaffordability. 9 This phenomenon is particularly pronounced in low- and middle-income countries, where access to subsidized healthcare is often limited, but it is also prevalent in high-income settings with fragmented insurance systems.
Financial toxicity in CVDs is not solely a function of medical costs but is influenced by a complex interplay of determinants. Socioeconomic factors, such as income level, employment status, and education, play a pivotal role in shaping patients’ ability to manage healthcare expenses. 10 Patients with lower socioeconomic status are disproportionately affected, as they may lack the resources to cover copayments, deductibles, or uncovered services. Additionally, healthcare system characteristics, including the availability of universal coverage, reimbursement policies, and access to affordable medications, significantly influence the degree of financial toxicity. For example, in systems with high out-of-pocket costs or limited generic drug availability, patients face greater financial strain.11,12Treatment-related factors, such as the complexity and duration of CVD management, also contribute. Patients requiring advanced interventions, such as implantable devices or heart transplantation, often face higher costs compared to those managed with pharmacotherapy alone. 13 Furthermore, patient-specific variables, including age, comorbidities, and social support, can exacerbate or mitigate financial toxicity. For instance, elderly patients or those with multiple chronic conditions may face compounded costs, while robust social support may alleviate some financial pressures.
The consequences of financial toxicity are far-reaching. Studies have shown that patients experiencing high financial burdens are more likely to delay or skip treatments, leading to poorer disease control, increased hospitalizations, and worse clinical outcomes.14,15 For example, non-adherence to prescribed medications, such as statins or anticoagulants, due to cost concerns is associated with higher risks of adverse cardiovascular events. 16 The psychological toll of financial toxicity, including stress, anxiety, and depression, further compounds its impact, creating a vicious cycle of deteriorating health and financial instability. 17
Despite growing recognition of financial toxicity in CVDs, there remains a lack of comprehensive evidence synthesizing its prevalence, determinants, and impact. A systematic review and meta-analysis are needed to consolidate the available evidence, quantify the extent of financial toxicity, and identify its key drivers across diverse populations and healthcare settings. Such an analysis can provide a robust foundation for developing targeted interventions, such as cost-sharing reduction programs, improved insurance coverage, or patient assistance initiatives, to mitigate financial toxicity. Additionally, understanding the determinants of financial toxicity can inform health policy reforms aimed at enhancing equitable access to CVD care.
Methods
This systematic review and meta-analysis were conducted to evaluate the prevalence, determinants, and impact of financial toxicity among patients with CVDs. The study adhered to the Preferred Reporting Items for Systematic Reviews and Meta-Analyses (PRISMA) (Table S1) 18 guidelines to ensure transparency and rigor.
Eligibility Criteria
Studies were eligible for inclusion if they involved patients diagnosed with any CVD, including coronary artery disease, heart failure, stroke, peripheral artery disease, or arrhythmias. Studies focusing exclusively on non-CVD conditions were excluded. The primary exposure of interest was financial toxicity, defined as the economic burden or distress resulting from direct costs (e.g., medical costs, out-of-pocket expenses) or indirect costs (e.g., lost income, transportation costs) associated with CVD management. Studies were included if they explicitly measured or described financial toxicity or related concepts, such as cost-related non-adherence or catastrophic health expenditure, using either subjective or objective measures. Primary outcomes of interest included the prevalence of financial toxicity and its determinants, such as socioeconomic status, healthcare system factors, treatment type, and patient demographics. Eligible study designs included observational studies (cross-sectional, cohort, case-control), interventional studies that reported financial toxicity as an outcome, and mixed-methods studies. Qualitative studies were included for narrative synthesis but excluded from meta-analysis. Editorials, reviews, case reports, and studies lacking primary data were excluded. Only studies published in English up to May 2025 were considered, with no geographical restrictions applied to ensure a global perspective.
Search Strategy
A comprehensive literature search was conducted across multiple electronic databases, including PubMed, Embase, Scopus, Web of Science, to identify relevant studies until May 2025. The search strategy combined Medical Subject Headings (MeSH) and free-text terms related to three key concepts: (1) CVDs (e.g., “heart disease,” “stroke,” “myocardial infarction”), (2) financial toxicity (e.g., “financial burden,” “economic hardship,” “out-of-pocket costs”). Search terms were tailored to each database’s syntax and functionality (Table S2).
Study Selection
Search results were imported into a Nested-Knowledge software to remove duplicates. Two independent reviewers screened titles and abstracts against the eligibility criteria. Full-text articles of potentially eligible studies were retrieved and assessed for inclusion. Discrepancies between reviewers were resolved through discussion or consultation with a third reviewer. A PRISMA flow diagram documented the selection process, including reasons for exclusion at the full-text stage.
Data Extraction and Quality Assessment
Data from the included studies were extracted using a pre-piloted data extraction form. Two reviewers independently collected information on study characteristics (including author, year, country, study design, and sample size), population details (such as patient demographics, including age and sex, and CVD diagnosis), financial toxicity measures (including definitions, measurement tools, and prevalence estimates), determinants (such as socioeconomic factors like income and insurance status, healthcare system factors like cost-sharing policies, and clinical factors like treatment type and disease severity), and statistical data (including effect sizes, odds ratios, confidence intervals, and p-values for meta-analysis). Any discrepancies in data extraction were resolved through consensus, and authors of the included studies were contacted for clarification or to obtain additional data when necessary. The methodological quality of included studies was assessed using the Joanna Briggs Institute (JBI) tool.
Data Synthesis and Meta-Analysis
A narrative synthesis summarized findings on the prevalence, determinants, and impact of financial toxicity. Where sufficient data were available a random-effects meta-analysis was conducted to pool prevalence estimates and effect sizes for key determinants and outcomes. Heterogeneity was assessed using the I2 statistic, with values >75% indicating substantial heterogeneity. Subgroup analyses were performed where evever possible based on CVD type. Publication bias was evaluated using Doi plot and LFK Index.
We calculated the posterior probability of prevalence with 95% credible intervals (CrI). All analyses were performed within a Bayesian framework using ‘weakly informative priors,’ which incorporate limited prior knowledge to let the data primarily influence the posterior estimates while providing slight regularization for model stability (11). A Bayesian hierarchical random-effects model was employed. The primary analyses used a weakly informative prior for the overall effect size μ ∼ N(0, 1) and a half-Cauchy prior for heterogeneity τ ∼ HC(0, 0.5). Study-level heterogeneity was assessed using τ. Study-specific distributions from the hierarchical model were visually represented based on model outputs. Posterior probabilities were computed using Markov Chain Monte Carlo (MCMC) methods in R (Version 4.4; R Foundation for Statistical Computing, Vienna, Austria, https://www.R-project.org/), utilizing the “brms” package with four chains and 10,000 iterations saved per chain. Posterior predictive checks were conducted by generating random samples from the posterior distribution and comparing them to observed data. MCMC convergence was evaluated through trace and density plots. Results were visualized as a joint posterior density plot of the effect parameter μ and heterogeneity parameter τ.
To evaluate the stability and robustness of the pooled prevalence estimates, a leave-one-out sensitivity analysis was performed. This involved iteratively removing one study at a time and recalculating the pooled effect size to determine if any single investigation significantly influenced the overall results or the degree of observed heterogeneity.
Results
Search Results
The screening and study selection process began with the identification of 14,207 records from databases and registers, including Embase (n=4,099), PubMed (n=3,877), Scopus (n=3,069), and Web of Science (n=3,162), alongside 8 additional records from other methods such as bibliography screening. After removing 7,278 duplicate records, a total of 6,929 records were screened. Of these, 6,685 were excluded, leaving 244 reports sought for retrieval. All 244 reports were retrieved, and their full texts were assessed for eligibility. During this assessment, 214 studies were excluded for various reasons: 7 reviews, 3 different diseases, 5 economic modeling studies, 5 country-level studies, 16 burden studies, and 168 reports not reporting the outcome of interest or deemed irrelevant. Additionally, 3 reports identified via other methods were assessed, with 3 excluded due to not reporting the outcome of interest (n=2) or being duplicates (n=1). Ultimately, a total of 30 studies19-48 were included in the analysis (Figure 1). PRISMA Flow diagram showing article screening and selection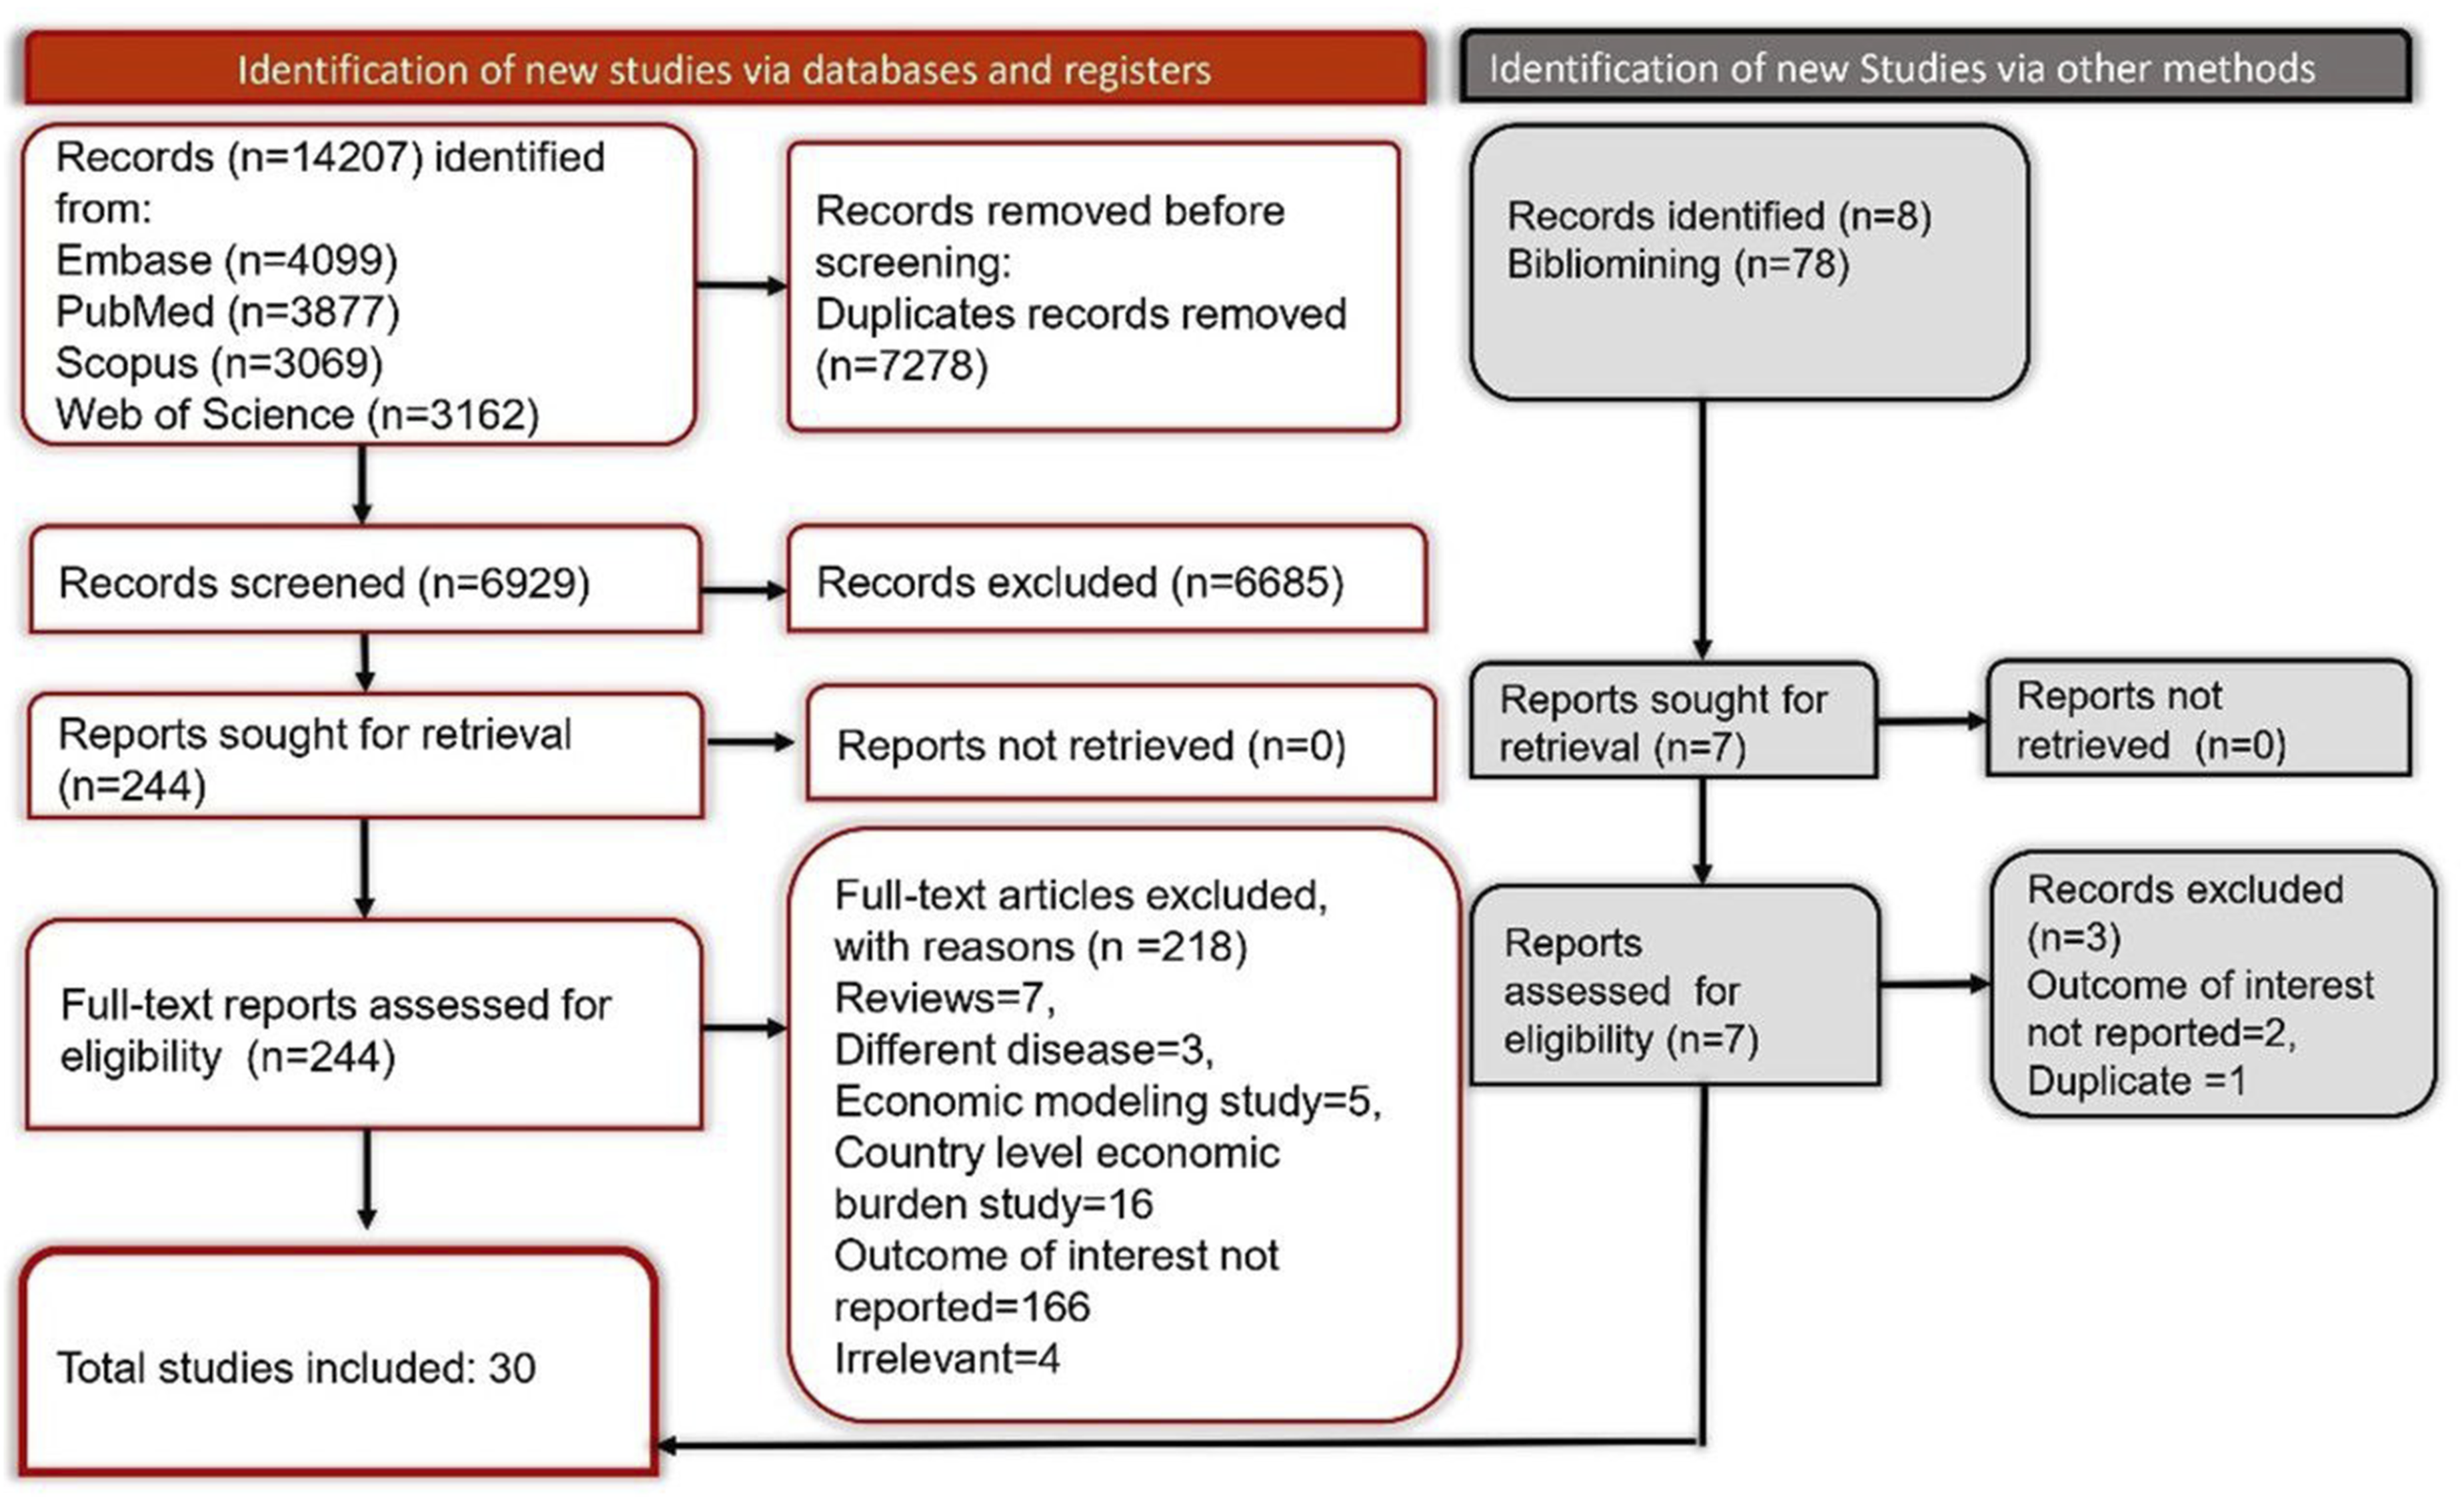
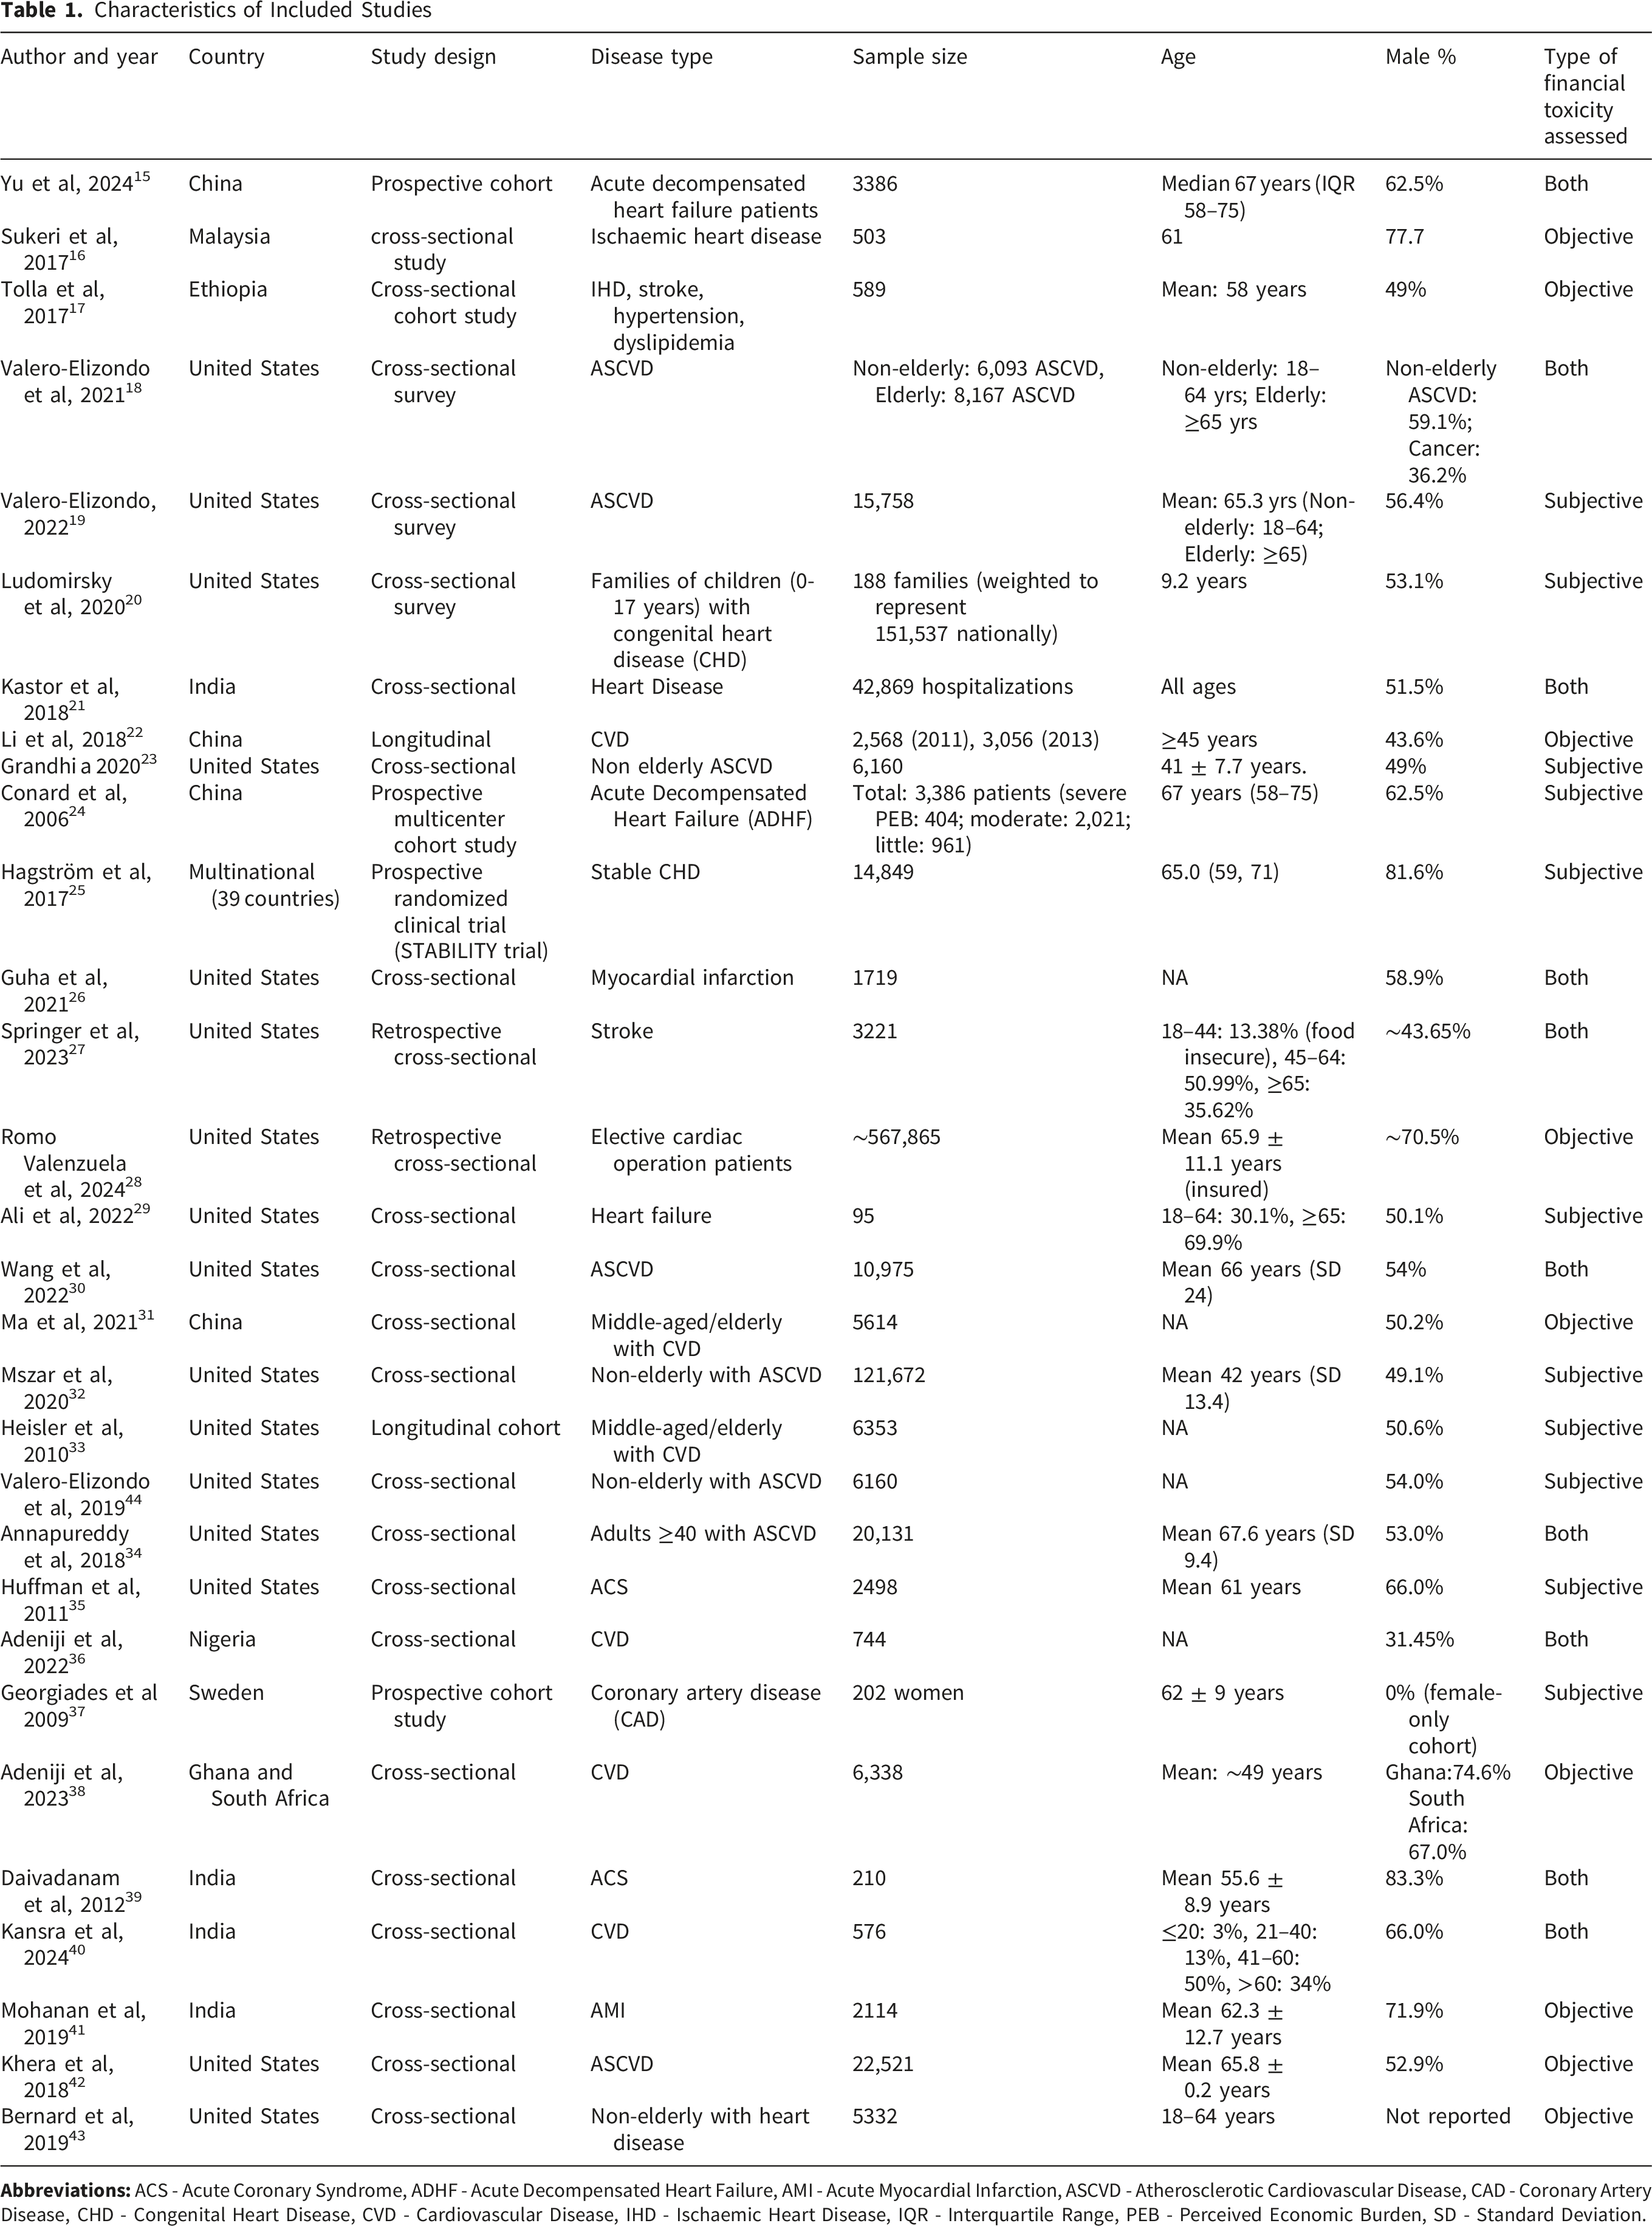
Characteristics of Included Studies
Characteristics of Included Studies
Financial Toxicity
Financial Toxicity in Cardiovascular Diseases
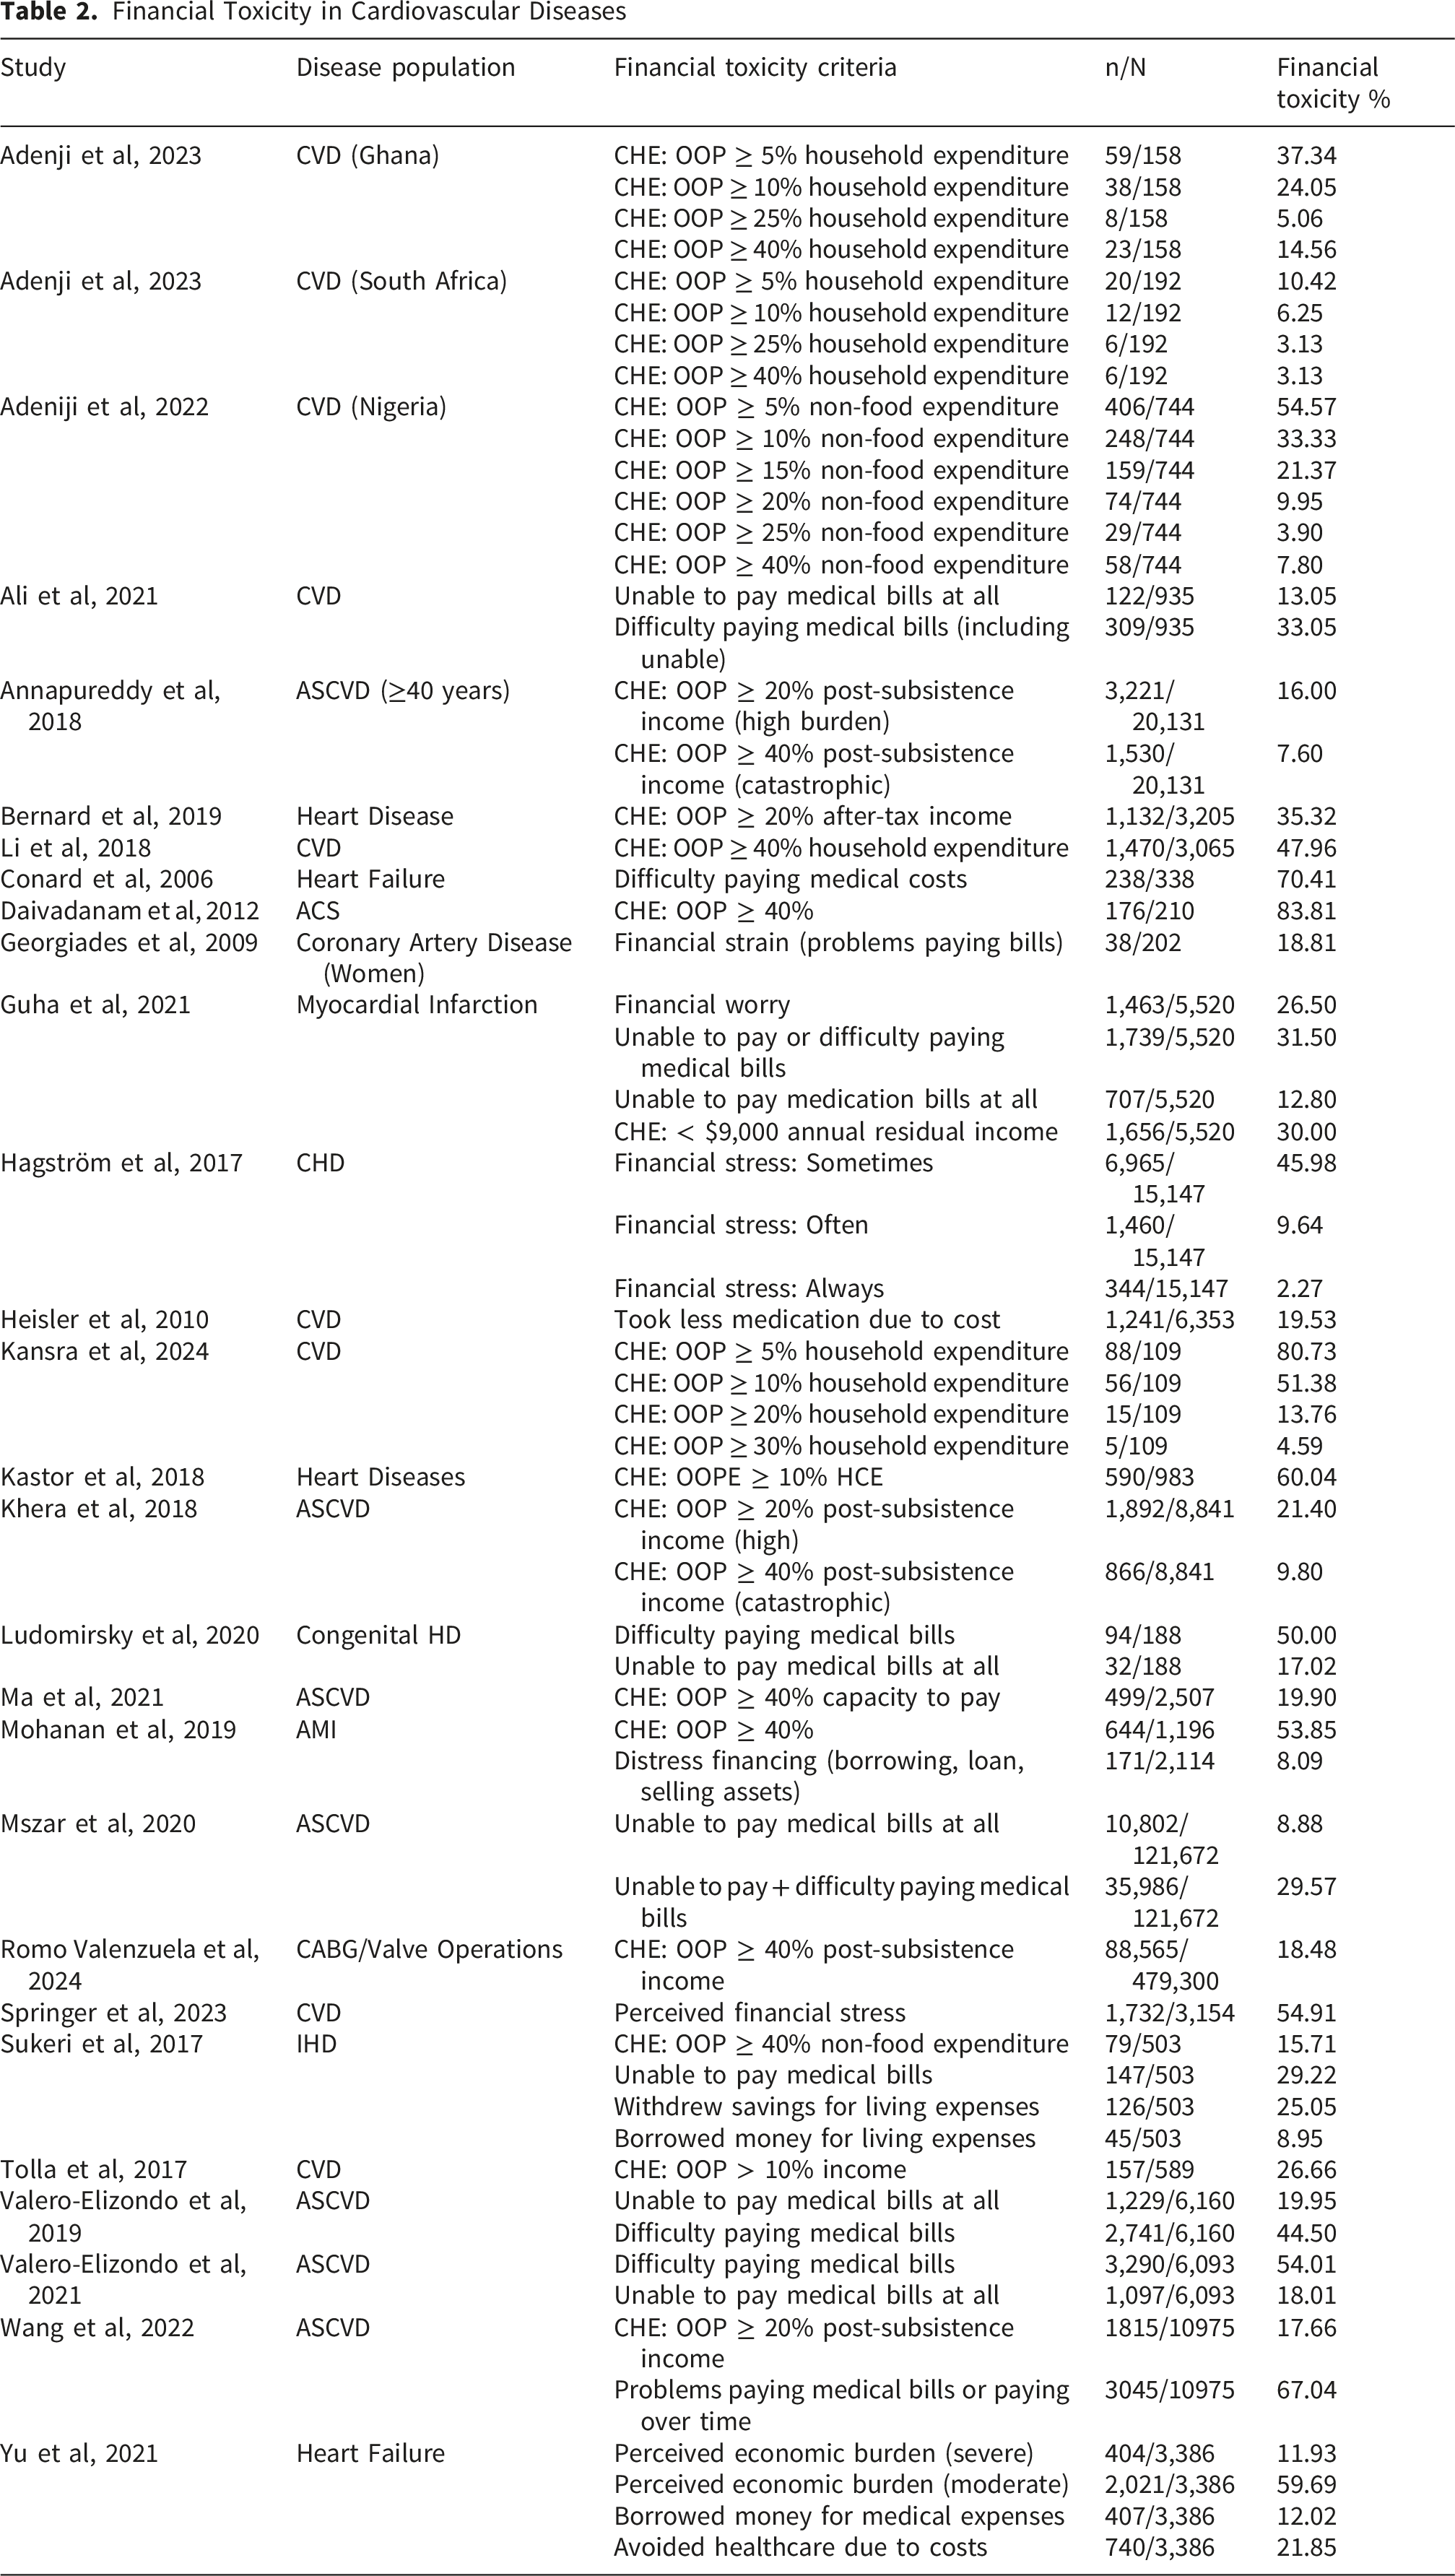
Difficulty or inability to pay medical bills was another prevalent indicator, with rates varying widely. Valero-Elizondo et al (2021) reported 54.01% of non-elderly ASCVD patients in the US experiencing difficulty paying bills, while 18.01% were unable to pay at all. Similarly, Wang et al (2022) found 67.04% of ASCVD patients faced problems paying bills or paid over time. Conard et al (2006) identified 70.41% of heart failure patients in China struggling with medical costs, and Ludomirsky et al (2020) noted 50.00% of families with children having congenital heart disease facing similar challenges. Perceived financial stress was also significant, with Hagström et al (2017) reporting 45.98% of stable CHD patients experiencing stress sometimes, and Springer et al (2023) finding 54.91% of CVD patients perceiving financial stress. Distress financing, such as borrowing or selling assets, was observed in Mohanan et al (2019) with 8.09% of acute myocardial infarction patients in India resorting to such measures, and Yu et al (2021) noting 12.02% of heart failure patients borrowing money for medical expenses.
The prevalence of financial toxicity varied by region, disease type, and assessment method, with higher rates observed in low- and middle-income countries and among patients with acute conditions. These findings highlight the substantial economic burden faced by CVD patients globally, underscoring the need for targeted interventions to alleviate financial toxicity.
Meta-Analysis
Catastrophic Health Expenditure (CHE)
CHE Threshold OOP >40%
CHE defined by out-of-pocket (OOP) expenditures exceeding specific thresholds of household or post-subsistence income was reported in studies for CHE of OOP more than >40%, the meta-analysis of 10 studies, encompassing a combined sample of 1,087,594 participants with 93,685 events. The pooled prevalence of CHE >40% of OOP was estimated at 0.28 [95% CI: 0.12, 0.48], indicating that approximately 28% of CVD patients experienced severe economic burden. Significant heterogeneity was observed (τ2= 0.145, χ2= 45,321.73, df = 9, P < 0.0001, I2= 100%), suggesting considerable variability across studies, likely due to differences in healthcare systems, economic contexts, and patient demographics (Figure 2). Forest plot of pooled prevalence of catastrophic health expenditure (>40% OOP threshold) among patients with cardiovascular diseases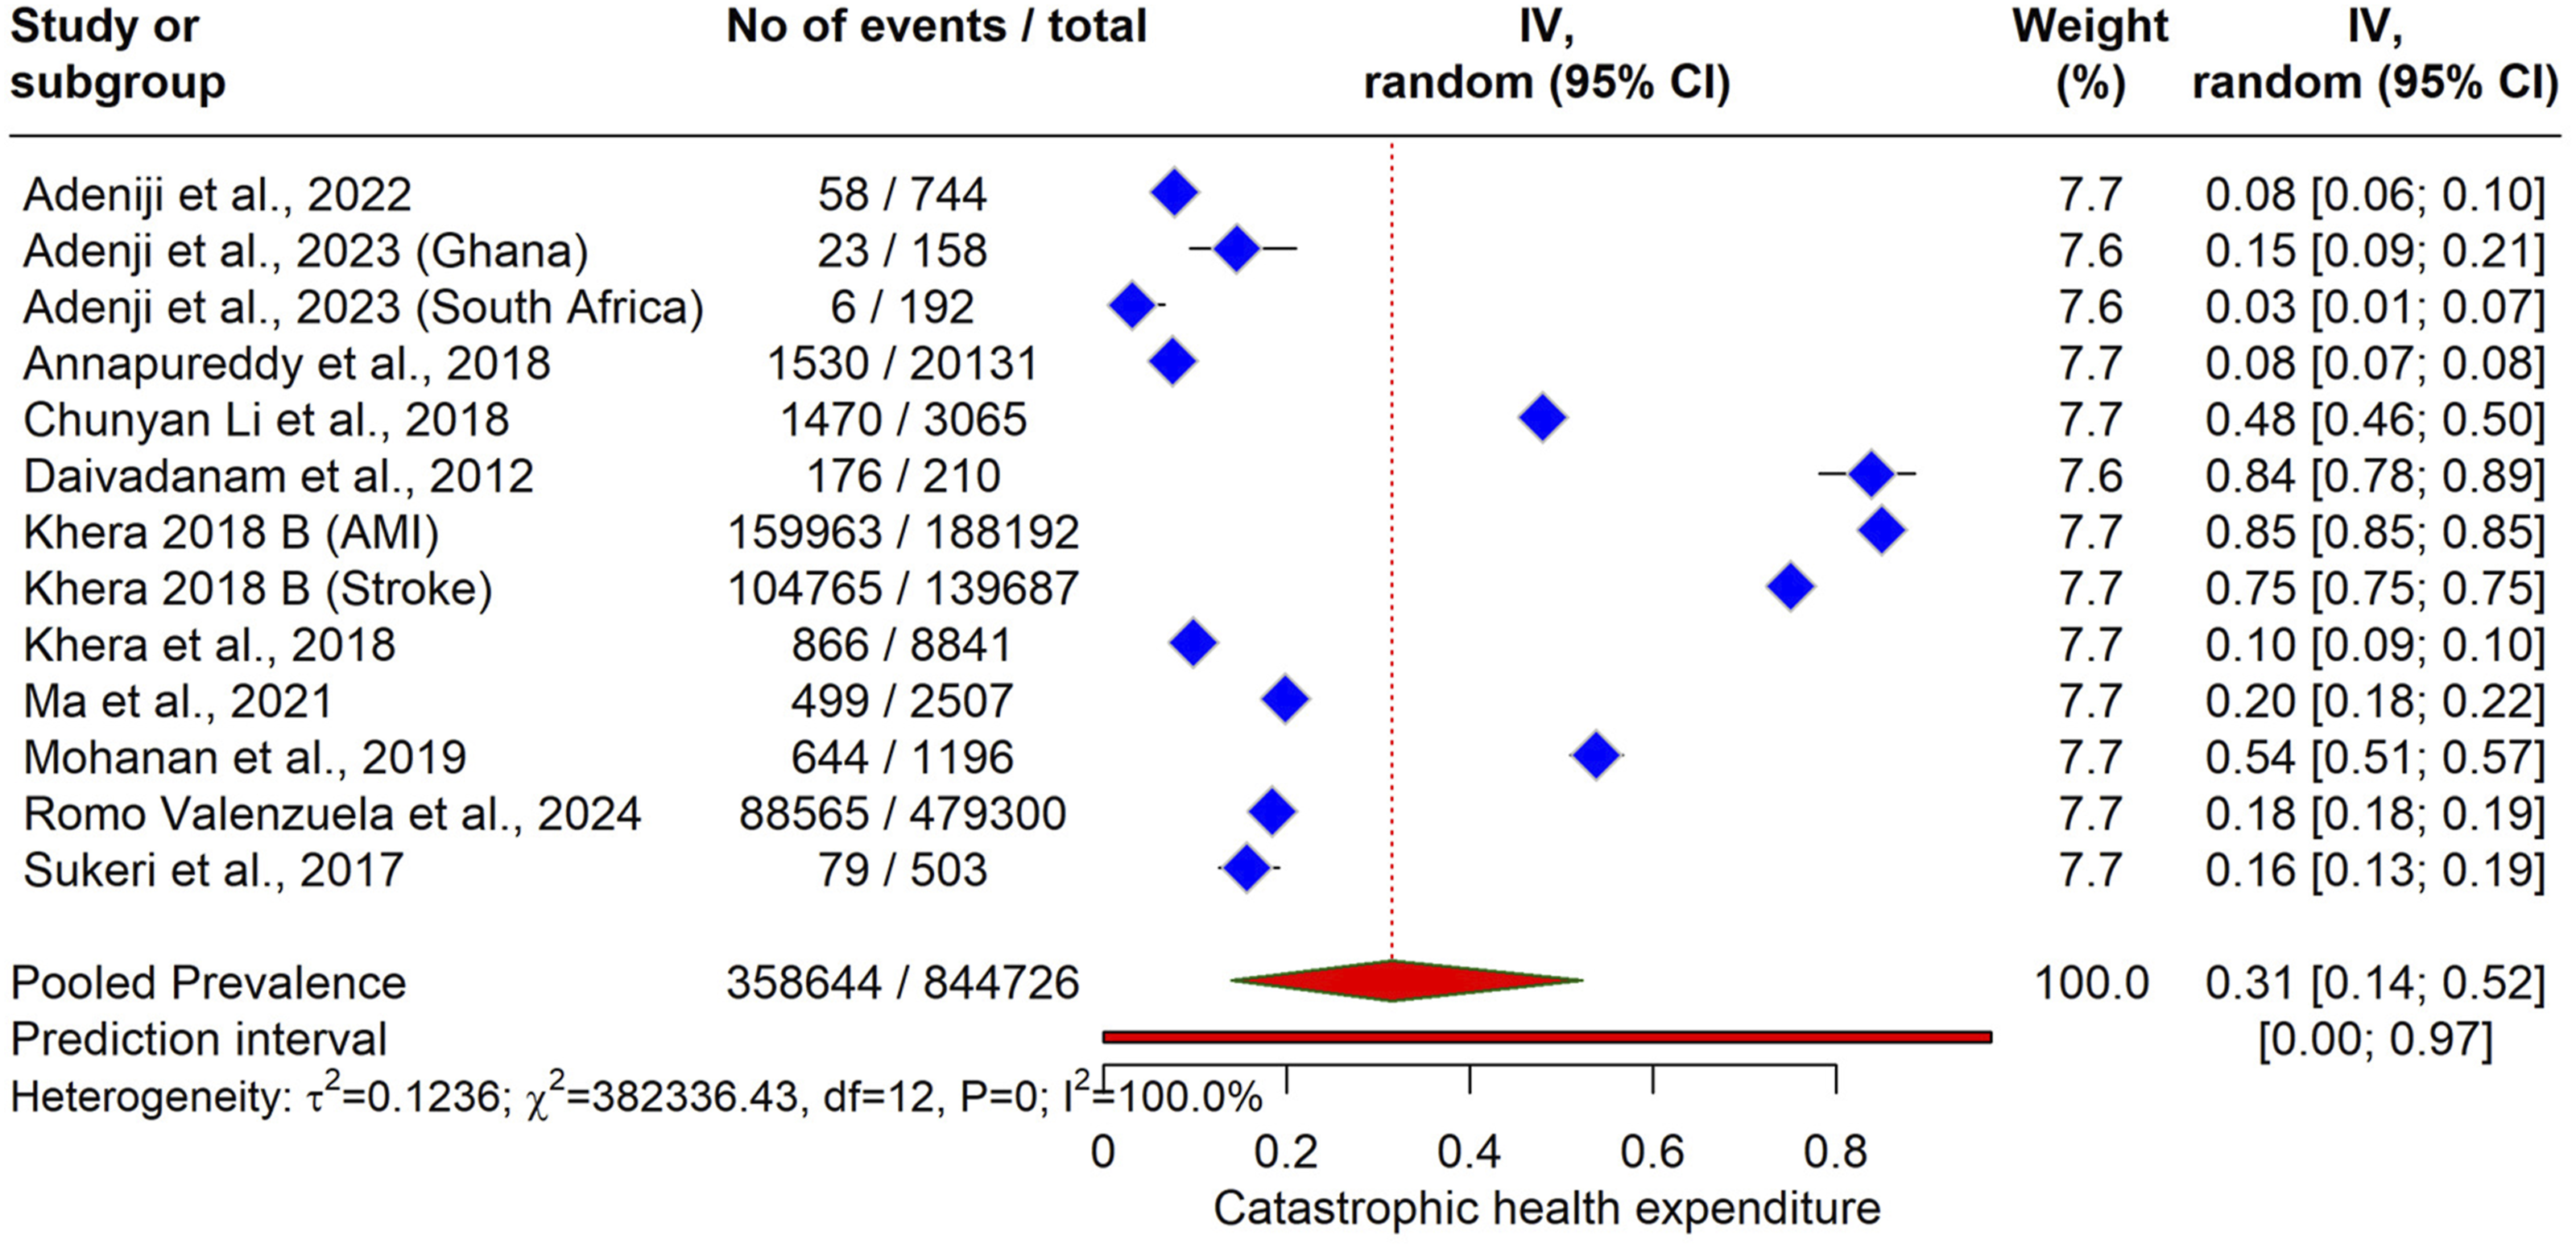
In the Bayesian model meta-analysis, Figure 3 illustrates the posterior probability distributions of the proportion of CHE) among patients with CVDs. The pooled effect, estimated using a Bayesian hierarchical random-effects model with weakly informative priors, yields a prevalence of 0.34 [95% CrI: 0.16, 0.53], represented by a vertical line and density curve at the bottom. Bayesian forest Plot of Pooled Prevalence of Catastrophic Health Expenditure (>40% OOP Threshold) Among Patients with CVD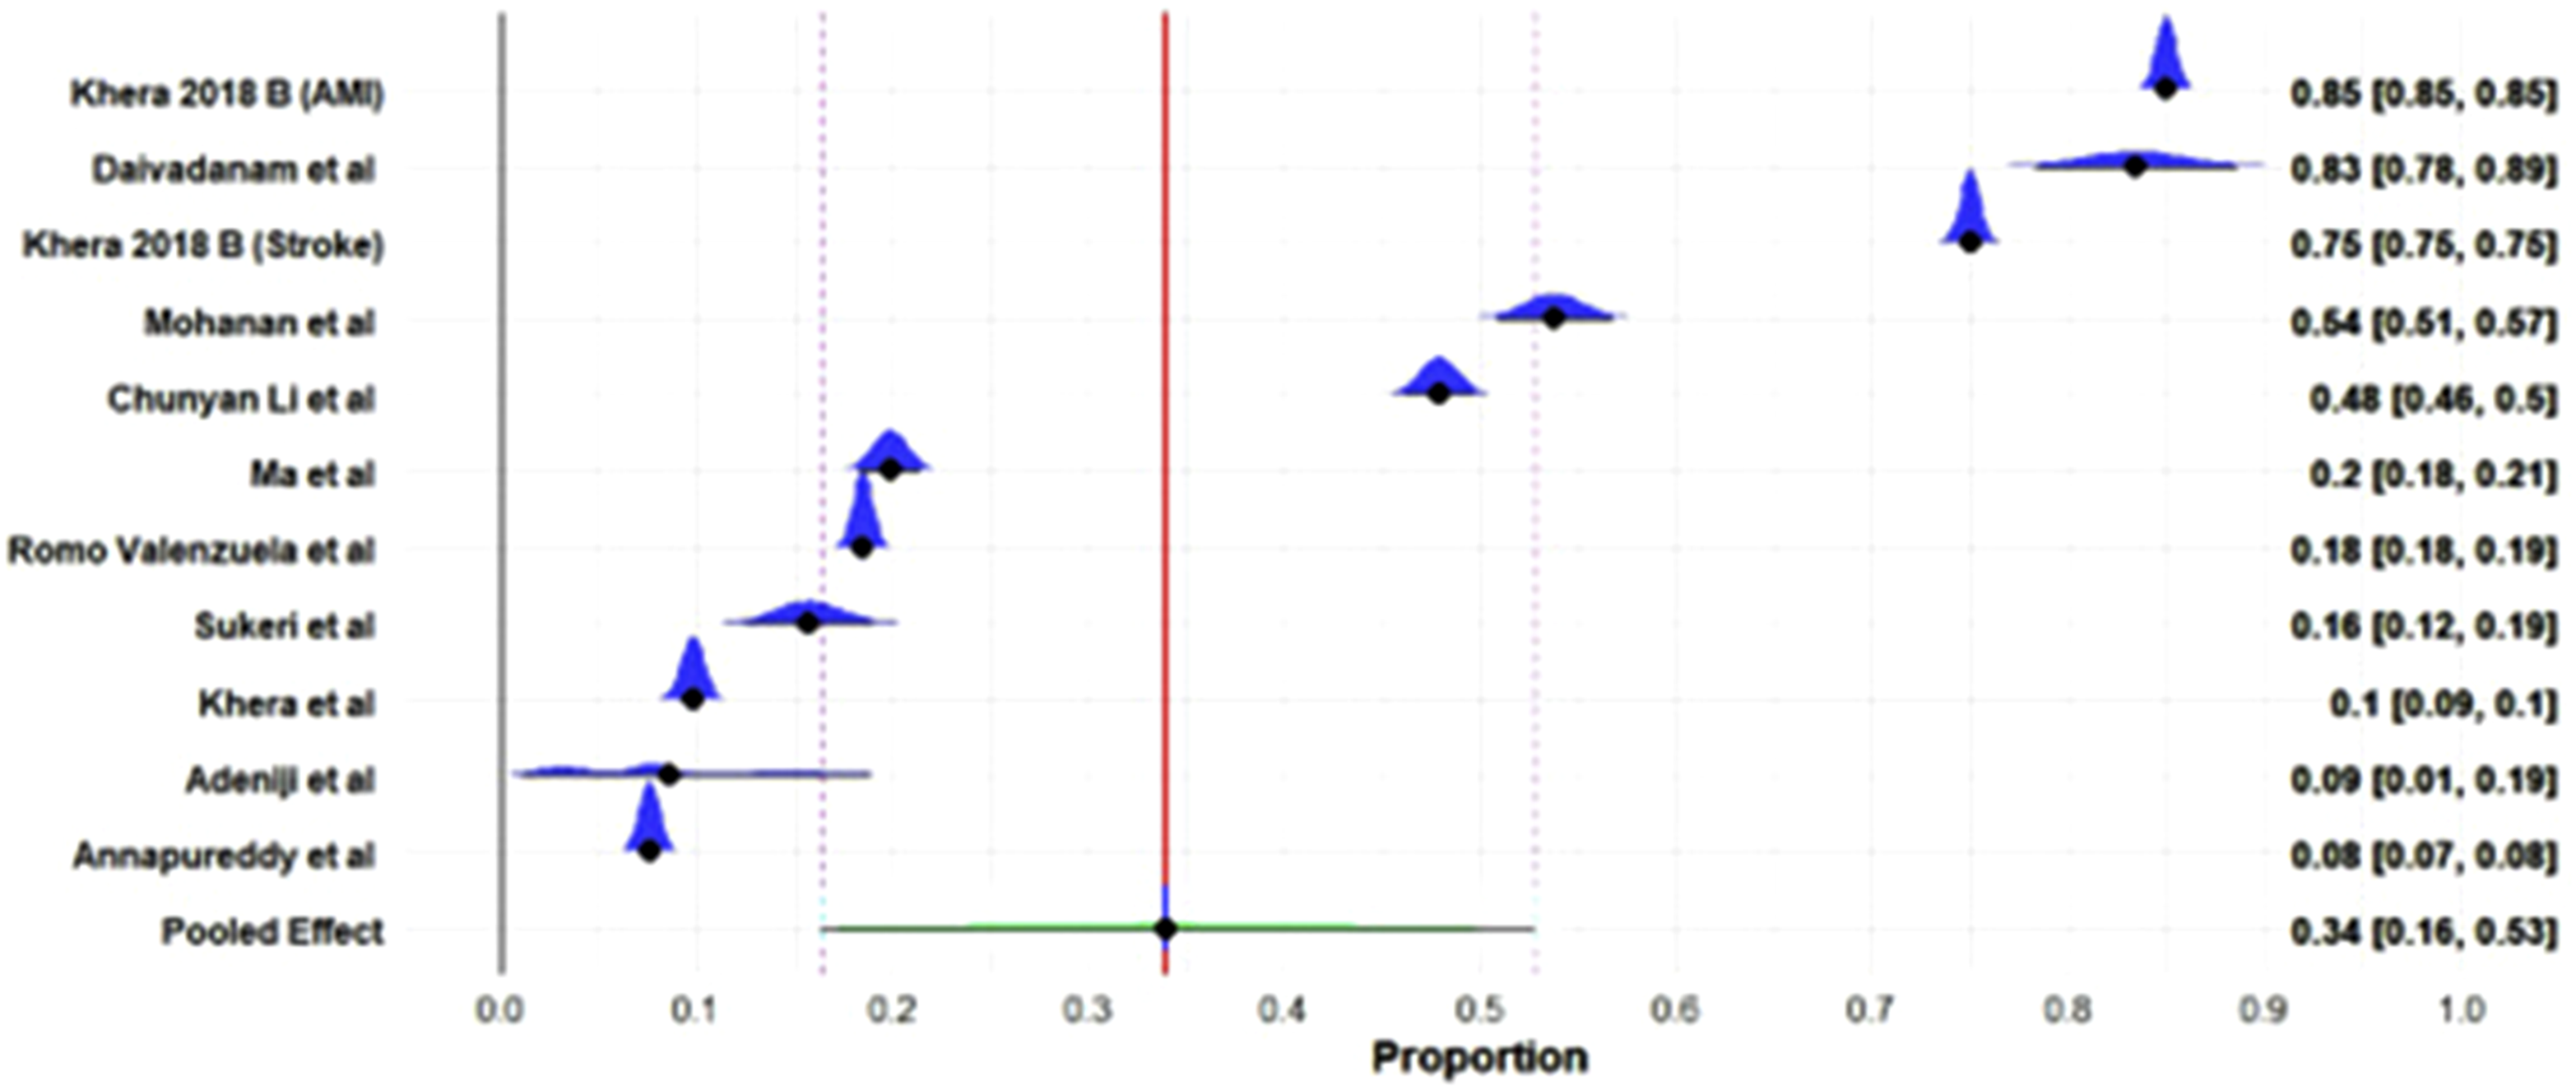
Subgroup Analysis
Subgroup analysis based on type of disease is given in Figure 4. Subgroup analysis of CHE Threshold OOP >40%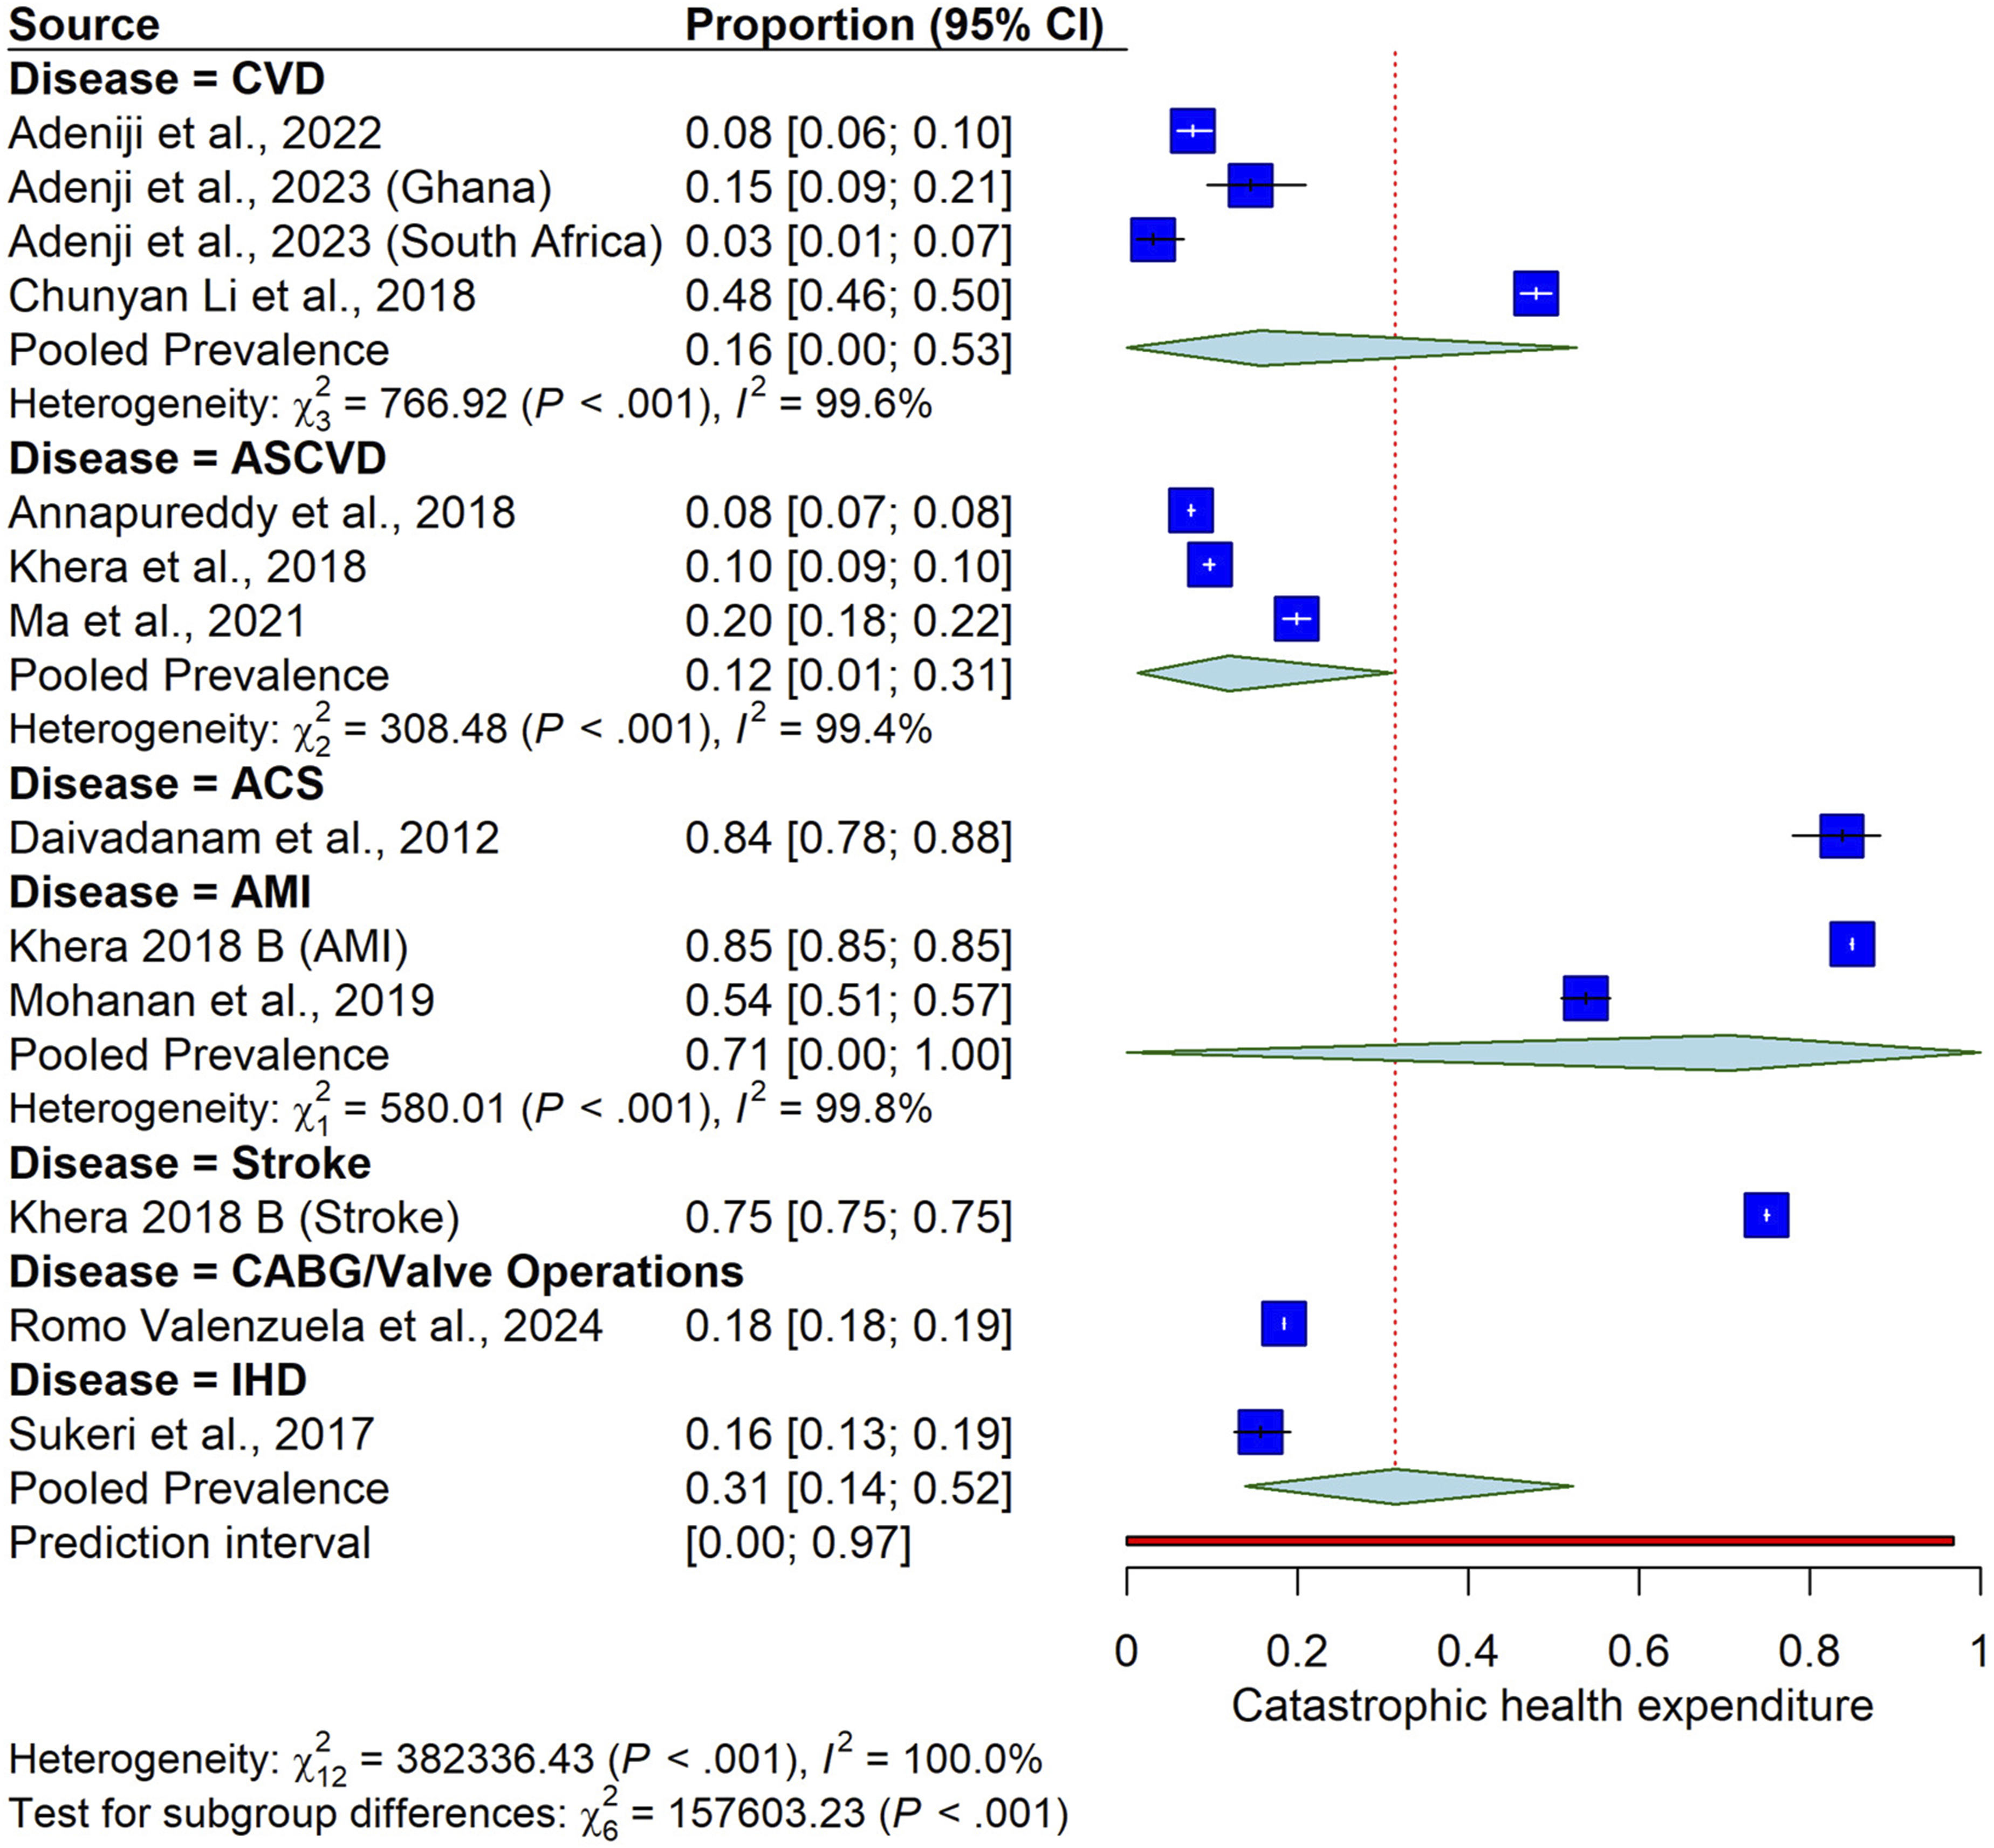
CVD Subgroup
The pooled prevalence of CHE with an OOP >40% threshold, in which studies were only mentioned as CVD, was 16 [0.00, 0.53]. Significant heterogeneity was observed (I2=99.6%), indicating substantial variability across studies.
AMI Subgroup
The pooled prevalence of CHE among patients with acute myocardial infarction (AMI) was 0.71 [0.00, 1.00]. The subgroup exhibited significant heterogeneity (I2= 99.8%), reflecting considerable differences among the studies. This high degree of imprecision reflects the limited number of studies included in these strata and the significant variation in outcomes between the individual studies. While these figures suggest a high potential burden in acute settings, the wide intervals underscore the need for more targeted research to produce stable disease-specific estimates.
Stroke Subgroup
The pooled prevalence of CHE among stroke patients was 0.75 [0.75, 0.75], based solely on Khera et al (2018, Stroke). No heterogeneity was reported due to the inclusion of only one study, limiting the variability assessment.
CABG/Valve Operations Subgroup
The pooled prevalence of CHE among patients undergoing coronary artery bypass graft or valve operations (CABG/Valve) was 0.18 [0.18, 0.19], based on including Romo Valenzuela et al (2024) et al only.
ASCVD
Three studies reported ASCVD showed the pooled prevalence of CHE 0.12 (95% CI:0.12 (95% IC: 0.01 to 0.31).
IHD (Ischemic Heart Disease)
One study mentioned (Sukeri et al, 2017) IHD with CHE of 0.16 (95% CI: 0.13 to 0.19).
CHE Threshold OOP >20%
The meta-analysis results for CHE with a threshold of OOP expenditure >20% revealed a significant economic burden among patients with CVD. A total of six studies, contributed to the analysis, encompassing 7524 events out of 45,618 participants. The pooled prevalence of CHE >20% was estimated at 0.15 [95% CI: 0.06, 0.28] using a random-effects model, indicating that approximately 15% of CVD patients experienced this level of financial toxicity. Significant heterogeneity was observed (τ2= 0.0031, χ2= 293.70, df = 5, P < 0.0001, I2= 98.3%), suggesting considerable variability across the studies, likely due to differences in healthcare systems, economic contexts, and patient populations (Figure 5). Forest plot of meta-analysis of CHE Threshold OOP >20%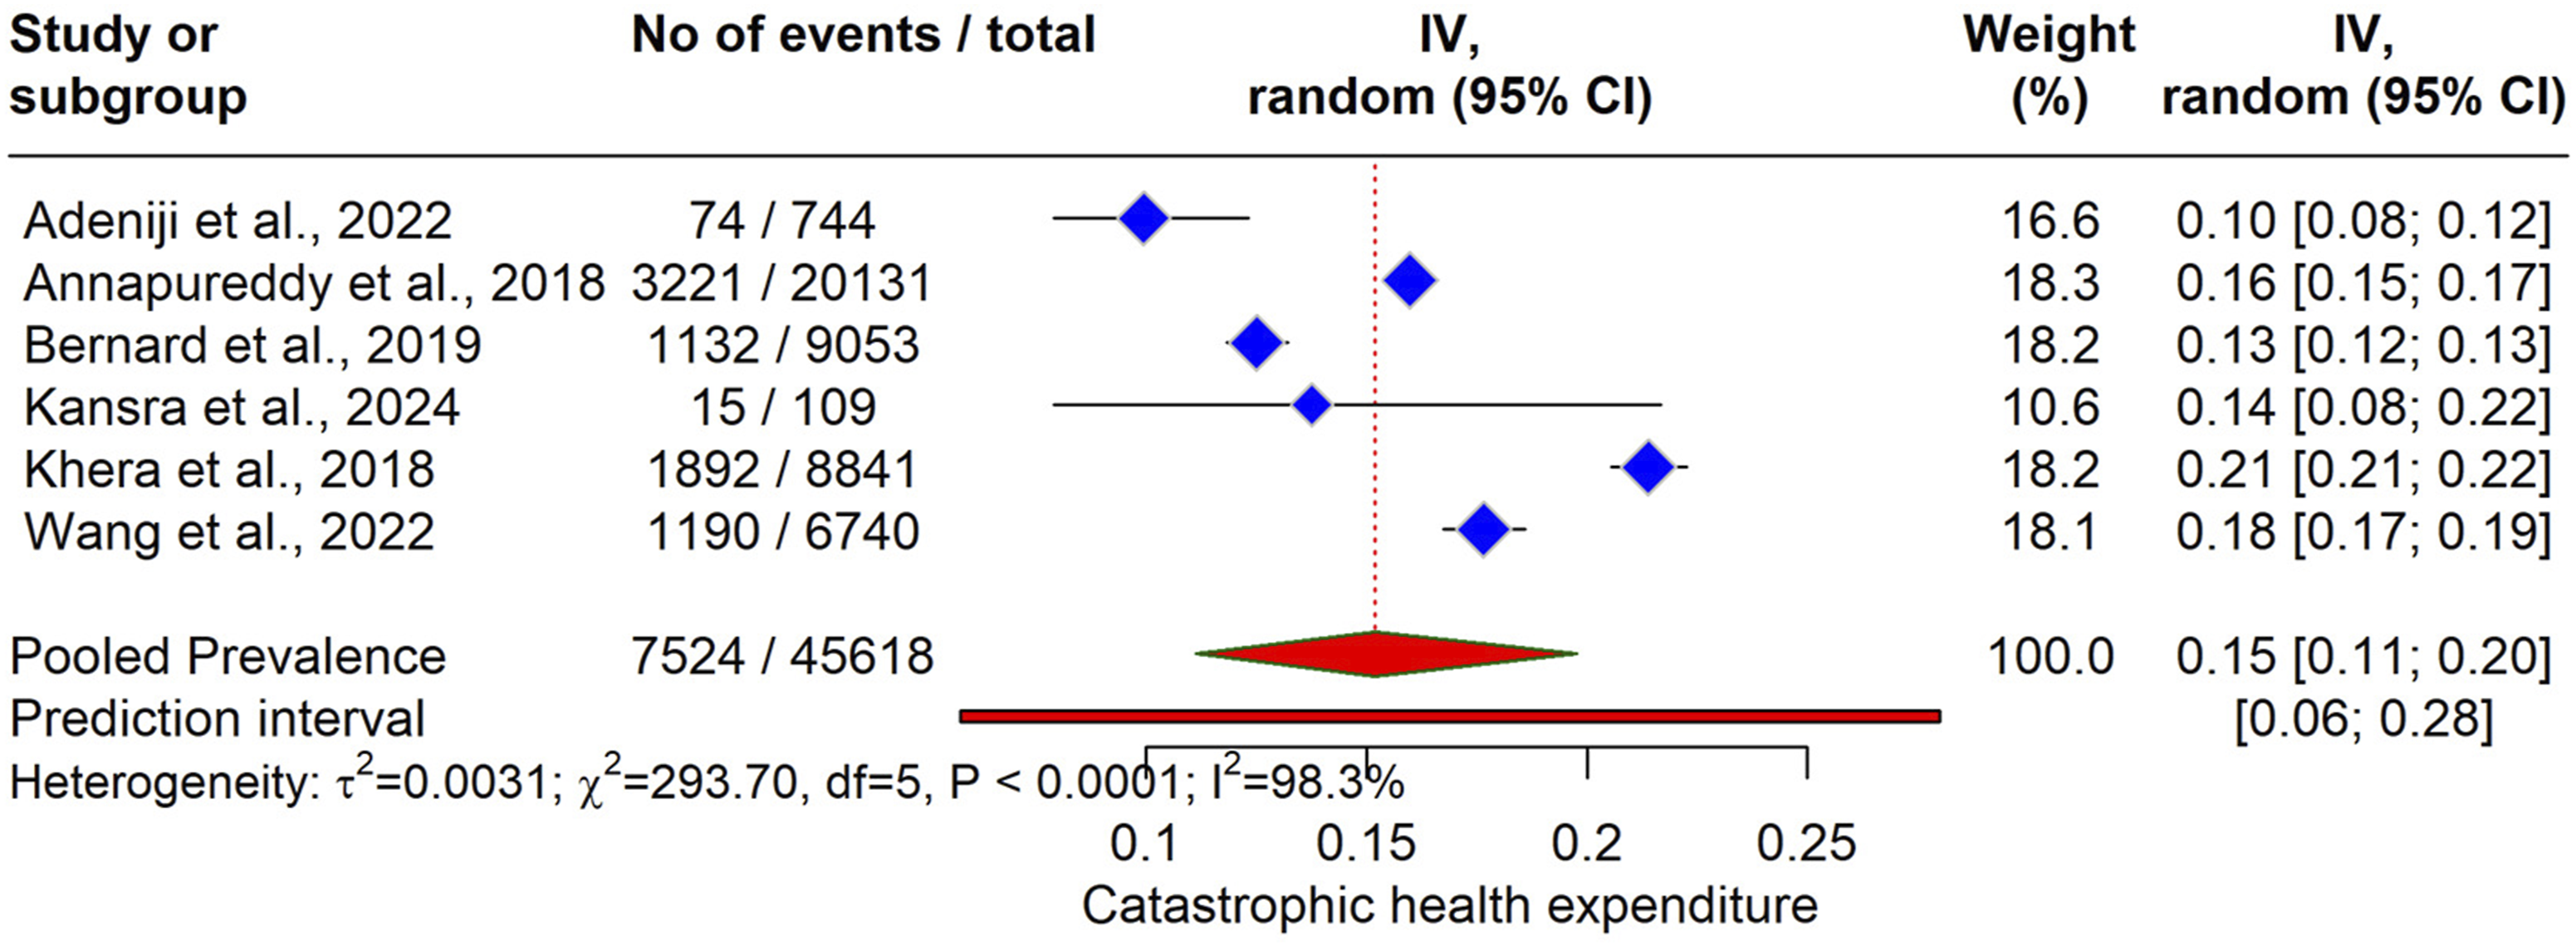
The Bayesian meta-analysis results for CHE with a threshold of OOP expenditure >20% among patients with CVDs are presented in the forest plot (Figure 6). The pooled effect, estimated using a Bayesian hierarchical random-effects model with weakly informative priors, yielded a prevalence of 0.15 [95% CrI: 0.01, 0.21], indicating that approximately 15% of CVD patients faced this level of financial burden. Forest plot of posterior probability distributions from Bayesian meta-analysis of CHE (>20% OOP threshold) among patients with CVD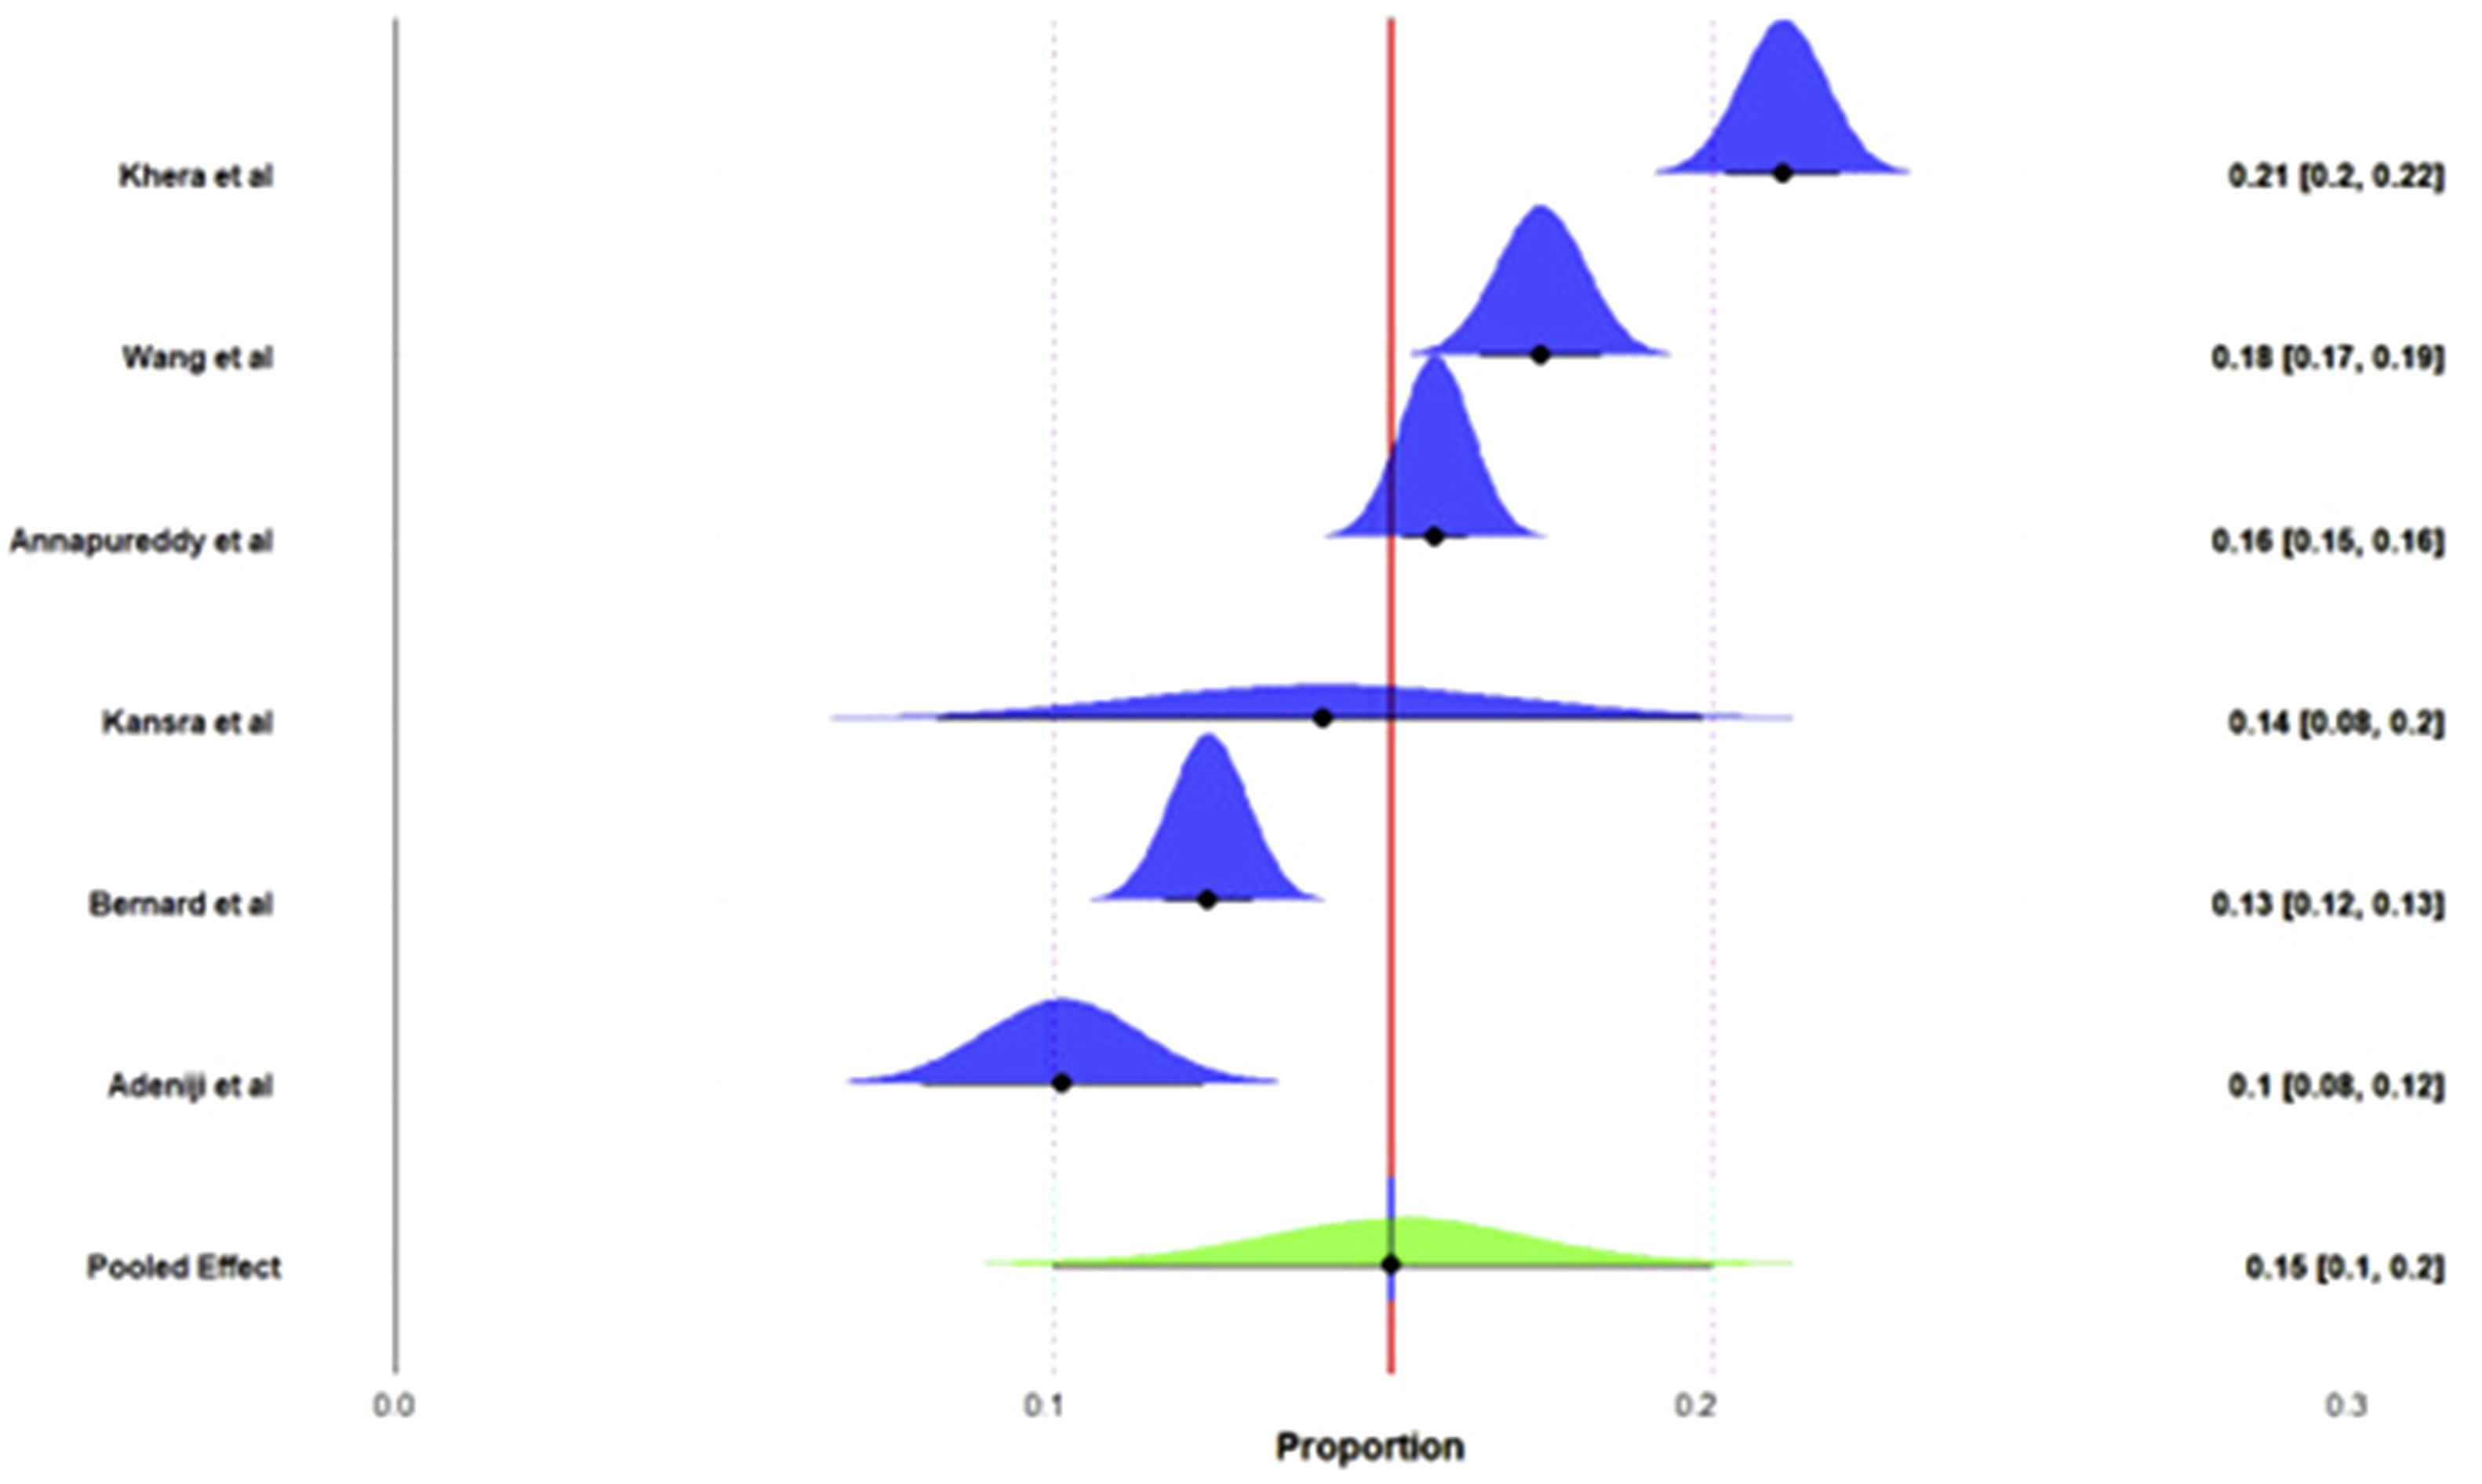
Difficulty Paying Bills
The meta-analysis results for the proportion of patients with CVDs experiencing difficulty paying medical bills are presented in the forest plot (Figure 7). The pooled prevalence of difficulty paying medical bills was estimated at 0.46 (95% CI: 0.34, 0.58) using a random-effects model, indicating that approximately 46% of CVD patients faced this financial challenge. Significant heterogeneity was observed (τ2= 0.024, χ2= 4053.27, df = 8, P < 0.0001, I2= 99.8%), suggesting substantial variability across studies. Forest plot of pooled prevalence of difficulty paying medical bills among patients with cardiovascular diseases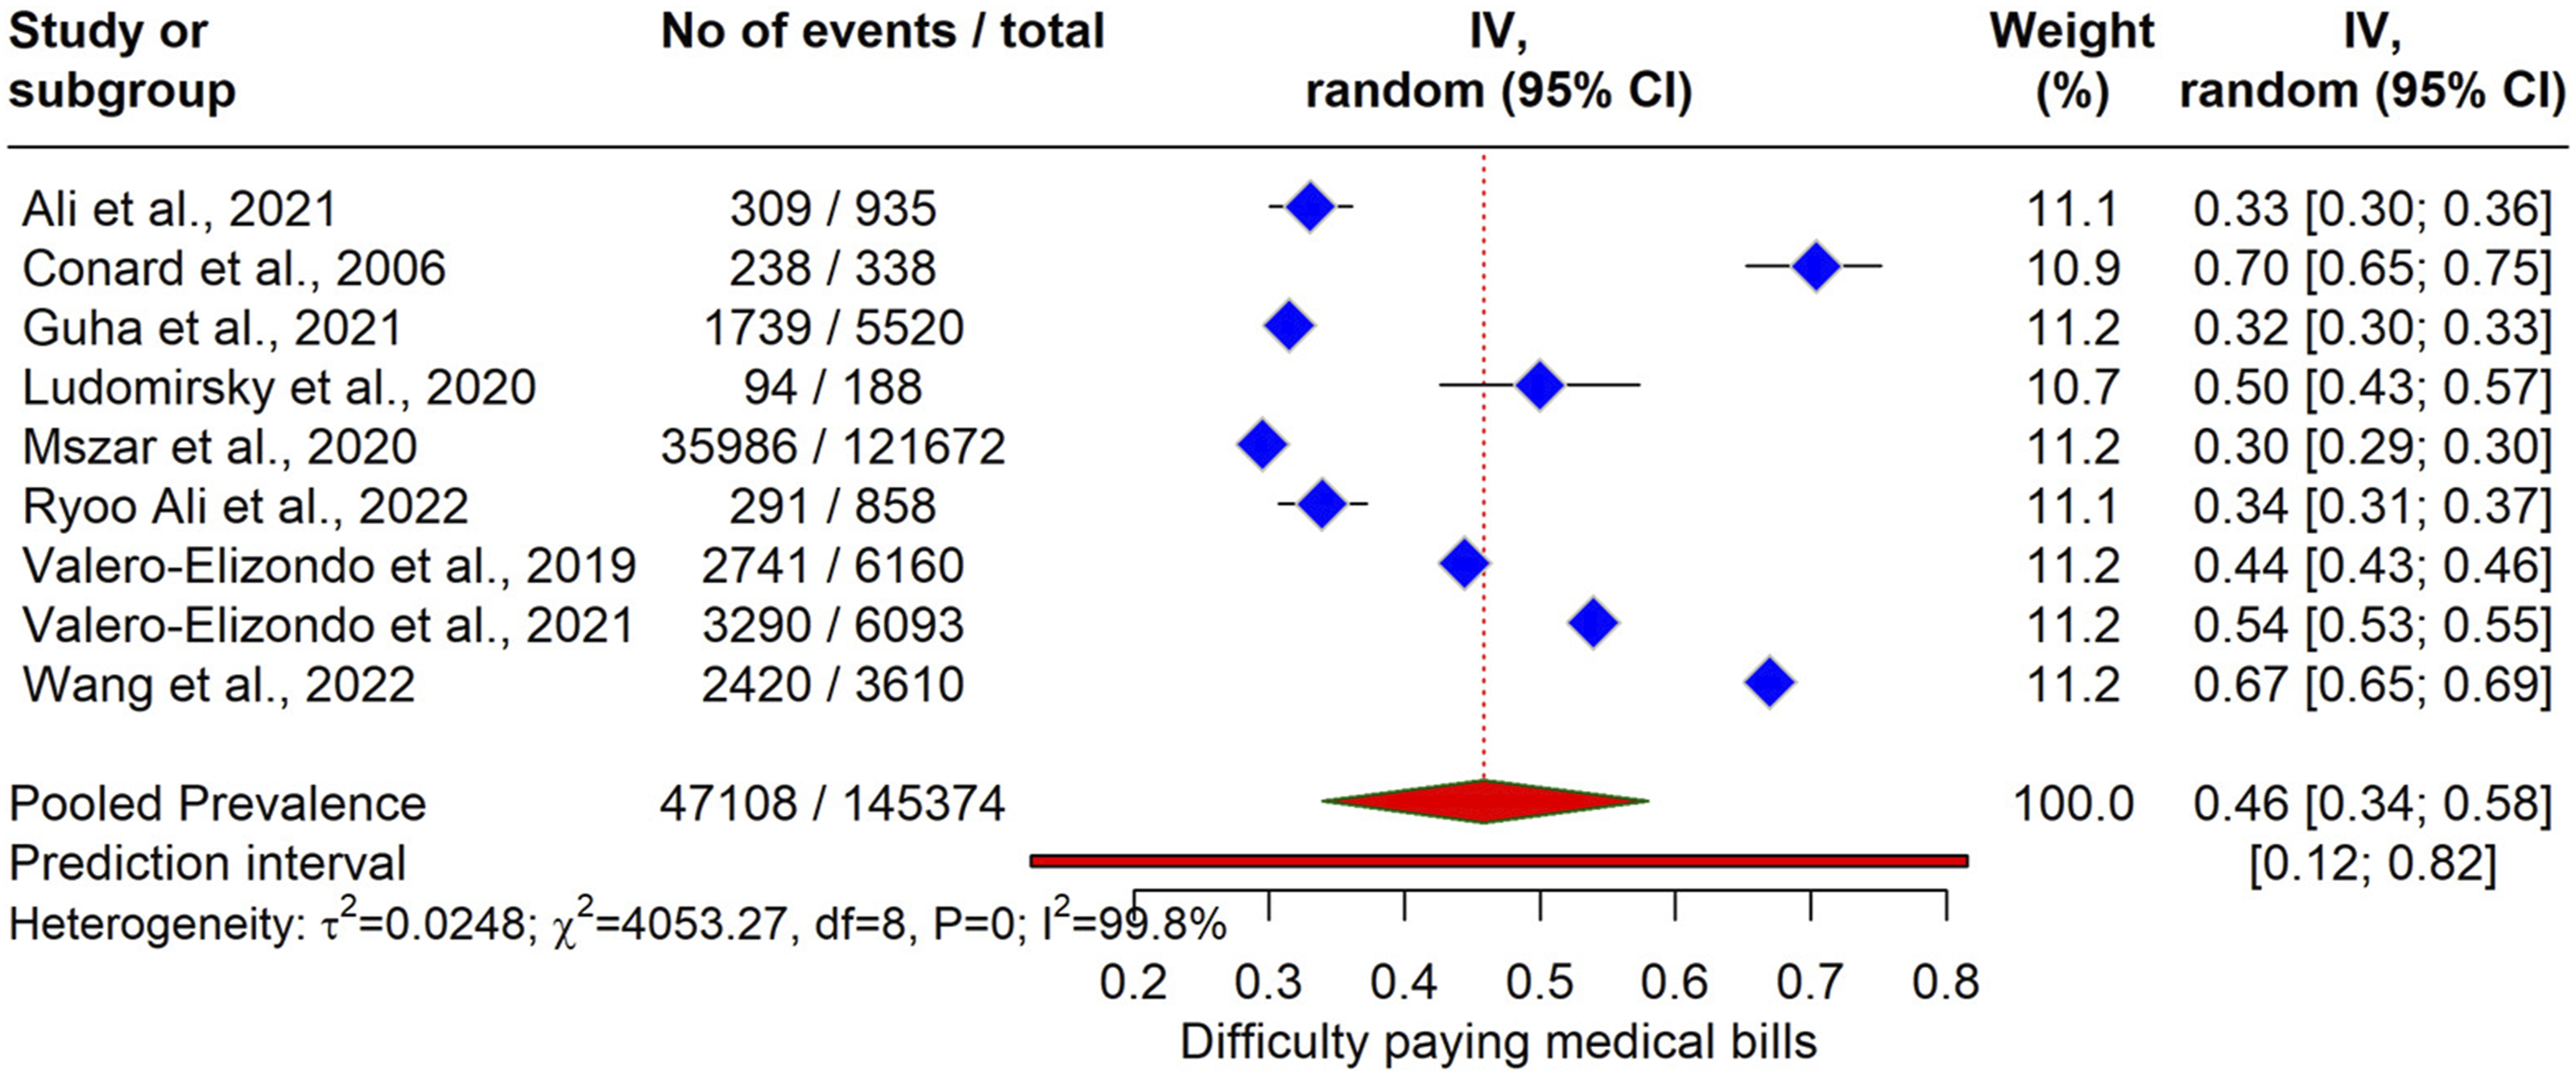
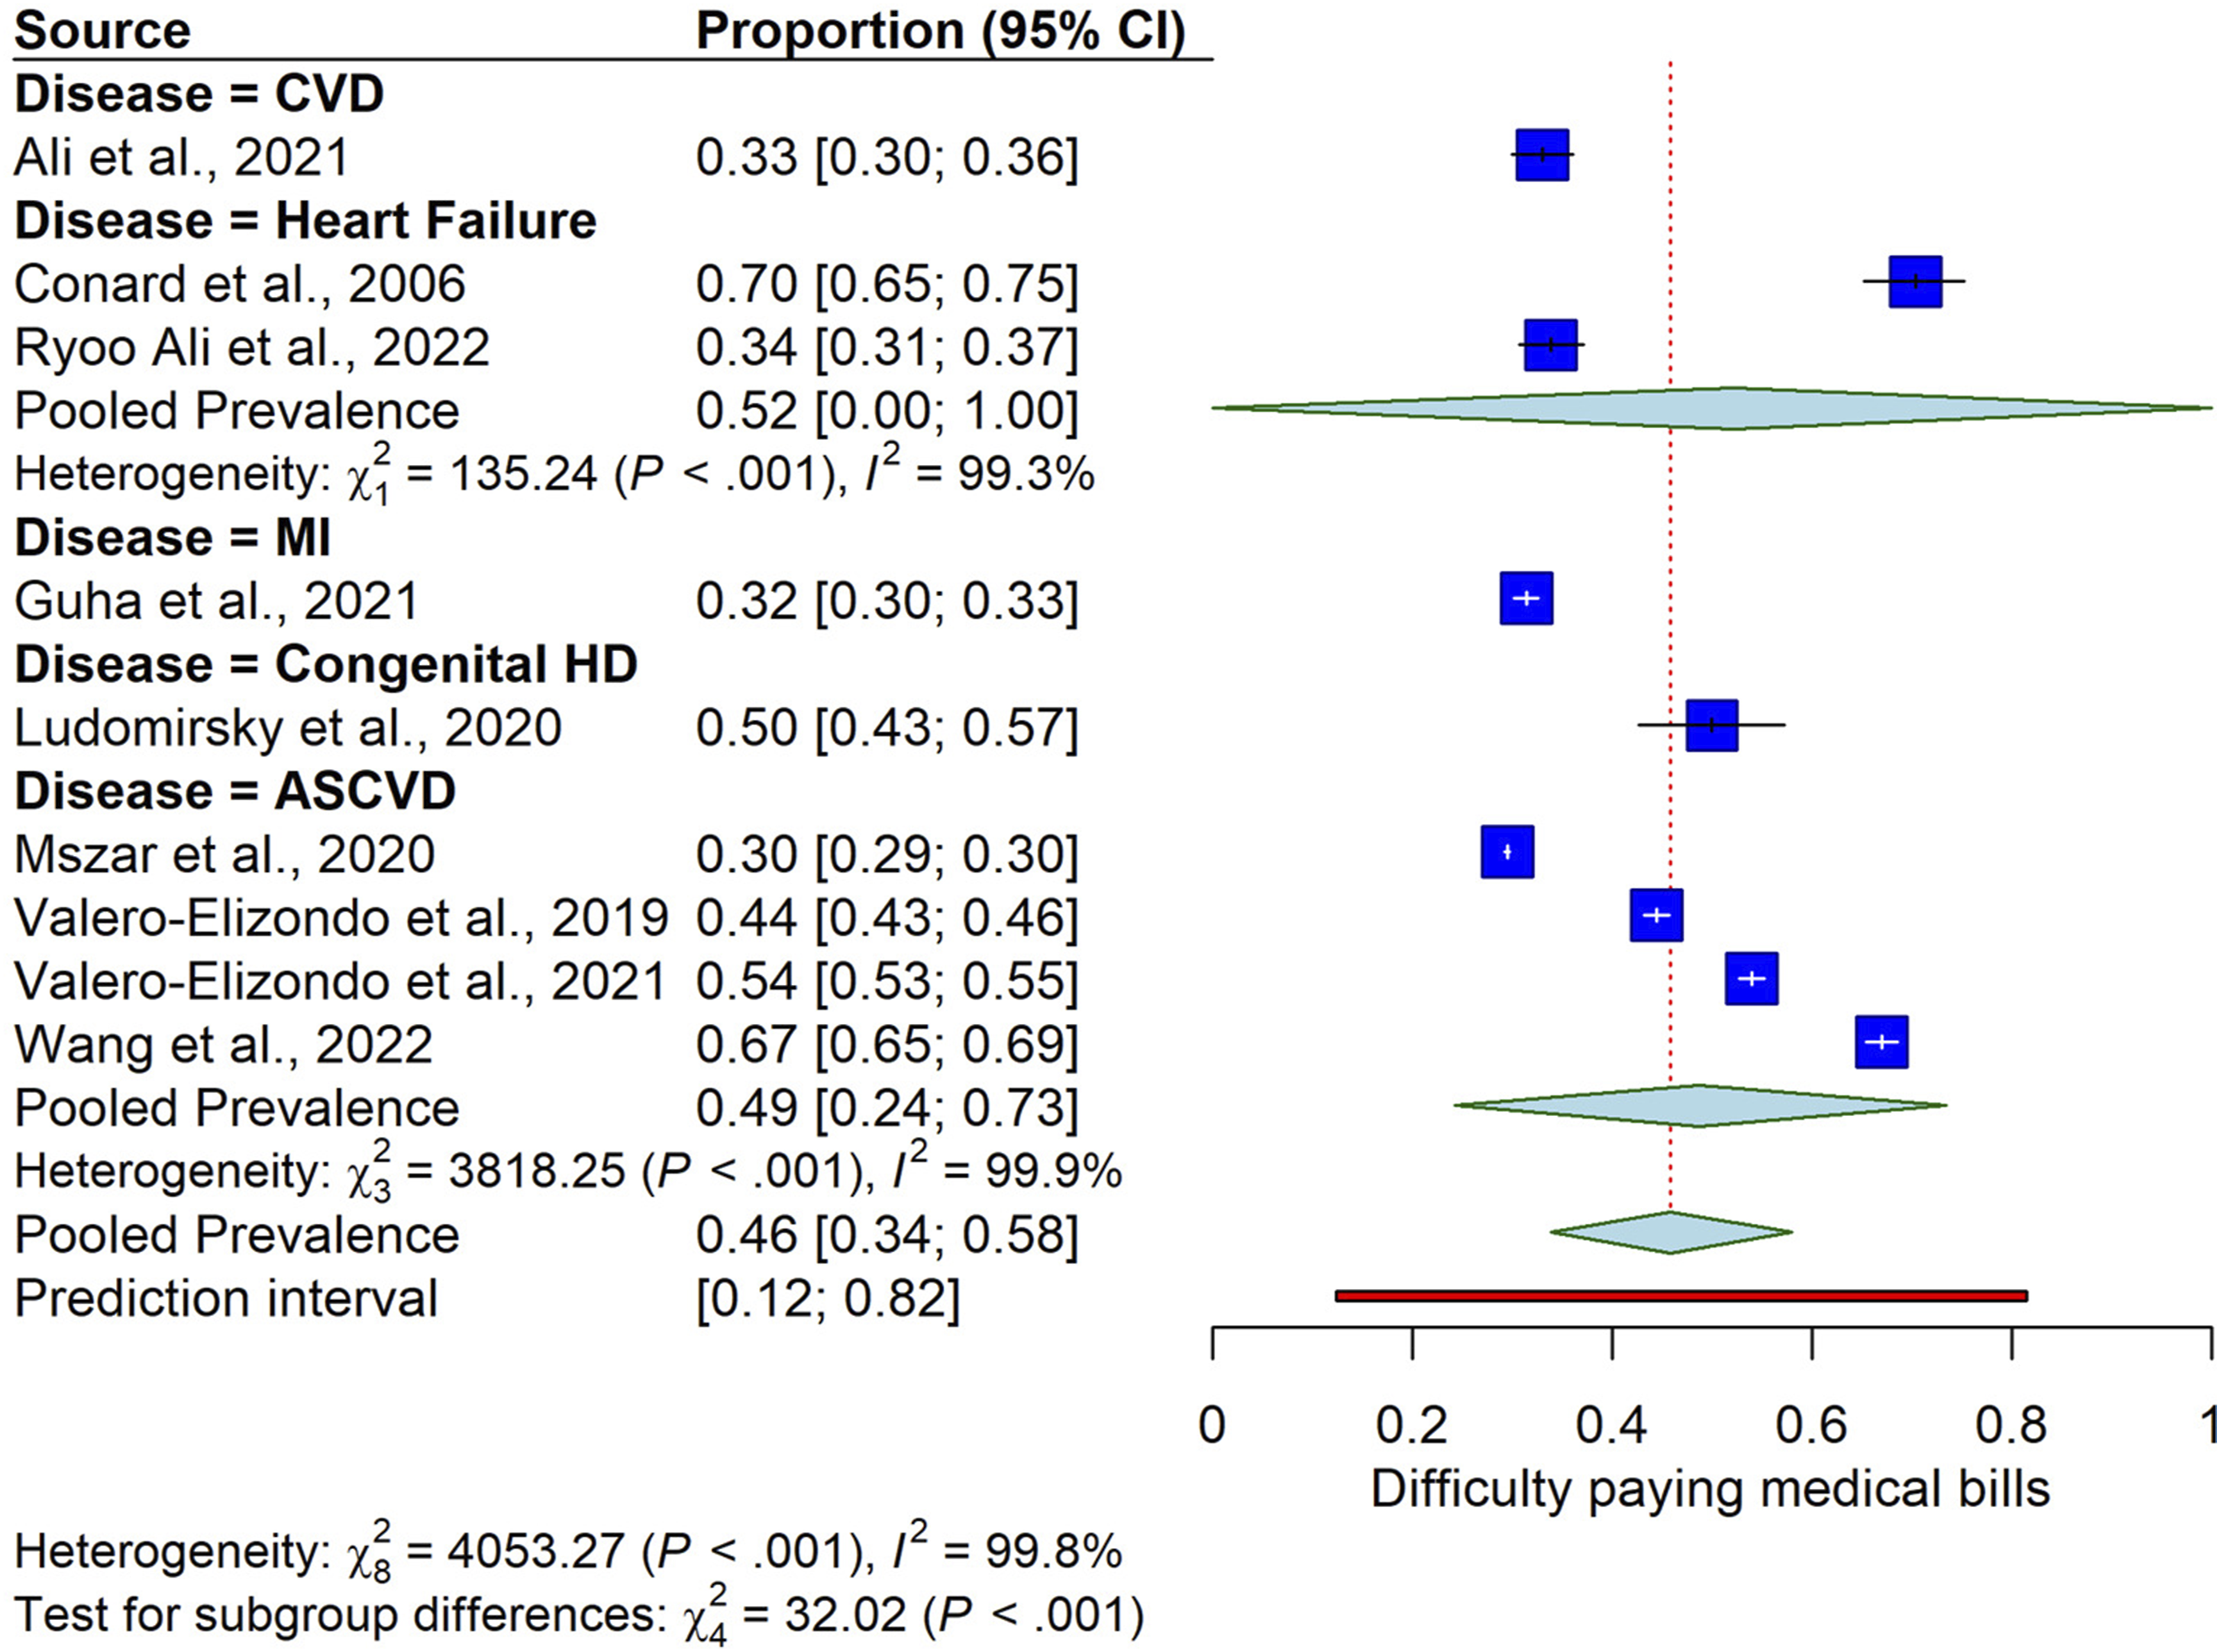
The Bayesian meta-analysis results for the proportion of patients with CVDs experiencing difficulty paying medical bills are depicted in the forest plot. The pooled effect, estimated using a Bayesian hierarchical random-effects model with weakly informative priors, yielded a prevalence of 0.46 [95% CrI: 0.31, 0.59] (Figure 8), indicating that approximately 46% of CVD patients faced this financial challenge. The subgroup analysis difficulty paying bill is given in Figure 9. Forest plot of posterior probability distributions from Bayesian meta-analysis of difficulty paying medical bills among patients with CVD Forest plot of subgroup analysis of pooled prevalence of difficulty paying medical bills by disease type among patients with CVD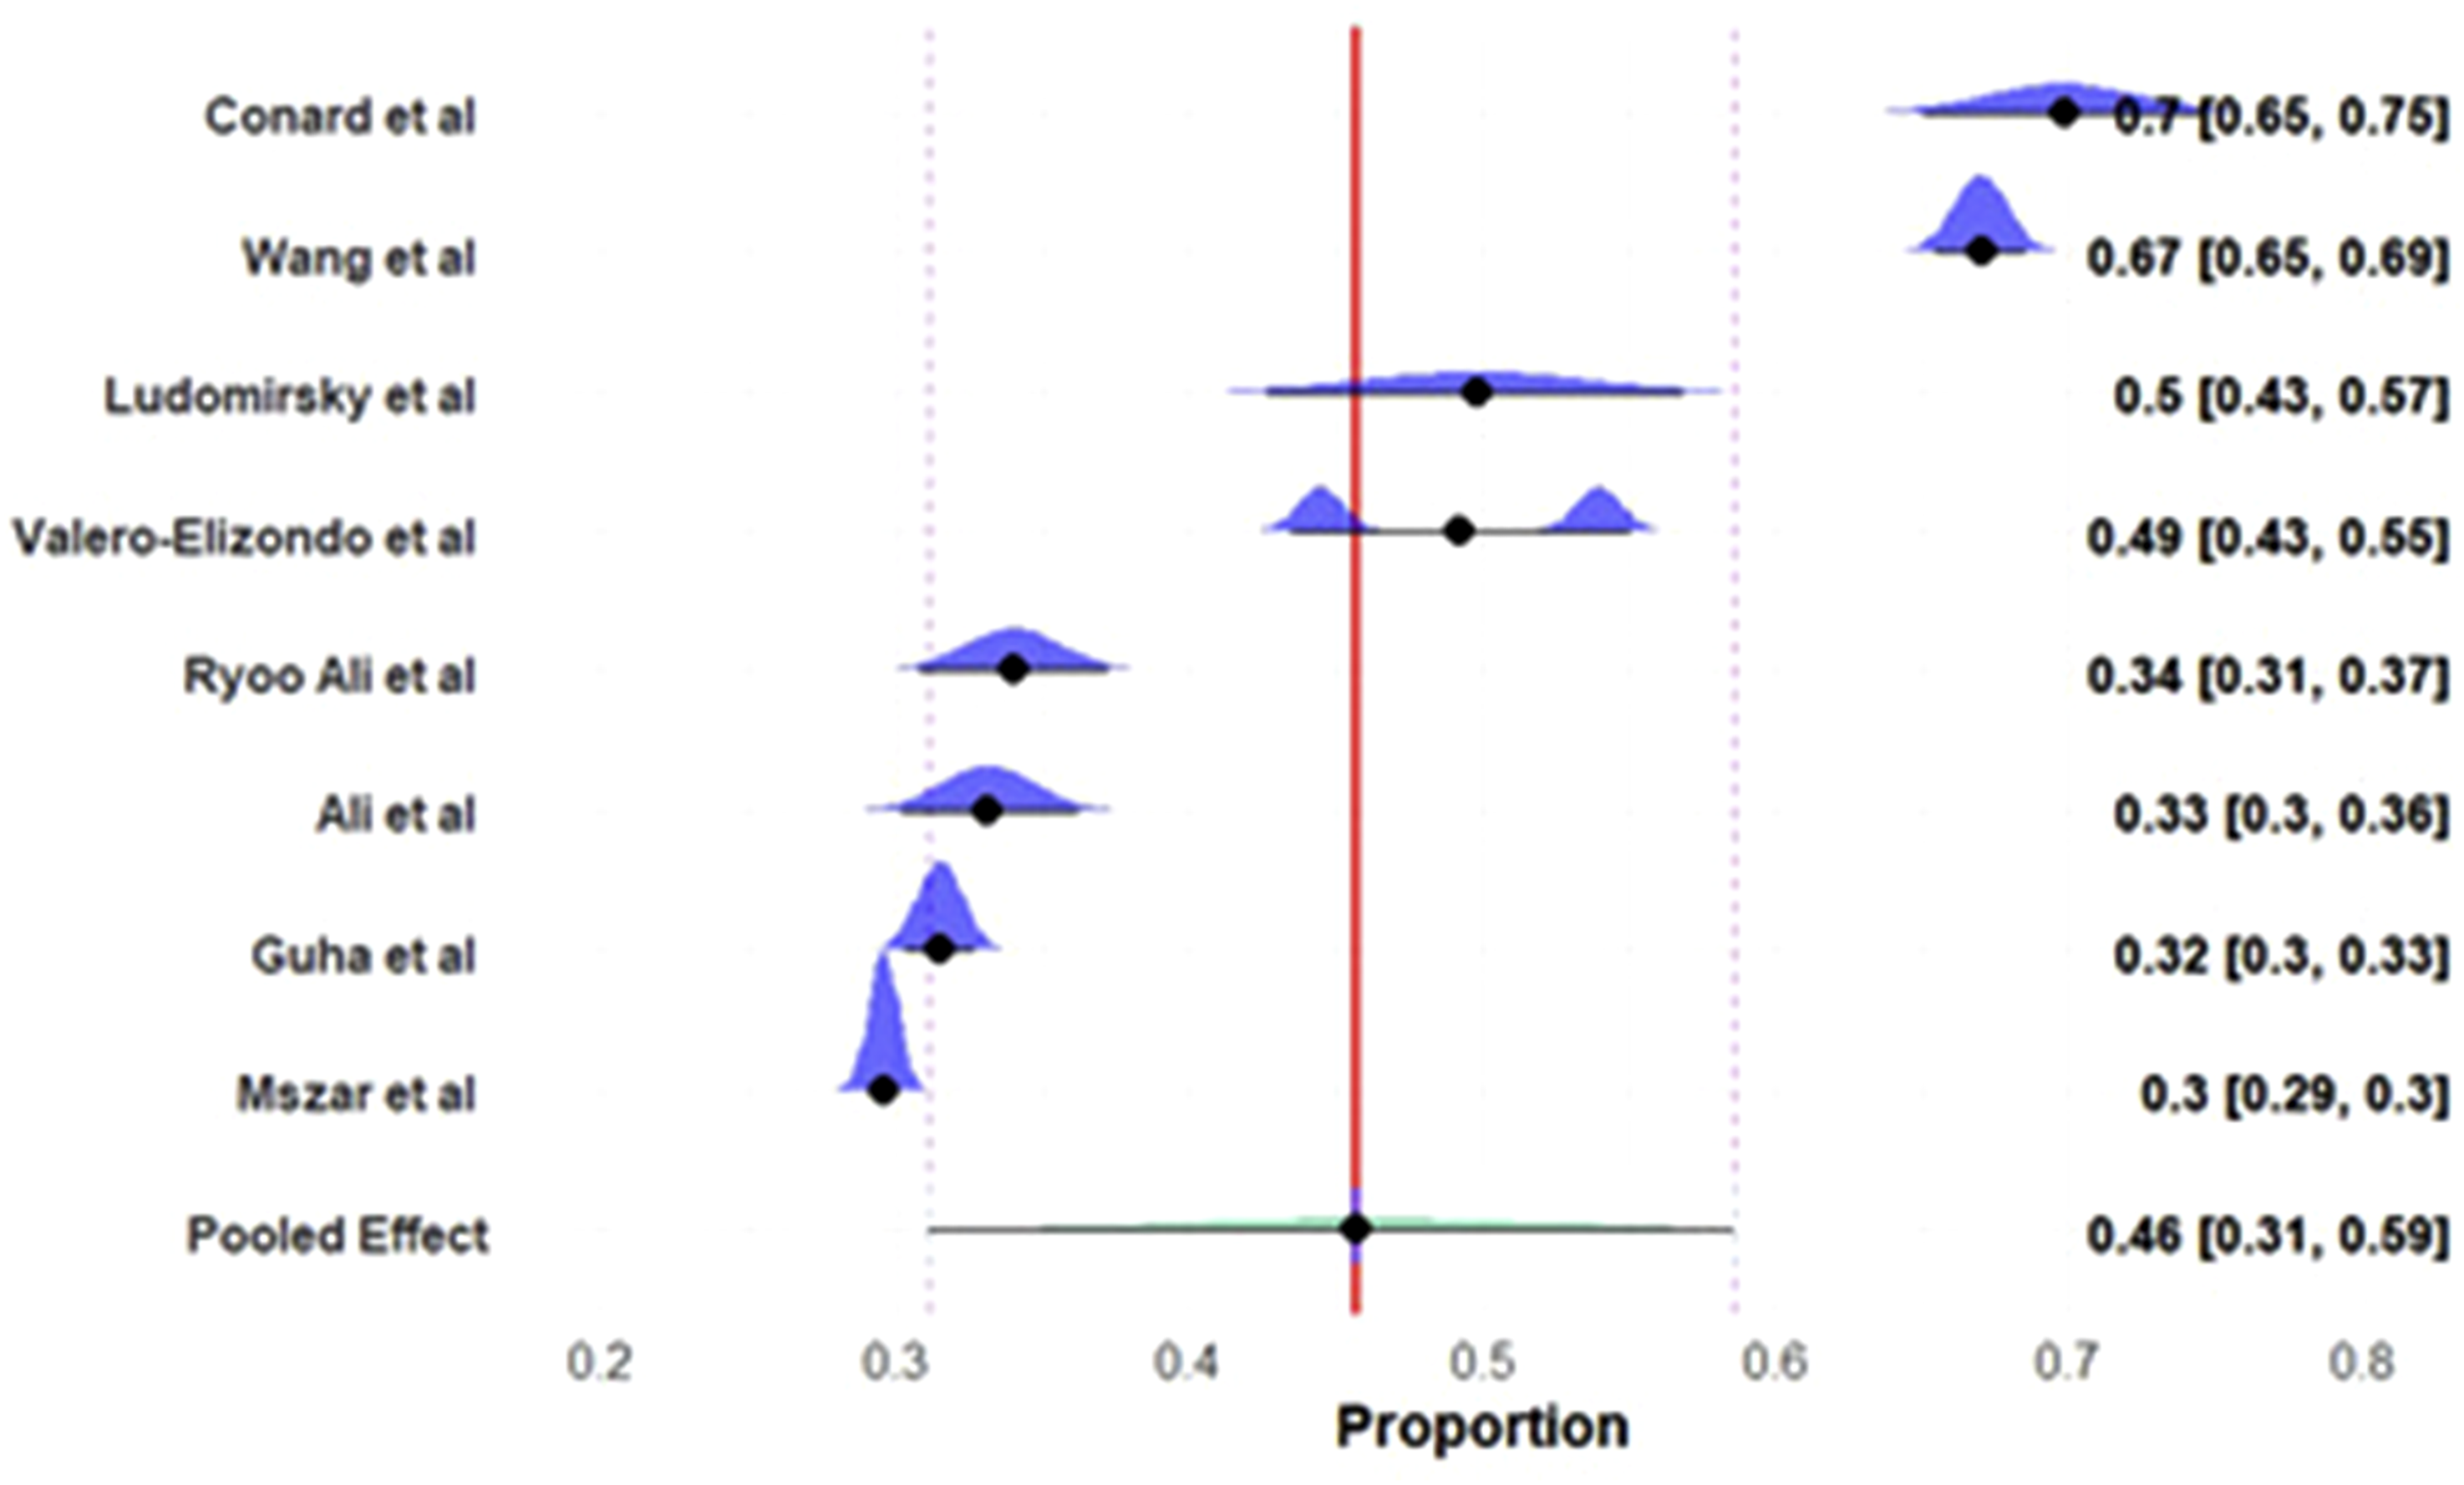
Unable to Pay Bills
The meta-analysis results for the proportion of patients with CVDs unable to pay medical bills are presented in the forest plot. A total of eight studies encompassing 14,264 events out of 14,1929 participants. The pooled prevalence of being unable to pay medical bills was estimated at 0.16 [95% CI: 0.12, 0.21] using a random-effects model (Figure 10), indicating that approximately 16% of CVD patients faced this financial barrier. Significant heterogeneity was observed (τ2= 0.0061, χ2= 1206.58, df = 7, P < 0.0001, I2= 99.4%). Forest plot of pooled prevalence of being unable to pay medical bills among patients with CVD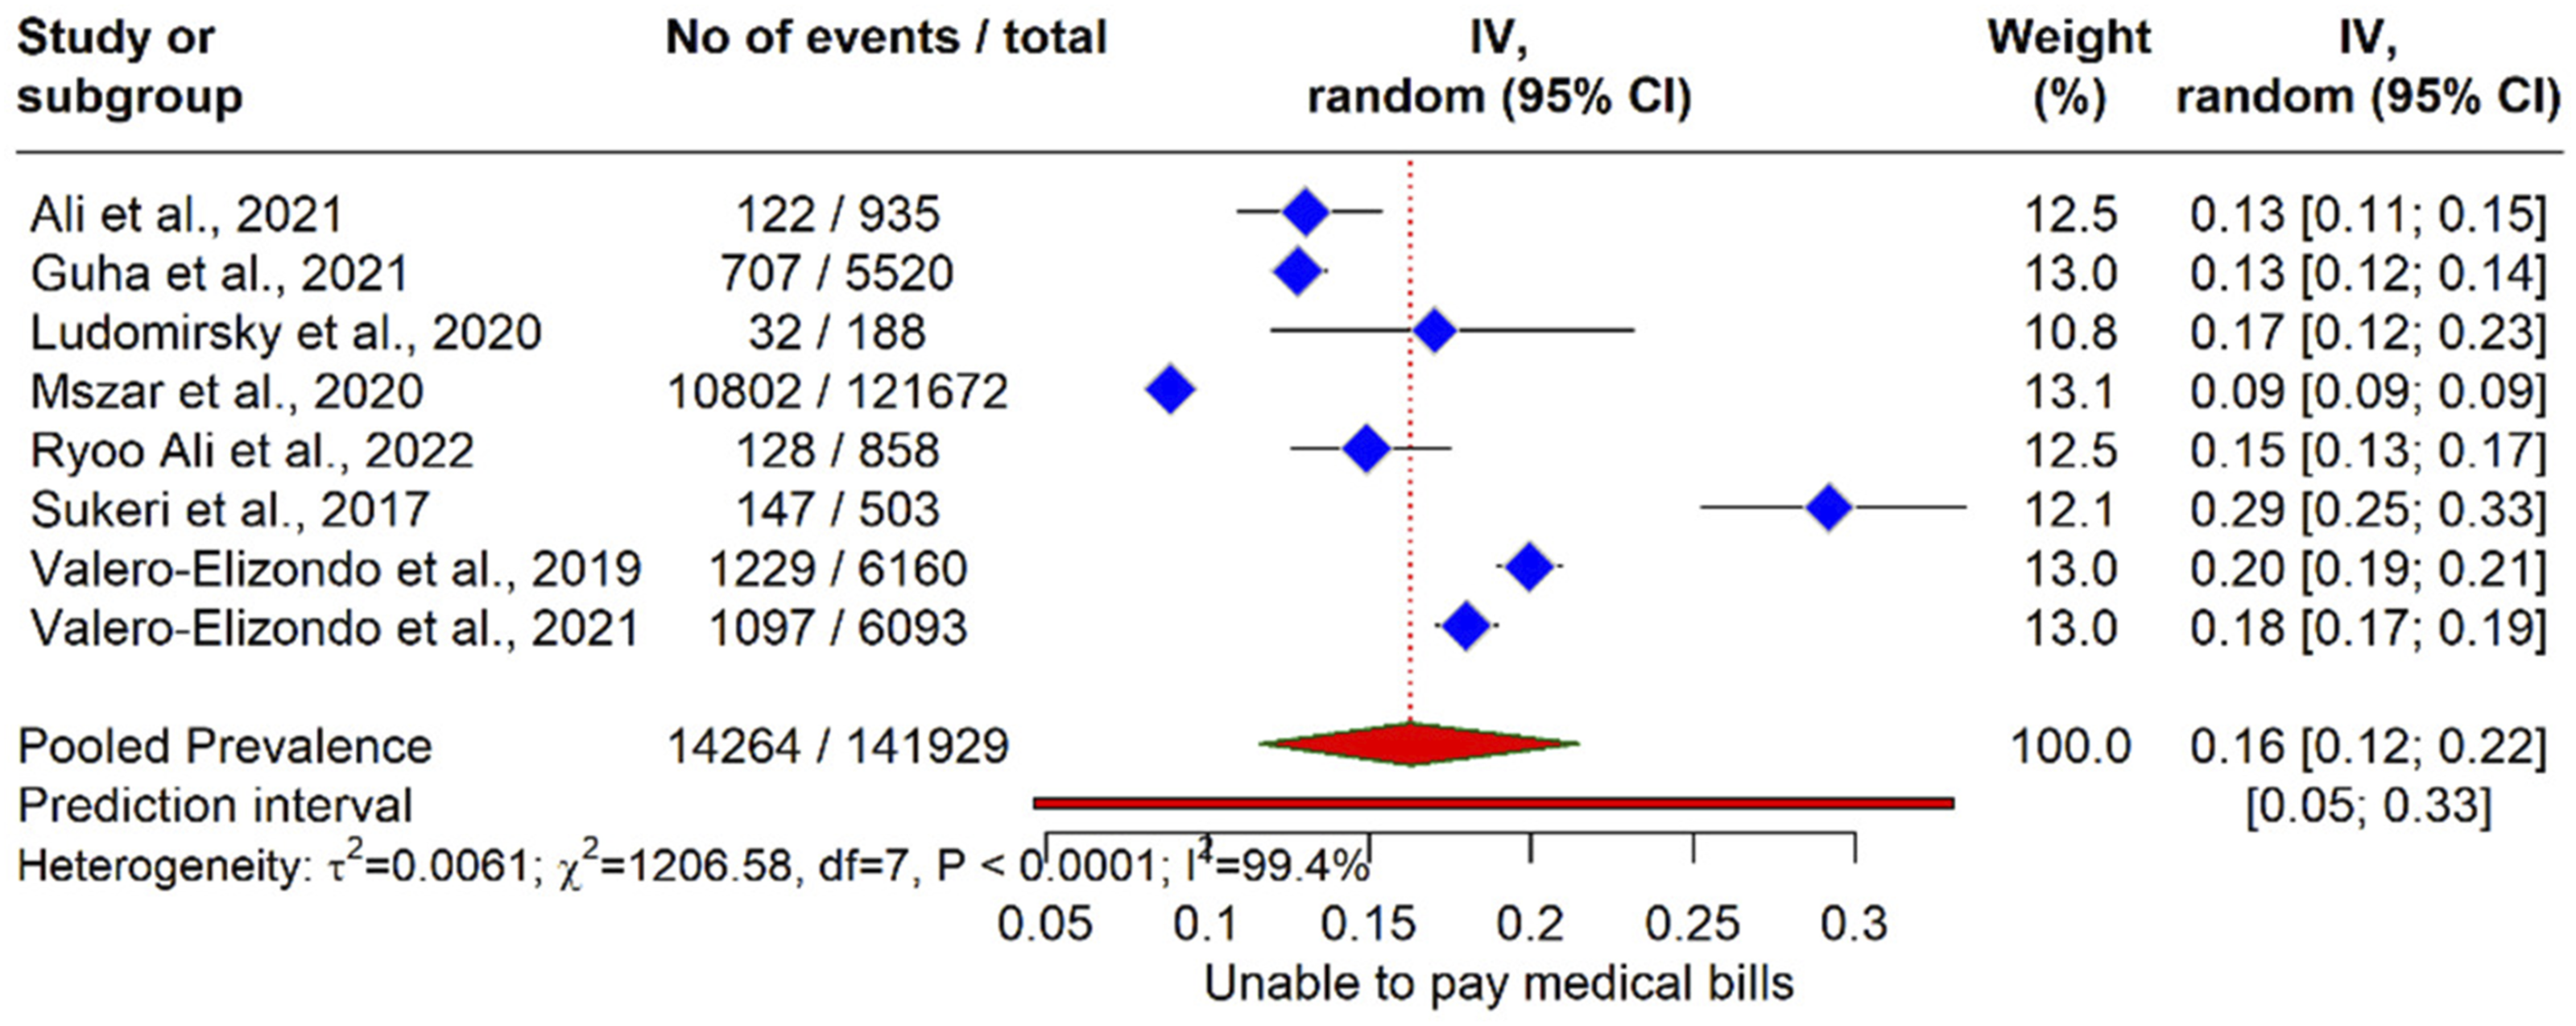
The Bayesian meta-analysis results for the proportion of patients with CVDs unable to pay medical bills are depicted in the forest plot (Figure 11). The pooled effect, estimated using a Bayesian hierarchical random-effects model with weakly informative priors, yielded a prevalence of 0.17 [95% CrI: 0.11, 0.22], indicating that approximately 17% of CVD patients were unable to pay medical bills (Figure 11). Forest plot of posterior probability distributions from Bayesian meta-analysis of being unable to pay medical bills among patients with CVD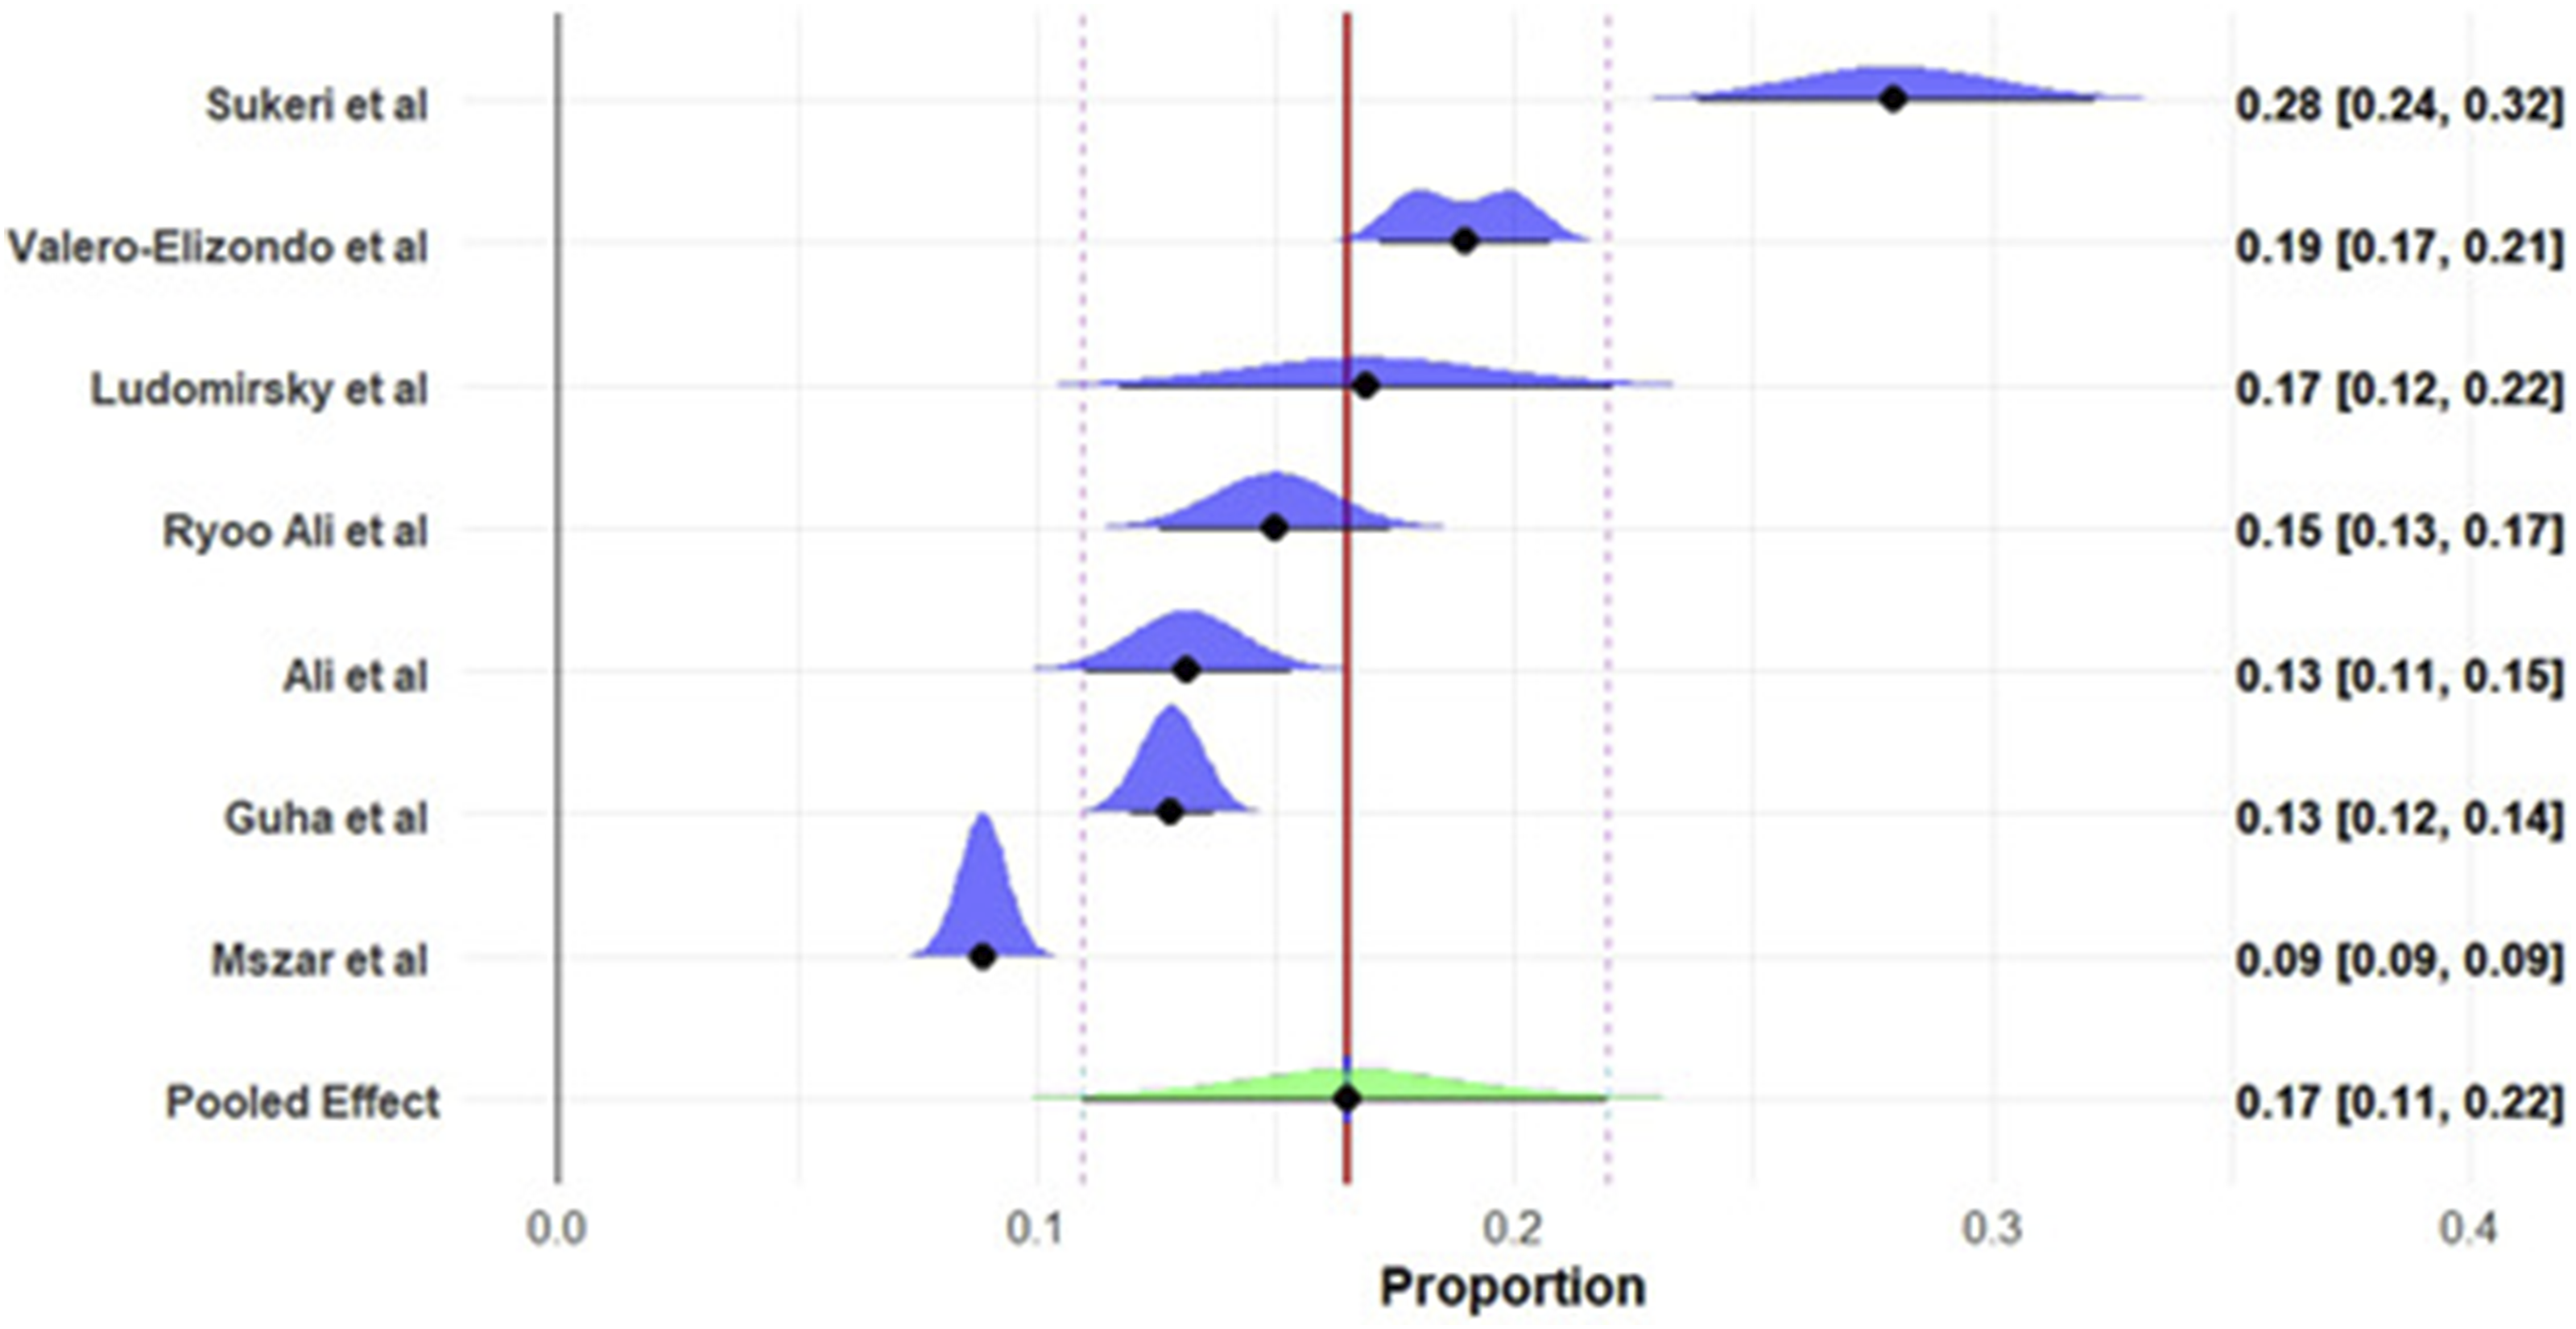
Determinants of Financial Toxicity
The meta-analysis and individual studies identified several key predictors of financial toxicity among patients with CVDs, encompassing CHE, difficulty paying medical bills, distress financing, and high financial burden. These predictors, derived from OR and 95% CI, highlight socioeconomic, demographic, and clinical factors influencing financial strain (Table S3).
Insurance Status
Lack of insurance consistently emerged as a significant predictor across multiple studies. Romo Valenzuela et al (2024) reported an OR of 1.17 (95% CI: 1.11–1.24, P = 0.001) for financial toxicity (FT) risk per unit increase in length of stay (LOS) among uninsured patients, adjusted for multiple variables. Huffman et al (2021) across India, Argentina, China, and Tanzania found ORs ranging from 2.05 (95% CI: 0.82–5.11, P = 0.13) in China to 11.37 (95% CI: 5.18–24.95, P < 0.001) in India for CHE and distress financing among the uninsured compared to insured patients. Mohanan et al reported an OR of 1.49 (95% CI: 1.28–1.73, P = 0.05) for catastrophic financial burden (>40% income), while Bernard et al (2019) noted ORs of 2.16 (95% CI: 1.5–3.13, P = 0.05) for uninsured versus private group insurance. Additionally, Bernard et al found public coverage reduced burden (OR = 0.17, 95% CI: 0.1–0.26, P = 0.05) compared to private group insurance.
Income Levels
Lower income was a strong predictor of financial toxicity. Huffman et al (2021) in India reported an OR of 6.59 (95% CI: 2.23–19.45, P < 0.001) for CHE among low-income versus high-income patients, while in China, the OR was 6.67 (95% CI: 1.69–26.35, P = 0.007) for distress financing. Khera et al (2018) found an OR of 8.32 (95% CI: 7.2–9.6, P = 0.05) for high financial burden (>20% income) among low-income versus mid/high-income patients, escalating to 16.84 (95% CI: 13.08–20.69, P = 0.05) for >40% income burden. Tolla et al (2017) reported ORs up to 58.6 (95% CI: 16.52–208, P = 0) for the lowest income quartile (Q1) versus the highest (Q5). Adeniji et al (2022) noted an OR of 0.43 (95% CI: 0.22–0.83, P = 0.012) for the highest income quintile (Q5) versus the lowest (Q1).
Rural Residence
Rural living increased financial toxicity risk. Huffman et al (2021) in India and China reported ORs of 1.93 (95% CI: 1.27–2.93, P = 0.002) and 5.13 (95% CI: 1.53–17.13, P = 0.008) for distress financing, respectively, compared to urban residents. Tolla et al (2017) found an OR of 3.25 (95% CI: 1.79–5.9, P = 0) for residence outside Addis Ababa region versus within. Li et al (2018) reported an OR of 0.61 (95% CI: 0.47–0.8, P = 0.05) for urban versus rural residence, indicating lower risk in urban areas.
Age
Younger age (<55 years) was a predictor in Huffman et al (2021, India) with an OR of 1.66 (95% CI: 1.06–2.61, P < 0.05) for CHE, while Ali et al (2021) reported an OR of 3.11 (95% CI: 2.00–4.83, P < 0.001) for less financial hardship among those ≥65 versus 18–64 years. Kansra et al (2024) found an OR of 0.72 (P = 0.009) for ages 41–60 versus below 20 years, suggesting age-related variability.
Education and Employment
Lower education levels increased risk. Ali et al (2021) found ORs of 2.03 (95% CI: 1.21–3.43, P = 0.008) for high school/GED and 2.56 (95% CI: 1.81–5.00, P = 0.006) for some college+ versus less than high school for less financial distress. Kansra et al (2024) reported an OR of 15.41 (P = 0.002) for homemakers versus salaried individuals. Daivadanam et al noted an OR of 7.21 (95% CI: 1.54–33.8, P = 0.05) for employment adversely affected versus not affected.
Clinical Factors
Longer LOS (Romo Valenzuela et al, 2024), stroke diagnosis (Huffman et al, 2021, OR = 0.60, 95% CI: 0.37–0.97, P = 0.04), and combined CABG/valve procedures (OR = 2.31, 95% CI: 1.12–4.76, P = 0.02) were significant predictors. Tolla et al (2017) noted an OR of 8.39 (95% CI: 4.24–16.59, P = 0) for inpatient care versus no inpatient care. Daivadanam et al reported an OR of 3.24 (95% CI: 1.03–10.16, P = 0.05) for any intervention versus no intervention.
Household Size
Larger households increased risk. Adeniji et al (2022) found ORs of 0.59 (95% CI: 0.39–0.88, P = 0.011) for 3–4 members and 0.40 (95% CI: 0.24–0.67, P = 0.001) for 5+ members versus 1–2 members. Tolla et al (2017) reported an OR of 1.2 (95% CI: 1.06–1.36, P = 0.04) per unit increase in household size.
Race/Ethnicity and Gender
Ali et al (2021) found no significant race/ethnicity effects (e.g., OR = 1.02, 95% CI: 0.63–1.66, P = 0.92 for Non-Hispanic Black vs. White), but Kansra et al (2024) reported an OR of 2.55 (P = 0.015) for males versus females, indicating gender differences.
Type of Hospital and Duration
Tolla et al (2017) reported an OR of 20.71 (95% CI: 10.21–42.05, P = 0) for private versus public hospitals. Duration since diagnosis showed a slight protective effect (OR = 0.99, 95% CI: 0.98–0.99, P = 0.05).
The leave-one-out sensitivity analysis for CHE (>40% threshold) demonstrated that the pooled prevalence estimates remained stable, ranging from 27% to 35% across all iterations. No individual study was found to exert a disproportionate influence on the final meta-analytic estimate, suggesting that the results are statistically robust despite the high baseline heterogeneity (Figure S1).
Quality Assessment of Included Studies
The methodological quality of the 30 included studies was evaluated using the JBI critical appraisal tool, revealing a high standard of evidence across the review. Of the included investigations, 28 studies (93.3%) were classified as high quality, achieving scores between 7 and 9, while two studies (6.7%) were rated as moderate quality with scores of 5. The majority of studies demonstrated rigorous adherence to criteria regarding clear inclusion definitions, detailed setting descriptions, and the application of valid, reliable metrics for assessing both cardiovascular disease and financial toxicity. Minor limitations were primarily noted in the reporting of confounding factors and the strategies employed to manage them (Q2 and Q3), particularly in large-scale survey datasets (Table S4). Despite these occasional reporting gaps, the overall dominance of high-quality evidence reinforces the statistical robustness of the pooled prevalence estimates and the identified determinants of financial toxicity.
Discussion
The findings of this systematic review and Bayesian meta-analysis indicate the nature of financial toxicity among patients with CVDs globally, with significant implications for health policy and clinical practice. Drawing from 30 studies encompassing 1,087,594 participants, the pooled prevalence estimates reveal a substantial economic burden, characterized by CHE, difficulty paying medical bills, and inability to afford care. These results, supported by both frequentist and Bayesian approaches, highlight the critical need for interventions to alleviate financial strain, particularly in vulnerable populations.
The high prevalence of financial toxicity observed in this synthesis indicates that CVD is a major driver of medical impoverishment globally, comparable to or exceeding the economic burden seen in oncology. These estimates align with prior research on financial toxicity in chronic diseases, such as cancer, where similar burdens have been documented.14,15 The extreme heterogeneity (I2> 98%) reflects not just statistical variation but a significant global disparity in healthcare financing, where the economic impact of the same diagnosis varies widely based on geographic and policy contexts. Additionally, elevated levels of subjective financial distress highlight a psychological burden that may adversely affect recovery. Overall, these results suggest that clinical outcomes in cardiovascular care are increasingly influenced by systemic economic limitations, where survival may depend as much on financial resilience as on medical intervention.
Regional disparities are particularly striking. In LMICs like India and Nigeria, CHE rates exceeded 50% in some studies,40,43 reflecting limited subsidized care and high OOP costs. Conversely, high-income settings like the United States reported lower CHE rates (e.g., 9.8% for >40% OOP in Khera et al, 2018 49 ) but higher rates of difficulty paying bills (up to 54% in Valero-Elizondo et al, 2021), likely due to fragmented insurance coverage and high deductibles. The multinational STABILITY trial 29 reported 45.98% of stable coronary heart disease patients experiencing financial stress, underscoring the global relevance of this issue even in diverse healthcare landscapes.
The identified determinants of financial toxicity provide a roadmap for intervention. Lack of insurance emerged as a consistent risk factor, with ORs ranging from 1.17 to 11.37 across studies. 32 This suggests that uninsured patients face amplified economic burdens, particularly in systems with high OOP requirements. Low income was another strong predictor, with ORs up to 58.6 for the lowest income quartile, 21 reflecting the disproportionate impact on socioeconomically disadvantaged groups. Rural residence increased risk (OR: 1.93–5.13), likely due to limited healthcare access and higher travel costs, 39 while younger age (<55 years) was associated with higher CHE (OR: 1.66–3.11), possibly due to career interruptions and lack of retirement benefits. 33 Clinical factors, such as longer length of stay (LOS) and specific interventions (e.g., CABG/valve operations, OR: 2.31), also contributed to financial strain (Romo Valenzuela et al, 2024). Interestingly, stroke diagnosis showed a protective effect (OR: 0.60), potentially due to subsidized post-stroke care in some settings. Education and employment status further modulated risk, with lower education levels and unemployment increasing financial hardship.43,44 Household size and type of hospital (private vs. public, OR: 20.71) added layers of complexity, with larger households and private care exacerbating costs. 40 These determinants align with the social determinants of health framework, 10 emphasizing the interplay of socioeconomic, environmental, and healthcare system factors. 50 The lack of significant race/ethnicity effects33,51 contrasts with some cancer studies, suggesting that financial toxicity in CVDs may be more universally driven by economic access than racial disparities, though further research is needed.
The high prevalence of financial toxicity among CVD patients necessitates urgent action. Enhancing insurance coverage is a cornerstone intervention, as evidenced by Bernard et al (2019), 47 who found public coverage reduced financial burden (OR: 0.17). Policy reforms could expand universal health coverage, particularly in LMICs, and reduce copayments or deductibles in high-income settings. Subsidizing generic medications, as suggested by Luo et al (2016), 11 could lower OOP costs, given the reliance on long-term pharmacotherapy in CVD management.
Targeted support for low-income and rural populations is equally critical. Income-based subsidies or transportation assistance could mitigate the barriers identified.21,52 Younger patients, who face career disruptions, may benefit from flexible payment plans or employer-supported health benefits. Clinically, integrating financial toxicity screening into routine CVD care using tools like the Comprehensive Score for Financial Toxicity (COST) could identify at-risk patients early, enabling tailored support.9,53
The pervasive nature of financial toxicity among CVD patients necessitates a multi-stakeholder strategy to transition from identifying economic hardship to actively mitigating it. For policy makers, the primary focus must be the expansion of universal health coverage and the implementation of legislative caps on out-of-pocket spending, specifically targeting the 28% of patients currently facing catastrophic expenditures. Such reforms should be coupled with pharmaceutical policies that prioritize the availability of low-cost generic medications to alleviate the burden of lifelong cardiovascular therapy.54,55 For healthcare providers, the integration of standardized screening tools, such as the COST scale, into routine clinical workflows is essential to identify high-risk groups particularly low-income, rural, and younger patients before treatment non-adherence occurs. 56 Furthermore, hospital systems should invest in financial navigation programs and financial informed consent models to assist patients in navigating assistance programs and making cost-conscious clinical decisions. 57 By addressing these socioeconomic and systemic drivers, stakeholders can break the vicious cycle of financial stress and deteriorating cardiovascular health, ultimately fostering more equitable access to life-saving care globally.
The psychological toll of financial stress29,31 indicates the need for holistic care. Integrating mental health services with cardiovascular care could address the vicious cycle of stress and non-adherence. Patient assistance programs, such as those for implantable devices or post-surgical care, could reduce the burden of advanced interventions. 58
Beyond the identification of prevalence and risk factors, the impact of financial toxicity is deeply rooted in the coping mechanisms adopted by patients and their families to mitigate catastrophic expenditures. Our synthesis indicates that economic hardship often triggers a cascade of ‘distress financing’ strategies, including the depletion of household savings, the sale of productive assets like land or livestock, and reliance on high-interest informal loans. While these measures may provide immediate relief for acute CVD events, they frequently lead to long-term medical impoverishment and intergenerational debt. 59 Furthermore, at the patient level, the primary coping mechanism is often cost-related medication non-adherence splitting doses, skipping follow-up appointments, or forgoing essential diagnostics which directly compromises clinical outcomes and increases the risk of recurrent cardiovascular events. 60 These behavioral responses highlight that financial toxicity is not merely a static economic metric but a dynamic process of trade-offs that sacrifice future health and financial stability for immediate survival, reinforcing the need for policy interventions that provide holistic social protection alongside clinical care.
This review has several limitations. The high heterogeneity (I2> 98%) limits the generalizability of pooled estimates, driven by diverse definitions of financial toxicity (e.g., CHE thresholds) and study designs. Publication bias, assessed via Doi plots, may overestimate prevalence, as negative findings are less likely to be published. The reliance on English-language studies and the exclusion of qualitative-only data may introduce selection bias, particularly in non-Western contexts. The Bayesian model’s weakly informative priors, while stabilizing estimates, may slightly influence results, though posterior predictive checks confirmed model fit. Furthermore, some subgroup analyses were limited by a small number of constituent studies, resulting in wide confidence intervals and reduced statistical power. These specific findings should be viewed as exploratory rather than definitive, highlighting a gap in the literature for disease-specific financial toxicity data in cardiovascular care.
Strengths of this study include the large sample size (1,087,594 participants), global representation. The use of Bayesian hierarchical models provided robust posterior probabilities, accounting for heterogeneity better than frequentist approaches. The inclusion of both objective (e.g., CHE) and subjective (e.g., perceived stress) measures offers a comprehensive view of financial toxicity.
Future studies should standardize financial toxicity definitions to reduce heterogeneity, potentially adopting a unified CHE threshold or validated scales. Longitudinal designs could assess the temporal impact of financial toxicity on CVD outcomes, addressing the cross-sectional bias here. Research in underrepresented regions (e.g., Africa, Latin America) and pediatric CVD populations could enhance global insights. Exploring the cost-effectiveness of interventions (e.g., insurance expansion) using economic modeling would guide policy.
While this Bayesian meta-analysis provides a robust quantitative synthesis of global financial toxicity, the complexity of socioeconomic drivers suggests that purely numerical data may benefit from primary qualitative insights. Incorporating Key Informant Interviews (KII) with healthcare administrators, clinical cardiologists, and health economists represents a critical next step to bridge the gap between identified prevalence and actionable policy. Such primary data generation would allow for a deeper understanding of the systemic bottlenecks in insurance reimbursement and the specific barriers to financial navigation programs that are often not captured in observational studies. Future iterations of this research will adopt a mixed-methods framework, utilizing qualitative expertise to refine the quantitative findings and develop culturally and geographically tailored interventions to mitigate the economic burden of CVD.
Conclusion
Financial toxicity is a pervasive issue among CVD patients. Driven by lack of insurance, low income, rural residence, and clinical factors, it demands multifaceted interventions. Enhancing insurance, reducing cost-sharing, and supporting vulnerable groups can mitigate this burden, improving adherence and outcomes. This analysis provides a robust evidence base for health policy reforms, urging a shift toward equitable CVD care worldwide.
Supplemental Material
Supplemental Material - Financial Toxicity and Its Determinants in Cardiovascular Diseases: A Systematic Review and Bayesian Meta-Analysis
Supplemental Material for Financial Toxicity and Its Determinants in Cardiovascular Diseases: A Systematic Review and Bayesian Meta-Analysis by Muhammed Shabil, Eswaran Maheswari and Amogh Verma in Inquiry: The Journal of Health Care Organization, Provision, and Financing.
Footnotes
Author Contributions
Muhammed Shabil: Conceptualization; literature search; data curation; formal Bayesian meta-analysis and model implementation; creation of figures and tables; writing — original draft. Eswaran Maheswari: Study supervision and project administration; study design and oversight of analytic approach, interpretation of findings; writing — review & editing; correspondence. Amogh Verma: data curation; formal Bayesian meta-analysis and model implementation; creation of figures and tables; writing — original draft.
Funding
The authors received no financial support for the research, authorship, and/or publication of this article.
Declaration of Conflicting Interests
The authors declared no potential conflicts of interest with respect to the research, authorship, and/or publication of this article.
Data Availability Statement
The data is with the authors and available on request.
Trial Registration
PROSPERO Number: CRD420251080078.
Supplemental Material
Supplemental material for this article is available online.
References
Supplementary Material
Please find the following supplemental material available below.
For Open Access articles published under a Creative Commons License, all supplemental material carries the same license as the article it is associated with.
For non-Open Access articles published, all supplemental material carries a non-exclusive license, and permission requests for re-use of supplemental material or any part of supplemental material shall be sent directly to the copyright owner as specified in the copyright notice associated with the article.