
Abstract
We used data from the 2014 National Youth Tobacco Survey to examine patterns of cigarette smoking behavior and tobacco use. In light of the recent upsurge in e-cigarette use, we modeled current use and future intentions to use vape products along with combustible cigarette smoking and other tobacco products (i.e., cigars, cigarillos, chew, snuff, and dip). Latent class analyses indicated four discrete classes of smokers including a nominally involved class with very modest levels of tobacco product use, a class blending e-cigarette and cigars, a class of youth who predominantly use combustible cigarettes, and a group reporting indiscriminate use of almost all tobacco products excluding chew. Tests of invariance in item response probabilities and latent class proportions showed little variation across race and gender, albeit a new class of combustible cigarette and e-cigarette users emerged when examined by grade. Members of the heavy smoking and tobacco use class were more likely to be male, White, and older. Predictors of class membership included expectancies (perceived benefits of use), perceived harm (risk), media exposure, tobacco dependence, and the desire to quit. Findings are discussed in terms of characterizing risk among already smoking youth and how actionable prevention measures can be incorporated into existing universal and indicated programs that target reducing tobacco use and smoking behaviors.
Keywords
Nationally representative data from two independent surveys document that rates of lifetime, annual, and past 30-day use of e-cigarettes (more broadly called electronic nicotine delivery systems or ENDS) exceed those of regular combustible cigarette use (Jamal et al., 2017; Johnston et al., 2018). According to the Monitoring the Future (MTF) national survey results, lifetime prevalence rates for youth vaping in general (without describing content) are considerably higher for 8th (18.5%), 10th (30.9%), and 12th graders (35.8%) than combustible cigarette use (9.4%, 15.9%, and 26.6% for 8th, 10th, and 12th graders, respectively), showing that vaping in general (and vaping nicotine) is becoming a preferred consumption modality (Johnston et al., 2018).
The public health significance of e-cigarettes is important for several reasons (Grana et al., 2014; Smith et al., 2016). First, in addition to inhaling nicotine, e-cigarettes contain irritants that can compromise pulmonary and respiratory functioning (Centers for Disease Control and Prevention, 2019; Drummond & Upson, 2014; Williams et al., 2013). These “nanoparticles,” many of which are cytotoxic, can include glycols, aldehydes, and various oxidant metals that are heated in a battery-powered device to create a flavored aerosol vapor, which is inhaled (Breland et al., 2017). E-cigarettes are heavily marketed to youth and often flavored to taste like candy, fruit, or bubble gum to increase their appeal (Dai & Hao, 2016; Miller et al., 2016). There is also evidence that the vapor produced by e-cigarettes can contain tobacco-specific nitrosamines that are carcinogenic (Breland et al., 2017; Farsalinos et al., 2015; Kim & Shin, 2013). The nicotine content of e-cigarettes raises concerns that youth could become dependent (Bell & Keane, 2012; Case et al., 2018; Zhan et al., 2012) and suffer serious health complications that are normally associated with regular combustible smoking (U.S. Department of Health and Human Services, 2016). Moreover, a grave concern is that by inhaling nicotine, youth may experience deleterious effects on brain maturation and cognitive function with long-term ramifications (Lydon et al., 2014; Yuan et al., 2015).
There are other reasons for concern over the rash of e-cigarette use among youth. Several studies confirm that e-cigarettes provide a stimulus for combustible cigarette smoking. Findings from prospective observational studies (Leventhal et al., 2015; Lozano et al., 2017; Primack et al., 2015; Stanton et al., 2019; Wills et al., 2016) consistently show that the risk is higher for current e-cigarette users to become regular cigarette smokers compared with e-cigarette-naive youth. Based on a national longitudinal panel sample, Miech et al. (2017) showed that risk for progression is almost five times as high for e-cigarettes smokers to become a combustible smoker compared with baseline nonsmokers, adjusting for relevant covariates. Likewise, a recent meta-analysis based on data from youth and young adults showed a 23.2% greater likelihood for baseline ever e-cigarette users compared with 7.25% for never e-cigarette users to initiate combustible cigarette use (Soneji et al., 2017). Developmental progression is not limited to tobacco products, as several studies now show that early e-cigarette use can prompt other types of drug use as well (e.g., Lozano et al., 2017; McCabe et al., 2018).
Understanding Patterns of E-Cigarette Use
A new type of smoker has emerged, termed a “dual user” who mixes use of tobacco products usually including combustible cigarettes with one other tobacco product (e.g., cigars, chew or snuff, e-cigarettes). This poses additional problems as these youth are at greater risk for negative behavioral and psychosocial outcomes (Azagba, 2018; McCabe et al., 2017; Wills et al., 2015). A different category of polytobacco users combine three or more tobacco products (e.g., Auf et al., 2018; King et al., 2018), are less motivated to quit, and report higher levels of nicotine dependence (Ali et al., 2016). These individuals are also more prone to advance to use of other substances (Creamer et al., 2016), and continue using multiple tobacco products (Yu et al., 2018). Despite this grim forecast, studies of dual or polytobacco use are not without their limitations. To better understand patterns of smoking behavior, researchers often create crude measures involving artificial dichotomies such as “ever/never” or “light/heavy” use or by assigning users “1” if they smoked even a puff in the past 30 days and “0” otherwise. Conceivably, these categories may not reflect the complexity of smoking behavior, which most likely involves greater, if not more subtle, heterogeneity. For instance, tobacco users can mix and match resulting in different combinations involving e-cigarettes, combustible cigarettes, snuff, snus, chewing or smokeless tobacco, cigars, and other tobacco products resulting in distinct profiles of users. As an example, King et al. (2018) recently reported 27 different combinations when youth and young adults mixed ENDS with other tobacco products. The quite numerous possibilities point toward the necessity of verifying the combinations of tobacco products youth use in an effort to better understand the context of smoking and delineate behavioral risk status.
Modeling Subpopulation Heterogeneity in Studies of Youth Tobacco Use
Several studies have used latent classification strategies to elucidate “typologies” of smokers, producing anywhere between two and five classes. The lack of consistency in these findings reflects either differences in the indicators used to reflect the class structures or the different substantive interpretations given by the investigators to characterize class composition. For example, Gilreath et al. (2016) used latent class analysis (LCA) with a relatively large sample of high school youth and obtained four classes including a nonuser class (72.3%), one that used only e-cigarettes and hookah (8.2%), polytobacco experimenters (13.9%), and polytobacco users (5.6%). Yu et al. (2018) analyzed the 2013 National Youth Tobacco Survey (NYTS) data and, using six indicators of tobacco product use (hookah, e-cigarettes, cigarettes, cigars, chew, and pipe), found four discrete classes. The classes were characterized as a very-low-risk group of tobacco users (77.6%), a lifetime smoking group (13.2%), a lifetime multiple tobacco class (3.6%), and a past month multiple tobacco use class (5.5%), with the latter class behaving much like the dual users observed in other studies. Delk et al. (2019) found increased class differentiation by grade level in a statewide survey of Texas youth. Two classes denoted by “no risk” and “tobacco susceptible” were appropriate for seventh grade youth, with susceptibility determined based primarily on intentions and offers for combustible tobacco and e-cigarettes. The ninth grade solution contained the same two classes plus an additional “tobacco ever use” class based on a single indicator of consumption. The 11th grade model included a fourth class distinguished by tobacco consumption, past 30-day alcohol and marijuana use, and 14-day binge drinking. Using a convenience sample, Sutter et al. (2018) reported a five-class model fit the data best including chippers (28%), moderate polyusers (23.6%), cigar users (20.9%), smokeless users (17.3%), and heavy polyusers (10.4%).
Typologies of smokers can also include use of other drugs. For instance, Miech et al. (2016) classified youth typologies based on e-cigarette use alone or in combination with alcohol (binge drinking), marijuana, cigarette, and prescription drug abuse. Using the MTF data, these authors found a two-class model fit the 8th grade students best with one class representing low-level users (dominated by e-cigarette use, 91%) and a second polyuser class (low endorsement of prescription drugs, 9%), a two-class model also fit for 10th grade students with the same configuration (82% and 18%), and a three-class model fit the 12th grade students with low-level users (76%), predominant e-cigarette users (8%), and a polyuser class (16%). Using a convenience sample, Morean et al. (2016) found four classes in a sample of high school students including abstainers (81.6%), e-cigarettes and alcohol users (4.6%), marijuana and alcohol users (6.9%), and a class that used all tobacco products including e-cigarettes in addition to alcohol and marijuana (6.9%).
Focus of the Present Study
Although there is now growing evidence that supports distinct patterns of tobacco product use among youth, there are still several questions that remain unresolved. First, prior attempts to discern smoking typologies have used a limited set of tobacco products, collapsed consumption items into broad categories (e.g., snuff, chew, and dip), or modeled indicators of tobacco along with alcohol and other drugs, all of which can obscure the true nature of smoker types. In the current study, we examine smoker typologies using a full range of tobacco products including multiple items assessing consumption of e-cigarettes, snuff, dip, chew, snus, cigars, cigarillos, and combustible cigarettes. This more inclusive approach should yield a richer picture of smoking behavior among youth. In addition, latent class methods are a probability-based technique, and the inclusion of nonsmokers in the analysis alters the estimated probabilities of the remaining smoker groups. In the current study, we limit the analyses to include only youth that responded “yes” to having tried combustible cigarettes. The rationale behind this sample delimitation is supported by several trends. National data show that the median age of onset for combustible cigarettes is 13 years, whereas the median onset for e-cigarettes is 15 years of age (Sharapova et al., 2018). Also, the same data show that a greater percent of tobacco users report smoking cigarettes (55.4%) compared with e-cigarettes (30.0%) at 13 years of age or younger. As a result, curtailing the analyses to include only those reporting combustible cigarette use provides a means to examine heterogeneity in smoking behavior among youth that would likely have more extensive prior tobacco use (see also Ali et al., 2016, who made the same delimitation using the 2012 NYTS data).
As a methodological refinement, we also examine the invariance of models based on age groups, race, and gender. Compared with previous studies (e.g., Delk et al., 2019; Yu et al., 2018), this is a more rigorous means of testing group differences because it provides information about parameter differences (both the measurement properties of indicators and class proportions) not obtained with covariate-adjusted models (Collins & Lanza, 2010). Consistent model findings across demographic groups would be instructive for those tasked with developing prevention frameworks. The equivalence of model parameters would generate support in favor of universal prevention programs, whereas the existence of clear subgroup differences would suggest perhaps the need for tailoring programs to meet the needs of a particular subgroup. Furthermore, outside of traditional demographic measures, researchers have failed to assess the impact of other risk factors for smoking behavior. In the present study, we examine the association of several explanatory measures with class membership using multinomial logistic regression (MNR), a technique appropriate for categorically distributed dependent measures. The explanatory measures include measures of smoking expectancies, media exposure, quitting, self-reported dependence, and perceived harm. This strategy is appropriate to determine whether there is a defined psychosocial “vulnerability” associated with smoking behavior that can be the target of future prevention efforts.
We examined smoker typologies using the 2014 NYTS, 1 which is a nationally representative cross-sectional sample of youth in grades 6–12. We focus on this particular year for several reasons. E-cigarettes were not introduced into the United States until the early 2000s, and it was not until 2013 that the major tobacco companies entered this consumer market (Grana et al., 2014). Absent any formal regulatory stance against e-cigarettes, the tobacco industry opted for aggressive marketing (Boley-Cruz et al., 2018; Miller et al., 2017) particularly targeting youth through internet sites (Unger & Bartsch, 2018) and heralding e-cigarettes as a safe substitute for combustible cigarettes and an adjunct to smoking cessation (e.g., Kalkhoran & Glantz, 2016). In addition, systematic national surveillance data on youth e-cigarette use show a dramatic increase in the frequency of past month e-cigarette use between 2011 and 2015 (Singh et al., 2016a, 2016b, 2016c). Indeed, routine surveillance data suggest that 2014 was a pivotal year when prevalence rates for e-cigarette use surpassed regular combustible cigarette use among youth (Arrazola et al., 2015). Moreover, as we explain later, the 2014 survey was quite rich in explanatory markers that could be used to empirically distinguish smoker class membership. Eventfully, many of these markers were eliminated from subsequent surveys making it impossible to examine mutable prevention targets associated with e-cigarette use.
Method
Sample Description
The NYTS was designed to support estimation of tobacco-related knowledge, beliefs, attitudes, and behaviors in a nationally representative sample of public and private school students enrolled in grades 6 through 12 in the United States. The survey uses a stratified three-stage (e.g., students, schools, and counties within stratum defined by primary sampling units) cluster probability sampling design. Non-Hispanic Black and Hispanic youth are intentionally oversampled, and survey weights are created to adjust for nonresponse, varying selection probabilities and to produce accurate national population estimates. The survey is anonymous and administered by trained personnel. Average school participation rate since its inception has been 86.5% and for 2014 was 80.2% with a 91.4% student participation rate, using 228 schools in 36 states. A detailed description of the sampling strategy can be found in 2014 NYTS Methodology Report (U.S. Department of Health and Human Services, 2015).
Measures
Latent Class Indicators of Smoking Behavior
We culled 17 survey items assessing cigarette use, e-cigarettes use, and use of other tobacco products. Each question was dichotomized a priori to capture smoking behavior and subsequently used as observed indicators in the LCA. This strategy is considered appropriate if we want to measure any “involvement” across the different timeframes (no use vs. some use for lifetime, past 30 days, recent week, and future intentions).
Four items captured current combustible cigarette smoking behavior and three assessed future intentions including: “About how many cigarettes have you smoked in your entire life?” (up to 1 cigarette coded 0 and more than 1 cigarette coded 1), “During the past 30 days, on the days you smoked, about how many cigarettes did you smoke per day?” (those who did not smoke coded 0 and those who smoked at least a few puffs per day coded 1), “When was the last time you smoked a cigarette, even one or two puffs?” with responses of more than a week ago coded 0 and up to a week ago coded 1, and several intentions items including “How likely is it that you will try to purchase cigarettes within the next 30 days?” with response options including “more unlikely” coded 0 and those saying “more likely” coded 1), “Do you think you will smoke a cigarette in the next year?” “Do you think that you will try a cigarette soon?” and “If one of your best friends were to offer you a cigarette, would you smoke it?” with response option “probably not and definitely not” coded 0 and those indicating “definitely yes and probably yes” coded 1.
Six items assessed use of other tobacco products: “Have you ever tried smoking cigars, cigarillos, or little cigars, such as Black and Mild, Swisher Sweets, Dutch Masters, White Owl, or Phillies Blunts, even one or two puffs?” (“No” coded 0 and “Yes” coded 1), “Do you think that you will try a cigar, cigarillo, or little cigar soon?” “If one of your best friends were to offer you a cigar, cigarillo, or little cigar, would you smoke it?” with response options “probably not” and “definitely not” coded 0 and “probably yes” and “definitely yes” coded 1, “During the past 30 days, on how many days did you smoke cigars, cigarillos, or little cigars?” with “0 days” coded 0 and “1 or more days” coded 1, “Have you ever used chewing tobacco, snuff, or dip, such as Redman, Levi Garrett, Beechnut, Skoal, Skoal Bandits, or Copenhagen, even just a small amount?” with “No” coded 0 and “Yes” coded 1, “During the past 30 days, on how many days did you use chewing tobacco, snuff, or dip?” with “0 days” coded 0 and “1 or more days” coded 1.
Four items assessed e-cigarette use: “Have you ever tried an electronic cigarette or e-cigarette such as Blu, 21st Century Smoke or NJOY?” with “No” coded 0 and “Yes” coded 1, “Do you think that you will try an electronic cigarette or e-cigarette soon?” and “If one of your best friends were to offer you an electronic cigarette or e-cigarette, would you use it?” with both items using the same response format, “probably not and definitely not” coded 0 and “definitely yes and probably yes” coded 1, and “During the past 30 days, on how many days did you use electronic cigarettes or e-cigarettes such as Blu, 21st Century Smoke, or NJOY?” with “0 days” coded 0 and “1 or more days” coded 1.
External Markers
We also validated markers of class membership using three demographic measures (male vs. female, age: 6th to 8th grade vs. 9th to 12th grade, and White vs. non-White) and six other composite variables: dependence including four items (e.g., “During the past 30 days, was there a time when you wanted to use a tobacco product so much that you found it difficult to think of anything else,” with responses coded “Yes” vs. “No”), quitting including two “motivation” items (e.g., “Are you seriously thinking about quitting cigarettes” with responses coded “Yes, … within the next 30 days, the next 6 months, the next 12 months” vs. “Yes, but not within the next 12 months or No,” and “Are you seriously thinking about quitting the use of all tobacco products” with the same response format dichotomized in the same fashion), perceived harm based on six items (e.g., “How much do you think people harm themselves when they smoke cigarettes some days but not every day” with response options coded “no harm or little harm” vs. “some harm or a lot of harm”), cigarette and other tobacco products media exposure based on four items (e.g., “When you are using the internet, how often do you see ads or promotions for cigarettes or other tobacco products” with responses coded “Not using the internet, Never, Rarely, or Sometimes” vs. “Most of the time or always”), four items assessed electronic cigarettes media exposure (e.g., “When you are using the internet, how often do you see ads or promotions for electronic cigarettes or e-cigarettes” with responses coded “Not using the internet, Never, Rarely, or Sometimes” vs. “Most of the time or always”), and six items assessing expectancies (e.g., “Do you think smoking cigarettes makes young people look cool or fit in” with responses coded “probably not and definitely not” vs. “definitely yes and probably yes”). All multi-item scale scores were unit-weighted scored in the direction of less perceived harm, more exposure to ads/promotions for cigarette and tobacco products and the same for e-cigarette media exposure, more dependence, less desire to quit, and more favorable smoking expectancies.
Analyses and Model Testing Strategy
We used Stata 13.1 for data management and descriptive frequencies and the Mplus statistical program for both the LCA (using maximum likelihood parameter estimates and the estimation–maximization algorithm) and the MNR analyses (Muthén & Muthén, 1998–2012). LCA is a probability-based statistical classification procedure that identifies unobserved population heterogeneity in response patterns. The technique posits there is an unordered categorical latent factor with a multinomial distribution causing the association among observed (categorical) indicators producing homogeneous subtypes or mixtures. The resulting mixtures (latent classes) are qualitatively distinct, where members within a class differ from each other only with respect to random measurement error; however, they are uniquely and systematically different from members in the other classes based on their pattern of response profiles (McCutcheon, 1987).
The assumption of local or conditional independence (Lazarsfeld & Henry, 1968) states that it is the latent categorical factor causing the association among the observed indicators, which would be unrelated by themselves (this constraint can be relaxed). LCA is often called a categorical analogue to factor analysis, because factor analysis reduces the number of items into a smaller number of unobservable factors, whereas LCA reduces the number of individuals into a smaller number of unobserved classes based on their item response patterns (Lubke & Muthén, 2005). In the LCA model, two parameters are of interest: the class membership probabilities (γ or gamma) and the item response probabilities (ρ or rho) for each class. Endorsement for the item response probabilities (the probability of saying “yes”) over a threshold of 0.6 indicates that members of the particular class were likely to affirm the item (60% of the members of the class endorsed the item), with the total configuration of items distinguishing the unique class features. Assignment to the resulting classes is based on estimated posterior probabilities (see Collins & Lanza, 2010 for the computational roots of LCA).
We first tested a parsimonious one-class model positing there is no heterogeneity in the responses to the smoking and tobacco use questions (no differentiation in smokers). This model was followed by increasing the number of classes up to a six-class model. Model fit was determined using the Bayesian Information Criterion (BIC; Schwarz, 1978), Akaike (1981) Information Criterion (AIC; smaller numbers are better and indicate greater model parsimony), and likelihood ratio chi-square (L2) statistical fit indices (McCutcheon, 1987). The L2 statistic quantifies the discrepancy between expected and observed cell frequencies or, stated differently, the amount of association or nonindependence that remains unexplained by the model, where smaller numbers indicate a better fit. The information criteria penalize the L2 for the lack of model parsimony (having too many parameters) and thus provide a more conservative estimate of model fit. The AIC and BIC differ only with regard to the “weight” they attribute to model parsimony, 2 and the adjusted BIC has been shown in simulation studies to be most promising for class enumeration (Henson et al., 2007). Other markers of fit include entropy (ranging from 0 to 1 where higher values indicate more precise classification: Celeux & Soromenho, 1996) and the Lo-Mendell-Rubin statistic (Lo et al., 2001), which makes an empirical correction to the likelihood ratio statistic that is appropriate for homoscedastic normal mixtures.
Tests of structural invariance constrained item response probabilities to equality across groups (i.e., measurement equivalence). This restriction determines whether the class structure is the same between subgroups or whether item response probabilities are group-specific. Full invariance builds on the structural invariance model and tests equality of latent class proportions. At each stage, we assessed whether the additional restrictions led to a degradation in fit of the model using the nested likelihood test (–2LL) and eyeballing changes in the AIC and BIC fit indices. The MNR models regressed class membership on the external markers. The model parameters include regression coefficients adjusted for all other variables in the model. The regression coefficient can be exponentiated to indicate the probability (odds ratio) of class membership corresponding to a one-unit change in the external marker. For the purpose of identifiability, one regression coefficient is customarily set to zero (i.e., pivoting), and this forms the “reference” class (i.e., low consumption) against which all other classes are compared. The procedure uses the Expectation Maximization algorithm and incorporates the Newton-Raphson method to normalize the probability density function. The procedure does not permit missing data on covariates, and thus, we used a single imputed data set with the R3STEP procedure available in Mplus V7 (Asparouhov & Muthén, 2014). With this model specification, the explanatory measures are treated as latent class predictors, and parameter estimates from the regression model are based on posterior distributions for the latent categorical variable. This method is able to handle the classification uncertainty (i.e., imperfect measurement) generated from earlier steps in the procedure. Because the data were clustered at the school level, we also computed Intra-Class Correlations (ICCs) for the markers, and sandwich standard errors were produced using a Taylor linearization procedure (Asparouhov, 2005). Failure to account for the survey’s complex design would inflate the Type I error rate and bias standard errors.
Results
Sample Characteristics
From a total of 22,007 participants who completed the questionnaire, only students who answered that they ever tried cigarette smoking (Have you ever tried cigarette smoking, even one or two puffs? Yes/No) were selected for the present analysis (N = 4,856). From this subsample, we further excluded students with inconsistent responses in other questions, in which they repeatedly answered that they have never smoked cigarettes. The final analytic sample consisted of N = 4,812 students with a mean age of 15.6 (SD = 1.88), 55% were males, 49% were White (51% non-White), and 24.4% were from middle schools (75.6% from high schools).
Prevalence and Demographic Differences
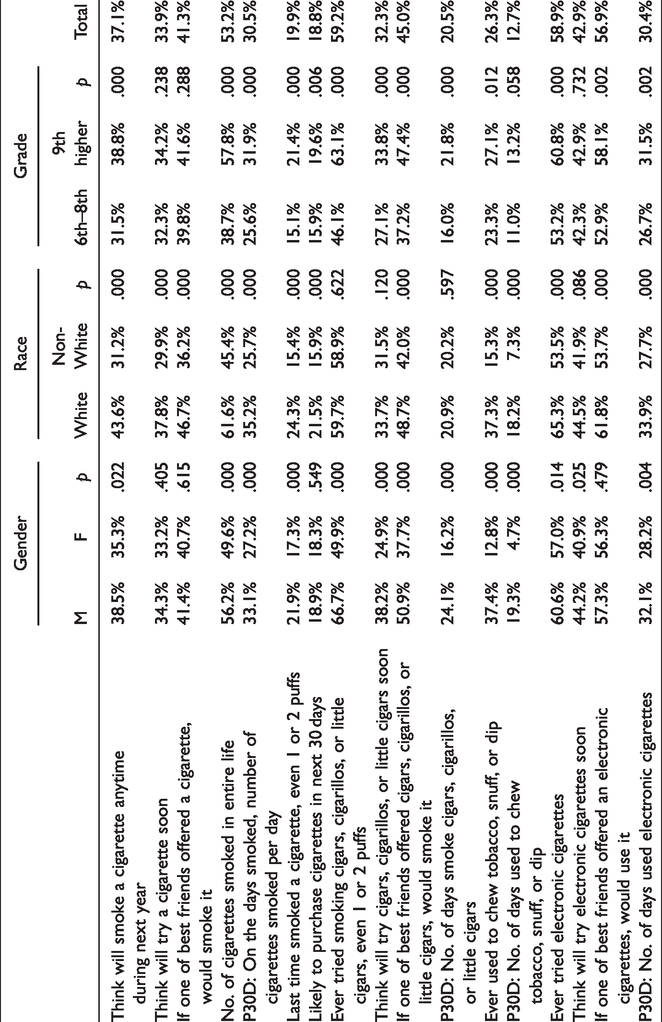
Table 1 shows the prevalence rates for the 17 indicators used in the LCA model for the total sample and also broken down by gender, race, and grade. Statistical comparisons by the chi-square test indicated significant group differences with only 24% of the comparisons failing to achieve significance. Interestingly, the nonsignificant comparisons were spread evenly across the three demographic subgroups (four in each comparison). Where they were significant, males were always more likely to report combustible cigarette use, intentions to use, cigar use and intentions to use, e-cigarette use (60.62% vs. 57.0% for males and females, respectively), and intentions to use as well as past 30-day use for all tobacco products. White youth were more likely to report use for all of the different tobacco products including ever use for e-cigarettes (65.26% vs. 53.55% for White and non-White, respectively), and there was a marked race difference for chewing tobacco (18.2% vs. 7.3%). The same held for grade comparisons where older youth reported a greater likelihood to be involved in all the different tobacco products including ever use of e-cigarettes (60.85% vs. 53.2% for older vs. younger youth, respectively).
Prevalence of Cigarette and Tobacco Use for Total Sample and by Demographic Subgroups.
LCA Model Results
Table 2 contains the model fit indices for the one- to six-class LCA models. With each successive extraction of a class, the AIC and BIC improve by getting smaller. Although entropy is best for the two-class model (.92), the remaining model fit indices do not support this as the best model. The best model conceptually and based on model fit is the four-class model, which has a considerably smaller AIC and BIC statistics and shows major reductions in both the likelihood and Lo-Mendell-Rubin statistics (and this decrement in fit levels off with respect to further change). The four-class model also had a higher level of certainty and reliable classification as evidenced by the posterior probabilities (.934, .912, .966, and .852), which decreased to .902, .883, .957, and .827 in the five-class model. Characteristics of the item response probabilities also reinforced there is good latent class separation (item response probabilities clearly differentiate the classes) with distinct features for each class. Moreover, with increasing extraction of classes, a saturation point can be reached that produces weak identifiability (Garrett & Zeger, 2000).
Fit Statistics From the Latent Class Analyses.
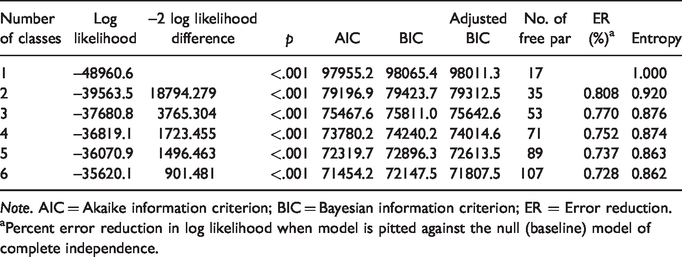
Note. AIC = Akaike information criterion; BIC = Bayesian information criterion; ER = Error reduction.
Percent error reduction in log likelihood when model is pitted against the null (baseline) model of complete independence.
Table 3 contains the item response probabilities for the four-class model. The proportion of youth assigned to each class based on posterior probabilities is contained in the top line under each class name. Class 1 (18.6%) has very high endorsement probabilities for almost all 17 indicators with the exception of past 30-day use of chewing tobacco, snuff, snus, or dip (.337); ever used chewing tobacco, snuff, or dip (.538); and past 30-days quantity of cigars, cigarillos, and little cigars used (.582). The remaining indicators all exceeded the .60 threshold including the e-cigarette items. We labeled this class the “heavy tobacco use” class owing to the high probability of answering yes to using all of the different tobacco products. Class 2 (25.8%) has relatively low endorsement probabilities for most of the combustible cigarette items with the exception of ever trying cigars. What distinguishes the members of this class is their relatively high item response probabilities for the e-cigarette items (ever tried, intentions, best friend, and past 30-day use). All of these indicators exceed the .60 threshold with the exception of number of days using e-cigarettes (.564). Accordingly, we labeled this class “e-cigarette users.” Class 3 (41.5%) is characterized by very low levels of tobacco involvement, with no item response probabilities exceeding the .60 benchmark. This is labeled the “experimental tobacco use” class. Class 4 (14.1%) is comprised of youth with very high endorsement probabilities for the combustible cigarette items (except for recent use and intend to purchase), and two of the four cigar items, and also low endorsement probabilities for the e-cigarette items. We labeled this class the “cigarette smoker class.”
Item Endorsement Probabilities for the Four-Class Model.
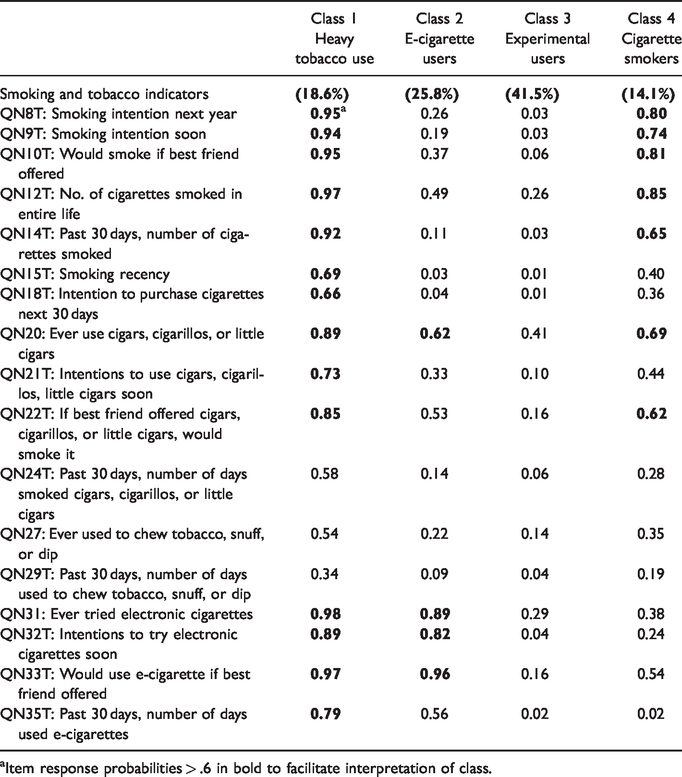
Item response probabilities > .6 in bold to facilitate interpretation of class.
Model Invariance Tests
We next tested invariance of the latent class models across age levels (6th–8th grade vs. 9th to 12th grade), race (White vs. other), and gender. The first step constrains the item response probabilities to equality between subgroups, and this is followed by constraining the latent class prevalences (i.e., structural homogeneity). Although not shown (model fit statistics available from first author), all of the nested model comparisons are highly significant (p < .001). This suggests that there are differences between subgroups; however, the L2 statistic is sensitive to sample size. To detect if there were true underlying differences in the class composition structures, we tabled (Supplemental Tables 1–3) the different item response probabilities for each subgroup in the invariance analyses. In the case of the grade comparison, both four-class models fit well; however, both the younger and older grades showed a slight difference in the pattern for the combustible cigarette class. For the full sample, this class was mainly composed of youth that endorsed combustible cigarette use. However, when examined separately by grade, older but not younger youth also endorsed two e-cigarette items in addition to the combustible cigarette use items.
A comparison of male and female item response probabilities also reinforced their similarity in endorsement patterns. Where there were differences, they were trivially small and would not support a different composition for the class. Both groups had a heavy smoking class endorsing almost all the items, a distinct e-cigarette user class with very low response probabilities except for the four e-cigarette indicators, and an experimental tobacco use class with very low levels of endorsement for any indicator. In comparison to the female model, the cigarette user class for males included two additional items that were endorsed > .60 including ever use of cigars, cigarillos, and little cigars (.808) and if best friend offers cigars … , would smoke it (.723), whereas these two items were well below the .60 threshold for females. The race comparison also showed the two groups were quite similar with relatively few exceptions. Non-Whites were more likely to endorse ever use of cigars, cigarillos, and little cigars (.680) and if best friend offers cigars … , would accept (.638), whereas both items were well below .5 for non-Whites. Whites were more likely to endorse ever use of chewing tobacco, snuff, or dip (.713 vs. .436, for Whites and non-Whites, respectively). Otherwise, the response profiles were almost identical for Whites and non-Whites. 3
The latent class proportions varied somewhat between subgroups; however, this too is expected as the proportions were not equal for the different comparisons (i.e., there were more males than females, slightly more non-Whites, and a greater number of older youth). Using gender to illustrate this point, with full invariance, 21.1% of the males were assigned to the heavy tobacco use class, but only 15.6% of females were assigned to this class. The other difference was for the experimental tobacco use class where 38.6% of males were assigned to this class but 44.9% of females were assigned to the same class. Male and female youth were equally likely to be in the e-cigarette class (26.0% for males and 25.6% for females). Overall, the largest class was always the experimental smokers, regardless of subgroup. In all case, the next largest class was the e-cigarette user class, followed by either the heavy tobacco use or the combustible cigarette user class.
Results of the MNR
The final analysis step involved predicting class membership from a set of explanatory variables. We tested these models with incremental block entry, first including demographics, then expectancies, followed by e-cigarette media exposure, combustible cigarette media exposure, perceived harm, and quitting. This forward inclusion method avoids masking suppression; however, to avoid error propagation, we present only the final model. Several of the measures were moderately associated (not shown). The largest association was between the two media exposure measures (r = .543, p < .001), followed by quitting and dependence (r = .456, p < .001), quitting and harm (r = .289, p < .001), dependence and harm (r = .281, p < .001), and smoking expectancies and harm (r = .242, p < .001). The two largest associations between the demographic and explanatory measures was between race and dependence (r = –.132, p < .001), indicating that Whites reported more dependence, between race and smoking expectancies (r = .122, p < .001), indicating that non-Whites reported more favorable smoking benefits, and between race and quitting (r = –.118, p < .001), indicating that Whites reported fewer quit attempts.
Table 4 contains the adjusted odds ratios (AORs; and 95% confidence intervals [CIs]) corresponding to each explanatory measure and the corresponding regression coefficient showing the change in log odds for being assigned to a class for a corresponding one-unit change in the explanatory measure (a negative sign means less likely to be assigned to the class compared with the reference low smoking class). These analyses also adjusted for serial correlation that might arise from dependencies of students within schools (ICCs) and that would potentially bias standard errors and inflate the Type I error rate. Although not shown, the average ICC across all 17 indicators was .06. Three measures had relatively large (>10%) ICCs including ever used chewing tobacco, snuff, or dip (ICC = .109), past 30-day e-cigarette use (ICC = .105), and number of cigarettes smoked in lifetime (ICC = .08), reinforcing the need to statistically control for clustering effects.
Results of Multinomial Logistic Regression.
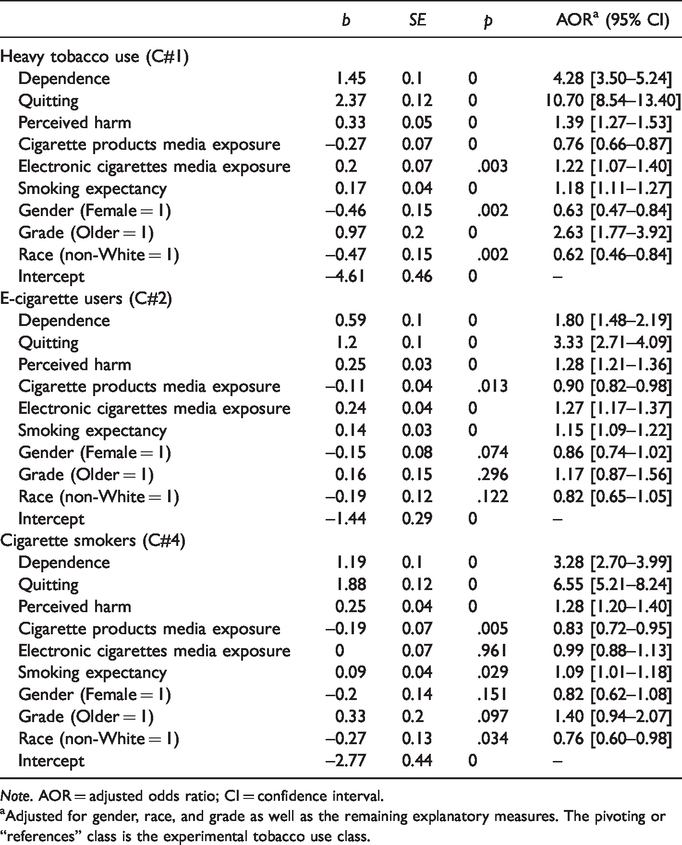
Note. AOR = adjusted odds ratio; CI = confidence interval.
Adjusted for gender, race, and grade as well as the remaining explanatory measures. The pivoting or “references” class is the experimental tobacco use class.
As depicted, all of the explanatory measures (including demographics) were significant in comparing the heavy tobacco use class to the reference (experimental smoking) class. Members of the heavy tobacco use class were more likely to show signs of dependence (AOR = 4.28, CIs [3.49, 5.24]), less likely to want to quit (AOR = 10.70, CIs [8.54, 13.40]), perceive less harm associated with smoking (AOR = 1.39, CIs [1.27, 1.53]), less likely to witness ads and promotions for cigarettes and tobacco products (AOR = 0.76, CIs [0.663, 0.872]), more likely to see ads/promotions for e-cigarettes (AOR = 1.23, CIs [1.07, 1.40]), have higher expectancies for smoking effects (AOR = 1.19, CIs [1.11, 1.27]), be male (AOR = 0.63, CIs [0.472, 0.840]), older (AOR = 2.64, CIs [1.77, 3.92]), and non-White (AOR = 0.62, CIs [0.464, 0.839]). Members in the e-cigarette class were more likely to report greater dependency (AOR = 1.80, CIs [1.48, 2.19]), less desire to quit (AOR = 3.33, CIs [2.71, 4.10]), less perceived harm associated with smoking (AOR = 1.28, CIs [1.21, 1.36]), less likely to be exposed to ads/promotions for cigarettes and tobacco (AOR = 0.90, CIs [0.822, 0.977]), more likely to report media exposure to e-cigarettes (AOR = 1.15, CIs [1.09, 1.22]), and more likely to report positive smoking expectancies (AOR = 1.15, CIs [1.09, 1.22]). None of the demographic measures were significant in this model. Members of the combustible cigarette smoker class were more likely to report dependency (AOR = 3.28 CIs [1.70, 3.99]), less likely to quit (AOR = 6.55, CIs [5.21, 8.24]), less likely to see harm associated with e-cigarette use (AOR = 1.28, CIs [1.18, 1.40]), less likely to report seeing ads or promotions related to cigarettes and tobacco products (AOR = 0.99, CIs [0.876, 1.14]), and more likely to have favorable smoking expectancies (AOR = 1.09, CIs [1.01, 1.18]). Media exposure to e-cigarettes, sex, and grade were not significant predictors of class membership.
Discussion
The current study points toward distinct smoking typologies in youth that have, at least, tried cigarettes. The largest class, for all subgroups, was comprised of experimental smokers with very low levels of endorsement for all tobacco products, albeit they had smoked in their lifetime to satisfy the sample delimitation. The next largest group experimented with cigars, cigarillos, or little cigars; however, what distinguished their behavior was their use of e-cigarettes and their willingness to try them or accept an offer to try them from a best friend. The size of this group was somewhat surprising, as it was larger than what has been reported in other studies that have identified a clearly distinct group of e-cigarette users (Gilreath et al., 2016; Miech et al., 2016). The remaining two classes represented mixtures of youth characterized by combustible cigarette use mixed with cigar and e-cigarette use and a fourth subtype that endorsed using almost all of the tobacco products (including cigarettes and e-cigarettes) although past 30-day use of cigarettes and also chew, snuff, or dip played a less influential role in their tobacco use.
One of the striking differences in the current study is that we delimited the sample to include only smokers and also focused solely on tobacco-related products. This helps to paint a more realistic picture of smoking behavior in a highly representative sample. One other distinction is that in addition to modeling traditional consumption items, class composition was also determined based on intentions to purchase tobacco products and accept offers from friends to use, both items reflecting a smokers’ social milieu and peer socialization factors that may contribute to their tobacco susceptibility.
Another point is that we obtained evidence of both dual users (combustible cigarettes mixed with cigar products) and polytobacco users (heavy use class). The e-cigarette class could also be qualified as “dual users” given they also endorsed using cigar products. When the proportions of youth from the dual and polytobacco use classes are combined, almost 40% of the sample was using more than one tobacco product. This has been a consistent pattern now for over a decade, with several national surveys such as the NYTS and MTF noting a trend toward multiple tobacco product use by youth. Continued interest in using multiple tobacco products at such a young age could harbor negative sequelae in terms of nicotine addiction and also incur serious health complications from smoking.
The composition and latent class proportions remained fairly consistent across demographic subgroups. The one exception involved the grade comparison where there were subtle differences in endorsement patterns that changed the composition of the combustible cigarette user class. For the younger youth (6th–8th grade), this class was defined primarily by cigarette consumption (lifetime) and intention to smoke if a best friend offered. However, older youth endorsed not only the combustible cigarette items (use, intentions, and best friend) but also two of the e-cigarette items (ever tried and would use if best friend offered), suggesting they are dual users. In addition, the magnitude of the item response probabilities indicated a much stronger “socialization” effect operating for older youth, suggesting in fact that older youth may associate with smoking peers. Although we cannot test this supposition with cross-sectional data, the magnitude of the best friend offer item suggests that older smoking youth gravitate toward being around smoking peers. Future studies may want to further examine this premise, as it remains an important literature in the field (e.g., Ennett & Bauman, 1994; Simons-Morton & Farhat, 2010).
The only striking difference in the gender comparison was that, like the full sample, males endorsed two cigar items (ever use and best friend offer), whereas the females did not. We also did not find any racial/ethnic differences, although there is some caution in the interpretation of this finding, because we compared White youth to all other racial/ethnic groups in an effort to reduce the number of comparisons. For all of the comparisons, the constraints on latent class proportions also reinforced that the largest class was always the experimental users, followed by the e-cigarette users and then either the heavy tobacco users or the combustible cigarette users depending on which subgroup was examined. In all cases, the class of e-cigarette users was always larger than the combustible cigarette users, reinforcing the growing popularity of this tobacco product.
Distinguishing Class Membership
Prediction of class membership from demographic and psychosocial risk factors showed that older youth, Whites, and males were more likely to be members of the heavy tobacco use class, and Whites were more likely to be members of the cigarette smoker class. These findings are fairly consistent with other nationally representative surveys and are also consistent from year to year when the NYTS surveys are administered. Males are at higher risk for tobacco involvement partly because they have an earlier age of onset for combustible cigarettes compared with females, report higher prevalence rates for lifetime and past 30-day consumption for most tobacco products, and are more likely to be dual or polytobacco users (e.g., Cooper et al., 2016). The same holds for older youth, at least in this sample of smokers, as they have had more time to consolidate their involvement with tobacco products and begin the process toward nicotine dependence. Although White youths are often noted to be at higher risk for consuming tobacco products (i.e., smoking combustible cigarettes or using e-cigarettes), very little work has examined why they are at risk for being dual or polytobacco users or whether there are certain profiles of risk that distinguishes their tobacco product use. For instance, their susceptibility to combustible cigarettes may reflect advertising or the social appeal of smoking promoted through the media, peer and/or family socialization, neighborhood and contextual influences, and other factors that have not been routinely explored. Taken as a whole, the prevalence data combined with the results of the LCA prediction models suggest there are target groups that can be the recipients of prevention activities given their heightened vulnerability. Others have also noted a specific vulnerability to e-cigarettes among males (Pepper et al., 2013), reinforcing the importance of targeting them early to prevent future tobacco product use.
With regard to the remaining explanatory measures, the larger effect sizes were noted for quitting, dependency, smoking expectancies, and perceived harm. All four of these explanatory measures are candidates for prevention activities emphasizing the harms of smoking, the body’s physiological response to tobacco, the nature and course of nicotine dependence, and the fact that many tobacco-involved youth herald smoking under false presumptions of anticipated social and personal benefits (Skara & Sussman, 2003). Perceived harm has been implicated in smoking initiation and continued use for combustible cigarettes (Ambrose et al., 2014) and e-cigarettes (Amrock et al., 2015; Dobbs et al., 2017; Persoskie et al., 2017) and with regard to future smoking intentions (Brose et al., 2015). Harm involves a myriad of possible perceptions including the effects of smoking on health, whether one type of tobacco product is deemed “less” harmful than another, and whether using any tobacco product inevitably leads to dependence (Case et al., 2018). Many youthful smokers do not believe that e-cigarettes have the same addictive potential as combustible cigarettes, and this has been validated in national surveys such as the NYTS (e.g., Amrock et al., 2015; Dobbs et al., 2017). Furthermore, youth are also less inclined to believe that e-cigarettes will promote combustible cigarette use as they view e-cigarettes as more innocuous and not involving “tobacco.” At the very least, given the strength of these findings, both harm and dependence should be emphasized as formidable parts of youth tobacco control policy and antismoking prevention themes.
Marketing also plays a vital role in the popularity of e-cigarettes (Auf et al., 2018; Singh et al., 2016a, 2016b, 2016c) and has been identified as a marker of future tobacco product use (Boley-Cruz et al., 2018; Mantey et al., 2016). Furthermore, new evidence is accruing that also shows youths’ intentions and susceptibility to use e-cigarettes can be experimentally manipulated through advertising (Farrelly et al., 2015; Padon et al., 2017). What makes this increasingly troubling is that there are no regulations in place yet for marketing e-cigarettes especially to minors. Marketing that is prohibited for cigarettes (television and sports venues) is not currently prohibited for e-cigarettes, which uses placards and point-of-sale advertising at retail stores, the internet, print media, television, and movies to promote sales. Tobacco control policies can take a stronger position on marketing and limit these activities in the hope that the same prevention effect obtained with combustible cigarettes will translate to e-cigarettes.
In the current study, inclusion of the measures assessing advertising exposure for combustible cigarettes and e-cigarettes as predictors of e-cigarette class membership provided evidence of suppression. The signs of the coefficients were opposite (exposure to cigarette advertising was negative). We tested a model with only the advertising measures (one by one), adjusted for demographics and obtained the same result. When modeled separately, only e-cigarette media exposure was a significant predictor of class membership in the heavy tobacco use and e-cigarette use classes, but not the combustible cigarette class. When modeled separately, both regression coefficients were positive (and so is their zero-order correlation). However, when modeled simultaneously, the sign for media exposure to cigarettes and tobacco products was negative. Without a doubt, the two measures are highly collinear as both share the same stem for all four items, differing because one item refers to “cigarettes or other tobacco products,” whereas the other refers to “electronic cigarettes or e-cigarettes.”
Limitations
There are several limitations associated with this research. The data are cross-sectional, and thus, we are unable to infer causation with regard to relations between explanatory measures and class membership, which requires longitudinal data with appropriate statistical controls. We also do not know about the order of use for the different tobacco products, an issue that other researchers have suggested through longitudinal studies matters in the evolution of vulnerability to smoking behavior (e.g., Bold et al., 2018; Primack et al., 2015; Wills et al., 2016). The sample of youth are surveyed while attending public and private school, and there is evidence that high-risk youth may be truant or absent from school (Townsend et al., 2007), resulting in more conservative prevalence estimates. Other surveys that assess homeless youth and youth attending alternative schools (Miller et al., 2017) are now including similar e-cigarette and smoking items, and this should help paint a more inclusive picture of smoking behavior. In contrast to previous studies, we included a broad set of tobacco measures including smokeless tobacco products (i.e., snuff, dip, snus, and chew) and various types of cigars in addition to the usual combustible cigarettes and e-cigarettes. Others (Morean et al., 2016) have also included hookah and blunts, the latter which involves marijuana wrapped in tobacco leaves. Furthermore, we also only referenced e-cigarette users based on items available in the NYTS that exclude several new market products including e-pens or electronic hookah. As we continue to examine typologies of tobacco use, we need to include many different types of products to keep pace with general trends (e.g., Singh et al., 2016a, 2016b, 2016c). Although we tried to include a broad spectrum of explanatory measures, we may have overlooked several that would likely serve to boost model precision. Included are family (e.g., Chassin et al., 2005) and peer (e.g., Go et al., 2010) socialization influences that are known risk factors for smoking and smoking initiation.
Implications
E-cigarettes pose tremendous health risks and can be used in combination with other tobacco products, particularly regular combustible cigarettes. Their introduction to the consumer market and the absence of any tight regulations may contribute the renormalization of smoking (Fairchild et al., 2014; Stanwick, 2015). This has also prompted a growing discussion to regulate marketing of e-cigarettes to minors along with other policy initiatives to deter youth e-cigarette use (e.g., Henriksen, 2012). Strategies would include preventing e-cigarette advertising at venues where youth may be present (i.e., sports activities), prohibiting internet marketing and use of social media to advance sales to minors by tobacco companies, making the laws and regulations for combustible cigarettes apply to e-cigarettes, increased taxation, and large-scale prevention efforts including mass media campaigns targeting youth who use e-cigarettes alone or in combination with combustible cigarettes. These steps are in keeping with efforts taken by the United Kingdom, which has a comprehensive approach to restricting e-cigarette marketing to minors (Rough & Barber, 2017). Based on the success of past efforts to curb youthful smoking in general, it would appear there is value in prevention, which can stem the tide of e-cigarette users before youth ever embark on a smoker’s journey.
Supplemental Material
sj-pdf-1-dre-10.1177_0047237920980483 - Supplemental material for Are E-cigarette Users a Unique Group of Smokers? Latent Class Analysis of the National Youth Tobacco Survey
Supplemental material, sj-pdf-1-dre-10.1177_0047237920980483 for Are E-cigarette Users a Unique Group of Smokers? Latent Class Analysis of the National Youth Tobacco Survey by Lawrence M. Scheier and Martin Komarc in Journal of Drug Education
Footnotes
Declaration of Conflicting Interests
The authors declared no potential conflicts of interest with respect to the research, authorship, and/or publication of this article.
Funding
The authors received no financial support for the research, authorship, and/or publication of this article.
Notes
Author Biographies
References
Supplementary Material
Please find the following supplemental material available below.
For Open Access articles published under a Creative Commons License, all supplemental material carries the same license as the article it is associated with.
For non-Open Access articles published, all supplemental material carries a non-exclusive license, and permission requests for re-use of supplemental material or any part of supplemental material shall be sent directly to the copyright owner as specified in the copyright notice associated with the article.