
Abstract
This article starts with a detailed literature review of recent studies that focused on using learning analytics software or learning management system data to determine the nature of any relationships between online student activity and their academic outcomes within university-level business courses. The article then describes how data was collected from an online course in Moodle learning management system and the student test scores are compared with the engagement learning analytics indicators to measure the strength and predictive nature the hypothesized relationships. The results were less than definitive and in some ways even puzzling. Despite the paucity of positive results, the findings indicated there was very little correlation between student online practices and their academic outcomes in a qualitative business course. On the other hand, several explanations were offered to account for these results, including small sample size, the specialized nature of the course, and the likelihood that students were downloading the material instead of interacting online. The article closes by suggesting directions for future learning analytics research in higher education.
Keywords
Introduction
Learning analytics have been applied to study and visualize the relationship between student activity and performance in online-based university-level courses during the last decade (Dyckhoff, Zielke, Bültmann, Chatti, & Schroeder, 2012; Ferguson, 2012; Gunn, 2014; Nieto Acevedo & Montenegro Maran, 2015; Retalis, Papasalouros, Psaromiligkos, Siscos, & Kargidis, 2006; Scanlon, McAndrew, & O'Shea, 2015). The authors of 11 relevant studies published in peer-reviewed scholarly journals all found some benefits, but they also cited many problems when trying to assess student learning through combinations of learning analytics, learning management system (LMS) activity data logs, and graded performance results (Agudo-Peregrina, Iglesias-Pradas, Conde-Gonzalez, & Hernandez-Garcia, 2014; Fidalgo-Blanco, Sein-Echaluce, Garcia-Peealvo, & Conde, 2015; Gomez-Aguilar, Hernandez-Garcia, Garcia-Pealvo, & Theren, 2015; Iglesias-Pradas, Ruiz-de-Azcarate, & Agudo-Peregrina, 2015; Nieto Acevedo & Montenegro Maran, 2015; Reyes, 2015; Ruiparez-Valiente, Mua-Merino, Leony, & Delgado Kloos, 2015; Scheffel, Drachsler, Stoyanov, & Specht, 2014; Xing, Guo, Petakovic, & Goggins, 2015; Yahya, Messoussi, & Touahni, 2015).
Each of those scholarly manuscripts cited above made unique contributions to the literature beyond visualizing inferential deductions that previous GPA predicts future GPA. In addition to explaining how learning analytics may be used to measure and visualize student learning activity in online courses, all of those researchers raised the concern that deep learning may not be reliability predicted by learning analytics. In fact, only two groups of researchers (Agudo-Peregrina et al., 2014; Gomez-Aguilar et al., 2015) found any statistically significant correlation relationships between student online activity reported in learning analytics and academic performance. More than one researcher confirmed that there was no statistically significant relationship between learning analytics, LMS activity data, and student learning outcomes (Iglesias-Pradas et al., 2015). Therefore, more studies are needed to test if learning analytics data could relate to or predict student performance.
It is difficult to generalize either the positive, negative, or null findings of the above studies toward any business school population due to the differences in the research design, unit of analysis, LMS context, and subject matter disciplines from which the samples were drawn. For example, only a few studies tested for and used objective measures of student learning performance for the dependent variable. All of those researchers called for more studies to further explore how learning analytics, and LMS data could be utilized to assess student performance.
There are numerous empirical studies published in scholarly peer-reviewed journals beyond the scope of learning analytics where researchers have found statistically significant links between student performance in online courses and activity-related factors (Blumenthal et al., 2014; Chang, Wu, Kuo, & You, 2012; Farrington, 2014; P. A. Gibson & Dunning, 2012; Hu, Lo, & Shih, 2014; Kaufman & Schunn, 2011; Lu & Law, 2012; Lu & Zhang, 2012; Mirriahi & Alonzo, 2015; Pombo & Talaia, 2012; Russell, 2015; Shih, 2011; Strang, 2010, 2011, 2013a; Thomas, Reyes, & Blumling, 2014; Wichadee, 2014; Zacharis, 2015). Thus, there may be relevant concepts in other domains that show how student activity in online courses may be related to estimating performance as well as how that knowledge could be applied to improve teaching.
A few pertinent empirical studies have uncovered some relationships between student performance and online activity in Moodle (Dierenfeld & Merceron, 2014; Ferguson & Buckingham-Shum, 2012; Hatala, Gasevic, & Joksimovic, 2014; Iglesias-Pradas et al., 2015; Strang, 2013b). Moodle, the popular open source LMS developed in Australia, now features a learning analytics module called “engagement analytics” (J. Dimopoulos, 2015, para. 1; Moodle, 2015). Other third-party learning analytics tools are available at cost and the free applications remain untested in Moodle (Hatala et al., 2014; Nieto Acevedo & Montenegro Maran, 2015; Reyes, 2015; Ruiparez-Valiente et al., 2015; Yahya et al., 2015). At the time of writing, there were no studies the examining learning engagement module in Moodle.
Several researchers recently studied how learning analytics in Moodle may be used to visualize student activity (I. Dimopoulos, Petropoulou, Boloudakis, & Retalis, 2013; Dyckhoff et al., 2012). Those studies demonstrated the visualization capability of learning analytics in Moodle, but it remains unclear if student learning performance is statistically related to the online activity. This gap in the literature is addressed by the current study as guided by the research question: Can online student learning performance be reliably predicted by learning engagement analytics in Moodle? The sample will be drawn from a business school, but the results may generalize to other disciplines since the focus of this study is on the approach of testing if learning analytics data can be linked with student performance.
Literature Review
First, the term “learning analytics” is defined from the literature. Next, the most relevant empirical studies are reviewed to develop the factors and hypotheses for the current study. The scope of the review is to identify pertinent empirical studies that use Moodle activity data or learning analytics in some way to assess student performance or learning outcomes during online or hybrid courses at the university level.
Learning Analytics State-of-the-Art
Learning analytics is a relatively new field in need of more research (Gunn, 2014). Although 2010 was the first popular emergence of the term “learning analytics” in scholarly discussions (https://groups.google.com/forum/#!msg/learninganalytics/), interestingly, Gunn cited an earlier conference paper by Retalis et al. (2006). Scheffel et al. (2014) confirm that learning analytics is now a de facto education conference track integrating ideas from data warehousing, information retrieval, technology-enhanced learning, educational data mining, and visualization techniques. Learning analytics is a “multi-disciplinary research field that now forms its own domain” (Scheffel et al., 2014, p. 117).
Ferguson (2012) and others (i.e., Fidalgo-Blanco et al., 2015; Nieto Acevedo & Montenegro Maran, 2015; Scanlon et al., 2015; Scheffel et al., 2014) cite the generally accepted definition developed at the First International Conference on Learning Analytics and Knowledge in 2011 adopted by the Society for Learning Analytics Research.
Learning analytics is the measurement, collection, analysis, and reporting of data about learners and their contexts, for purposes of understanding and optimizing learning and the environments in which it occurs (Ferguson, 2012).
Learning Analytics Factors and Variables
The four common units of analysis used with online student activity in learning analytics studies (Agudo-Peregrina et al., 2014; Iglesias-Pradas et al., 2015), as outlined below: student-student [individual]; student-content [individual]; student-teacher [individual]; student-system [individual].
Shum (2012) further expanded upon the learning analytics definition for a UNESCO policy briefing as being methods to analyze learning data and to improve learning systems through evidence-driven adaptation. He described three “strategic” levels of analysis in learning analytics: macro (region/national/international); meso (institution-wide); individual user (student); (Shum, 2012, p. 3).
In addition to above, the group, team, or course is often the strategic level of analysis (Strang, 2015a). The unit of analysis usually includes learning performance (e.g., grade or academic performance) as the dependant variable but other fields are sometimes analyzed such as satisfaction, specific outcome artifacts, or career advancement.
It is clear from the above review that there is an emphasis on prediction as a reason for employing learning analytics. Shum (2012, p. 4) stated that “emerging trends in 2012 identifies three kinds of predictors and indicators (dispositional, activity & performance, and student artifacts).” Thus, the factors or predictors could be associated with interpersonal characteristics as well as online activity and performance outcomes.
Scheffel et al. (2014) used action research to further refine the above factors into a taxonomy of quality indicators for learning analytics. These variables need to be considered by researchers in this field. The constructivistic method they employed was inductive. They utilized brain storming with a focus group of 74 highly qualified participants at the Learning Analytics and Knowledge Conference (2014) to create quality themes for evaluating the outcomes of learning analytics. Next, a new group of 55 learning analytics subject matter experts (all having scholarly articles published) conducted a manual qualitative cluster analysis of the 103 quality themes (http://bit.ly/103QILA). They developed clusters and criteria. They rated the importance and feasibility of each criterion using a scale of 1 to 7 (where 7 = highest). The purpose of applying two scales was to ensure important criteria were also feasible in “real world settings” (Scheffel et al., 2014, p. 125) and vice-versa. Scheffel et al. (2014, pp. 121–130) reviewed the extant learning analytics literature to cite applied examples of each quality criteria for each of the five layers. The resulting taxonomy had five quality dimension layers each with supporting quality criteria, as summarized below. [Pedagogy] Objectives (awareness, reflection, motivation, behavioral change); [Automation] Learning support (perceived usefulness, recommendation, activity classification, detection of students at risk); [Performance] Learning measures and output (comparability, effectiveness, efficiency, helpfulness); [Ethics] Data aspects (transparency, data standards, data ownership, privacy); [Operations] Organizational aspects (availability, implementation, training of educational stakeholders, organizational change). (adapted from Scheffel et al., 2014, pp. 121–130)
Empirical Learning Analytics Research
Gunn (2014 p. 138), Xing et al. (2015), as well as Chatti, Dyckhoff, Schroeder, and Thüs (2012) asserted that we need better research design practices to study learning analytics from a scholarly perspective, so this gap in the literature also needs to be addressed. Given the scientific and predictive nature of learning analytics discussed by Shum (2012), one of the three strategic levels of analysis ought to be aligned with research design principles when practitioners undertake scholarly academic studies. Relevant quality indicators developed by Scheffel (2014) should be incorporated.
Researchers should design learning analytics studies by first identifying their overall ideology (positivist to pragmatic, interpretive, or constructivist), and then describe the strategy—which is developed from the level of analysis, unit of analysis, within or between group focus, as well as bearing in mind the generalization goal of the research questions and hypotheses (Strang, 2015b). The unit of analysis and hypotheses should include one or more of the quality indicator variables from the taxonomy developed by Scheffel et al. (2014). Given that Shum (2012) and others (e.g., Xing et al., 2015) pointed out that learning analytics generally enlists a predictive mandate, within group correlation, or between group mean comparison techniques will most likely be needed in positivist and pragmatic-oriented research designs (Strang, 2015c). Other variations are possible, for example, the creator of Moodle from Curtin University in Perth, WA, Australia, uses the constructivist ideology (Dougiamas & Taylor, 2003). Researchers need to be clear in their design so as to collaborate with their colleagues, to share their studies and to facilitate the understanding of their findings, in order to enlarge this field in the higher education community of practice.
An exemplary alternative but compatible viewpoint for conducting learning analytics research was described by Chatti et al. (2012). They developed a learning analytics reference intended for researchers. The model is predicated on the researcher answering four questions to design their study: What (data and environments), who (stakeholders), why (objectives), and how (methods). In contrast to the above literature that predominately focused on correlating with of predicting student performance, they asserted that learning analytics usually employ “techniques to detect interesting patterns hidden in educational data sets” (Chatti et al., 2012, p. 10). The most valuable aspect of their study was the literature review followed by some applied examples of the research methods in learning analytics. They explained the four distinct techniques that have received the most attention in the scholarly learning analytics literature: Statistics, information visualization, data mining, and social network analysis (Chatti et al., 2012). In big data analytics, these four techniques are integrated along with data warehousing due to the significant volume, high velocity, value importance, and variable complexity of the information collected (Sun, Strang, & Yearwood, 2014). Ethics and respect data privacy are issues that have arisen in big data analytics studies, and more recently, Beattie, Woodley, and Souter (2014, p. 143) reminded researchers that these principles also apply to learning analytics.
Common techniques applied in learning analytics studies such as regression have constraints associated with the method, particularly the assumptions of underlying distributions or a priori models that are often unmet and, therefore, would result in unreliable or invalid estimates of student performance (Xing et al., 2015). The use of parametric statistical techniques require rigorous designs that ensure the prerequisites of the data are satisfied including distribution, population-sample homogeneity, sample group size, data type, and other inferential thresholds including collinearity and variance tolerance (Strang, 2015d). Learning analytics software generally involve nonparametric distribution-free nonlinear techniques utilized in big data analytics (Chatti et al., 2012; Strang & Sun, 2015; Sun et al., 2014; Xing et al., 2015) which include cluster analysis, neural network analysis with Bayes probability theory, nonlinear math programming, correspondence analysis, and genetic nonlinear programming (Nersesian & Strang, 2013; Strang, 2012; Vajjhala, Strang, & Sun, 2015; Xing et al., 2015). The strategy for this study is to accept learning analytics as a “black box” big data summarization tool by using its output for input into the unit of analysis during hypothesis testing. In other words, the learning analytics summary data output will become the input for testing if student online activity in Moodle is related to, or can predict, their performance toward the course learning objectives.
The empirical evidence of predicting online student learning performance from learning analytics data is weak and needs further investigation. In a study similar to the current one, Agudo-Peregrina et al. (2014) measured the relationship between student activity and performance (grade). Their sample drawn from several online courses (N = 138) and for three LMS-assisted face-to-face (F2F) courses (N = 218) at a university in Spain within a masters program focused on information technology and life long learning subjects. They used Pearson as well as Spearman correlation and backward regression to estimate the direction, strength, and predictability of the hypothesized relationships. The learning activity consisted of factors including student–student, student–content (materials), student–teacher, and student–system (e.g., tests, assignments), as well as other factors that were beyond the scope of this review, which were was extracted from Moodle log files rather than using engagement analytics as in the current study. Student activity followed a similar pattern between the online as compared with F2F course, except that the student–system interactions were less in the F2F modality because “all tests and assignments” were offline (Agudo-Peregrina et al., 2014, p. 546). While they did find statistically significant positive correlation between all of the online student activity indicators and grade, this was not observed for the F2F modality. In their regression on grade, only two factors in the online courses, student–student with a standardized B = 0.209 (T = 2.94, p = .004) and student–teacher having a standardized B = 0.508 (T = 7.14, p < = .001) were statistically significant but weak predictors of student learning performance. The high beta for student–teacher at more than twice the student–student interactions was problematic because it could indicate that customized tutoring was instead influencing the student's grade. The researchers were cautious with their findings and recommended more replications.
In a follow-up study of Spanish master level students, Iglesias-Pradas et al. (2015) collected Moodle activity log data and surveyed students (N = 39) to test the relationship of several new factors in an online teaching and learning with technology course. They used their own procedure to collect student–student, student–content, student–teacher and student–system interactions based on their previous work (Agudo-Peregrina et al., 2014). They added a new a priori validated tool to capture student self-reports of their perceived teamwork and commitment learning performance competency, both of which became the dependent variables in their analysis. Unfortunately, their findings were “counter intuitive, showing no relation between interactions in the LMS and the level of competency acquisition” (Iglesias-Pradas et al., 2015, p. 88). They reaffirmed their findings were similar to other studies in that learning analytics data concerning student activity in online courses had very little correlation relationship to learning performance and generally no predictive capability. They did find marginal relationships between the dependent variables team work and commitment. An insight they mentioned was that the levels of student activity seemed to interact. Thus, a multivariate analysis or structural equation model may have been able to illuminate more of these hidden relationships.
Zacharis (2015) used regression to test the predictive capability of 29 learning analytics factors on learning performance with a sample of 134 engineering students in a blended (partly online) computer programming course. His study is comparable to the current one since all of the relevant student activity and grading took place online in Moodle. On the other hand, there were numerous forums, activities, and quizzes in his course, whereas the current study used a streamlined approach with less student interaction points. Nonetheless, he found 14 of the 29 factors had significant positive correlation relationships with grade. He used stepwise regression, which produced a statistically model capturing 51% of adjusted variance on grade (R = 0.721, R 2 = 0.520, adjusted R 2 = 0.505, SE = 1.2036, p < .01). This model included four predictors: RePo messages (reading and posting messages in forum), CCC (content creation contribution), Quiz efforts (interacting with quizzes), and Files viewed (lesson materials viewed online). Remarkably, he performed a binary logistic analysis to measure if these four factors could correctly discriminate at risk students in this course. His logistic regression model “correctly classier 30 students who failed [68.8%] and also correctly classier 79 students who did not fail [86.8%]” (Zacharis, 2015, p. 50). Nevertheless, his sample was drawn from computer science students participating in a Java programming course so it may not be generalizable to other populations, and classifying only 69% of students at risk of failing could be considered too low of an academic benchmark.
In a study indirectly related to the current one, Xing et al. (2015)developed a genetic programming (GP) model to predict student performance from learning analytics data. Xing et al. (2015) applied the GP model on a sample of 122 students in an algebra category course within a proprietary LMS. They found that the GP model was “interpretable and has an optimized prediction rate,” and it was “useful for teachers to identify reasons that students are struggling” (Xing et al., 2015, p. 180). GP is based on nonlinear decision tree analysis with the ability to loop back through of-then-else logic (Xing et al., 2015), but GP has certain deterministic characteristics such as the parameters for the logic so it is limited (Strang, 2012), although it is more accurate in identifying optimistic relationships once customized for a sample. By comparison to GP, statistical algorithms use predictive inferential logic without requiring any parameters except for a p value (Strang, 2015d).
While GP seems accurate in predicting student performance, it is difficult to use by faculty in business schools without programming skills. Thus, the current study will focus on using inferential statistical techniques on data extracted from Moodle learning analytics, to test if there are any predictive relationships between the variables and student learning performance.
Employing Learning Analytics in Moodle
Operationally, there are seven common approaches to employ learning analytics in Moodle, as enumerated below. Some approaches require a plugin or external third-party software (beyond the scope of this study).
Course-level activity logs—the reporting thresholds must be configured and then may be viewed for any activity, and also the administrator can review the logs at higher levels of analysis such as organization—a high volume of sometimes cryptic event-oriented detailed results are generated which requires adequate server storage, but these are very useful for big data analytics approaches in learning analytics research.
Course-level engagement analytics (requires a plug-in with Moodle 2.8 but is included in higher versions)—this is a new block that first requires a rubric be defined identifying how to partition the activity counts in gradable modules (quizzes, forums, assignments, etc.)—this is the focus of the current study.
Course-level event monitoring (requires Moodle 2.8 or higher)—Moodle messages are sent to teachers when certain configurable trigger points are reached, such as late Lessons, low attendance, low Lessons, and so forth—these are generally not suitable for research purposes since the data may be obtained from log files.
Course-level graphs—these are provided to summarize some activities, such as the results of quizzes and assignments with grades (descriptive statistics), forums, and feedback (survey) responses—although the same data is available from the internal Moodle tables using SQL access, the feedback module is particularly useful for research because students may be surveyed at any point in the learning workflow (before or after readings, a quiz, or assignment), a summary graph may be displayed (and students may be given access to view it), plus the results may be exported as a CSV, Google Spreadsheet, or Excel file.
Organizational-level security statistics (functions better with Moodle 2.8 or higher)—these are tabular reports accessible by users designated with an administrator role, listing frequencies of security breach attempts, detailed logs, and other fields—these are usually beyond the accessibility of researchers.
Organizational-level usage statistics (requires a plug-in with Moodle 2.8 or higher)—an executive summary chart is provided, similar to the course usages statistics, but with university-wide as well as school, departmental, and course-level statistics broken down by month and year of logins, country counters, language, enrolled users—this is useful for demographic statistics describing the sample frame in research.
Organizational-level third-party tools (generally requires Moodle 2.9 or higher)—many tools are open source but sometimes require the data to be exported such as TrAVis, MTRDS, CourseViz, DIAS, LOCO, AuthorLineVisualizations, Piwik, GISMO (see Dyckhoff et al., 2012; Hatala et al., 2014; Yahya et al., 2015) while others are commercial often requiring the data to be exported from Moodle or other LMS such as and Google Analytics, ALASKA (see Agudo-Peregrina et al., 2014; Gomez-Aguilar et al., 2015; Ruiparez-Valiente et al., 2015; Xing et al., 2015; Yahya et al., 2015)—unfortunately, most of these tools generate statistics at the site level with subtotals for schools, departments, and courses, so they may be limited from a research perspective, although they are very effective in their visualization capability; (adapted from sources cited above and I. Dimopoulos et al., 2013; J. Dimopoulos, 2015; Moodle, 2015).
Research Design and Hypotheses
Guided by the literature review, the unit of analysis in the research design was the predictive relationship between student learning performance (grade) and student activity in an online course collected by the Moodle learning engagement module. Additionally, the views of online lesson materials were considered another predictive factor in the unit of analysis. The level of analysis was individual student. This was a within group focus (prediction of factors averaged across all students) with a generalization target of AACSB-accredited business schools at state and regionally accredited 4-year degree awarding universities.
Since this was an online course, it was logical to assume that students would have to at least log into the course regularly in order to (and before) accomplishing any activity toward their learning performance—thus, course logins formed the baseline as a prerequisite causal factor. The following hypotheses were created based on the literature review and the research goals.
H1: Course logins identified by Moodle engagement analytics (EngageC) have a positive causal relationship with student performance (Grade) and with all other predictors; H2: Lessons viewed by students will have a positive predictive relationship with student performance (Grade); H3: Assignment activity identified by Moodle engagement analytics (EngageA) have a positive predictive relationship with student performance (Grade); H4: Forum postings identified by Moodle engagement analytics (EngageF) have a positive predictive relationship with student performance (Grade).
We applied a theory-dependent positivist ideology consisting of a deductive literature review (above) to inform the research question, to develop the hypotheses, and to select the methods (Strang, 2015c). Since this study was designed to collect student activity and performance data, quantitative techniques were selected to answer the research question and to test the hypotheses (Strang, 2015d), as explained in the next section.
Methods
Descriptive statistics, correlation, and regression techniques were applied at the 95% confidence level. SPSS version 14.1 was used for the statistical tests, while Moodle version 2.8 with the engagement analytics plugin was installed during this study.
Participants
The population for the sample frame was the State University of New York (SUNY) which is a system of regionally accredited public higher education institutions serving nearly 467,000 students and at the time of writing having more than three million alumni around the world (www.suny.edu). The College at Plattsburgh was chartered in 1962 and is regionally accredited by Middle States Commission on Higher Education (MSCHE). The ongoing stable enrollment at this college is approximately 6,200 students, with roughly half of those in the School of Business and Economics (SBE), of which 350 were in the undergraduate BSBA program at the time of writing. Average class size is 21, student–faculty ratio is 16:1, and 90% of faculty holds the highest degree (e.g., PhD or doctorate) in their discipline (www.plattsburgh.edu/admissions/quickfacts.php).
The university maintains articulation agreements with many local colleges, institutions, and the military, with transfer students amounting to 10% of the population. According to the last report for MSCHE (2012), the institution uses selective enrollment: 87% were full-time students; 10% were non-resident (international and domestic out-of-state); 11.5% were from minority backgrounds (Asian/Pacific Islander, African American, Hispanic, Native American/Alaskan); 88% were 18 to 24 years of age; and 57% were women (www.plattsburgh.edu). However, the entrance criteria are moderately high including a 2.3 GPA for transfers, and this is monitored throughout the program for matriculated students.
In addition to MSCHE, the SBE maintains “specialized accreditation” from the Association for Academic Collegiate Schools of Business International (ASCSB). SBE is staffed with 38 full-time faculty (25 hold a PhD or doctorate in their field), who teach across 11 different majors (accounting, business administration, economics-finance, entrepreneurship, global supply chain management, hotel restaurant tourism management, international business, marketing, and management). All bachelor degree programs require 120 credits with roughly one third of those in a major. Internships are offered in companies such as IBM, Daimler, and Disney—study abroad opportunities extend to China, England, and Australia (www.plattsburgh.edu/academics/buseco/).
Natural intact convenience groups (existing online class sections) were used from two SUNY campuses. These SUNY campuses were part of a public comprehensive university located north of the state capital Albany, NY (USA). The enrollment at this university was 6,350 matriculated students, with 1,050 of those in the SBE, of which approximately 350 were in the undergraduate Bachelor of Science in Business Administration (BSBA) program at the time of writing.
At the university level, the average class size was 22, the student–faculty ratio was 17:1, and 97% of tenure-track faculty held the highest degree in their discipline. The gender balance was 45.1% male and 54.9% female. International enrollment from 63 countries represented 5.4% of the population. In the business school, 65% of faculty held a relevant business doctorate degree (DBA, DPM, DM), or at least a Philosophy Doctorate (PhD).
The size of this class was 45, and there were two professors, thus making the student–teacher ratio 45:2 (plus there was one part-time teaching assistant). The researcher was the lead professor and had taught large classes of over 600 students using Moodle technology. The mean age of the sample was 20.3 (SD = 1.6), while approximately 42% of the class were females. The higher-than-normal 51% sample proportion of international students was a result of credit transfer partnerships with accredited universities in China.
All 45 participants were undergraduate students in an upper division Professionalism Seminar and Human Resource Management (HRM) course taught by the researcher. This course had been taught by the researcher for 3 years in this context using Moodle, and this professor had taught a similar version of this course at other universities using Blackboard, Angel, Moodle, and a proprietary LMS. A pilot had been successfully completed in a previous term using an identical course syllabus and with the same configuration in Moodle.
Instrumentation
The demographic variables for the students' age, gender, and culture were exported from our course registration system BANNER-XE, reformatted slightly, saved in Excel spreadsheet format, and then imported into SPSS.
The materials for the course included lectures, videos, examples of resumes and cover letters, and URLs for job searches, as well as the rubrics for all assignments. These were uploaded as mandatory lessons in Moodle. The student views were tracked as counts in Moodle activity logs and exported in a variable named “Lessons.” This variable was intended to capture how much the students accessed the material for learning or clarification.
There were five formative assignments used in this study as enumerated below (with course weighting):
Job search must match skill competencies—must show ability to plan career advancement (10 points); Resume development—must be customized for one of five available job descriptions (20 points); Cover letter development—must be customized for one of five available job descriptions (20 points); Interview—answers must clearly satisfy five mandatory criteria and two desirable criteria (40 points); Reflection—student self-evaluates their performance against the course learning objectives (10 points).
Assignments 1 (job search) and 5 (reflection) took place in a Moodle Q&A post-first forum. The remaining Assignments 2 to 4 were setup as drop boxes. Assignments were graded using rubrics. A rubric applied to an example assessment for the most heavily weighted Assignment 4 (interview) is shown below in the appendix.
Moodle learning engagement was configured to capture the student interactions for the above five assignments. The same forum was used for Assignments 1 and 2 (job search and reflections) with different threads. Moodle learning engagement was configured according to best-practices (refer to Dierenfeld & Merceron, 2014; I. Dimopoulos et al., 2013; J. Dimopoulos, 2015; Moodle, 2015). One post was initially required in each assignment as minimum, between 2 and 4 posts were considered enough, and 5 or more posts were more than enough. The Moodle learning engagement attendance threshold was based on students logging into the course site twice per week over the 16 weeks—thus a student who logged in 32 times on different days would receive 100%. None of the Moodle learning engagement fields were used as part of assessing the student's learning performance.
The engagement analytics block was run when assignment grading was completed and when the course was complete. The Moodle engagement analytics final totals screen was captured and pasted into Excel, refined for alignment and column names, saved and then imported into SPSS. These were defined as ratio data types (percentages). The variables from Moodle engagement analytics were named: EngageF (activity related to the above forum Assignments 1, 5), EngageA (activity within Assignments 2–4), and EngageC (course logins).
The dependent variable “Grade” was the total of the grades for all five assignments, graded as a ratio data type out of 100% and shown as a percent out of 100. The field was exported from Moodle gradebook and imported into SPSS. No outliers were deleted meaning that students not participating received a zero and were retained.
Results and Discussion
Preliminary Demographics Analysis
Descriptive Statistics of Sample and Moodle Engagement Analytics (N = 45).
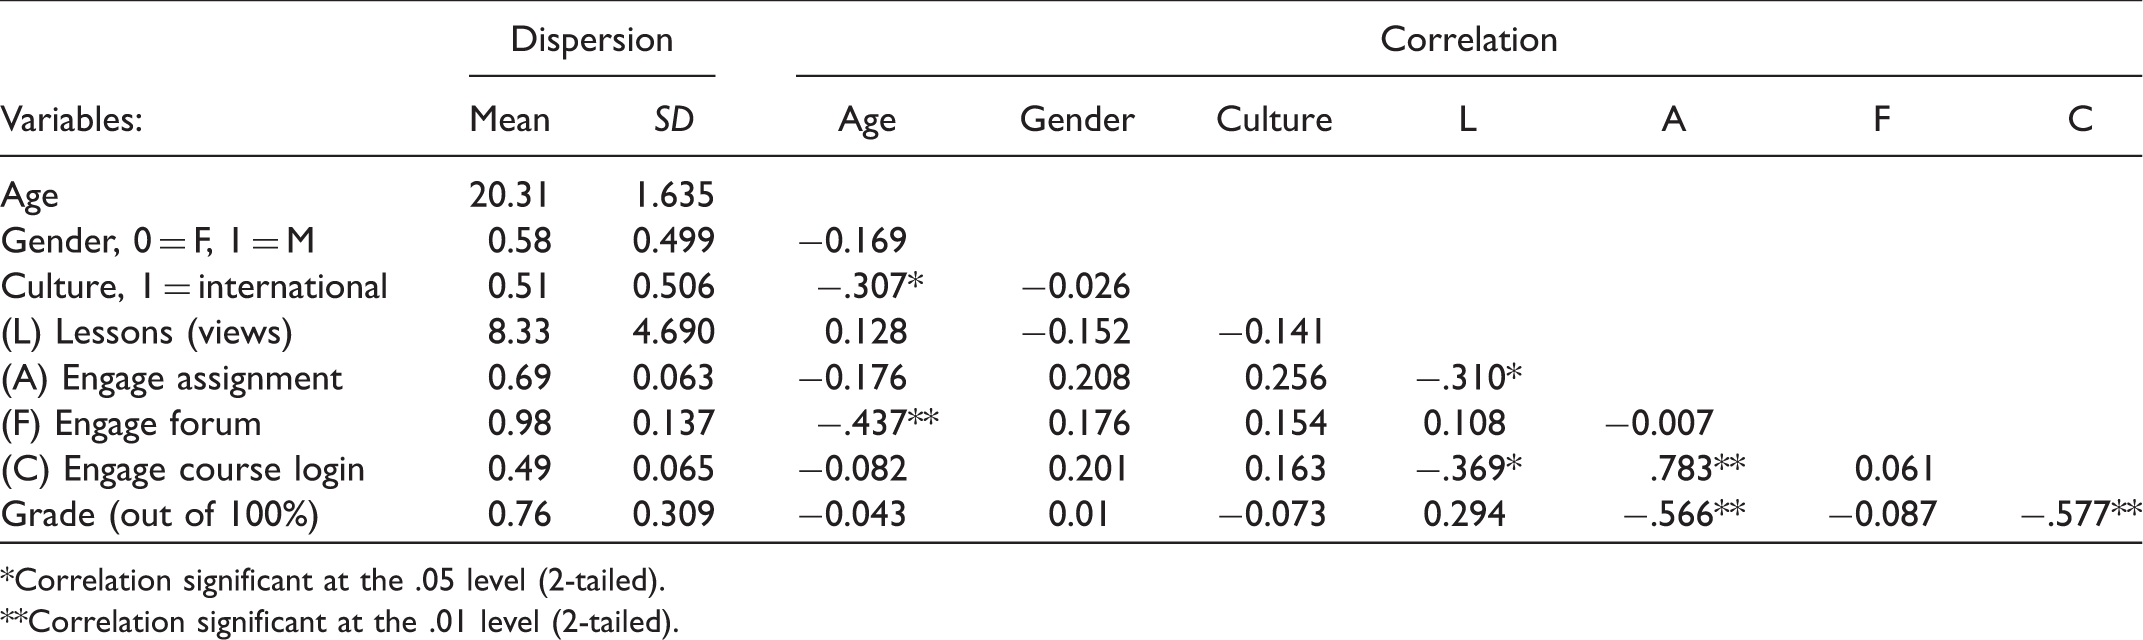
Correlation significant at the .05 level (2-tailed).
Correlation significant at the .01 level (2-tailed).
Interestingly, younger students were more likely to be associated with higher amounts of forum posts since there was a significant negative correlation of −0.437 (p < .01) between age and the forum engagement analytics variable EngageF. Other than this anomaly for EngageF, there were no other significant correlations between the sociodemographic variables (age, gender, and culture) and with the dependent variable Grade. This was a valuable finding for experimental control purposes because it illustrates that student learning (Grade) was not related to the sociodemographic factors in this sample.
Learning Performance Preliminary Analysis
Lessons read by students were not related to grade (no significant correlation in Table 1). This was worrisome because it could mean that students how did not access the course material but instead they may have used external sources to help them complete their assignments and achieve their grade. Alternatively, it could mean the students in general were already competent or they had good research skills allowing them to locate other materials to prepare them for the assignments (thus limiting their lesson browsing to the examples and rubrics).
A puzzling statistic from Table 1 was that students who read the lessons were less likely to engage more activity toward their assignments, as signaled by a significant negative correlation of −0.310 (p < .05) between Lesson and EngageA. It is plausible that students who more often read the lessons required less work to do their assignments and, therefore, did not become as active in those areas (i.e., making only the final submission).
Students who logged on more often despite attendance not being graded were less likely to expend activity reading their lessons, as seen by the significant negative correlation of −0.369 (p < .05) between Lessons and EngageC in Table 1. Not surprisingly, students who logged on to the course more regularly were also more active in Assignments 3–4 as found by the significant positive correlation of +0.783 (p < .01) between EngageC and EngageA. It seems reasonable that if students were uncertain about their assignment, or its due date (e.g., poor self-management of deadlines), then a student would log on more regularly.
We can see possible evidence of a mediating relationship between students logging on more often and spending more activity in their assignments, but inversely performing worse on the assignment, as suggested by the significant negative correlation of −0.566 between grade and EngageA from Table 1. In a similar fashion, students who spend logged on to the course more regularly had lower grades, as deducted from the significant negative correlation of −0.577 (p < .01) between grade and EngageC in Table 1.
Overall, there were no significant relationships between student learning performance and online activity either through reading lessons or as derived from the Moodle engagement analytics data, as seen by the lack of significant positive correlation between grade and any of the other variables in the hypotheses. Technically, this also meant that there was very little chance that regression could produce a statistically significant model. Nevertheless, the hypotheses were formulated with a prediction goal so they will be tested next.
Hypothesis Testing Results of Student Learning Performance
Statistical Estimates of Best Stepwise Regression Model (N = 45).
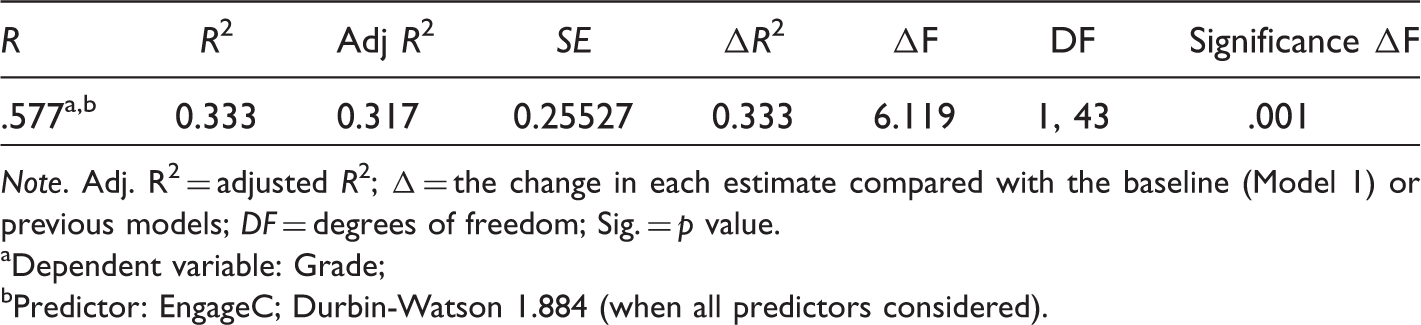
Note. Adj. R2 = adjusted R2; Δ = the change in each estimate compared with the baseline (Model 1) or previous models; DF = degrees of freedom; Sig. = p value.
Dependent variable: Grade;
Predictor: EngageC; Durbin-Watson 1.884 (when all predictors considered).
The first hypothesized causal factor representing the prerequisite online course logins was effective in predicting student learning performance, but none of the other anticipated factors were significant. The model summarized in Table 2 with the prerequisite causal factor EngageC produced an R2 of 0.333 with DF = (1, 43), and it was the only statistically significant model resulting in an adjusted R2 of 0.317 (p < .001). Adjusted R2 is the best estimate to report for this type of analysis, as it reflects the number of factors utilized in the model following the principle of parsimony (Strang, 2015d). The Durbin-Watson estimate of 1.884 is close to the benchmark of 2.0 (Tamhane & Dunlop, 2000) suggesting weak evidence of predictor autocorrelation over time but the indicator would not be relevant in this sample because the data points were not all available in a chronological sequence (Strang, 2015d). Nevertheless, some autocorrelation could be expected in a study of online student performance due to the fact that students must first logon to the course in order to access the materials and also because of the learning curve effect in that students often participate more and perform better as the course progresses.
Coefficient estimates of best stepwise regression model (N = 45).
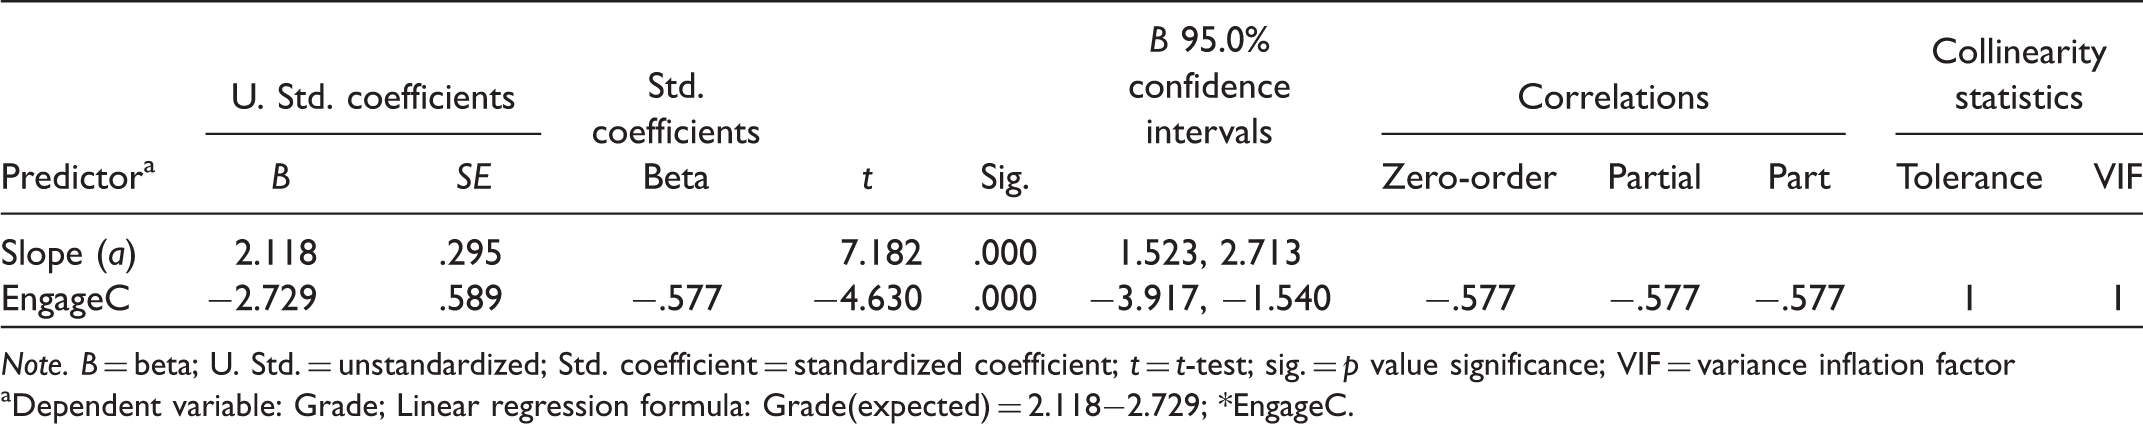
Note. B = beta; U. Std. = unstandardized; Std. coefficient = standardized coefficient; t = t-test; sig. = p value significance; VIF = variance inflation factor
Dependent variable: Grade; Linear regression formula: Grade(expected) = 2.118−2.729; *EngageC.
Table 3 lists beta (B) unstandardized (U. Std.) and standardized coefficient (Std. coefficient) estimates, along with the t-test estimates (t), and p value significance (sig.) for all statistically significant predictors. The standardized beta coefficient removes the effect of the constant to facilitate comparison across studies (Strang, 2015d). Table 3 also contains correlation estimates for the slope and predictor, including zero-order, partial, and the part for each factor (these are valid only when the beta is statistically significant and when the model includes more than one factor so they are included here only for completeness). The collinearity statistics are included but would not be relevant for a single factor model. Nonetheless, it could be mentioned that a variance inflation factor above 1 could signal factor interaction during regression (Tamhane & Dunlop, 2000).
Based on the coefficient results listed in Table 3, although course logins was statistically significant as a predictor of grade, it was not theoretically valid in the research model, as it had a negative casual relationship with student learning performance. The slope for constant (a) in Table 3 was statistically significant at T(1, 43) = 7.182, p < .001, as shown in Table 3. EngageC had a statistically significant beta of −2.729 and a standardized beta of −0.577 with a T(1, 43) = −4.63, p < .001.
This may be interpreted as EngageC had a negative casual relationship with grade: Higher EngageC values would result in lower Grades, and vice-versa. For example, given the resulting linear regression formula: Grade(expected) = slope + beta × EngageC; below are several comparative course login scenarios showing the predicted Grade. It is obvious from these scenarios that student learning performance cannot be reliably predicted by Moodle engagement analytics EngageC, as the grade cannot practically be negative nor would it be reasonable that more course logins should decrease grade.
Grade (with EngageC = 10 course logins) = 2.118−(2.729 × 10) = −25.16864256; Grade (with EngageC = 30 course logins) = 2.118−(2.729 × 30) = −79.74186095; Grade (with EngageC = −10 course logins) = 2.118−(2.729 × −10) = 29.40457582; Grade (with EngageC = −30 course logins) = 2.118−(2.729 × −30) = 83.97779421.
Agudo-Peregrina et al. (2014) made a good point that backward regression objectively includes all the independent variables, making it possible to find a set of variables with significant predictive capability even if none of its subsets have it; [and] there is no suppression effect, which occurs when independent variables interact with opposite effects. (p. 546)
It is good statistical reasoning to test all these predictors together for an online course, as they are all unavoidable factors that ought to have some impact on student learning. Therefore, we ran a backward regression of all our factors—EngageC, Lessons, EngageF and EngageA—on grade. The initial four-factor model was statistically significant capturing 32% of variance (R2 = 0.38, adjusted R2 = 0.318, SE = 0.25521, p < .05), but only course logins (EngageC) was statistically significant in the t-tests, and it was a negative predictor of grade, as found in the stepwise regression.
Limitations With Recommendations
A key limitation in this research, which affects any generalizations, was the small sample size of 45 students. Additionally, the context of SUNY may not be similar to other universities. The course design and pedagogy may be dissimilar to other populations. Also the sample had a higher concentration of international students (51%) as compared with the population at SUNY institution which means this sample does not even generalize perfectly to SUNY as a whole. Additionally, the sample was drawn from the School of Business & Economics so this would not necessarily be compatible with other disciplines.
Finally, the course was a professional human resource management course so students may behave differently during online courses in this subject matter. A technical limitation was that the rejection of the hypotheses was predicated upon the data provided by Moodle engagement analytics, but it is unknown exactly how those results were calculated without examining the program code (which was beyond the scope of this study). Most of these limitations could be easily overcome through replications of the research design with other samples drawn from different populations. More testing of Moodle engagement analytics and online activity data are needed.
Conclusions
Learning analytics was not able to predict student learning performance, based on Moodle engagement analytics used with the online AACSB-accredited business discipline course in this sample. This finding was congruent with several similar studies (including Agudo-Peregrina et al., 2014; Iglesias-Pradas et al., 2015) but in contrast to one comparable study (Fidalgo-Blanco et al., 2015) where activity in teams was related to student learning performance.
Besides failing to predict student performance, learning analytics variables were not even positively related to student grade. In fact, two Moodle engagement analytics variables, course logins, and assignment activity were inversely related to student learning performance, that is, they were negatively correlated with grade at a statistically significant level. Thus, according to Moodle engagement analytics data, we could deduce that students who achieved higher grades were less active in the course and in their assignments, and vice-versa, students who with lower grades were more active at the course level and within the assignment models.
Thus, there are no reliable generalizations or implications to propose from this study. Notwithstanding this finding that learning analytics cannot reliably predict student learning performance, at a statistically significant level, more research needs to be undertaken to replicate (or refute) these findings with new populations, in other disciplines, using other learning analytics software, and from more LMS contexts.
Deductions to Stimulate Further Learning Analytics Research
On the other hand, there were a few findings of interest that warrant additional investigation in future studies. First, student learning performance was not even statistically related to the access counts for the online lessons (lectures, rubrics, examples, videos, URLs, and other resources). This could be indicated that students are downloading the lessons in just a few accesses rather than regularly reading the material online, perhaps to save in mobile data fees, due to performance, lifestyle convenience, or for other reasons. This could be further explored by using a survey or interviewing the students to determine why they were or were not accessing the lessons materials regularly, and then comparing those responses to the student learning performance grade.
This deduction may in part be supported by the puzzling statistic that students who more frequently accessed the lessons were less likely to engage more activity within their assignment modules. There was further evidence of this deduction because students who logged on more often spent less time reading their lessons but more time accessing their assignments, possibly to clarify the assignment requirements or due to poor time self-management. Indeed, there is additional evidence of this deduction that students with poor self-management skills were logging in more often checking their assignment requirements but not reading their lessons, because these students (on average) scored lower on their learning performance grades. Thus, we see a bit of a pattern here, with students having poor self-regulation skills focusing more on the assignment requirements but less on the theory in the lessons needed to complete the assignment there thereby performing lower with lower grades.
Alternative Learning Analytics Topics to Investigate
Since Moodle engagement analytics was not found to be able to reliably predict student learning performance in this study, several other ideas have emerged through the literature review which may stimulate further research. Three different implications are suggested for using learning analytics for other purposes: self-regulation, early warning attrition systems, and strategic resource planning.
Visual feedback from learning analytics could help students self-regulate their progress and also teachers could monitor these indicators. Kennedy, Corrin, Lockyer, Dawson, Williams, and Mulder (2014) asserted that we need to find good uses of learning analytics besides merely identifying failing students. They suggest that teachers should use learning analytics to monitor student progress and in turn students could be taught how to use learning analytics to self-regulate their progress in courses. In fact Corrin and Barba (2014) conducted a study where students used learning analytics as a dashboard to monitor their progress. They found that the “ability to view their feedback in this format was found to have an impact on students' motivation towards the subject and helped to guide them in their progress and performance in learning activities and assessments” (Corrin & Barba, 2014, p. 632). On the other hand, they acknowledged that they did not test for a statistical link between learning analytics and performance so more research is needed.
Learning analytics could provide student early warning systems and attrition prediction. Scanlon et al. (2015) recommended that technology such as learning analytics with visualizations could be leveraged by administration to monitor student attrition as well as to inform program review and retention. Gibson and Freilas (2014) used regression for learning analytics to identify attrition in a MOOC (N = 195); they reported “a strongly predictive relationship was found to the final grade” (p. 183). A related potential use for learning analytics was identified by Hesson, Moskal, and Shephard (2014). Their idea was to visually monitor how the community, including schools, participated with the university. This could be done by inviting external stakeholders to log into the LMS so their interactions with one another and with students could be tracked by the learning analytics software.
Learning analytics could be used for system capacity monitoring and human resource planning. Wohlers and Jamieson (2014) described how Google Analytics for Moodle was useful in helping their university understand Website resource prioritization, but it has not provided feedback on student learning performance. They make an insightful suggestion that they plan to use learning analytics to “develop reporting processes to feed data to Schools and programme coordinators in order to augment its programme self assessment practice” (Wohlers & Jamieson, 2014, p. 118). Additionally, Kennedy et al. (2014) implied that learning analytics could be useful for the purposes of a university self-accreditation processes, by providing course, program, and site level statistics on basic student activity.
Thus, Moodle engagement analytics visualization graphs may be well-suited for capacity monitoring and human resource planning in addition to facilitating student self-regulation and flagging attrition as an early warning system. The real-time capability of learning analytics makes these tools particularly advantageous for student self-regulation and for attrition flagging. More research is needed into all of these learning analytics ideas.
Insight for Future e-Learning Technology Research
Some faculty around the world look to smaller advanced societies such as Australia and the subject matter experts at ASCILITE conferences for higher education ideas, including what is now considered an LMS standard: Moodle. To this end, the findings of student surveys in Australia may be a predictor of what we will see in other developed nations with bigger populations that take more time to adapt to change. Gosper, McKenzie, Pizzica, Malfroy, and Ashford-Rowe (2014) replicated their 2010 Student Experience and Expectation of Technology (SEET) survey to better understand student experiences and expectations regarding the use of technologies for learning at university level given the recent proliferation of newer devices such as digital pads and smart phones (N = 2,276). Their results indicated a significant increase in the use of mobile devices with collaboration tools outside the LMS but a slight increment for other technologies and “very little awareness of, or interest in MOOCs” (Gosper et al., 2014, p. 300). They found a 13% increase in the use of Google docs/drive and Drop box, an 8% change of online research catalogs, and a 4% jump in web conferencing or video chat tools which included Skype, Face Time, Adobe Connect, Collaborate, and Google Hangouts (Gosper et al., 2014). As implied above, a temporary limitation of their research was that the samples were drawn from only two of the most advanced universities in the Sydney region on the east coast of Australia.
Thus, if students in university populations that generalize from the Australia sample (Gosper et al., 2014) continue to increase their uptake of mobile devices and collaboration tools outside the LMS, learning analytics in Moodle or any in LMS will not be reflective of student activity, since the critical student learning activity will reside outside the LMS. Big data analytics could present some opportunities to capture student behavior outside the LMS. Nonetheless, given the results in this study, learning analytics had no capability to predict student learning performance, so these implications could generalize to other university populations of business school students, as well as to other disciplines.
Footnotes
Declaration of Conflicting Interests
The author declared no potential conflicts of interest with respect to the research, authorship, and/or publication of this article.
Funding
The author received no financial support for the research, authorship, and/or publication of this article.