
Abstract
This study uses the log data from Moodle learning management system for predicting student learning performance in the first third of a semester. Since the quality of the data has great influence on the accuracy of machine learning, five major data transmission methods are used to enhance data quality of log file in the data preprocessing stage. Furthermore, the modified FRBCS-CHI (fuzzy rule-based classification system using Chi's technique) algorithm, based on the weighted consequence, is proposed to improve the prediction accuracy of classification. Thereafter, the confusion matrix with two dimensions is employed to illustrate the prediction results, such as false positives, false negatives, true positives, and true negatives, which are further used to produce the parameters of prediction performance, including the precision rate, the recall rate, and the F-measure. From the results of experiment, the proposed modified FRBCS-CHI method will have higher prediction accuracy than the original FRBCS-CHI method.
Introduction
In the past, most universities have evaluated the student learning performance after the midterm examination in order to remedy the students who have learning difficulty. However, after the midterm examination, even if the students with poor learning performance have been offered some remedial courses and guidance, these students cannot keep up with the course progress. Thus, it is necessary to develop a warning system to predict the student learning performance earlier. This study is based on the log file of Moodle system to predict the student learning outcomes in the first third of the semester through the educational data mining (EDM), so that teachers can accurately acquire the student learning status and provide earlier assistance for student as soon as possible.
In the study of EDM, students’ learning data mainly come from three types of sources, including the administrative information on campus about grades, absence records, student background information, and so forth (Abu-Oda & El-Halees, 2015; Kaur, Singh, & Josan, 2015; Márquez-Vera et al., 2016; Milos Ilic & Mladen Veinovic, 2016; Sivakumar, Venkataraman, & Selvaraj, 2016), questionnaire survey (Sumitha & Vinothkumar, 2016), and learning management system (LMS) (Akçapınar, 2016; Elbadrawy, Scott Studham, & Karypis, 2015; Pitigala Liyanage, Lasith Gunawardena, & Hirakawa, 2016; Yassine, Kadry, & Sicilia, 2016). Among them, the LMS is the most convenient and effective source for collecting student learning data. The LMS completely records the process and results of all students learning activities, without any additional support from teachers, students, and administrative units.
Recently, the study of students learning performance has focused on the application and the comparison of prediction methods. For example, the classification methods were adopted to identify learners’ learning patterns for comparing the effectiveness of classification methods, including J48, Bayesian network, Naive Bayes Classifier, and random forest (Pitigala Liyanage et al., 2016). K-NN cluster analysis was used to establish a classification model of student learning methods (Akçapınar, 2016). The collaborative multiple regression model was proposed to predict students’ performance of curriculum activities (Elbadrawy et al., 2015). The past literature has mainly focused on the data analysis stage of EDM. However, the data selection and data transformation in the data preprocessing also play a key role in influencing the accuracy of predictive analysis.
Data preprocessing is a very important task for EDM. The measured variables should be properly normalized or transformed in advance especially if the standard deviation of student learning activity data in different groups is quite different. Modeling analysis and appropriate prediction techniques can then be applied to the transformed data. The whole process involves a lot of preparatory work and planning process. In particular, the data preprocessing stage accounts for a large portion of the workload, which is an important basic work that cannot be neglected.
In the data preprocessing stage, common processing methods are as follows: (a) processing of missing values, (b) processing of category data, and (c) scaling of data features. As this study employs the log data of the Moodle platform for analysis, in the original log data, the ranges of variables are very different to each other, so the transformation of the data is necessary. A lot of normalization and transformation methods can be used to reconstruct the learning activity data for improving the prediction accuracy of learning performance.
Furthermore, in the traditional classification method, each data sample is explicitly classified to a class. In the binary class, a data sample belongs to one of the two classes. In the fuzzy classification method, data samples can belong to many different classes with different degrees.
In the traditional classification method, each data sample is explicitly classified to a class, while a data sample belongs to one of the two classes in the binary class. However, in the fuzzy classification method, data samples may belong to many different classes with different degrees.
In the EDM, the classification method generally used the decision tree methods to classify the students’ learning status. However, the pattern of student behavior at the edge of pass and fail is very similar. Therefore, the fuzzy rule-based classification method (FRBC) can be adopted to fuzzify the input data to make the data much closer to the real situation (Ishibuchi & Nakashima, 2001; Ishibuchi, Nakashima, & Murata, 1999; Ishibuchi & Yamamoto, 2005; Ishibuchi, Yamamoto, & Nakashima, 2005; Zadeh, 1965). In addition, the fuzzy classification method can automatically generate the fuzzy rules and the fuzzy membership functions, which can express the information status more accurately, so as to enhance the prediction accuracy of the student’s learning.
The FRBCS.CHI method is one of the most useful and effective fuzzy rule-based classification systems based on Chi's method to handle classification tasks. The FRBCS.CHI method generates rules according to the techniques of Wang and Mendel and then replaces the consequent parts of the IF–THEN rule with class labels. The degree of each rule is calculated according to the antecedent part of the IF–THEN rule. In prediction phase, the FRBCS.CHI algorithm first calculates the matching degree of each fuzzy rule for each query pattern in testing case and then the consequence class of the fuzzy rule with the maximum matching degree will be assigned as the consequence class of the corresponding query pattern.
In this study, the modified FRBCS.CHI, denoted as M-CHI, is proposed for improving the classification performance. The M-CHI first calculates the matching degree between the query pattern and each fuzzy rule. Then, the weighted consequence can be defined as the sum of all matching degree multiplied by the rule weighting value and the consequence value of the corresponding fuzzy rule. The weighted consequences are utilized to determine the final consequence value, which is expected to reach a higher prediction rate.
In the predictive analysis, the confusion matrix with two dimensions is employed to illustrate the prediction results, such as false positives, false negatives (FNs), true positives (TPs), and true negatives (TNs), which are further used to produce the parameters of prediction performance, including the precision rate, the recall rate, and the F-measure.
The rest of this article is organized as follows. In “Previous Works” section, the basics of the previous research methodology are introduced. The system model is presented in “The System Model” section. And then, the proposed M-CHI method is developed in “The Proposed Method” section. “Evaluation Results” section illustrates the results of performance evaluation of the M-CHI method compared with the original CHI method for different data transformation methods. Finally, last section concludes the paper.
Previous Works
Data mining is an analysis of supervised and unsupervised learning for huge amounts of data. A lot of techniques are used to extract a lot of valuable and potential information from the existing data, such as grouping by data clustering, detecting data outlier detection, and creating data relationship. And then, the results are represented and visualized by summarizing the data processing. This study explores students’ behavior patterns through four steps, including data collection, data preprocessing, data analysis, and results reporting (Romero, Ventura, & Garcia, 2008).
Data Collection
In the LMS, student materials, usage history, and interactive materials are stored in the database system. The R system is employed to access the log file of student learning activities from the Moodle system directly through the R MySQL suite.
Data Preprocessing
Data cleaning can improve the integrity of data in data analysis. Data preprocessing mainly consists of three steps: retrieving the required fields in the data file, normalizing or transforming each field, and eliminating the outliers of the data.
Data Analysis
There are a lot of data analysis techniques used in the education data mining, such as regression, classification, clustering, and correlation, in which the classification method is able to divide students into groups for distinguishing the pass and the fail of students.
Result Reporting
The final step is to provide the results and recommendations to instructors for identifying the potential students with poor learning status, in order to offer remedial courses to improve their learning performance.
Data Transformation
In the multi-index criteria system, it usually has different dimensions and orders of magnitude due to the different nature of each evaluation data. When the levels between the data vary greatly, the role of the higher value data in the comprehensive analysis will be highlighted if the analysis is performed directly with the original values. To ensure the process of the reliability of the results, therefore, the original data need to be standardized or transformed before data are analyzed.
The data transformation process mainly consists of two aspects: data homogenization processing and data dimensionless processing. The data homogenization process solves the problem of different nature of data. The direct combination of data with different nature cannot correctly reflect the comprehensive results. It is necessary to transform the nature of data, so that all of the data can be used to generate the correct result. The data dimensionless process mainly solves the comparability of data. After the transformation processing, the original data are converted into the value at the same quantity level, from which evaluation analysis can then be performed.
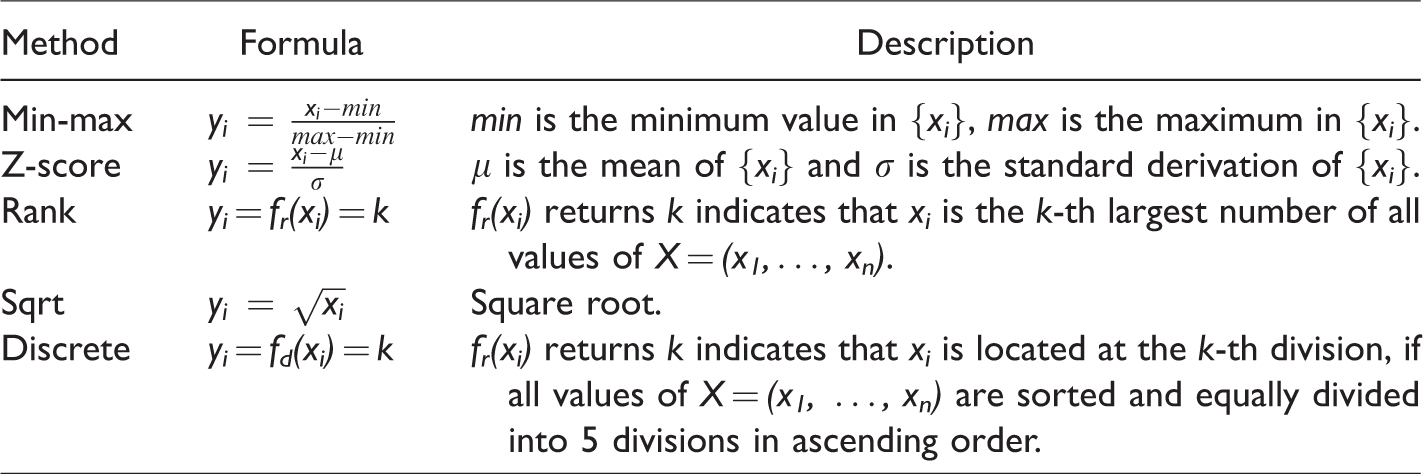
There are several common data transformation methods, including min-max normalization, zero-mean normalization, uniform distribution, discrete transformation, and square root (Alecu, Voloshynovskiy, & Pun, 2005; Jayalakshmi & Santhakumaran, 2011; Saranya & Manikandan, 2013; Shier, 2004; Weisstein, 2019), as shown in Table 1.
Five Common Data Transformation Methods.
Fuzzy Classification
The classification methods are mainly used to establish a decision-making model based on the student learning activity log data and the final grade of the course and to predict the learning outcomes of the students in the same course in the following semester. Among them, the final learning outcomes used in most studies are usually divided into pass and fail. By observing the log data of learning activities, however, the behaviors of the various learning activities of students falling on the borders between pass and fail are very similar.
If the training data of the model uses only the boundary between pass and fail to divide the learning behavior pattern, it will lead to relatively significant misjudgment. The learning activities of pass close to the boundary are in fact very similar to the learning activities of fail close to the boundary. However, as the distance between the grades and the boundaries increases, the similarity of learning activities between pass and fail will gradually decrease. Therefore, this study attempts to use the fuzzy classification method, in order to improve the accuracy of the prediction, and thus can achieve the effect of early warning.
The Mamdani model is a typical fuzzy method with multiple inputs and single output, representing the cause and result of the rules, as shown in Figure 1 (Mamdani, 1974; Mamdani & Assilian, 1975). The Mamdani model consists of four parts, including a fuzzer, a knowledge base, an inference engine, and a defuzzifier. The fuzzy interface converts the crisp value into the linguistic value. The knowledge base is composed of a database and a rule base, wherein the database has a definition of the fuzzy set and parameters of the membership function, and the rule base includes a set of fuzzy IF–THEN rules. The inference engine utilizes suitable fuzzy rules to infer the linguistic value. The defuzzification converts the inferred result into the crisp value as the final result.
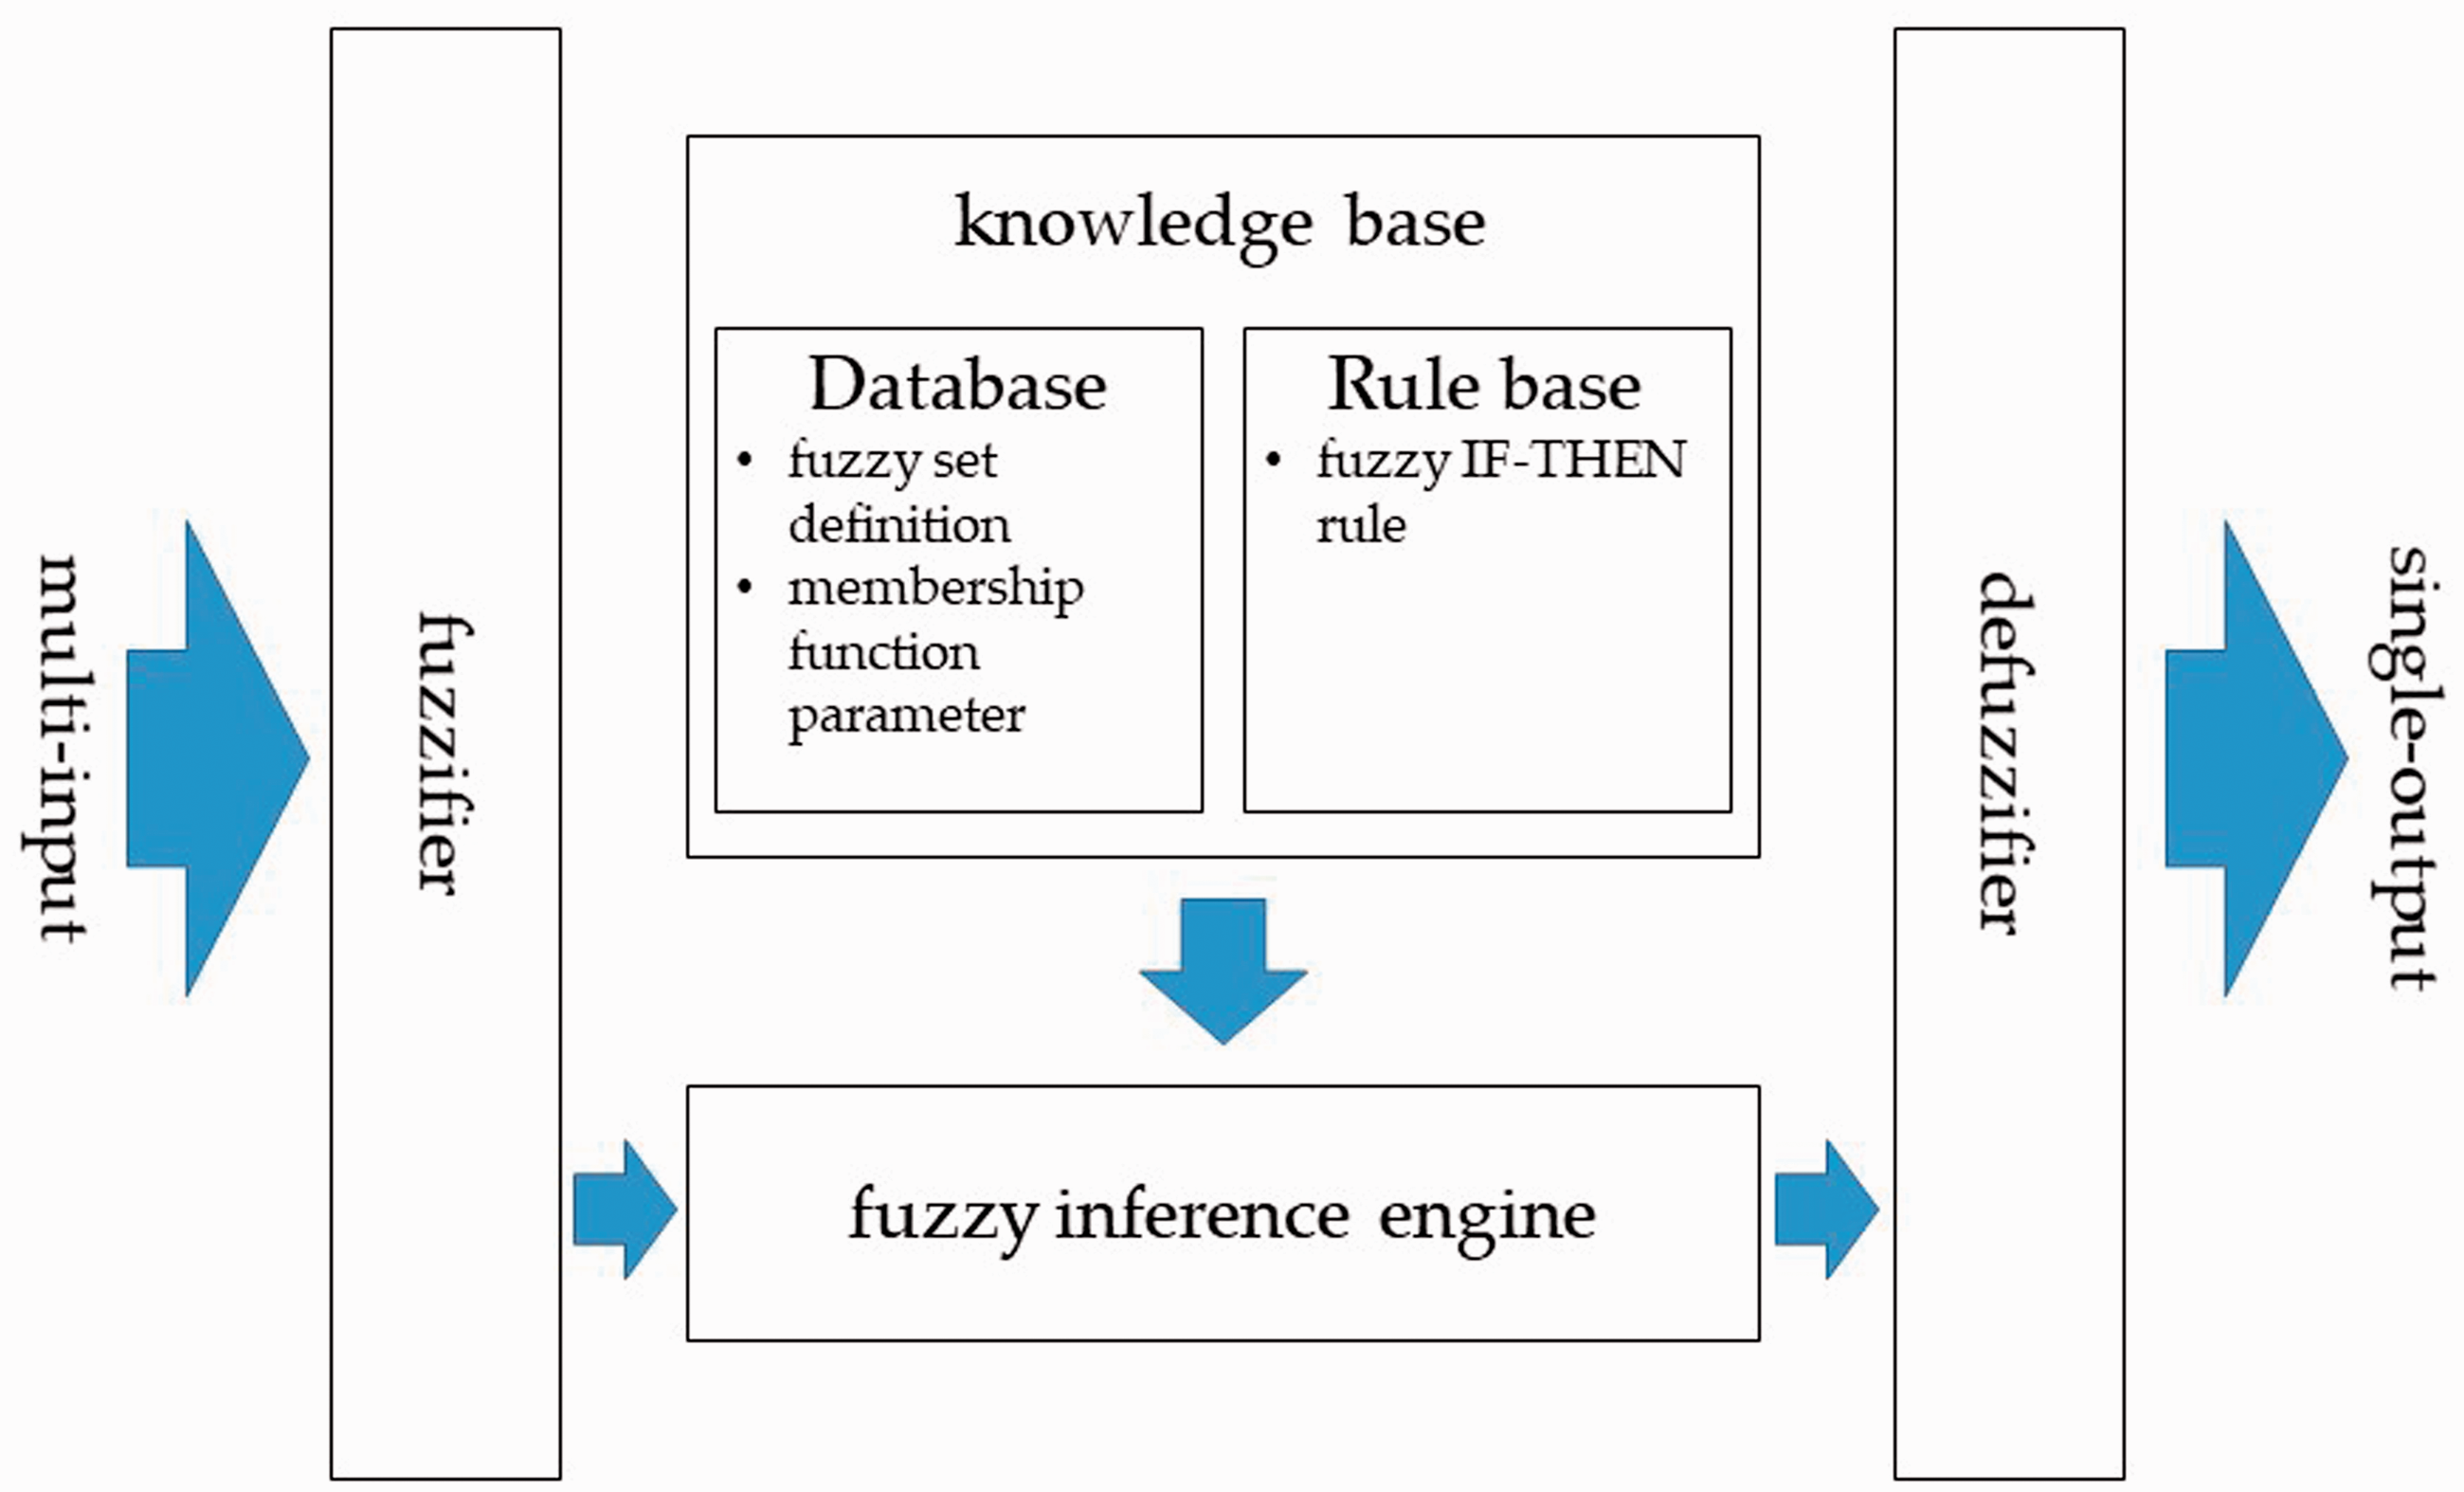
Mamdani model.
FRBCS.CHI method adopted in this study is the fuzzy rule-based classification systems based on Chi’s method to handle classification tasks. The FRBCS.CHI method, based on Wang and Mendel from Chi, Yan, and Pham (1996), proposes a scheme to solve the classification problem. The FRBCS.CHI method generates rules according to the techniques of Wang and Mendel and then replaces the consequent parts of the IF–THEN rule with class labels. The degree of each rule is calculated according to the antecedent part of the IF–THEN rule, and the redundancy rule is deleted according to the degree value.
The System Model
Moodle is an LMS, also known as a Course Management System or a Virtual Learning Environment, which is adopted to facilitate the education process of online learning, traditional classroom learning and blended learning, and to deliver a powerful set of learner-centric tools and collaborative learning environments to support MOOCs (Massive Open Online Courses; Liu et al., 2014).
Universities using the LMS have accumulated a lot of information, which has become an education gold mine that can be used to recognize and analyze the learning behaviors of students. The collected information in LMS can provide descriptions of all students’ learning activities, including reading, writing, and participation in exams or in different work assignments and learning missions, as well as communication between peers. As the magnitude of huge information is generated daily, it is difficult to use manual means to manage. Although the LMS platform provides some reporting tools, it is still not easy for teachers to employ the system to obtain valid information to effectively improve the quality of teaching.
This study is based on the student learning behavior data of the seven courses on the Moodle system to predict student learning outcomes. The system model is illustrated in Figure 2. The student learning behavior data of the 2016 semester (old semester) were used to establish a predictive model, while the learning behavior data of the 2017 semester (new semester) were used to test the accuracy of the predictive model. To achieve the early predictions, the student’s learning behavior data of the first 6 weeks in each semester were employed for this study.
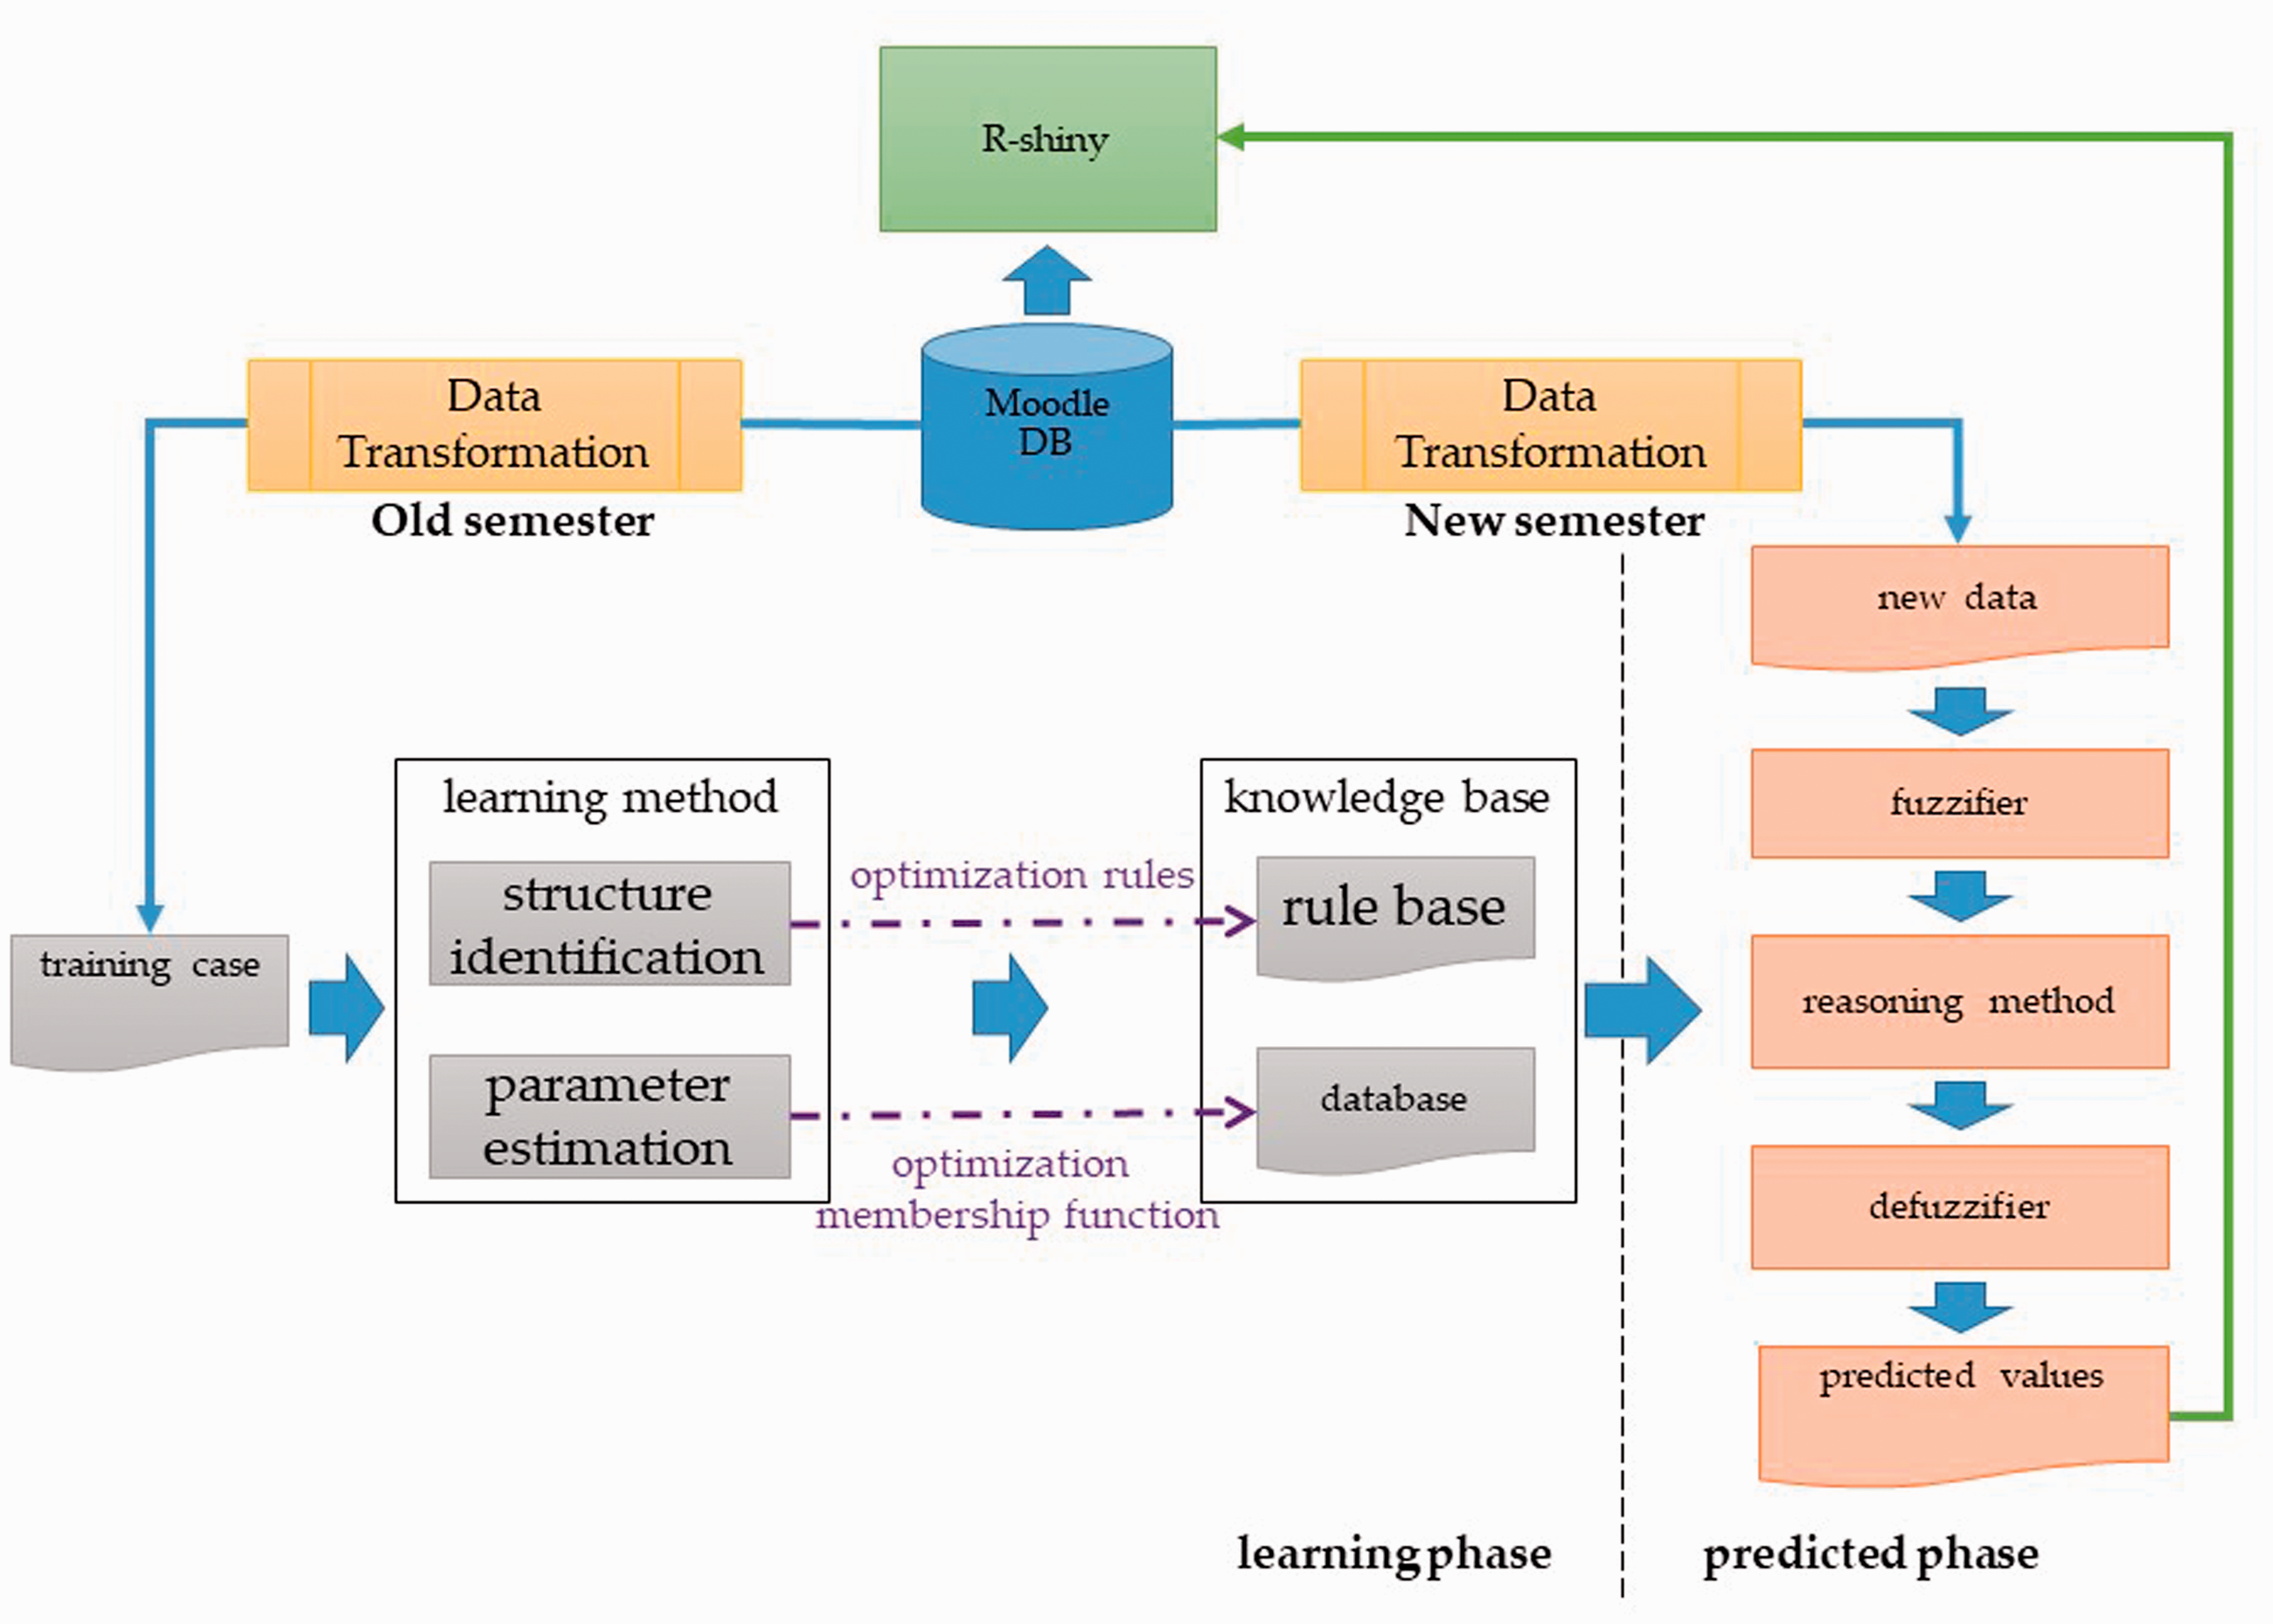
System model.
The student’s learning behavior data were retrieved from the log file in the database of the Moodle system. The training case was established from the student’s learning behavior data of the old semester following the data transformations, while the testing case was constructed from the student’s learning behavior data of the new semester after the same data transformations.
The operations of FRBCS can be divided into two phases, including the learning phase and the prediction phase, as shown in Figure 2. In the learning phase, structural identification and parameter evaluation are generated by using the training data (Pedrycz, 1996; Sugeno & Yasukawa, 1993), whereby the fuzzy rules and the membership functions are automatically generated and stored in the database and the rule base, respectively. In the prediction phase, the testing data are first converted into fuzzified data. Then, based on the fuzzy rules and membership functions in the knowledge base, the fuzzified data are inferred by the inference mechanism into the predicted data, which thereafter are transferred to crisp data through the defuzzification process.
The Proposed Method
The proposed algorithm consists of five phases, including the retrieval of learning activity data from the Moodle database, the cleaning and aligning of data, the transformation of data, the fuzzy classification, the hybrid scheme, and the establishment of a confusion matrix. 1. #Data retrieval con = dbConnect(MySQL(),user = ‘admin’,password = ‘xxxxx',dbname = ‘moodle',host = ‘localhost’) data2016 = dbReadTable(con, “mdl_log 2016”)[,c(1:8)] data2017 = dbReadTable(con, “mdl_log 2017”)[,c(1:8)] 2. #Data clean and alignment d1<-cleanData(data2016); d2<-cleanData(data2017); sem1<-alignColumn(d1,d2); sem2<-alignColumn(d2,sem1) 3. #Data transformation trainCase<-dataTrans(sem1); testCase<-dataTrans(sem2); 4. #Model establishment and Prediction model <- frbs.learn(trainCase, trainCase.range, method.type = “FRBCS.CHI”, control = list(num.labels = 3)) pred <-predict(model, testCase) 5. conMat<-table(pred,real) prate<-round(prop.table(conMat,1),2) #precision rate rrate<-round(prop.table(conMat,2),2) #recall rate
In prediction phase, the original FRBCS.CHI prediction algorithm, denoted as CHI, first calculates the matching degree of each fuzzy rule for each query pattern in testing case, denoted as Qi = (qi,1, qi, 2, … ,qi,K) and then the consequence class of the fuzzy rule with the maximum matching degree will be assigned as the consequence class (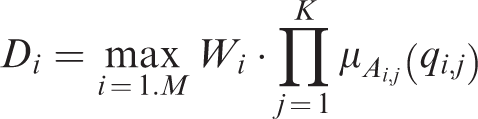
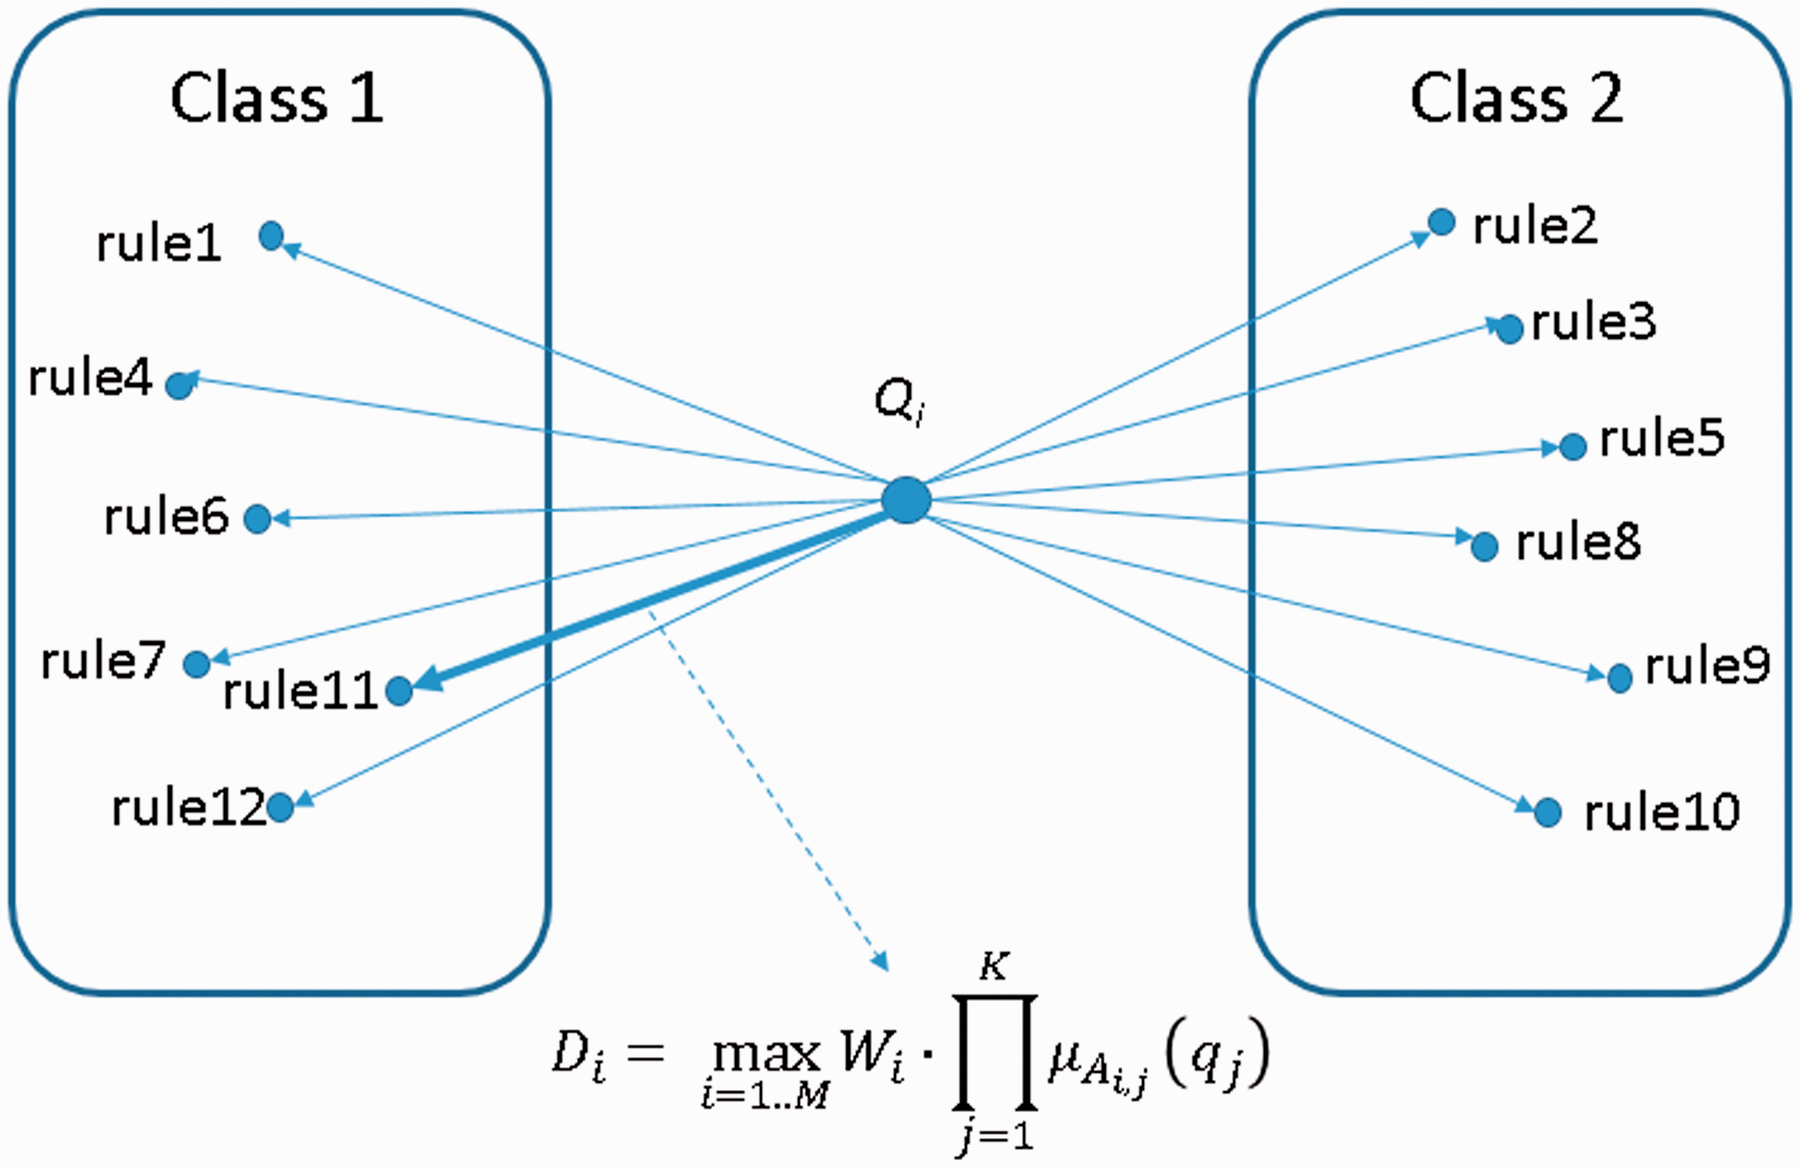
FRBCS.CHI method.
The classification method of M-CHI as shown in Figure 4 is constructed for improving the prediction performance. The M-CHI first calculates the matching degree between the query pattern and each fuzzy rule. Then, the weighted consequence can be defined as the sum of all matching degree multiplied by the rule weighting value and the consequence value of the corresponding fuzzy rule, as shown in Equation 2. All of weighted consequences (U1 … Ut) are sorted in ascending order to become (V1 … Vt). Any Vh value is lower than or equal to the threshold will be classified as fail, while any Vh value is higher than the threshold will be classified as pass. The threshold can be defined as the ratio of failing students (T1) to the total students (T1 + T2) in the training case.
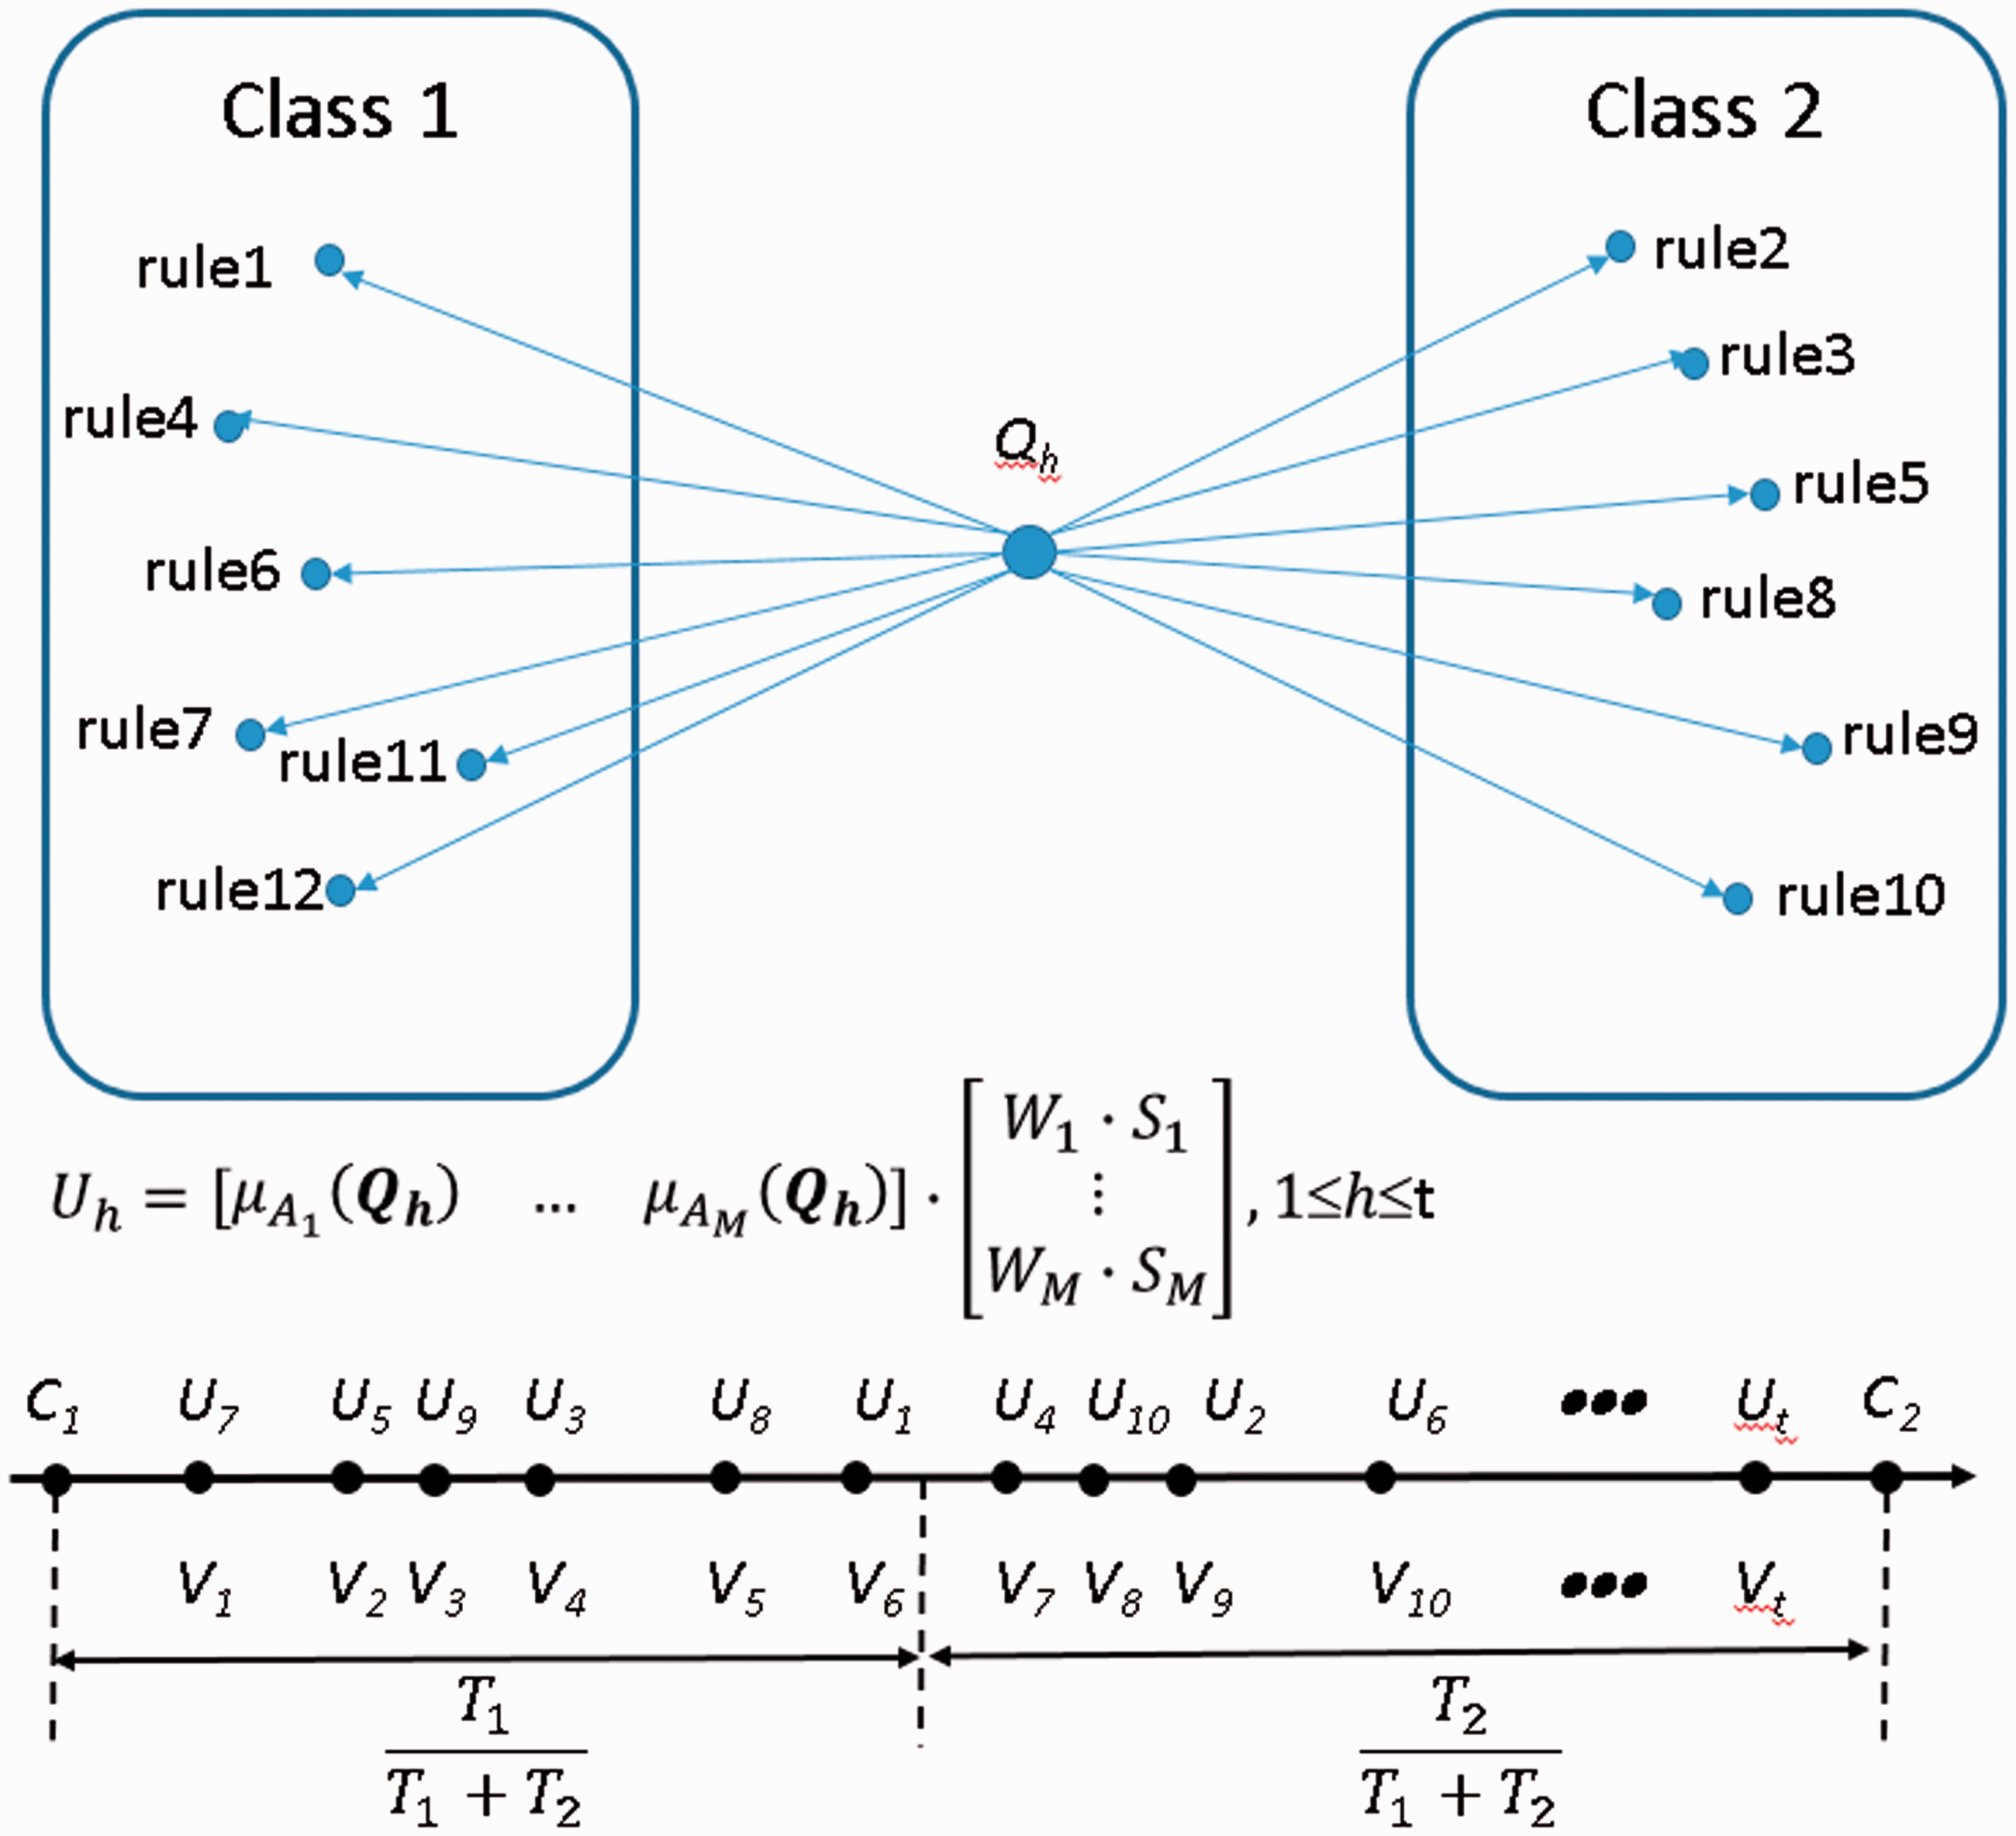
The proposed M-CHI method.
Let R1: If R2: If … RM: If 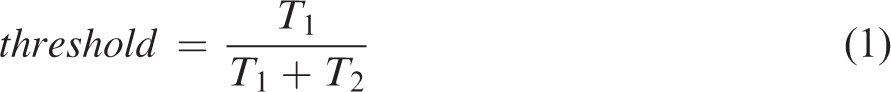
Let t be the number of query patterns and 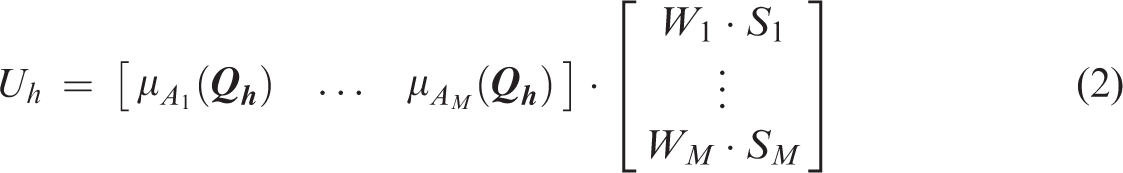
The matching degree 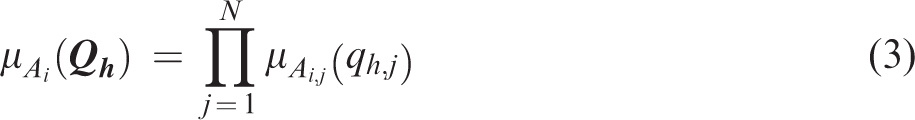

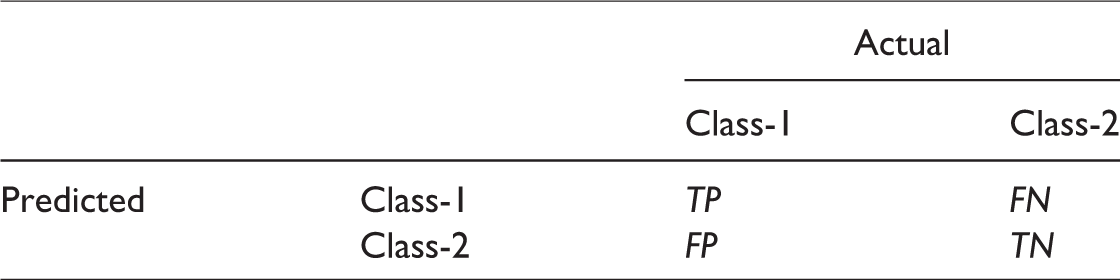
Moreover, the confusion matrix can be defined as 2 × 2 matrix for presenting the results of a binary-class pattern classification problem, as shown in Table 2, in which Class 1 indicates the learning status of fail, and Class 2 indicates the learning status of pass. The TP indicates the number of instances that are predicted as positive (fail), which is true. The TN indicates the number of instances that are predicted as negative (pass), which is true. The false positive indicates the number of instances that are predicted as positive (fail), which is false. The FN indicates the number of instances that are predicted as negative (pass), which is false.
Confusion Matrix.
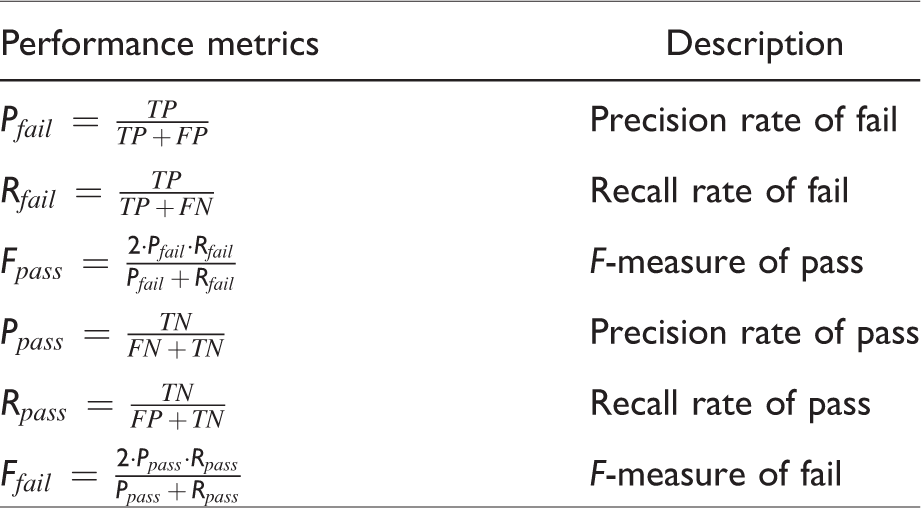
The performance metrics are shown in Table 3 in which Precision indicates the proportion of instances that are truly of a class divided by the total instances classified as that class, and Recall indicates proportion of instances classified as a given class divided by the actual total in that class. Pfail indicates the precision rate of the instances of fail, Rfail indicates the recall rate of the instances of fail, Ffail indicates the F-measure of the instances of fail, Ppass indicates the precision rate of the instances of pass, Rpass indicates the recall of instances of pass, and Fpass indicates the F-measure of instances of pass.
Performance Metrics.
Evaluation Results
The R software was utilized for the whole process of data mining, including the data retrieval, the data clearing, the data transformation, and the predictive analysis.
In the data cleaning phase, student data such as low activity, school dropout, and zero points were excluded. In the data transformation stage, five methods are used to convert original data, including Rank, SQRT (Square Root), Z-score, discrete, and Min-Max. Next, in the data analysis phase, the FRBCS.CHI method in the frbs package of R language was adopted to build the model and predict the results. Student learning data for the 2016 semester year were applied to the fuzzy classification method for the establishment of the predictive model. After that, the learning data for the 2017 semester year were submitted to the predictive model to predict the student status of pass and fail in the 2017 semester year. In this study, two kinds of fuzzy classification methods are used to compare the performance of prediction, including the FRBCS-CHI (denoted as CHI) and the Modified FRBCS-CHI (denoted as M-CHI). Finally, the predicted results compared with the actual situation are shown by using three kinds of performance parameters, including the Precision Rate, the Recall Rate, and the F1-measure, for two kinds of results, pass and fail.
Figure 5 illustrates the performance comparisons between CHI and M-CHI for seven courses (denoted as A, B, C, D, E, F, and G) by using the distribution of prediction accuracy of Pfail, Rfail, Ffail, Ppass, Rpass, and Fpass which is based on the data produced from five data transformation and the original data. Although the distribution of performance of prediction accuracy is quite different for different courses and for different evaluation parameters, the performance of the M-CHI method in most cases is better than that of CHI method.
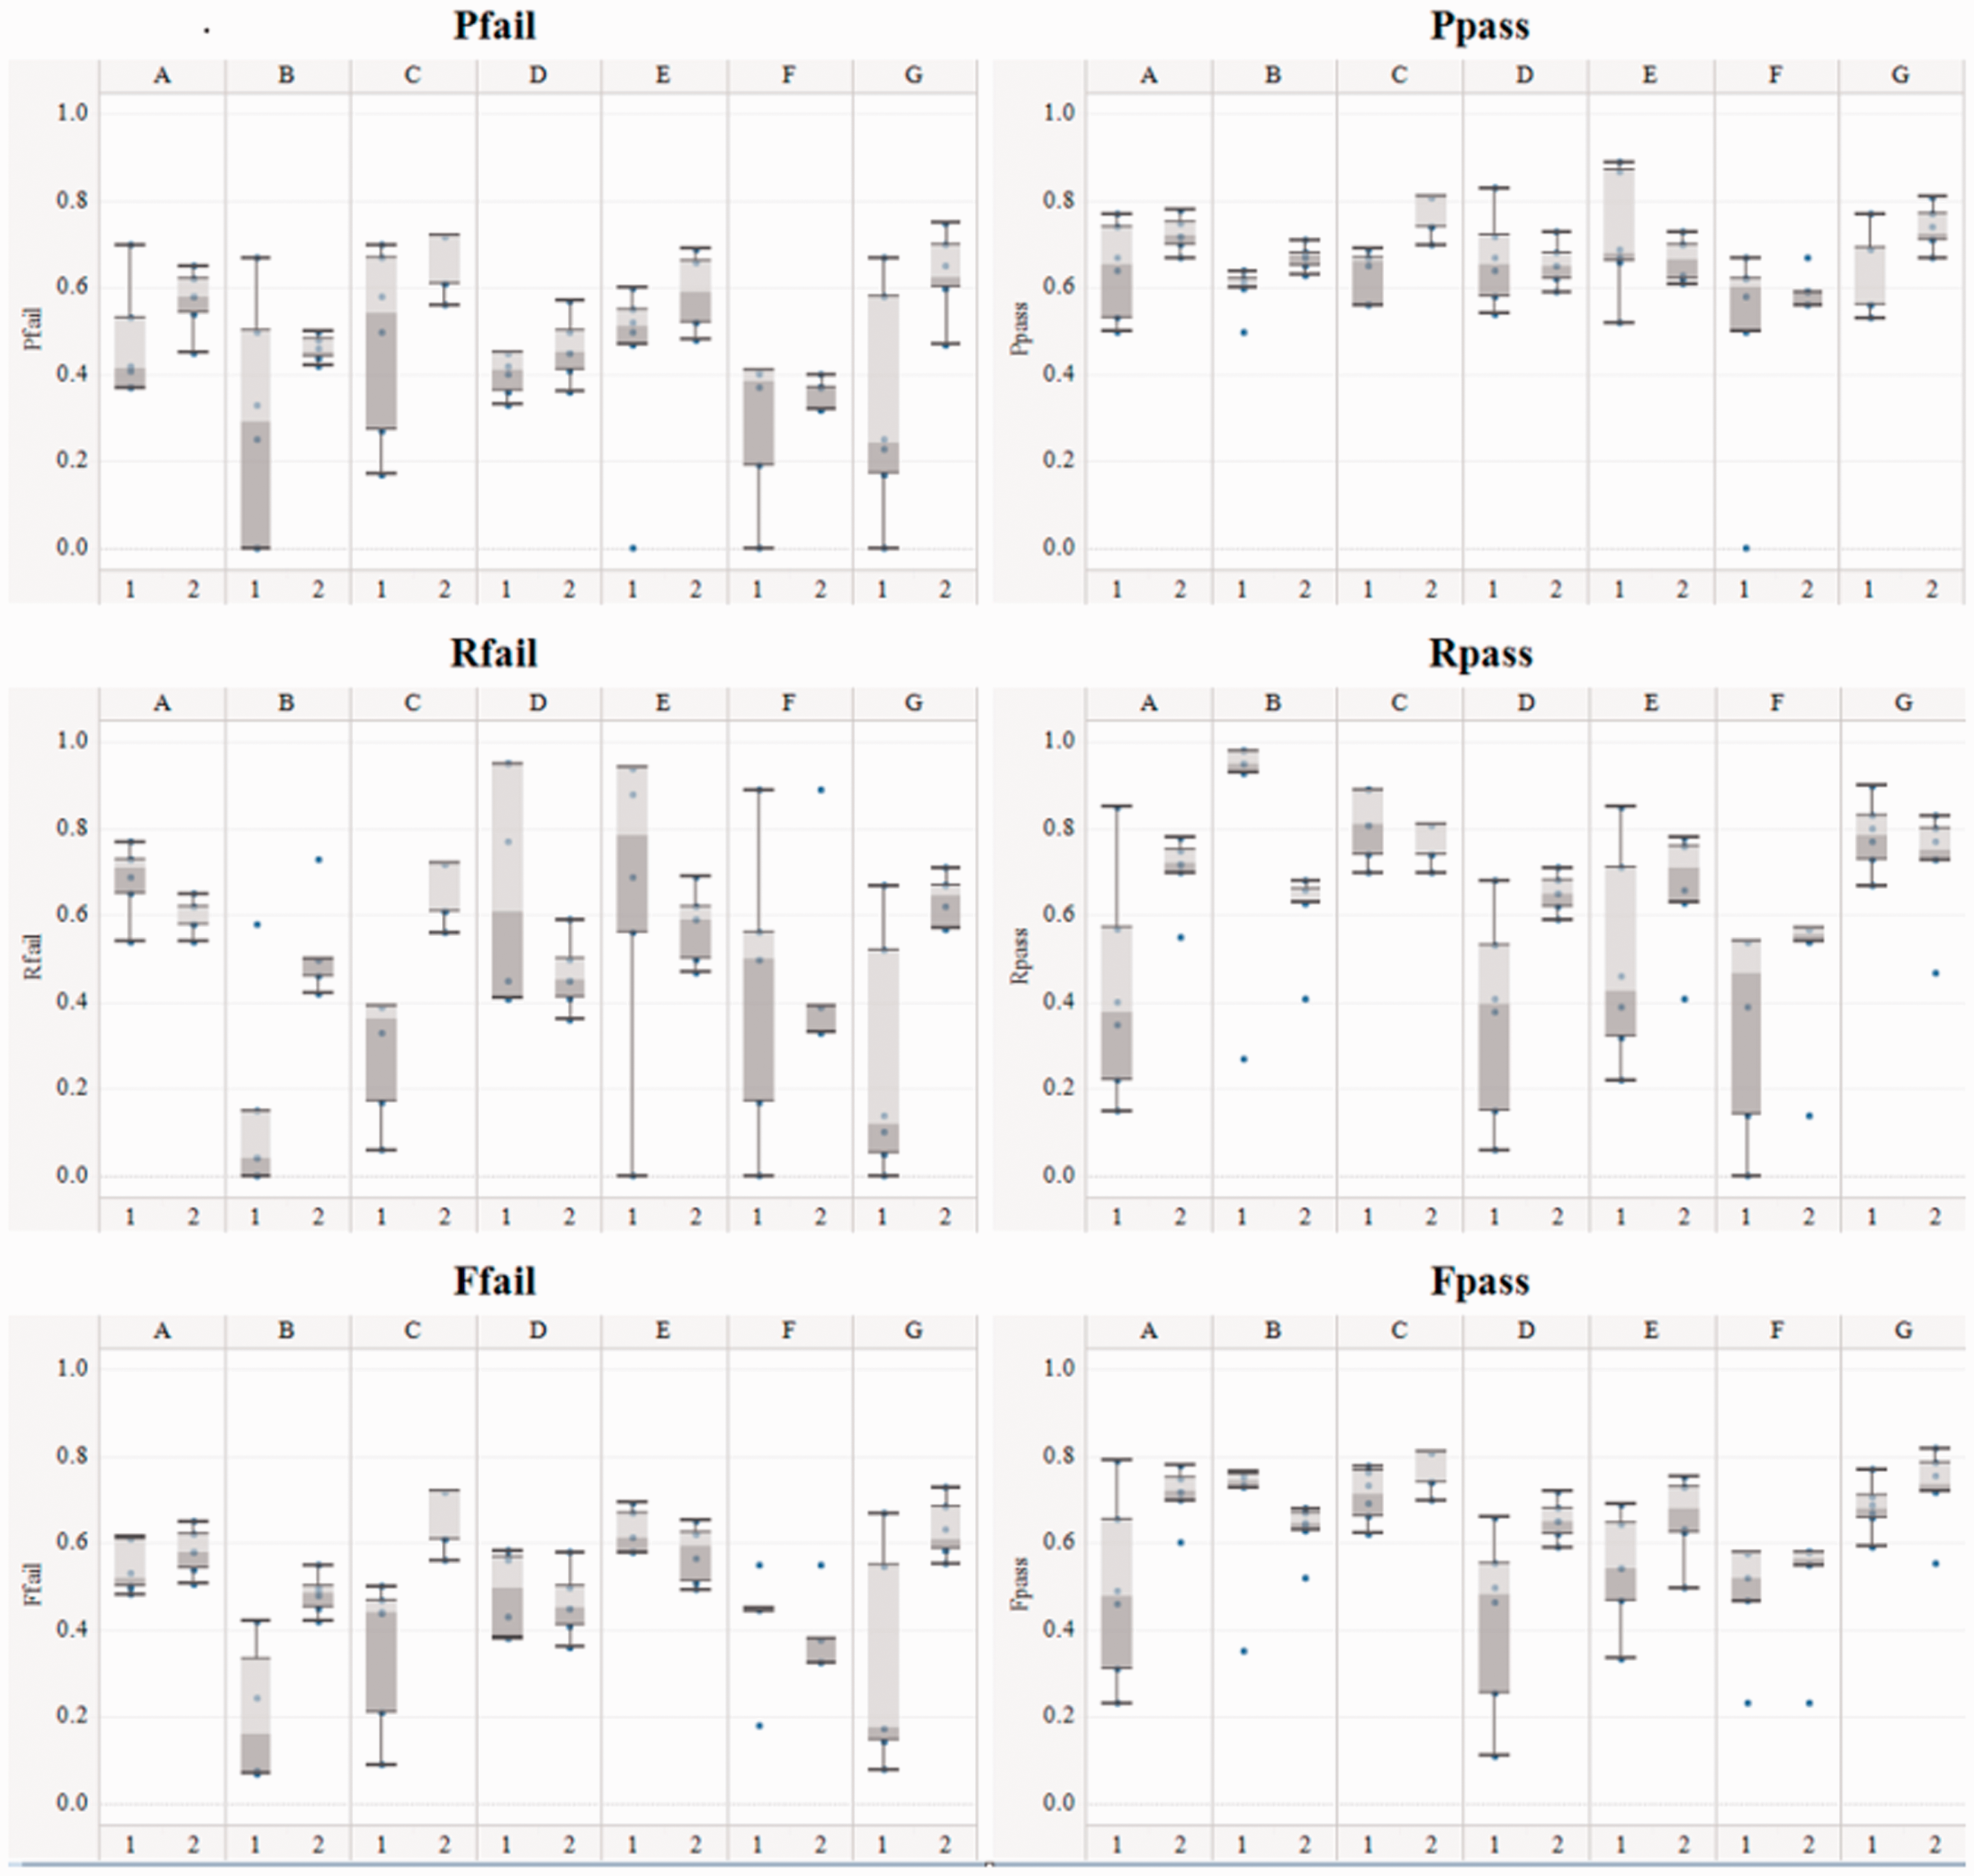
The comparison of prediction accuracy for CHI(1)and M-CHI (2) for each prediction parameter and each courses.
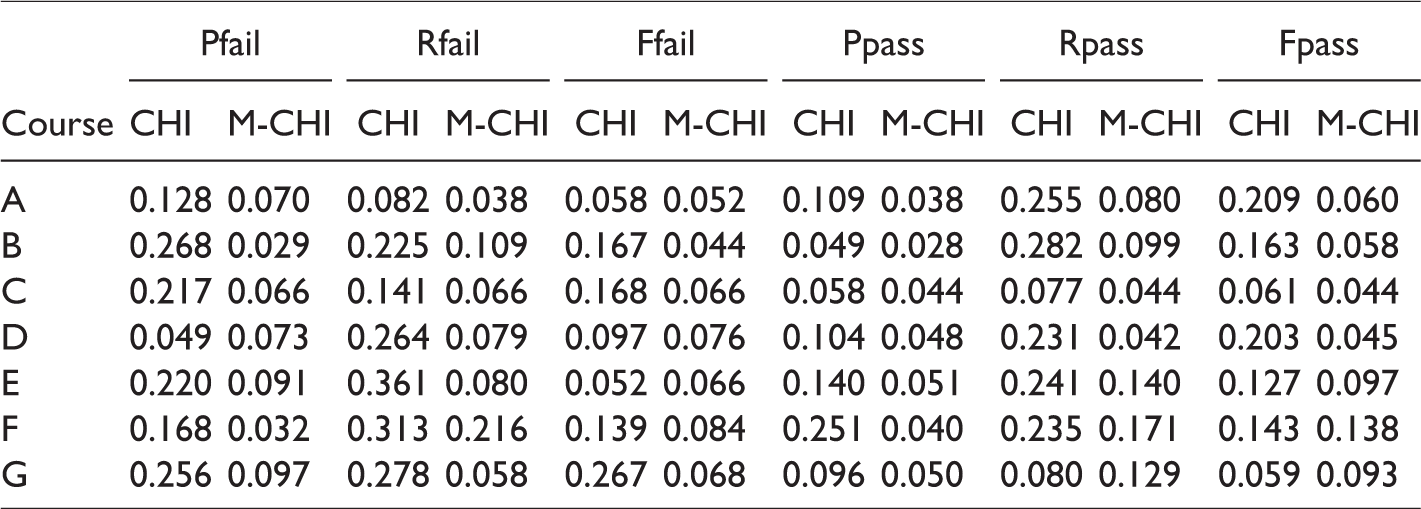
The comparison of prediction accuracy between CHI and M-CHI is shown in Figure 6 by using six parameters of prediction accuracy, including Pfail, Rfail, Ffail, Ppass, Rpass, and Fpass. From box plots of Figure 6, it is evident that M-CHI much better than the CHI, since the median value of each prediction parameter of M-CHI is higher than that of CHI. In addition, the performance of M-CHI is relatively stable, because the prediction accuracy produced by M-CHI is relatively concentrated, and the prediction accuracy produced by M-CHI is relatively scattered. Table 4 illustrates the standard deviation of prediction accuracy for CHI and M-CHI and six kinds of performance parameters, including Pfail, Rfail, Ffail, Ppass, Rpass, and Fpass. It is shown that most of the standard deviation of M-CHI method is much lower than that of CHI method.
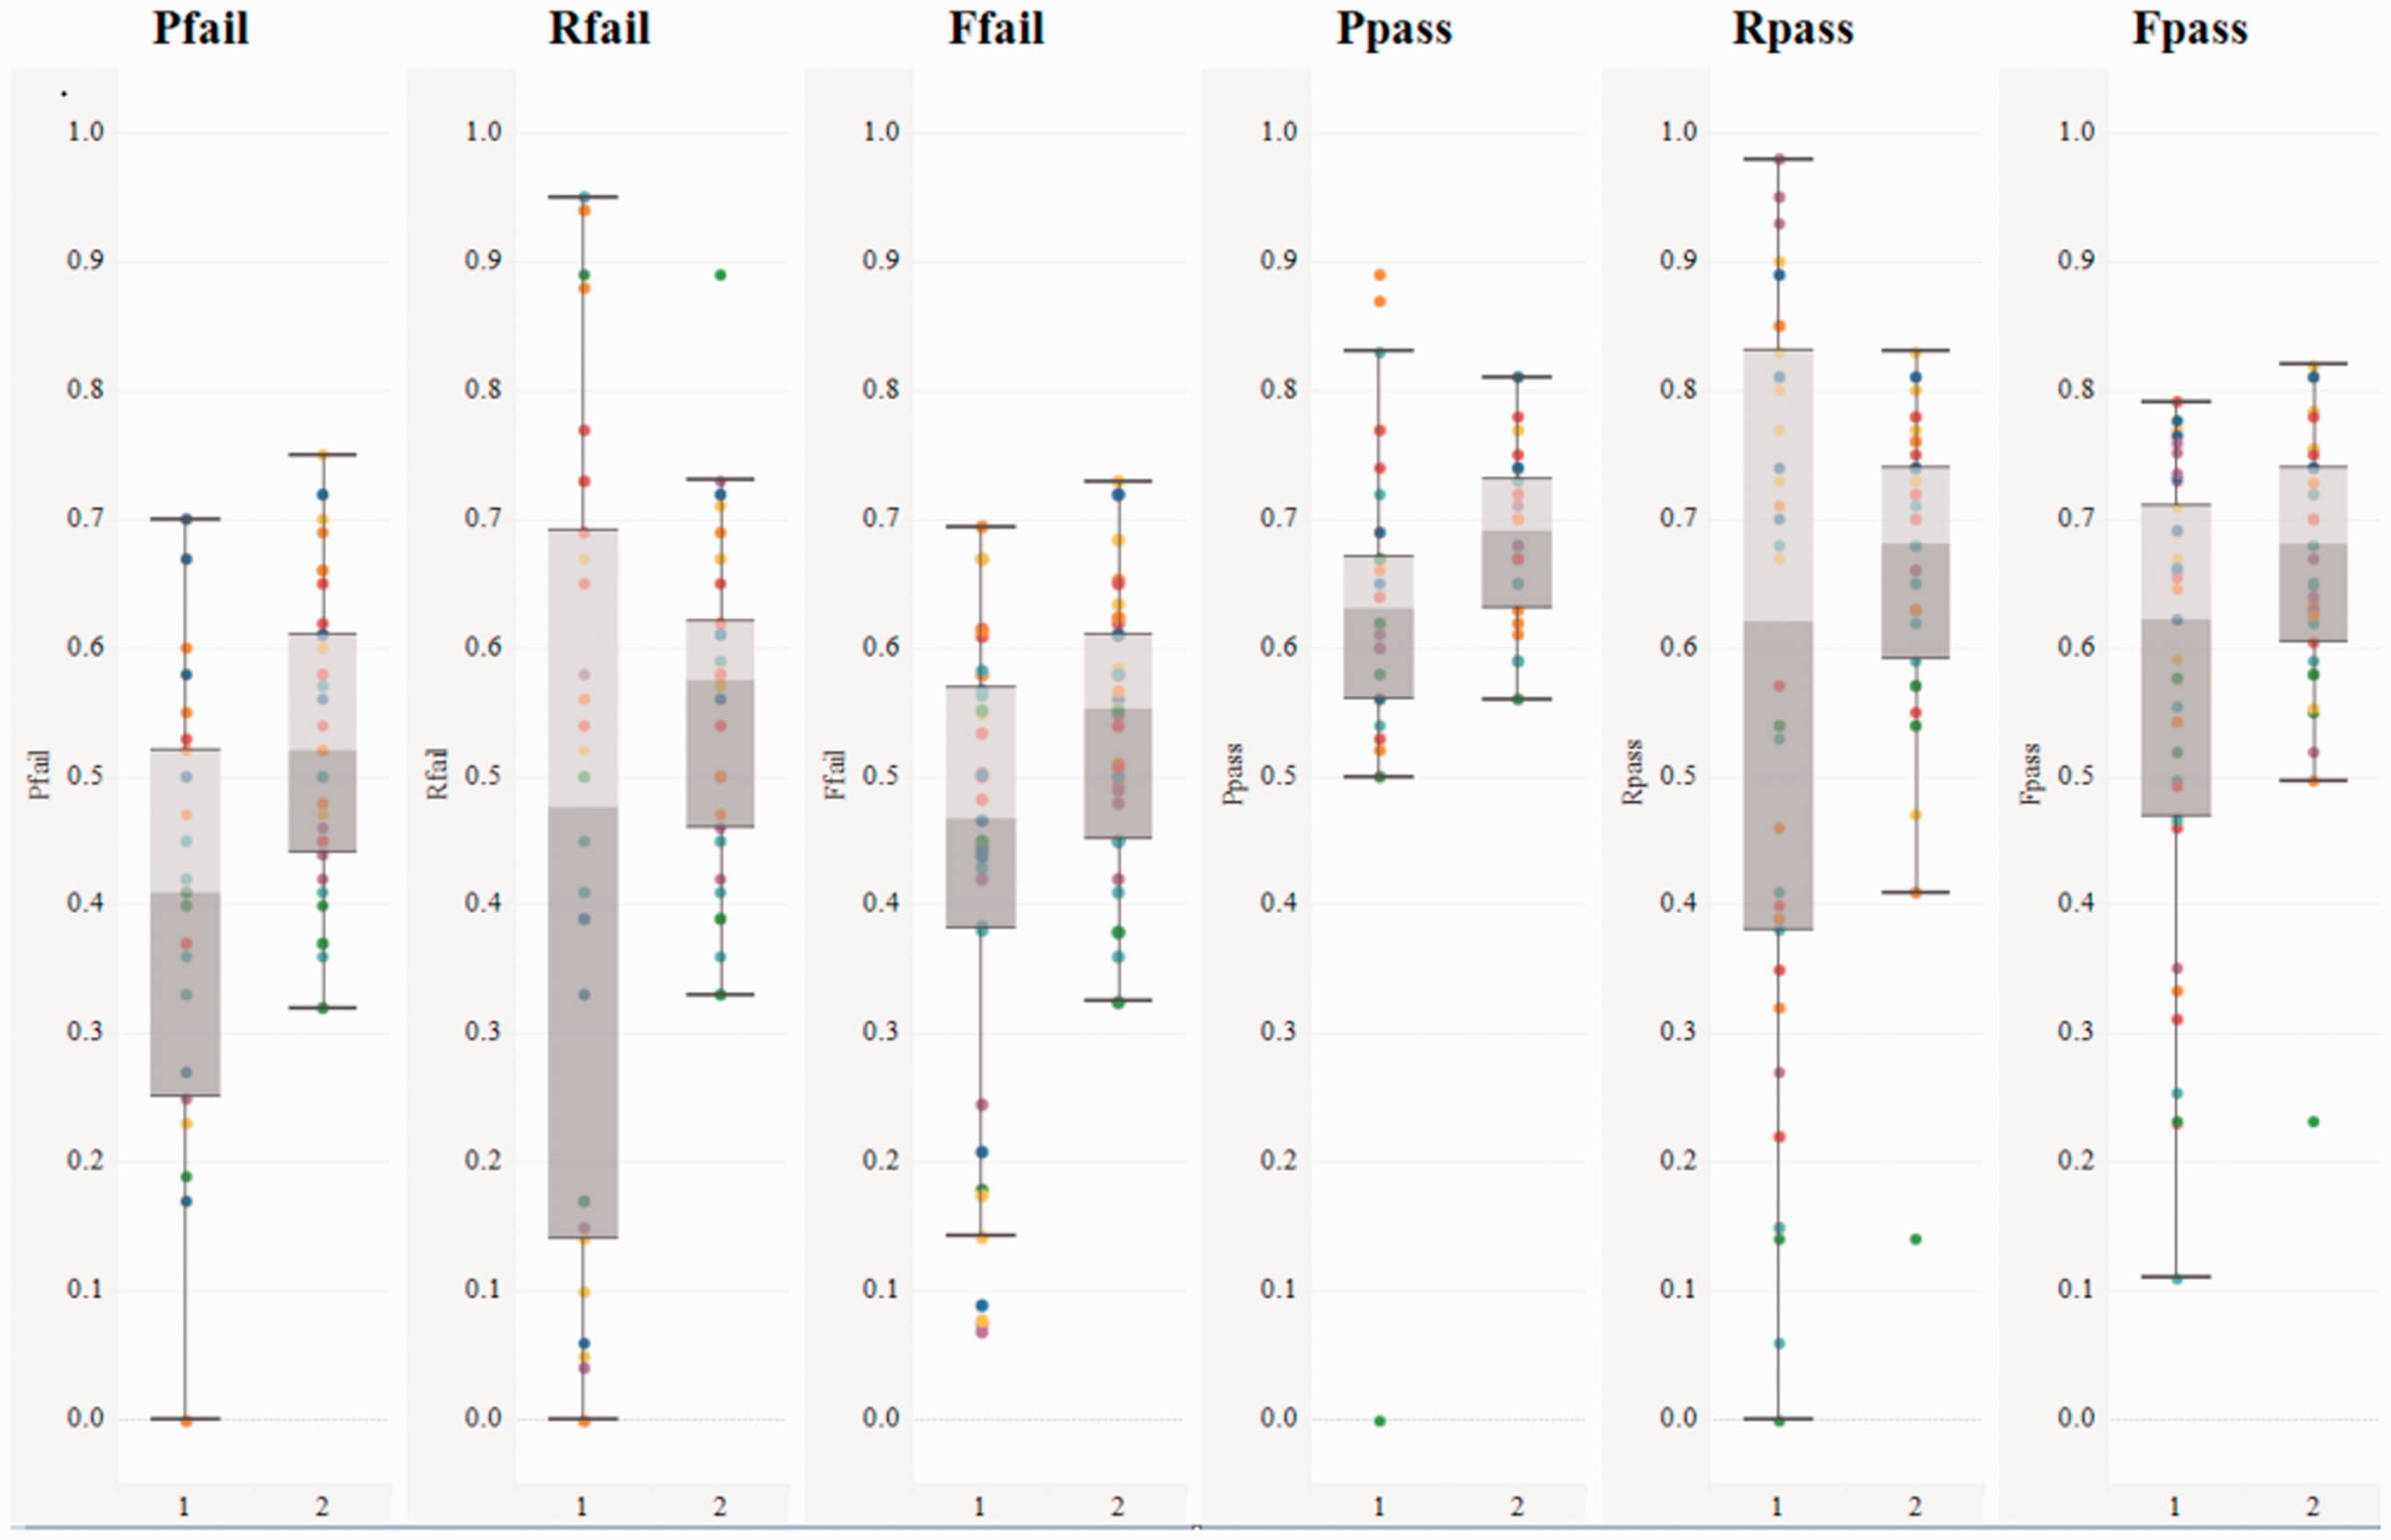
The comparison of prediction accuracy between CHI(1) and M-CHI(2) for each parameter of prediction accuracy.
The Standard Deviation of Prediction Accuracy for CHI and M-CHI.
The comparison of the number of wins between CHI and M-CHI is shown in Figure 7 by using six performance parameters of prediction accuracy, including Pfail, Rfail, Ffail, Ppass, Rpass, and Fpass. For each performance parameter, there are totally 42 cases from the combination of six data transformation and seven courses. The performance between CHI method and M-CHI method can be evaluated by calculating the number of wins of each method from 42 cases for each performance parameter. Evidently, the number of wins of M-CHI method is fully superior to that of CHI method. On the Pfail parameter, the M-CHI algorithm performs better than the CHI algorithm in 79.8% of cases. On the Rfail parameter, the M-CHI algorithm performs better than the CHI algorithm in 56% of cases. On the Ffail parameter, the M-CHI algorithm performs better than the CHI algorithm in 84.5% of cases. On the Ppass parameter, the M-CHI algorithm performs better than the CHI algorithm in 75% of cases. On the Rpass parameter, the M-CHI algorithm performs better than the CHI algorithm in 61.9% of cases. On the Fpass parameter, the M-CHI algorithm performs better than the CHI algorithm in 67.9% of cases. In summary, the M-CHI method is superior to CHI-method in 70% of cases.
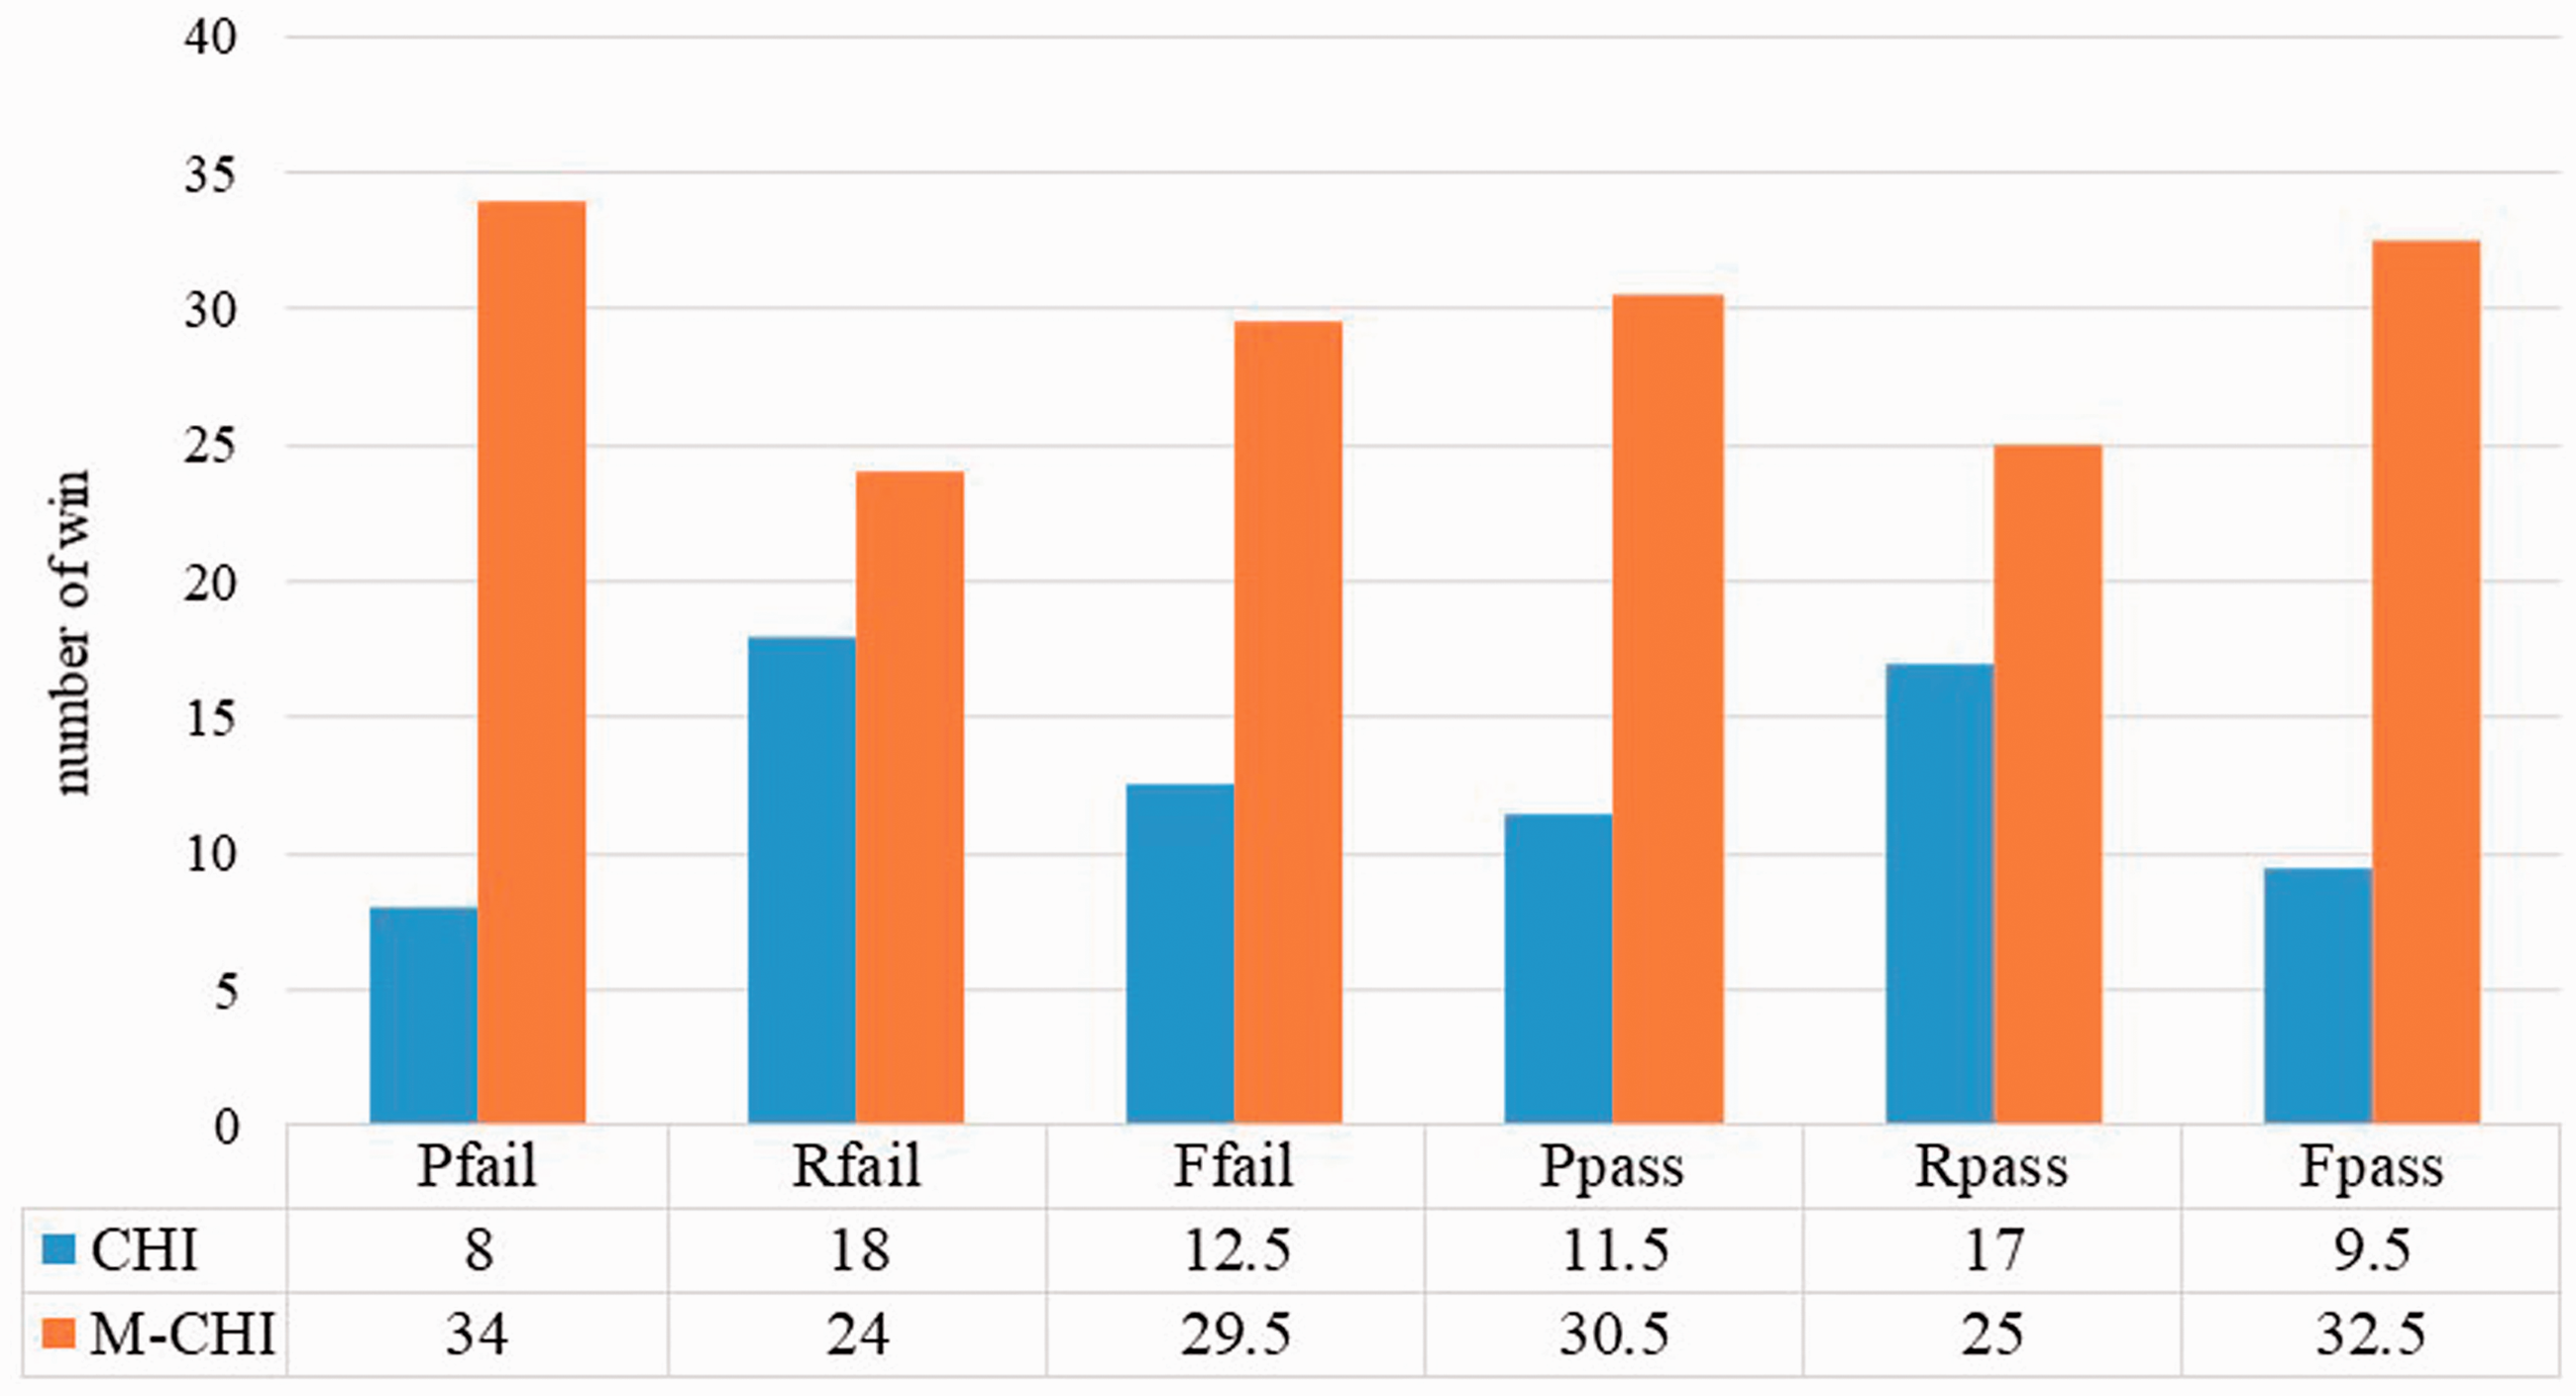
The number of wins between CHI and M-CHI.
Table 5 shows the performance of prediction accuracy for different courses and different methods. The column with the name marked with 1 uses the CHI method, and the column with the name marked with 2 uses the M-CHI method. It also illustrates the prediction ranking of various methods under the same performance parameter. From the average ranking, the prediction ranking of the M-CHI method is from 4.17 to 6.0, while the prediction ranking of the CHI method is from 6.57 to 7.46. Therefore, the M-CHI method is clearly superior to the CHI method.
The Prediction Accuracy and Rank of Different Courses and Different FRBCS Methods.
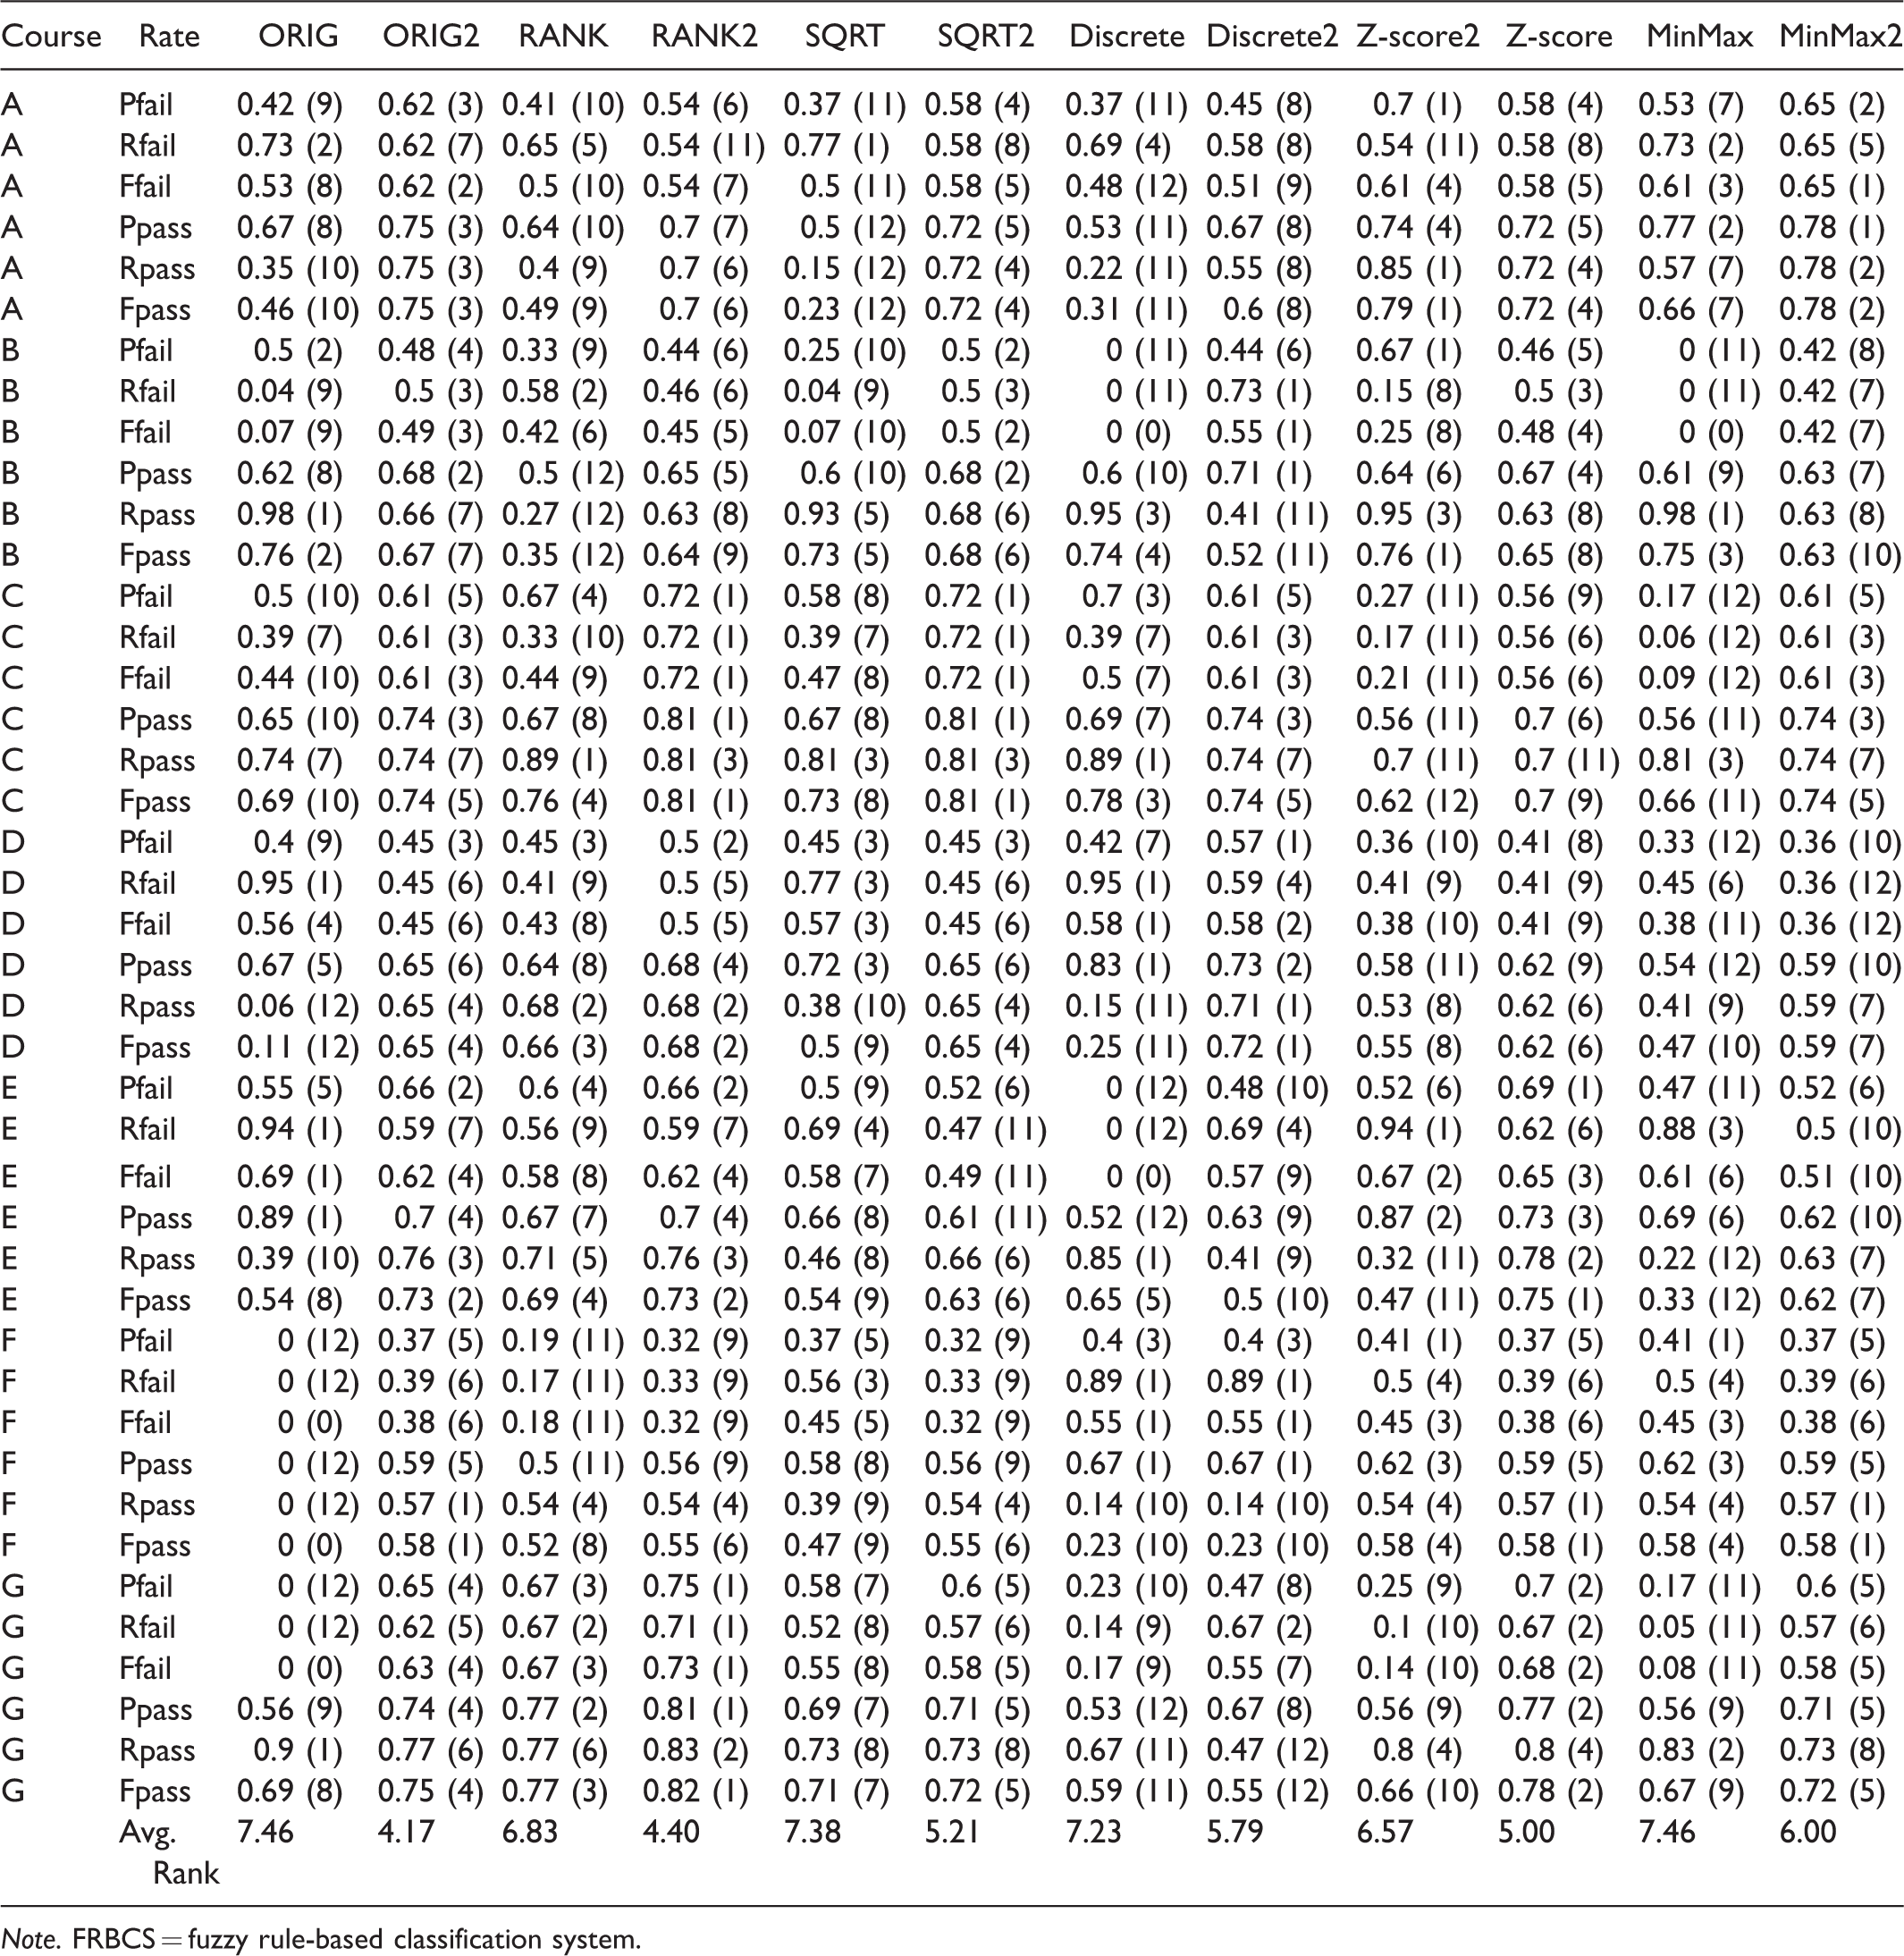
Note. FRBCS = fuzzy rule-based classification system.
This study is based on 2017 learning activities as a training case, and the same course in 2018 as a testing case. It is obvious that the sample is from different students from 2 academic years. To achieve generalization, we have standardized the 2-year student learning activities using five transformation methods. From the experimental results, the results of the predictions will be greatly improved through five transformation methods. In other words, even if the student samples are retrieved from 2 academic years, the results of the prediction will be greatly improved through the normalization of the five transformation methods. As shown in Figure 7, the proposed M-CHI is more efficient than the original CHI in all performance indicators. As shown in Table 4, the proposed M-CHI is much more stable in performance than the original CHI in all indicators. Table 5 shows further that the M-CHI method is more efficient than the original CHI, no matter what transformation method is used. Therefore, the experimental results prove that the M-CHI method is more efficient than the original CHI and can significantly enhance the prediction performance, no matter what transformation method is used.
In this study, the 2017 student class learning activities were used as a training case, while the student learning activities of the same course provided by the same teacher in 2018 were used in a testing case. The number of students in both classes was about 50. Since there is only 1-year interval between the training case and the testing case, the class content and the arranged learning activities will not be much different. Therefore, according to the results of the experiment, the proposed scheme is more suitable for the situations where the teaching content is in a nearly identical fashion between the training case and the testing case. In addition, if there are relatively large training cases, the prediction results will be more accurate.
The instructor indeed is an additional variable in this analysis. If different teachers teach a course of the same content and have the same learning activities and consistent scoring methods, the proposed model can be directly employed to predict the student’s learning outcomes and will have a good performance of prediction. If different teachers teach a course of the same content, but the learning activities and scoring methods are different, it will cause a great influence on the training case and the testing case, which will produce a considerable difference between them. In this manner, the accuracy of the established prediction model would be significantly reduced.
Conclusions
This study is an attempt to systematically predict a student who may fail a course according to the data from the first third of a semester. In summary, it is shown that the M-CHI method has the characteristics of high stability and highest efficiency from the comparisons of the precision rate, the recall rate, the F-measure, the standard derivation, and the average rank. Moreover, the study also found that the data transformation of learning data has a great influence on the prediction accuracy of the fuzzy classification method. This is due to the fact that the training case and the testing case after data transformation tend to be consistent in their data distribution, which proves that the data preprocessing possesses the critical position on the accuracy of cross-semester prediction. Moreover, the predictions of early warning allow teachers to identify students with poor learning performance in the first third of the semester and then actively conduct academic counseling in the early stages to help students achieve the learning targets at the end of the semester.
However, while the five transformation methods, and the M-CHI method, have significantly improved the predictions of student learning outcomes, we believe that there are still many challenges in finding ways to generalize and refine these techniques in the future.
Besides, the formative assessment proposed in this article can systematically feedback the student’s learning situation to the teachers. Based on this feedback, teachers can intervene in the way students learn, or modify the way they teach. Therefore, in the future, these students identified by the system as “at risk” could be subject to further study, to assess whether the learning outcome did eventually improve after teacher intervention. In addition, teachers can use a variety of interventions, and the effectiveness of these interventions is also an important direction for future research.
Footnotes
Declaration of Conflicting Interests
The authors declared no potential conflicts of interest with respect to the research, authorship, and/or publication of this article.
Funding
The authors received no financial support for the research, authorship, and/or publication of this article.