
Abstract
Social media platforms provide large-scale, naturally occurring data that enable researchers to examine public discourse and interaction patterns around major societal issues. Focusing on the late pandemic period, this study investigates how Twitter users discussed online learning by combining social network analysis and sentiment analysis. Tweets posted between July 1 and November 28, 2021 were collected using predefined hashtags and search terms in English and Turkish, resulting in a dataset of 6,070,574 tweets. After data cleaning and integration, network structures were modelled through retweet and mention relationships, and key social network metrics (e.g., node and edge counts, average degree, modularity, and network diameter) were computed and visualized using sociograms. In parallel, users’ emotional orientations were examined via dictionary-based sentiment analysis, classifying tweets as positive, negative, neutral, or mixed. Findings show that online learning discussions form clustered interaction patterns that vary by hashtag density and language, while neutral sentiment dominates overall with variations across terms.
Keywords
Introduction
With the COVID-19 pandemic, educational institutions worldwide (Dwivedi et al., 2020), including those in Türkiye, closed schools and continued educational activities through online learning environments in accordance with pandemic restrictions (Wang & Zhao, 2020). The sudden global transition triggered by the pandemic (Ahmad & Zabadi, 2020; Dilmaç, 2020) led to a rapid increase in the number of individuals using online learning environments (Kamble et al., 2021). While online learning enabled the continuation of education during this period, it also generated several challenges. Studies reported that teachers and learners experienced social isolation, stress, and anxiety during prolonged periods of remote education (Wang & Zhao, 2020), as well as various emotional and psychological difficulties (Aristovnik et al., 2020; Magson et al., 2021). At the same time, this radical transformation created social, psychological, and economic pressures on learners (Cao et al., 2020), teachers, and school leaders (Karakose et al., 2022). Thus, while the education system attempted to adapt to online learning environments, it also had to cope with these emerging pressures.
The most intensive phase of the pandemic lasted approximately one and a half years. By 2021, countries had entered a gradual recovery period (International Monetary Fund, 2022), and vaccination rates increased following the development and global distribution of COVID-19 vaccines (World Health Organization, 2021). In Türkiye, three different vaccines had been approved by June 2021, and increasing vaccination rates enabled a gradual return to face-to-face education. Nevertheless, despite fluctuations in case numbers caused by emerging variants, global case numbers remained high during this period (World Health Organization, 2021). During this period, social media platforms such as Twitter, Facebook, and YouTube functioned as important spaces where individuals shared their experiences, concerns, and opinions about online learning, contributing to the broader social media discourse on online education.
This study investigates discussions about online learning on the Twitter social network during the late pandemic period from two complementary perspectives. First, it examines the structural characteristics of networks related to online learning discussions using social network analysis. Second, it explores the emotional orientations of users toward online learning through sentiment analysis.
According to Marin and Wellman (2011), social networks consist of nodes connected through one or more types of relationships. These nodes-representing individuals, groups, or organizations-form the fundamental units through which interactions occur (Marin & Wellman, 2011). Social media platforms such as Twitter, YouTube, Instagram, and Facebook provide environments where such connections become visible and measurable. Boyd and Ellison (2007) define social media platforms as web-based services that allow individuals to create public or semi-public profiles and interact with others within a bounded system. Within these networks, users establish connections, share content, and follow interactions among other users. The structure and characteristics of these connections vary depending on the platform. In this study, Twitter-one of the most widely used social media platforms worldwide-was used to collect and analyze discussions related to online learning.
Sentiment analysis refers to computational techniques used to identify and classify opinions expressed in textual data (Pozzi et al., 2017). Traditionally, sentiment analysis begins by distinguishing between objective and subjective statements. Objective sentences typically express factual information, whereas subjective sentences contain personal opinions or evaluations. These subjective expressions are generally categorized as positive, negative, or neutral. However, identifying sentiment in textual data is not always straightforward. As noted by Nissim and Patti (2017), linguistic nuances, sarcasm, and contextual meanings can complicate the interpretation of sentiment. Consequently, recent sentiment analysis research increasingly focuses on classifying texts directly into positive, negative, or neutral categories rather than first separating objective and subjective statements. Moreover, the development of sentiment analysis tools and language resources remains an evolving area of research, and many resources are still developed and maintained by private organizations or research groups (Iglesias et al., 2017).
Despite the growing body of research on online learning during the COVID-19 pandemic, relatively limited attention has been given to examining large-scale social media discourse through social network structures. Most existing studies have focused on students’ or teachers’ perceptions using surveys or interviews, which provide valuable insights but often capture limited samples and individual perspectives. In contrast, social media platforms such as Twitter provide large-scale, naturally occurring datasets that allow researchers to examine how discussions about educational issues emerge and evolve within online networks. By combining social network analysis with sentiment analysis, it becomes possible to examine both the structural characteristics of online discussions and the emotional orientations expressed within them. Therefore, analyzing Twitter discussions related to online learning during the late pandemic period offers an opportunity to better understand how online learning was collectively discussed, interpreted, and emotionally framed within broader social media discourse. In this context, the present study aims to examine the structural characteristics and sentiment patterns of Twitter discussions about online learning during the late pandemic period.
Online learning during the late pandemic period should not be understood merely as a temporary instructional response to school closures. By this stage of the pandemic, it had become part of a wider educational ecosystem shaped by repeated use, accumulated experience, institutional adaptation, and public evaluation. Within this ecosystem, digital tools were experienced not only as delivery channels, but also as environments in which interaction, communication, access, autonomy, participation, and equity were negotiated. This interpretation is consistent with interaction oriented perspectives on distance and online learning, which position learner content, learner instructor, and learner learner interaction as central components of educational experience (Moore, 1989). It also aligns with transactional distance theory, where dialogue, structure, and learner autonomy are treated as interrelated dimensions of distance education (Moore, 2013, 2018). From this perspective, Twitter discussions provide a meaningful source for examining how online learning was socially interpreted, emotionally evaluated, and relationally experienced during the late pandemic period.
The use of social media data is also increasingly relevant for educational technology research. Social media has been conceptualized as a space that can connect formal and informal learning practices through participation, communication, and networked exchange (Greenhow & Lewin, 2016). Twitter, in particular, has been examined as an educational space that may support content communication, peer interaction, and learning related engagement, while also raising concerns about distraction, participation inequality, and privacy (Tang & Hew, 2017). In addition, public internet data mining has been proposed as a useful approach for instructional design, online learning, and educational technology research because it allows researchers to examine naturally occurring digital traces beyond institutionally controlled datasets (Kimmons & Veletsianos, 2018). Kimmons et al. (2021) further showed that Facebook, Twitter, and Scopus data can reveal current trends across educational technology research and practice, while Kimmons and Rosenberg (2022) demonstrated the value of such data for identifying emerging topics in the field. Recent Twitter based studies similarly show that public social media data can be used to examine perceptions and sentiments surrounding technology related issues, including AI supported e learning technologies and emerging tools such as ChatGPT (Demirel et al., 2025; Stracqualursi & Agati, 2024).
Accordingly, the present study contributes to educational technology research in three ways. First, it extends online learning research beyond surveys and interviews by examining naturally occurring user generated data at scale. Second, it combines network structure with sentiment in order to show not only how users evaluated online learning, but also how these evaluations circulated through retweet and mention relations. Third, it treats online learning as a broader educational ecosystem rather than as a single platform, course format, or delivery mode. This approach allows the study to move beyond reporting tweet volumes and instead examine how online learning became visible as a public educational issue across languages, networks, and sentiment patterns. Building on this framing, the study is guided by two complementary research questions (RQ) that address, first, the structural organization of online learning discussions on Twitter and, second, the sentiment patterns through which users evaluated online learning during the late pandemic period.
RQ1. What are the structural relationships and characteristics of social networks related to online learning created by Twitter users during the late pandemic period?
What are the numbers of tweets searched using specific terms and hashtags, and how many interactions were made with these tweets? Based on the density of the raw & cleaned data, how can the hashtags and search terms be categorized? In which geographic locations are online learning experiences concentrated? What are the social network metrics in the examined hashtags (#) and search terms used to access online learning experiences? How can interaction and communication rates in online learning-related social networks be grouped with social network metrics and sociogram examples?
RQ2. What sentiment patterns are observed in Twitter discussions about online learning during the late pandemic period?
Method
This study employed a large-scale Twitter-based social network analysis to examine discussions about online learning during the late pandemic period. Social network analysis is concerned with relational patterns among actors and the ways in which ties among them can be represented, measured, and interpreted (Scott, 2017; Wasserman & Faust, 1995). In Twitter-based research, such relations can be observed through platform-specific interaction traces, including retweets, mentions, replies, hashtags, and user connections (Bruns & Stieglitz, 2013; Stieglitz et al., 2018). In this study, social network analysis constituted the main methodological approach, while text mining procedures and dictionary-based sentiment analysis were used as complementary techniques to prepare, structure, and interpret the large-scale tweet dataset. The late pandemic period formed the contextual frame of the study, and Twitter posts containing predefined English and Turkish hashtags and search terms constituted the empirical data source.
Twitter data were treated as naturally occurring public communication traces rather than responses produced through researcher-administered instruments. Digital trace data are useful for examining how social actors communicate, circulate information, and express views in online environments, but they must be interpreted with attention to platform structure, data access conditions, and the research choices that shape collection and analysis (Boyd & Crawford, 2012; Freelon, 2014; Ruths & Pfeffer, 2014). In the present study, retweet relations were used to examine patterns of circulation and amplification, whereas mention relations were used to examine patterns of address, reference, and interaction among users. This relational modelling enabled the study to identify the structural characteristics of online learning discussions, while sentiment analysis provided an additional layer for examining users’ emotional orientations toward online learning.
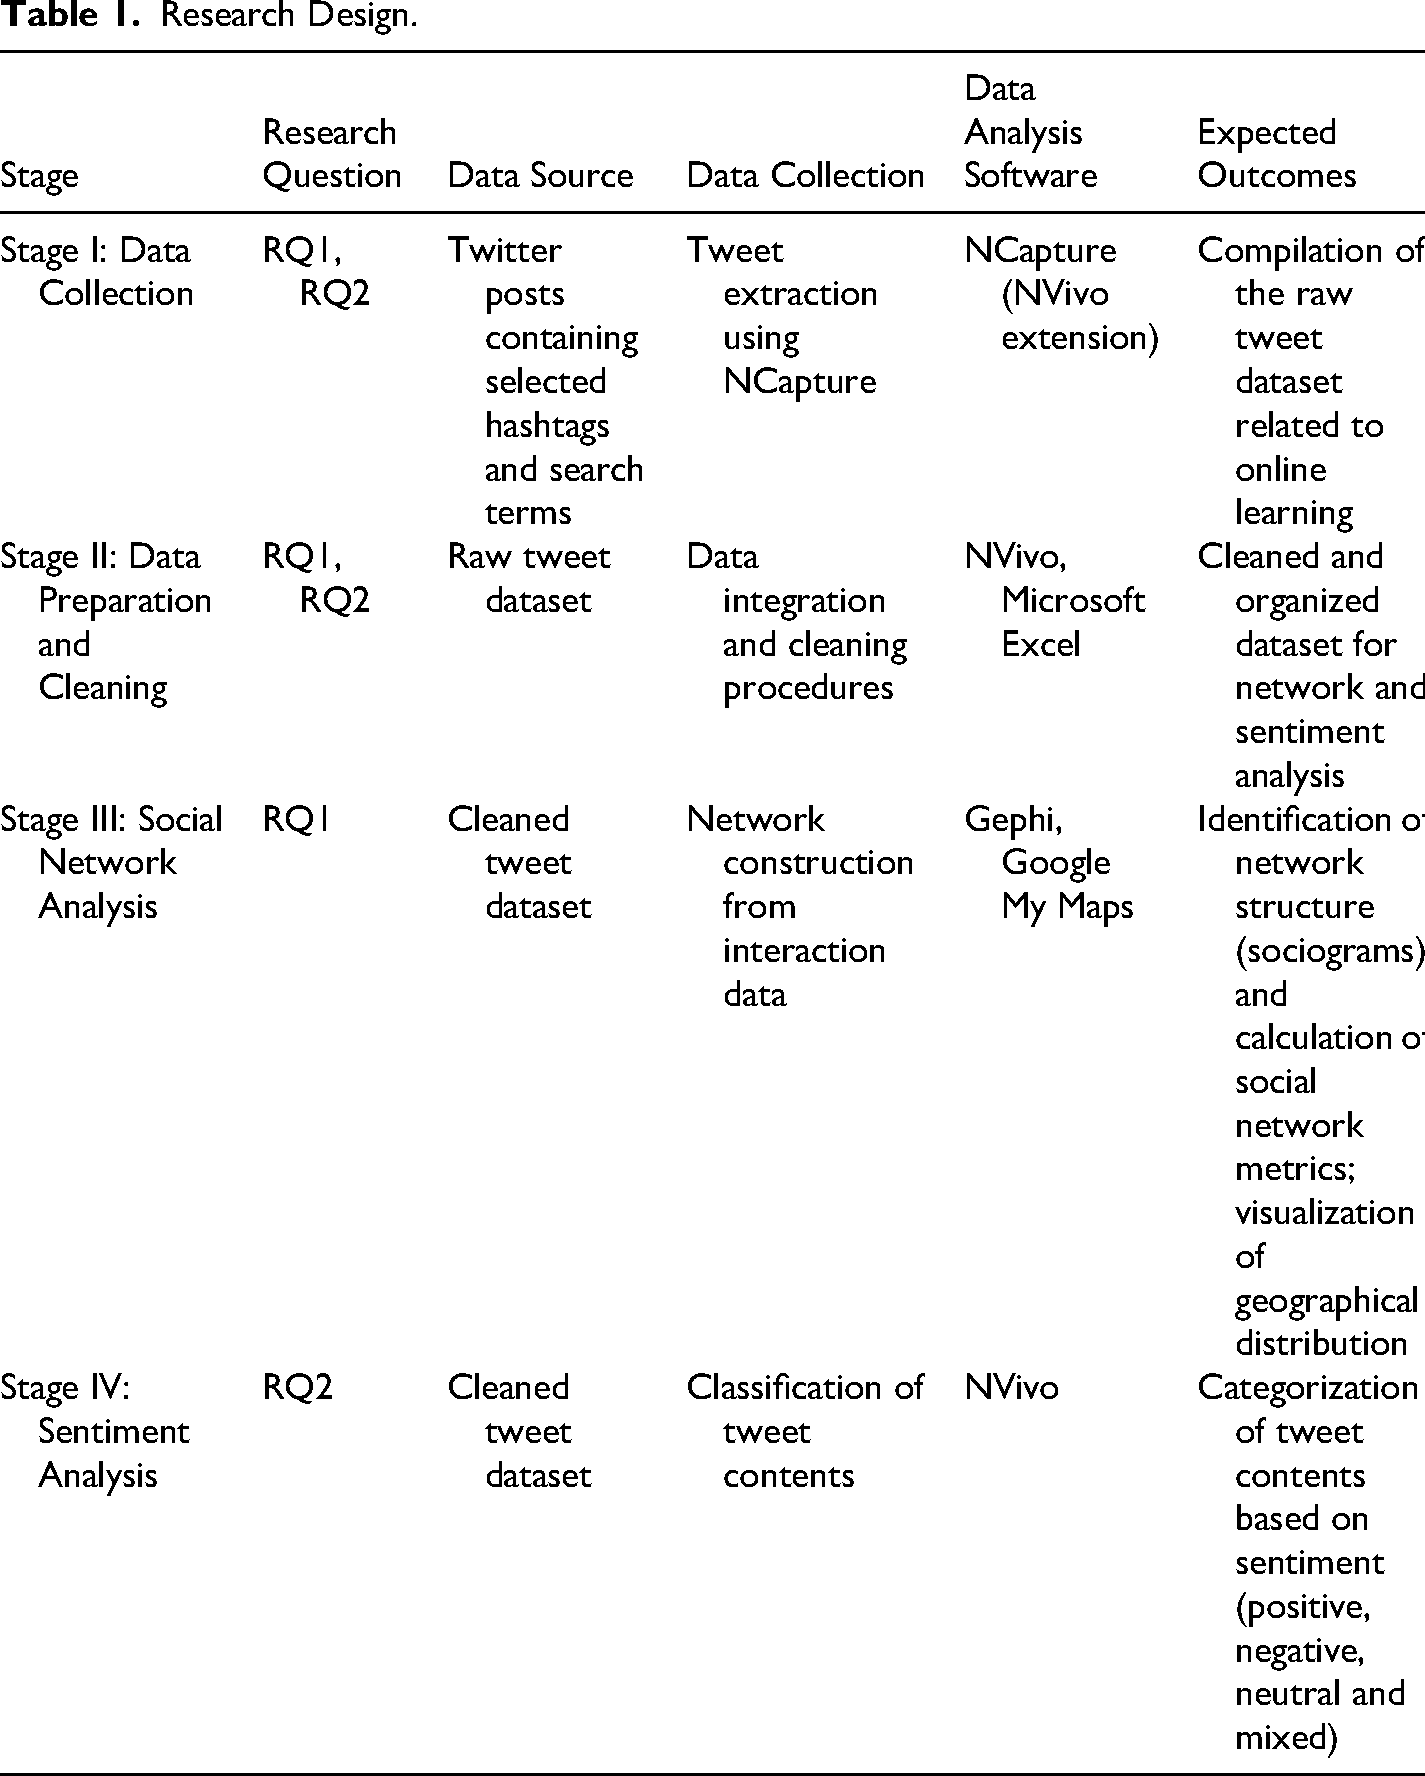
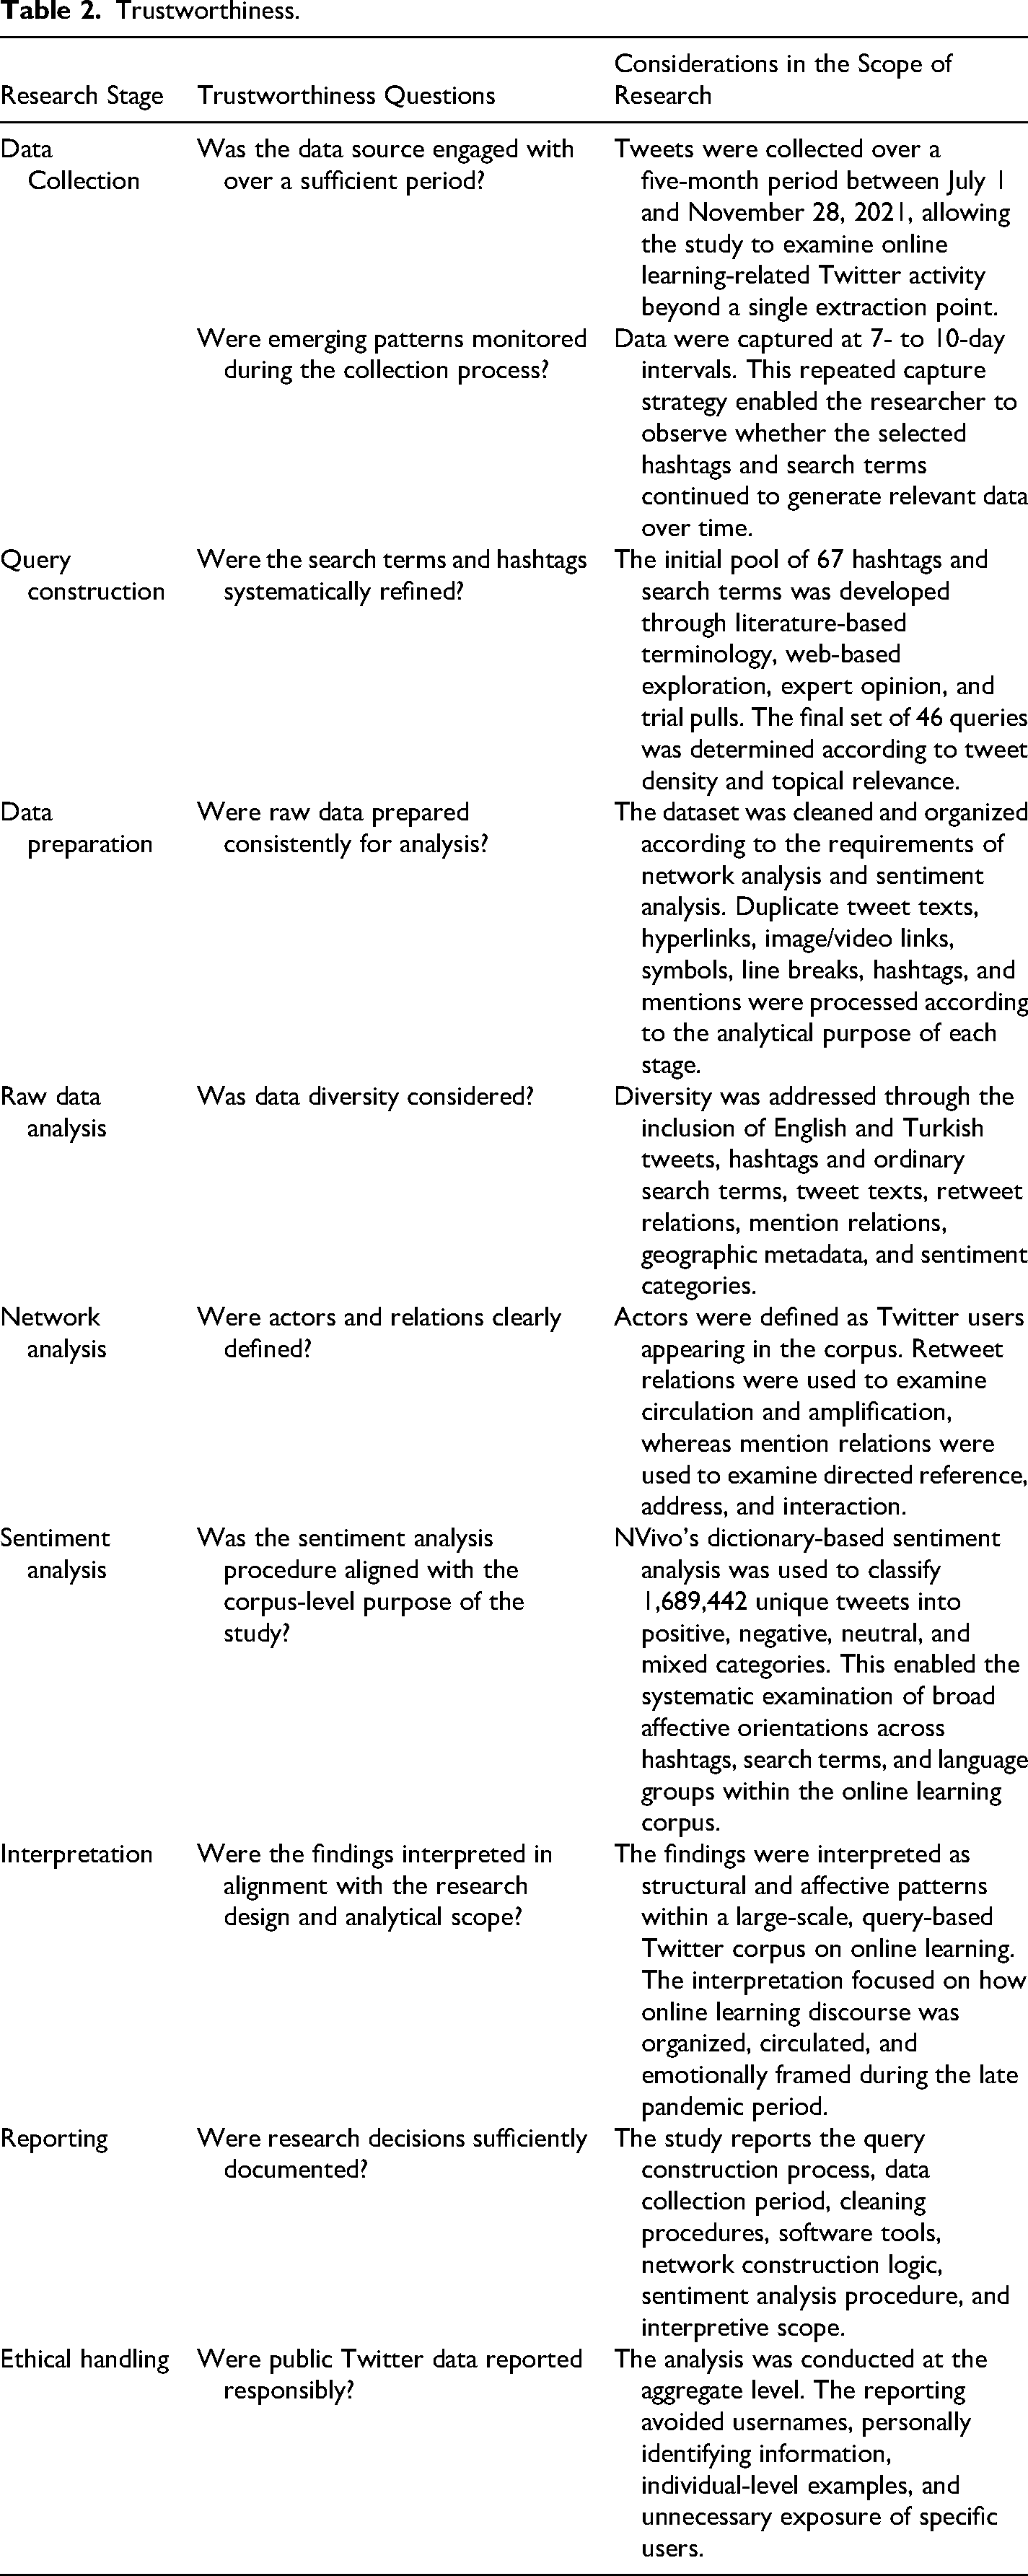
Methodological rigour was supported through a transparent and reproducible workflow across the stages of data collection, preparation, network construction, geographical visualization, and sentiment classification. These procedures included the construction of search queries from hashtags and search terms, a trial data collection phase, explicit inclusion and exclusion criteria for narrowing the initial query set, removal of duplicate and irrelevant records, cleaning of textual elements that could not be analysed, and clear definition of the two network relations used in the study. This approach is consistent with social media analytics research, which emphasizes topic identification, data collection, data preparation, and analytical transparency as interconnected stages of working with platform data (Stieglitz et al., 2018). At the same time, the findings are interpreted within the boundaries of the selected time period, query set, data collection tool, language processing decisions, and dictionary-based sentiment analysis procedure. Table 1 presents the research design and analytical stages of the study.
Research Design.
Dataset
The target population of this study refers to Twitter discussions that could potentially reflect online learning experiences during the late pandemic period. However, Twitter data cannot be treated as a complete representation of all public discourse on a given topic, because platform data are shaped by search logic, platform affordances, access conditions, data collection tools, and the timing of data capture (Boyd & Crawford, 2012; Freelon, 2014; Ruths & Pfeffer, 2014; Stieglitz et al., 2018). For this reason, the study does not claim to represent all Twitter activity related to online learning. Instead, the accessible dataset was operationally defined as tweets collected through NCapture between July 1 and November 28, 2021, using predefined English and Turkish hashtags and search terms related to online learning. This process resulted in a large-scale search-based Twitter corpus of 6,070,574 tweets.
The hashtags and search terms were used as analytical strata because they represented different entry points into online learning discourse. These included general education-related terms, online learning-specific terms, and subject- or community-specific tags. The initial query pool consisted of 67 hashtags and search terms identified through literature-based terminology, web-based hashtag exploration, expert opinion, and preliminary trial data collection. Trial data were collected between June 7 and July 1, 2021 to evaluate whether each term produced content relevant to online learning. These trial data were used only to refine the query set and were not included in the final analysis.
Following the trial phase and preliminary inspection of the raw data, the initial list was reduced from 67 to 46 hashtags and search terms. Two criteria guided this reduction. First, hashtags or search terms were excluded when they produced consistently very low weekly raw data, generally fewer than 100 tweets and often between 0 and 10 tweets. Second, terms were excluded when preliminary inspection showed that the retrieved tweets were not sufficiently related to online learning. A low-density term was retained when the content was clearly connected to online learning practices, tools, experiences, or educational discussions. In contrast, a term was removed when low volume was accompanied by weak topical relevance, repeated noise, or meanings unrelated to the research focus. Therefore, the final query set was determined through both numerical density and topical relevance, providing a structured basis for comparing online learning discussions across languages, hashtag types, and discourse contexts.
Data Collection
The construction of the query set followed an iterative process that combined conceptual relevance, platform-specific search practices, and preliminary data exploration. In large-scale social media research, the choice of keywords, hashtags, and sampling procedures is central to the boundaries of the corpus because these decisions determine which forms of public discourse become analytically visible (Moreno-Ortiz & García-Gámez, 2023). Accordingly, the query set was developed to capture online learning discourse across both English and Turkish Twitter content. The process began with the identification of frequently used hashtags related to education, educational technology, and online learning through web-based analytics tools. This was followed by a review of terms commonly used in the literature to describe technology-mediated learning, including online learning, remote learning, distance learning, blended learning, mobile learning, and e-learning.
Because Twitter discourse does not always develop through hashtagged communication alone, the search strategy included both hashtags and ordinary search terms. This decision was particularly important for the Turkish corpus, where online learning-related discussion often appeared through keywords embedded in tweet text rather than through standardized hashtags. The inclusion of Turkish search terms therefore enabled the study to access a wider range of locally meaningful expressions, including terms related to distance education, live lessons, learning platforms, and the return to face-to-face education. The initial pool of candidate queries was then reviewed by domain experts in relation to the conceptual scope of the study and the terminology used in online learning research. This combination of literature-based terminology, platform-based exploration, and expert review provided the basis for the preliminary query pool.
Trial data pulls were conducted between June 7 and July 1, 2021 in order to examine the empirical behaviour of the candidate queries before the main data collection period. These trial data were used only to refine the query set and were not included in the final analysis. During this phase, each candidate query was examined in terms of both volume and topical fit. Queries were retained when they produced tweets that were meaningfully related to online learning practices, digital learning tools, distance education, classroom experiences, or educational technology discussions. Queries were excluded when they produced very limited data without a stable flow of relevant tweets, or when the retrieved content was dominated by meanings unrelated to online learning. This procedure allowed the study to distinguish between sparse but conceptually relevant discourse and low-yield or noisy queries.
Following this refinement process, the initial pool of 67 hashtags and search terms was reduced to 46 final queries. The final dataset was then collected at 7- to 10-day intervals between July 1 and November 28, 2021 using NCapture, the NVivo browser extension. NCapture enabled the systematic archiving of Twitter search results and related metadata for the selected hashtags and search terms. The resulting corpus should be understood as a query-based Twitter dataset rather than a complete record of all Twitter discussions about online learning. This distinction is important because social media corpora are shaped by search terms, platform availability, data access conditions, collection timing, and the technical affordances of the tools used to capture data (Bruns & Stieglitz, 2013; Moreno-Ortiz & García-Gámez, 2023; Stieglitz et al., 2018).
The final hashtags and search terms were grouped descriptively according to raw tweet density to support comparison across the corpus. Dense queries were those that produced more than 250,000 raw tweets; moderately dense queries produced fewer than 250,000 tweets but still generated substantial data; and sparse queries produced fewer than 50,000 tweets but were retained when their contents remained directly relevant to online learning. These density categories were not intended as statistically validated thresholds. Rather, they provided an organizing framework for comparing discourse intensity across English and Turkish queries, different types of educational terminology, and different levels of Twitter activity. Based on these density categories, Figure 1 summarizes how the final English and Turkish hashtags and search terms were distributed across dense, moderately dense, and sparse data groups.
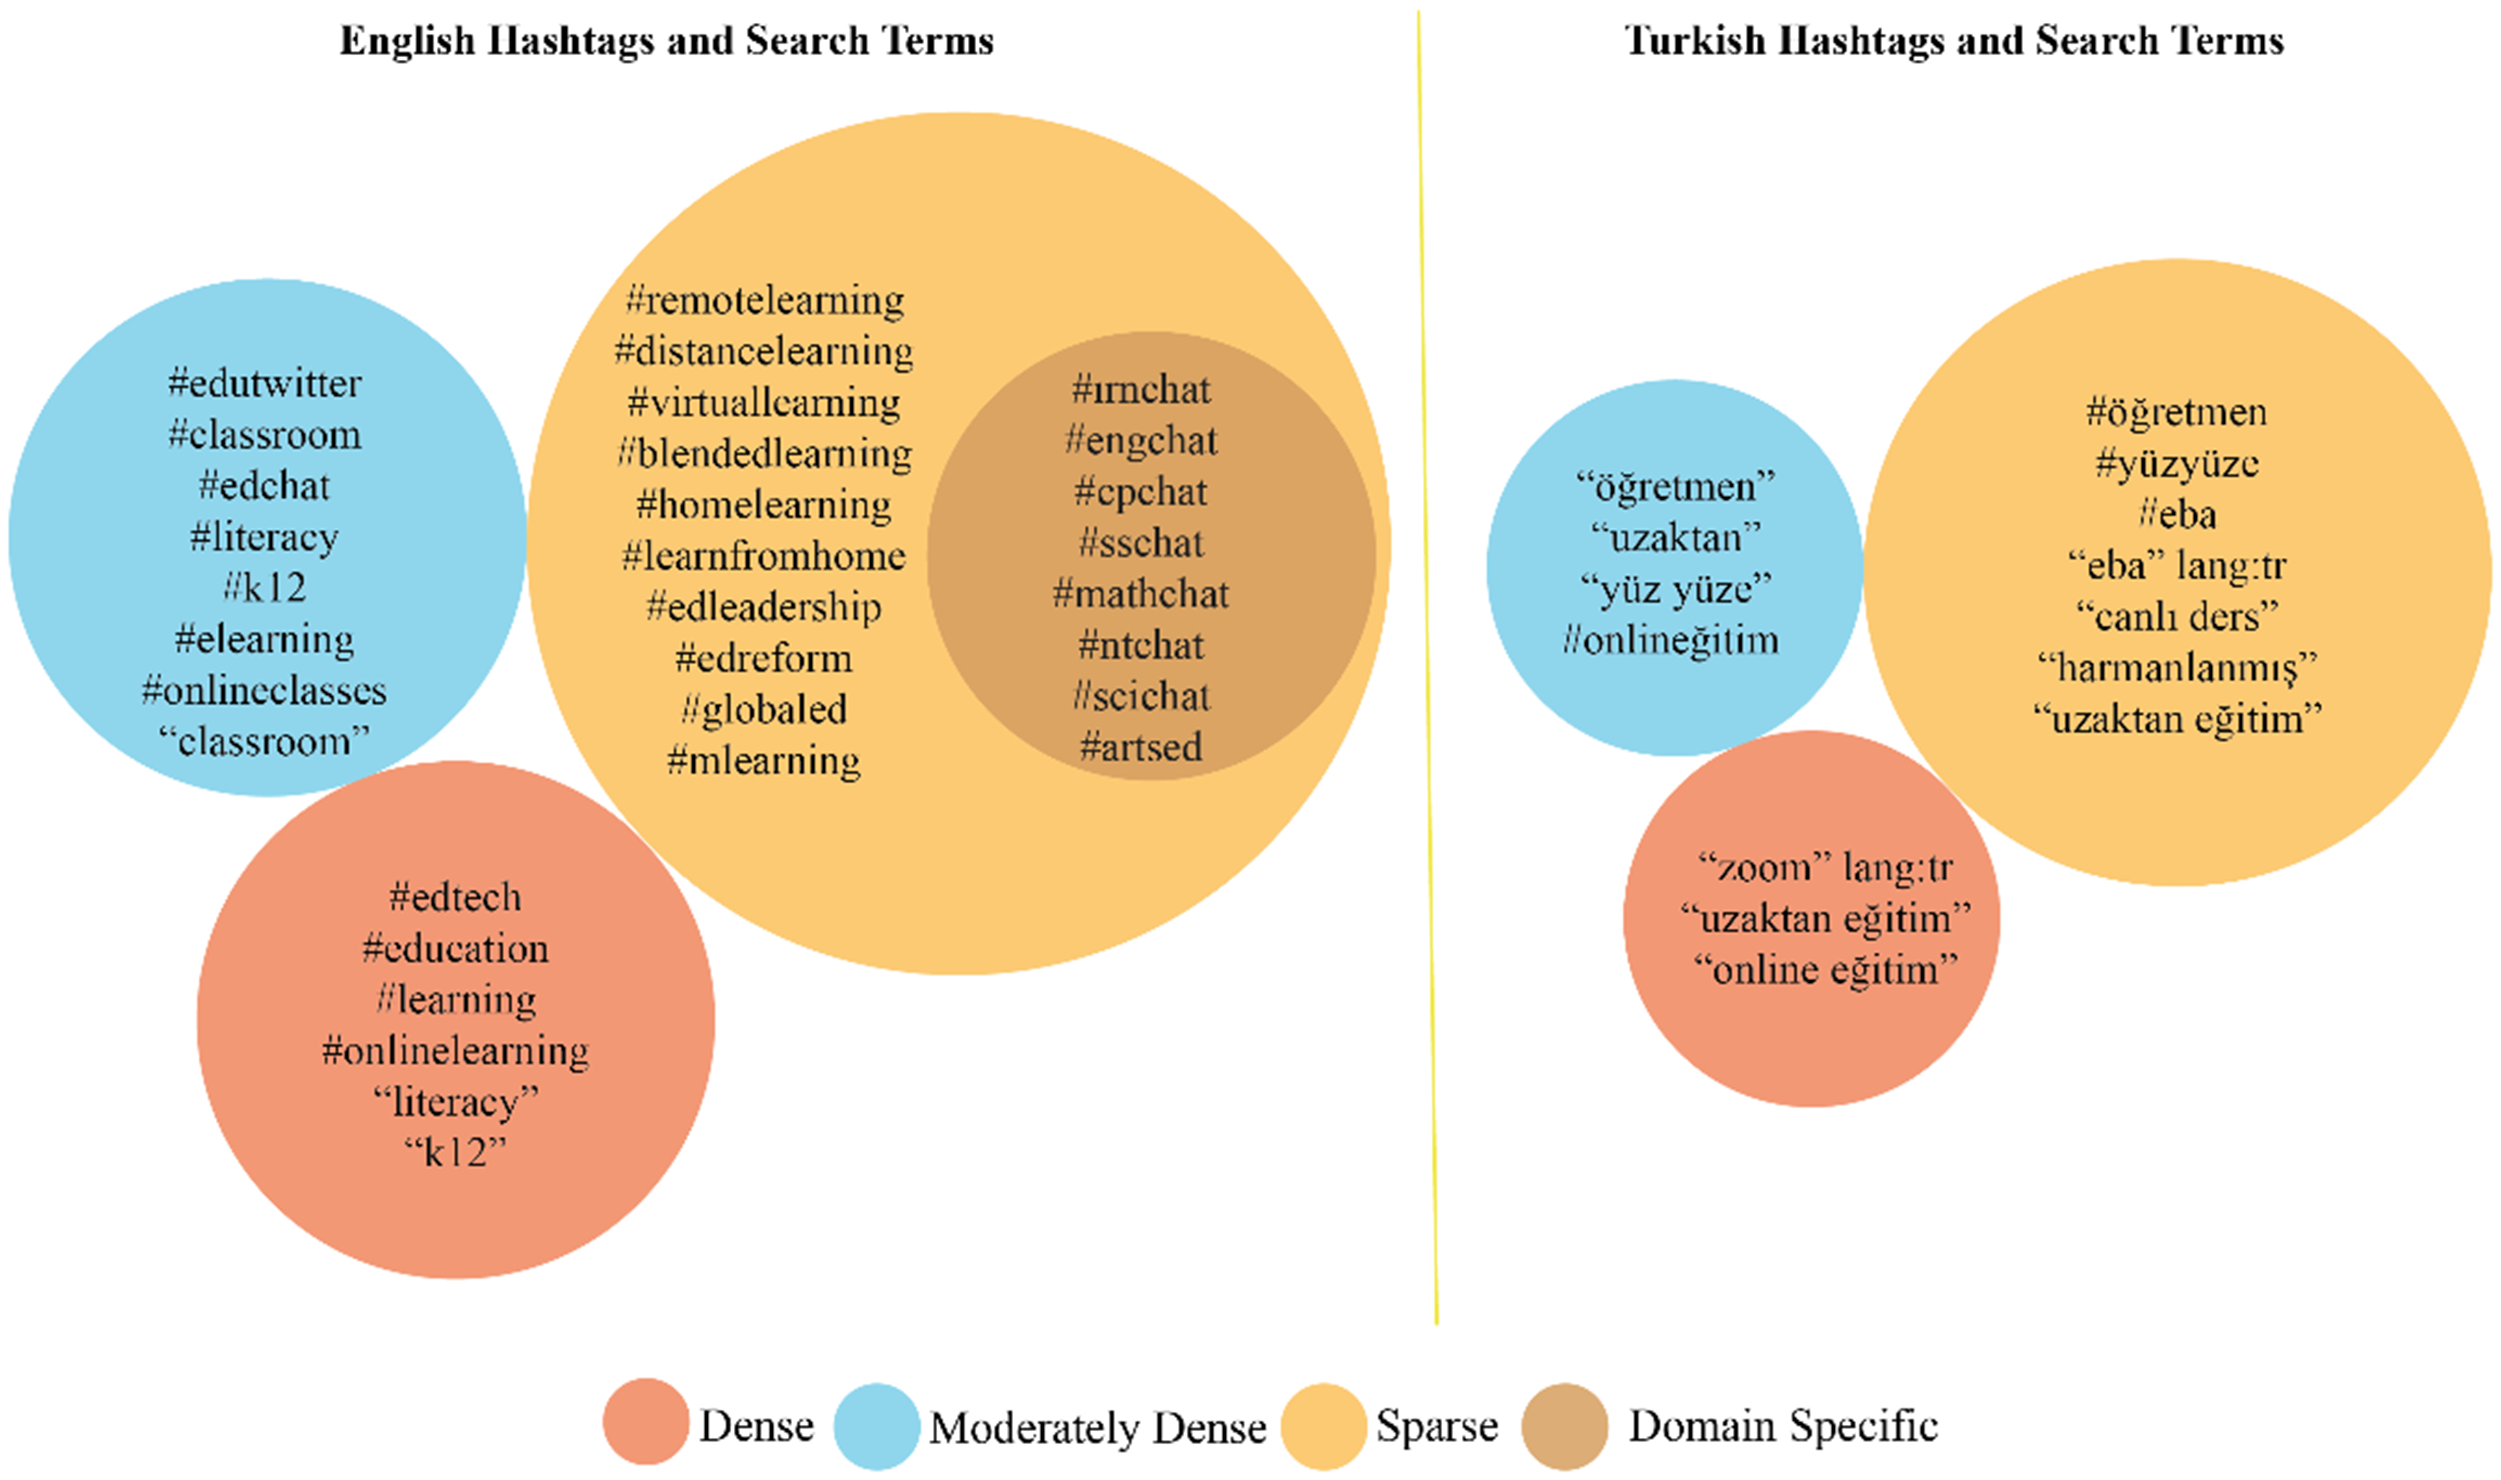
Distribution of hashtags and search terms.
Cleaning of the Data
During data cleaning, the hashtags and search terms collected at 7- to 10-day intervals were integrated and prepared for two forms of analysis: network analysis and sentiment analysis. The following procedures were applied consistently across the dataset:
For network analysis, tweet records were prepared in a way that preserved the relational information required for constructing retweet and mention networks. Gephi was used to calculate social network metrics and generate sociograms. Microsoft Excel was used to organize the datasets and facilitate data transfer between software tools. For sentiment analysis, duplicate tweet texts were removed and unique tweets were retained. Turkish tweets were translated into English before classification because the sentiment workflow used in the study relied on English-language resources. Textual elements that were not analytically relevant for sentiment classification, including hyperlinks, photo/video links, symbols, shapes, excessive spaces, and line breaks, were removed. Hashtags and mentions were processed according to the requirements of the relevant analytical stage. Candidate queries that consistently produced fewer than 100 weekly tweets and did not show sufficient topical relevance during preliminary inspection were excluded during the query refinement stage. However, low-density queries were retained when their contents were clearly related to online learning practices, tools, experiences, or educational discussions. After the cleaning of the data, the number of unique tweets subjected to sentiment analysis is 1,689,442.
The steps of data cleaning process and the transition to data analysis are summarized in Figure 2:
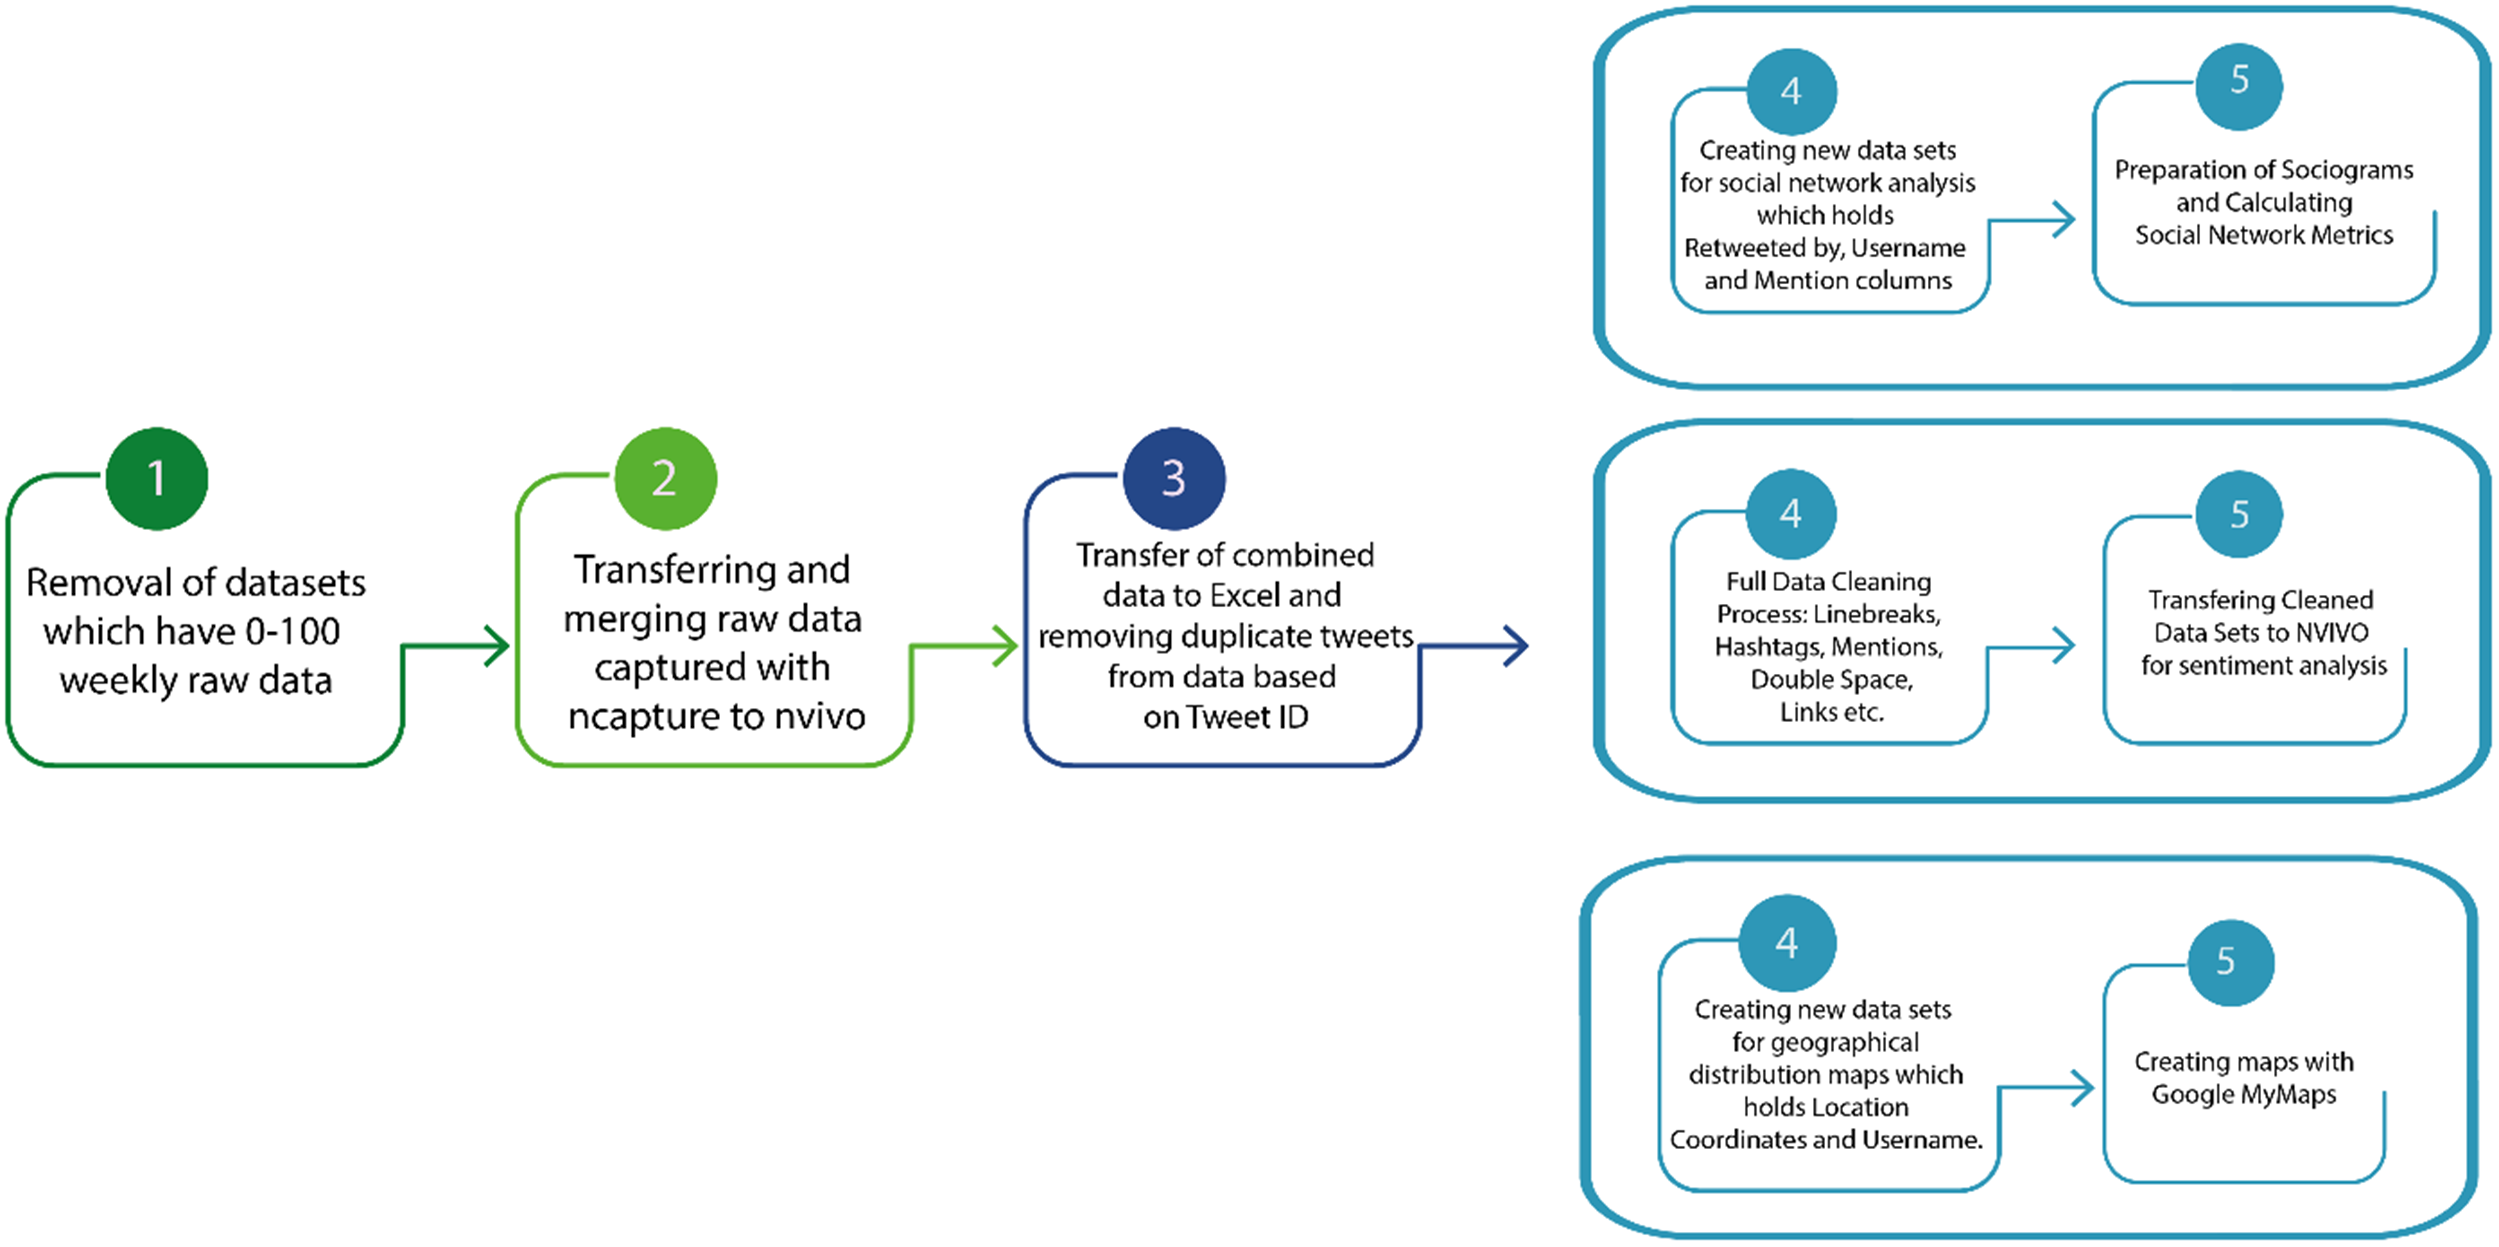
Data cleaning, data transitions between applications, and data analysis process.
Data Analysis
Social network analysis and sentiment analysis were used as complementary analytical lenses. Social network analysis identified the structure of interactions around online learning, while sentiment analysis examined the emotional orientation of cleaned tweet contents. The original corpus consisted of 6,070,574 tweets and was treated as large-scale platform data. Text-mining procedures were used to remove non-analytical text elements and to prepare the dataset for network and sentiment analyses.
Social Network Analysis
The simplest definition of social network analysis is the analysis of relationship patterns between actors and the exchange of resources through these relationships. There are three different representations of social network data, which can be used together. These are representation according to graph theory (basic level), sociometric representation (by creating sociograms) and algebraic representation (using mathematical formulas). In social network analysis, the characteristics of social actors (productivity, gender, ethnic identity) are understood by extracting connections or patterns between units (Wasserman & Faust, 1995).
Although social network analysis continues to use graph theory, the possibility of accessing and processing data on a wider scale has arisen through techniques such as big data analysis and text analysis (Scott, 2011). Freeman (2004) explains the steps of social network analysis as follows:
It requires intuition to establish connections between important social actors. It involves collecting social connections/relationships and analyzing this data. It is dependent on graphs for revealing patterns between these connections. Mathematical calculations are used to explain social connections.
Social network analysis was used to examine the structural characteristics of Twitter discussions on online learning in relation to the first research question. The relational structure of the networks was visualized through sociograms, while network properties were interpreted using social network metrics. Sociograms provide a graphical representation of social relationships after relational data have been collected and organized (Somyürek & Güyer, 2020). In this study, two directed network types were constructed because retweet and mention relations represent different forms of interaction on Twitter.
The first network type was constructed from retweet relations. In this network, the “Retweeted by” column was defined as the source and the “Username” column as the target, indicating a directed tie from the user who retweeted a post to the user who originally shared it. Retweet relations were interpreted as indicators of message circulation and amplification, as they show how particular posts are redistributed within the wider network (Bruns & Stieglitz, 2013). The second network type was constructed from mention relations. Here, the “Username” column was defined as the source and the “Mention” column as the target, indicating a directed tie from the tweeting user to the user mentioned in the tweet. Mention relations were interpreted as indicators of direct reference, address, or interaction among users. Analysing these two network types separately made it possible to distinguish between diffusion-oriented interaction patterns and address-oriented communication patterns in online learning discourse.
Sentiment Analysis
Sentiment analysis was used to identify broad emotional orientations expressed in tweets about online learning during the late pandemic period. Sentiment analysis generally follows two main approaches: dictionary-based, or lexicon-based, methods and machine learning-based methods (Tokcaer, 2021). This study adopted a dictionary-based approach using NVivo's automated sentiment analysis tool, which is based on the Salience 6.1.1 logic. The use of this approach was considered appropriate because the study aimed to classify a large-scale corpus of tweets into general sentiment categories rather than to conduct fine-grained psychological interpretation of individual users’ emotional states.
NVivo's sentiment analysis classifies textual content into four main categories: positive, negative, neutral, and mixed. Positive and negative categories include both stronger and more moderate sentiment orientations. Neutral sentiment refers to tweets that contain primarily factual, descriptive, informational, or weakly affective statements. Mixed sentiment refers to tweets that contain both positive and negative elements within the same textual unit. In the Salience logic, sentiment strength is represented along a scale ranging from negative to positive values, with values closer to zero indicating weaker or more neutral sentiment. Accordingly, tweets were grouped according to whether their dominant textual orientation was positive, negative, neutral, or mixed.
In this study, mixed sentiment was treated as an analytically distinct category rather than being added mechanically to both positive and negative totals. This decision was important because short social media texts may contain appreciation and criticism, comparison and complaint, or positive and negative evaluations within the same tweet. As Nissim and Patti (2017) note, sentiment classification is complicated by contextual meaning, irony, and linguistic ambiguity. Therefore, mixed tweets were interpreted as expressions of ambivalent or complex sentiment. The sentiment findings should therefore be understood as indicators of broad affective orientation within the collected corpus, not as precise measurements of individual psychological states.
The dataset included both English and Turkish tweets. Because the sentiment workflow used in this study relied on English-language resources, Turkish tweets were translated into English before classification. This procedure enabled Turkish-language discourse to remain part of the multilingual corpus and allowed sentiment patterns to be examined within a unified analytical framework. At the same time, translation may affect idiomatic expressions, culturally specific emotional language, irony, or affective intensity. The original design did not include a manually coded validation subset, a back-translation procedure, or a comparison with an alternative sentiment classifier. For this reason, Turkish-English sentiment patterns were interpreted as broad directional tendencies within the collected corpus rather than as exact cross-language measurements. Accordingly, the dictionary-based procedure was used descriptively to identify broad affective orientations in public online learning discourse, rather than to validate a multilingual sentiment model (Nissim & Patti, 2017; Pozzi et al., 2017; Tokcaer, 2021).
Big Data and Text Mining
Mayer-Schonberger and Cukier (2013) define big data as our ability to process large amounts of information, analyze it instantly, and sometimes obtain surprising results. Kaisler et al. (2015) mention that the data capacity produced by electronic devices monthly reaches 1018 terabytes. The characteristics of big data can be listed as the volume, velocity, variety, value, and veracity of the collected data. The volume of data indicates the data capacity that individuals or institutions can access at that moment. The velocity of data refers to the speed of data in the flow and the time it takes to collect it. The variety of data representation is related to its accessibility in different formats such as Excel, PDF, audio, video, or text. The value of data is related to its usefulness in achieving desired outcomes or making decisions. The veracity of data is related to the accuracy, precision, and reliability of the collected data. In this study, data such as tags, tweets, retweets, and system records related to online learning on Twitter social network were collected and analyzed using text mining techniques as big data.
Text mining is the extraction of text from different written sources through computers and using it to access new information that was previously unknown (Hearst, 2003; Witten, 2005). Witten (2005) defines text mining as the analysis of texts to extract useful information for specific purposes. Such texts are usually unstructured and difficult to handle algorithmically. However, text is still the most common tool for information exchange. One of the important elements of text mining is the use of raw data accessed to test new hypotheses. It is essential to clean unnecessary information and access and process relevant information. Text mining, one of the types of big data analysis, can be considered as the discovery of patterns that exist in databases (Hearst, 2003). Text analysis is the process of deriving meaning from texts (Freedman & Morrison, 2018). Using structured data such as web pages instead of obtaining plain texts provides new opportunities to obtain information from individual pages and large page networks. Even if individuals do not have personal domain knowledge, there is a long way to go in extracting and interpreting information from large document collections using automatic data mining techniques (Witten, 2005).
Validity, Reliability and Trustworthiness
In social network analysis, methodological quality depends on the explicit definition of actors, relational ties, and network properties, because the meaning of any network measure is shaped by how these elements are operationalized (Wasserman & Faust, 1995; Scott, 2017). In Twitter-based research, this issue becomes particularly important because hashtags, retweets, mentions, and search terms are platform-specific digital traces rather than neutral or complete representations of social interaction (Bruns & Stieglitz, 2013; Freelon, 2014; Ruths & Pfeffer, 2014; Stieglitz et al., 2018). Therefore, the validity and reliability of the present study were addressed through transparent corpus construction, explicit relational modelling, documented preprocessing procedures, and cautious interpretation of platform-mediated data.
The actors in this study were Twitter users who appeared in the corpus by posting tweets containing the selected online learning-related hashtags or search terms, retweeting such content, or being mentioned in these tweets. The relationships examined were retweet and mention relations. Retweet relations were used to examine the circulation and amplification of online learning-related content, whereas mention relations were used to examine directed reference, address, and interaction among users. These two relations were modelled separately because they represent different forms of Twitter-based communication. Retweets may increase the visibility of content without necessarily indicating agreement, while mentions may indicate reference or address without necessarily implying sustained dialogue.
Corpus validity was strengthened through an iterative query construction process. The initial pool of 67 hashtags and search terms was developed through literature-based terminology, web-based hashtag exploration, Turkish and English equivalents of online learning concepts, expert opinion, and preliminary trial pulls. After the trial phase, this pool was reduced to 46 final hashtags and search terms according to two criteria: tweet density and topical relevance. Low-density terms were retained when their content was clearly related to online learning practices, tools, experiences, or educational discussions. In contrast, terms were excluded when low volume was accompanied by weak topical relevance, repeated noise, ambiguity, or meanings unrelated to the research focus. Thus, the final query set was shaped by both empirical density and conceptual fit.
Reliability was supported through repeated data capture and procedural consistency. Tweets were collected between July 1 and November 28, 2021, at 7- to 10-day intervals using NCapture. This five-month collection period enabled the study to examine online learning-related Twitter activity beyond a single event or extraction point. However, the dataset was not treated as a complete representation of all Twitter discourse on online learning. Rather, it was defined as a large-scale, query-based Twitter corpus shaped by the selected hashtags and search terms, platform visibility, data access conditions, collection timing, metadata availability, and the technical affordances of NCapture. This framing is consistent with critical approaches to digital trace and big data research, which caution that large-scale social media datasets remain partial, constructed, and platform-dependent (Boyd & Crawford, 2012; Ruths & Pfeffer, 2014).
Trustworthiness was used as a broader quality criterion referring to the transparency, coherence, and auditability of the research process. Although trustworthiness is frequently associated with qualitative research traditions (Bassey, 1999), it can also be useful in large-scale digital trace research when understood as the extent to which research decisions are visible, justified, and open to critical inspection. In this study, trustworthiness was supported by the prolonged collection period, trial data pulls, expert-informed query refinement, diversified data structure, documented cleaning procedures, and explicit reporting of analytical boundaries.
Corpus stability was interpreted in relation to the computational and platform-based nature of the study. During the five-month data collection period, the selected hashtags and search terms continued to generate recurrent and relevant online learning-related discourse, and repeated inspection did not indicate the need to expand the query set beyond the refined corpus. In this respect, data collection was considered analytically sufficient for addressing the research questions within the boundaries of the selected query-based Twitter corpus.
The five characteristics of big data-volume, velocity, variety, value, and veracity-also informed the study's methodological quality framework (Kaisler et al., 2015). Volume was reflected in the corpus of 6,070,574 tweets. Velocity was addressed through repeated capture intervals over the five-month period. Variety was reflected in tweet texts, hashtags, search terms, retweet relations, mention relations, language groups, geographic metadata, and tweet-level properties. Value was associated with the ability of the dataset to reveal large-scale patterns in public online learning discourse. Veracity was supported through the explicit reporting of query development, data collection, cleaning, network construction, sentiment classification, software use, and interpretive boundaries.
Finally, sentiment analysis was used as a complementary analytical layer to identify broad affective orientations within the online learning corpus. After cleaning, 1,689,442 unique tweets were classified through NVivo's dictionary-based sentiment analysis into positive, negative, neutral, and mixed categories. This procedure enabled the study to examine sentiment patterns systematically across a large-scale multilingual dataset and to compare how different hashtags, search terms, and language groups were associated with varying affective orientations. In line with the corpus-level purpose of the study, sentiment findings were interpreted as aggregated patterns of public discourse rather than as individual-level psychological assessments. Turkish tweets were translated into English before classification in order to apply a consistent sentiment analysis workflow across the bilingual dataset. This procedure preserved the comparative scope of the study while supporting a unified analytical framework for examining affective tendencies in English and Turkish online learning discussions.
Overall, the methodological quality of the study was established through the alignment of research questions, corpus construction, relational modelling, data preparation, sentiment classification, and interpretive scope. Rather than treating validity, reliability, and trustworthiness as separate procedural concerns, the study approached them as interrelated dimensions of a transparent and auditable analytical workflow. Accordingly, Table 2 presents the main trustworthiness questions and methodological considerations that guided each stage of the research process.
Trustworthiness.
Results
The results section is organized around the two research questions. First, it presents the structural characteristics of online learning-related Twitter networks. Second, it reports sentiment patterns across English and Turkish hashtags and search terms. Throughout the results, the emphasis is on cross-query patterns rather than on isolated descriptions of individual hashtags.
RQ1: What are the Structural Relationships and Characteristics of Social Networks Related to Online Learning Created by Twitter Users during the Late Pandemic Period?
What are the Numbers of Tweets Searched Using Specific Terms and Hashtags, and How Many Interactions Were Made with These Tweets? Based on the Density of the Raw & Cleaned Data, How Can the Hashtags and Search Terms be Categorized?
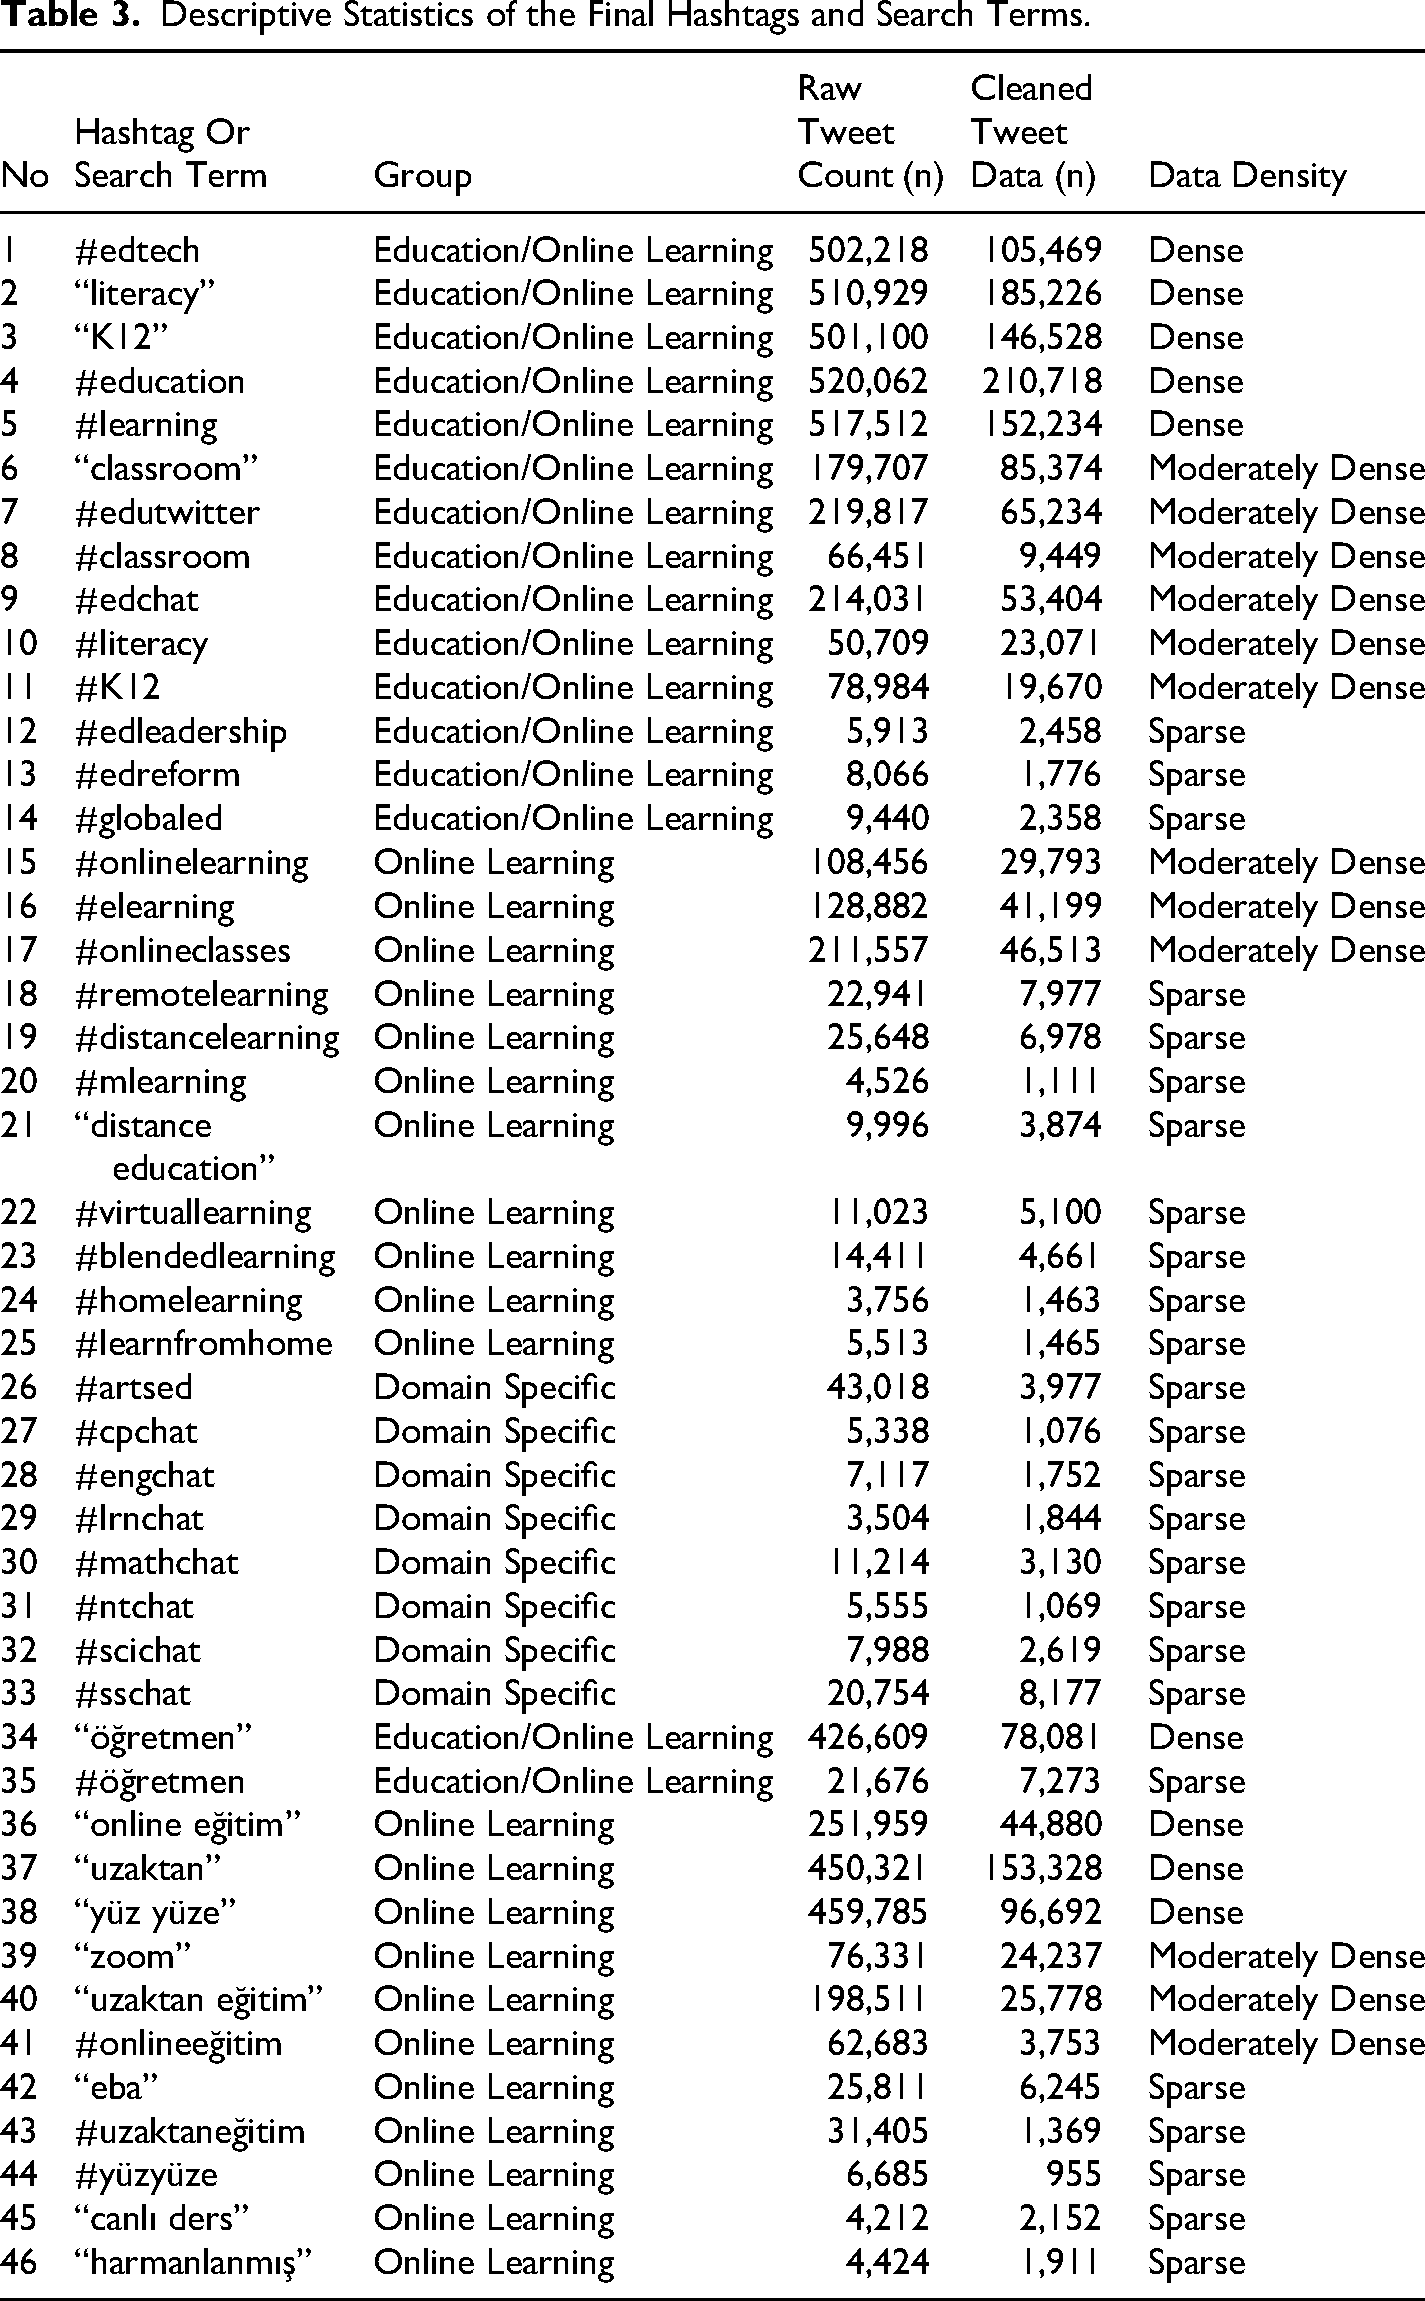
Descriptive Statistics of the Final Hashtags and Search Terms.
In Which Geographic Locations are Online Learning Experiences Concentrated?
Because it is not feasible to present geographical distributions for all 46 hashtags and search terms, this section presents three illustrative examples selected according to data density: #onlinelearning, #mlearning, and the Turkish search term “online eğitim.” The maps should be interpreted descriptively rather than causally. They show where geotagged or location-associated tweets in the captured corpus were concentrated, but they do not allow direct inference about population-level participation, infrastructure conditions, or platform preferences without additional evidence.
Across the selected examples, English-language tweets were concentrated most visibly in North America and Europe, with additional activity in selected regions such as India and Australia. Turkish-language data were concentrated in Türkiye but also appeared across Europe and the Americas. This broader distribution suggests that Turkish online learning discourse was not geographically confined to national borders within the captured corpus. However, the observed patterns may reflect a combination of diaspora presence, user-provided location settings, VPN or location-masking practices, platform metadata limitations, and the search terms used in the study (Figure 3).
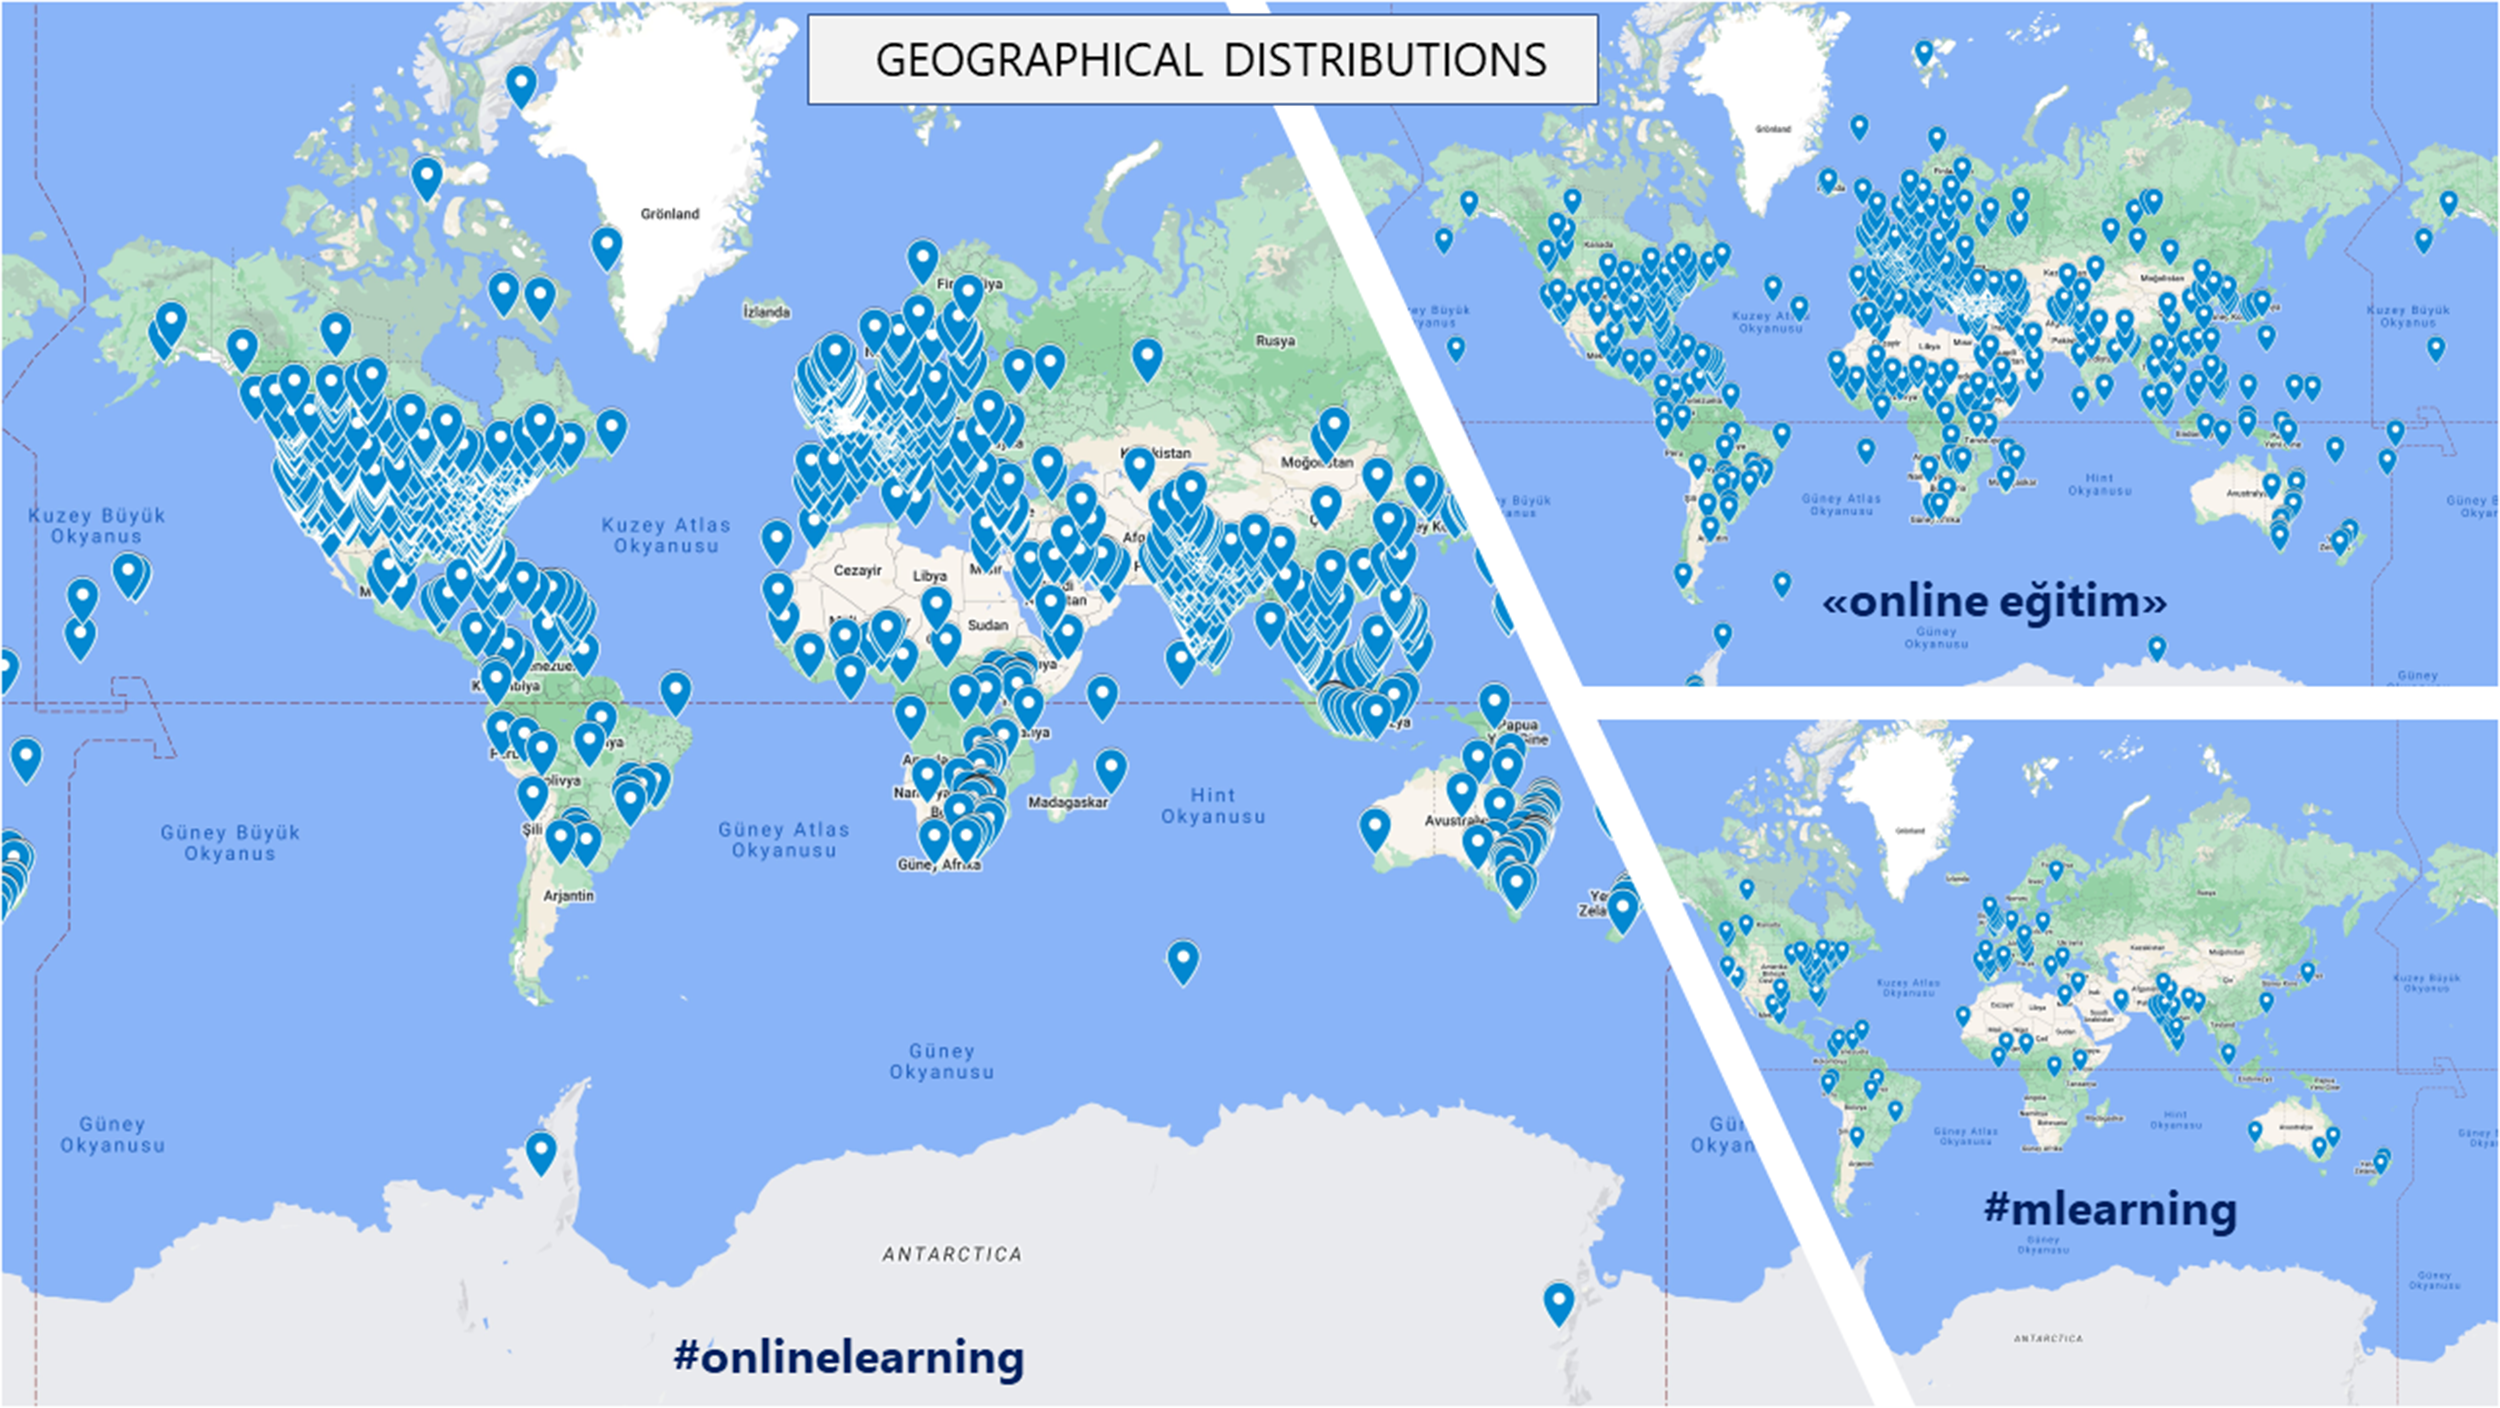
Geographical location distributions of tweets.
For moderate-density terms, geographical concentrations were generally less pronounced than in dense terms. The Turkish term “online eğitim” was concentrated primarily in Türkiye but also appeared in other regions. This finding is reported as a descriptive pattern of the captured dataset rather than as evidence of the actual distribution of Turkish-speaking users worldwide.
For sparse terms such as #mlearning, tweets were associated with a more limited number of locations. This pattern is consistent with the lower raw-data density of the term and suggests that sparse queries produced smaller and more fragmented geographical traces. These findings should be interpreted with caution because geographic metadata in Twitter data are incomplete and shaped by user settings and platform access.
What are the Social Network Metrics in the Examined Hashtags (#) and Search Terms Used to Access Online Learning Experiences?
In this research, 46 hashtags and search terms were examined. As it is not possible to show the sociograms of each of the 46 hashtags and search terms in the scope of the study, sociograms for 5 English and 3 Turkish hashtags and search terms were interpreted in terms of data density. As explained in the Method section, two types of sociograms were prepared for each hashtag and search term and were combined and presented in the Findings section.
To compare the data collected for 46 hashtags and search terms in Turkish and English, descriptive intervals were determined specifically for this research. These intervals are shown in Table 4. The intervals are not intended as universal thresholds for social network analysis; rather, they provide a within-study interpretive aid for comparing average degree, modularity, and network diameter across the captured query-based networks.
Intervals Determined for Social Network Metrics.
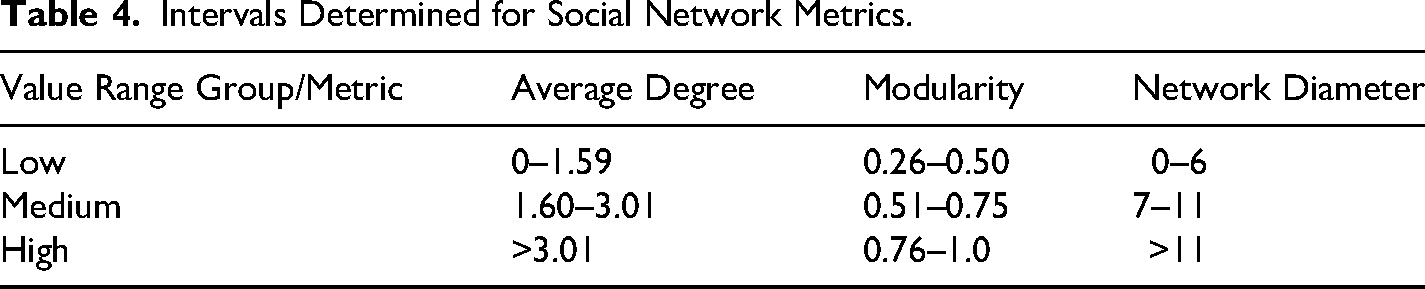
Based on Table 4, average degree was used to interpret the average number of ties associated with nodes in each network; modularity was used to interpret the extent to which interactions were distributed across clusters; and network diameter was used to interpret the longest shortest path among connected nodes. Higher modularity indicates stronger separation into communities, whereas lower modularity indicates fewer or more interconnected clusters. Network diameter is interpreted cautiously: a larger diameter may indicate broader reach, but it may also suggest that information or interaction travels through longer paths.
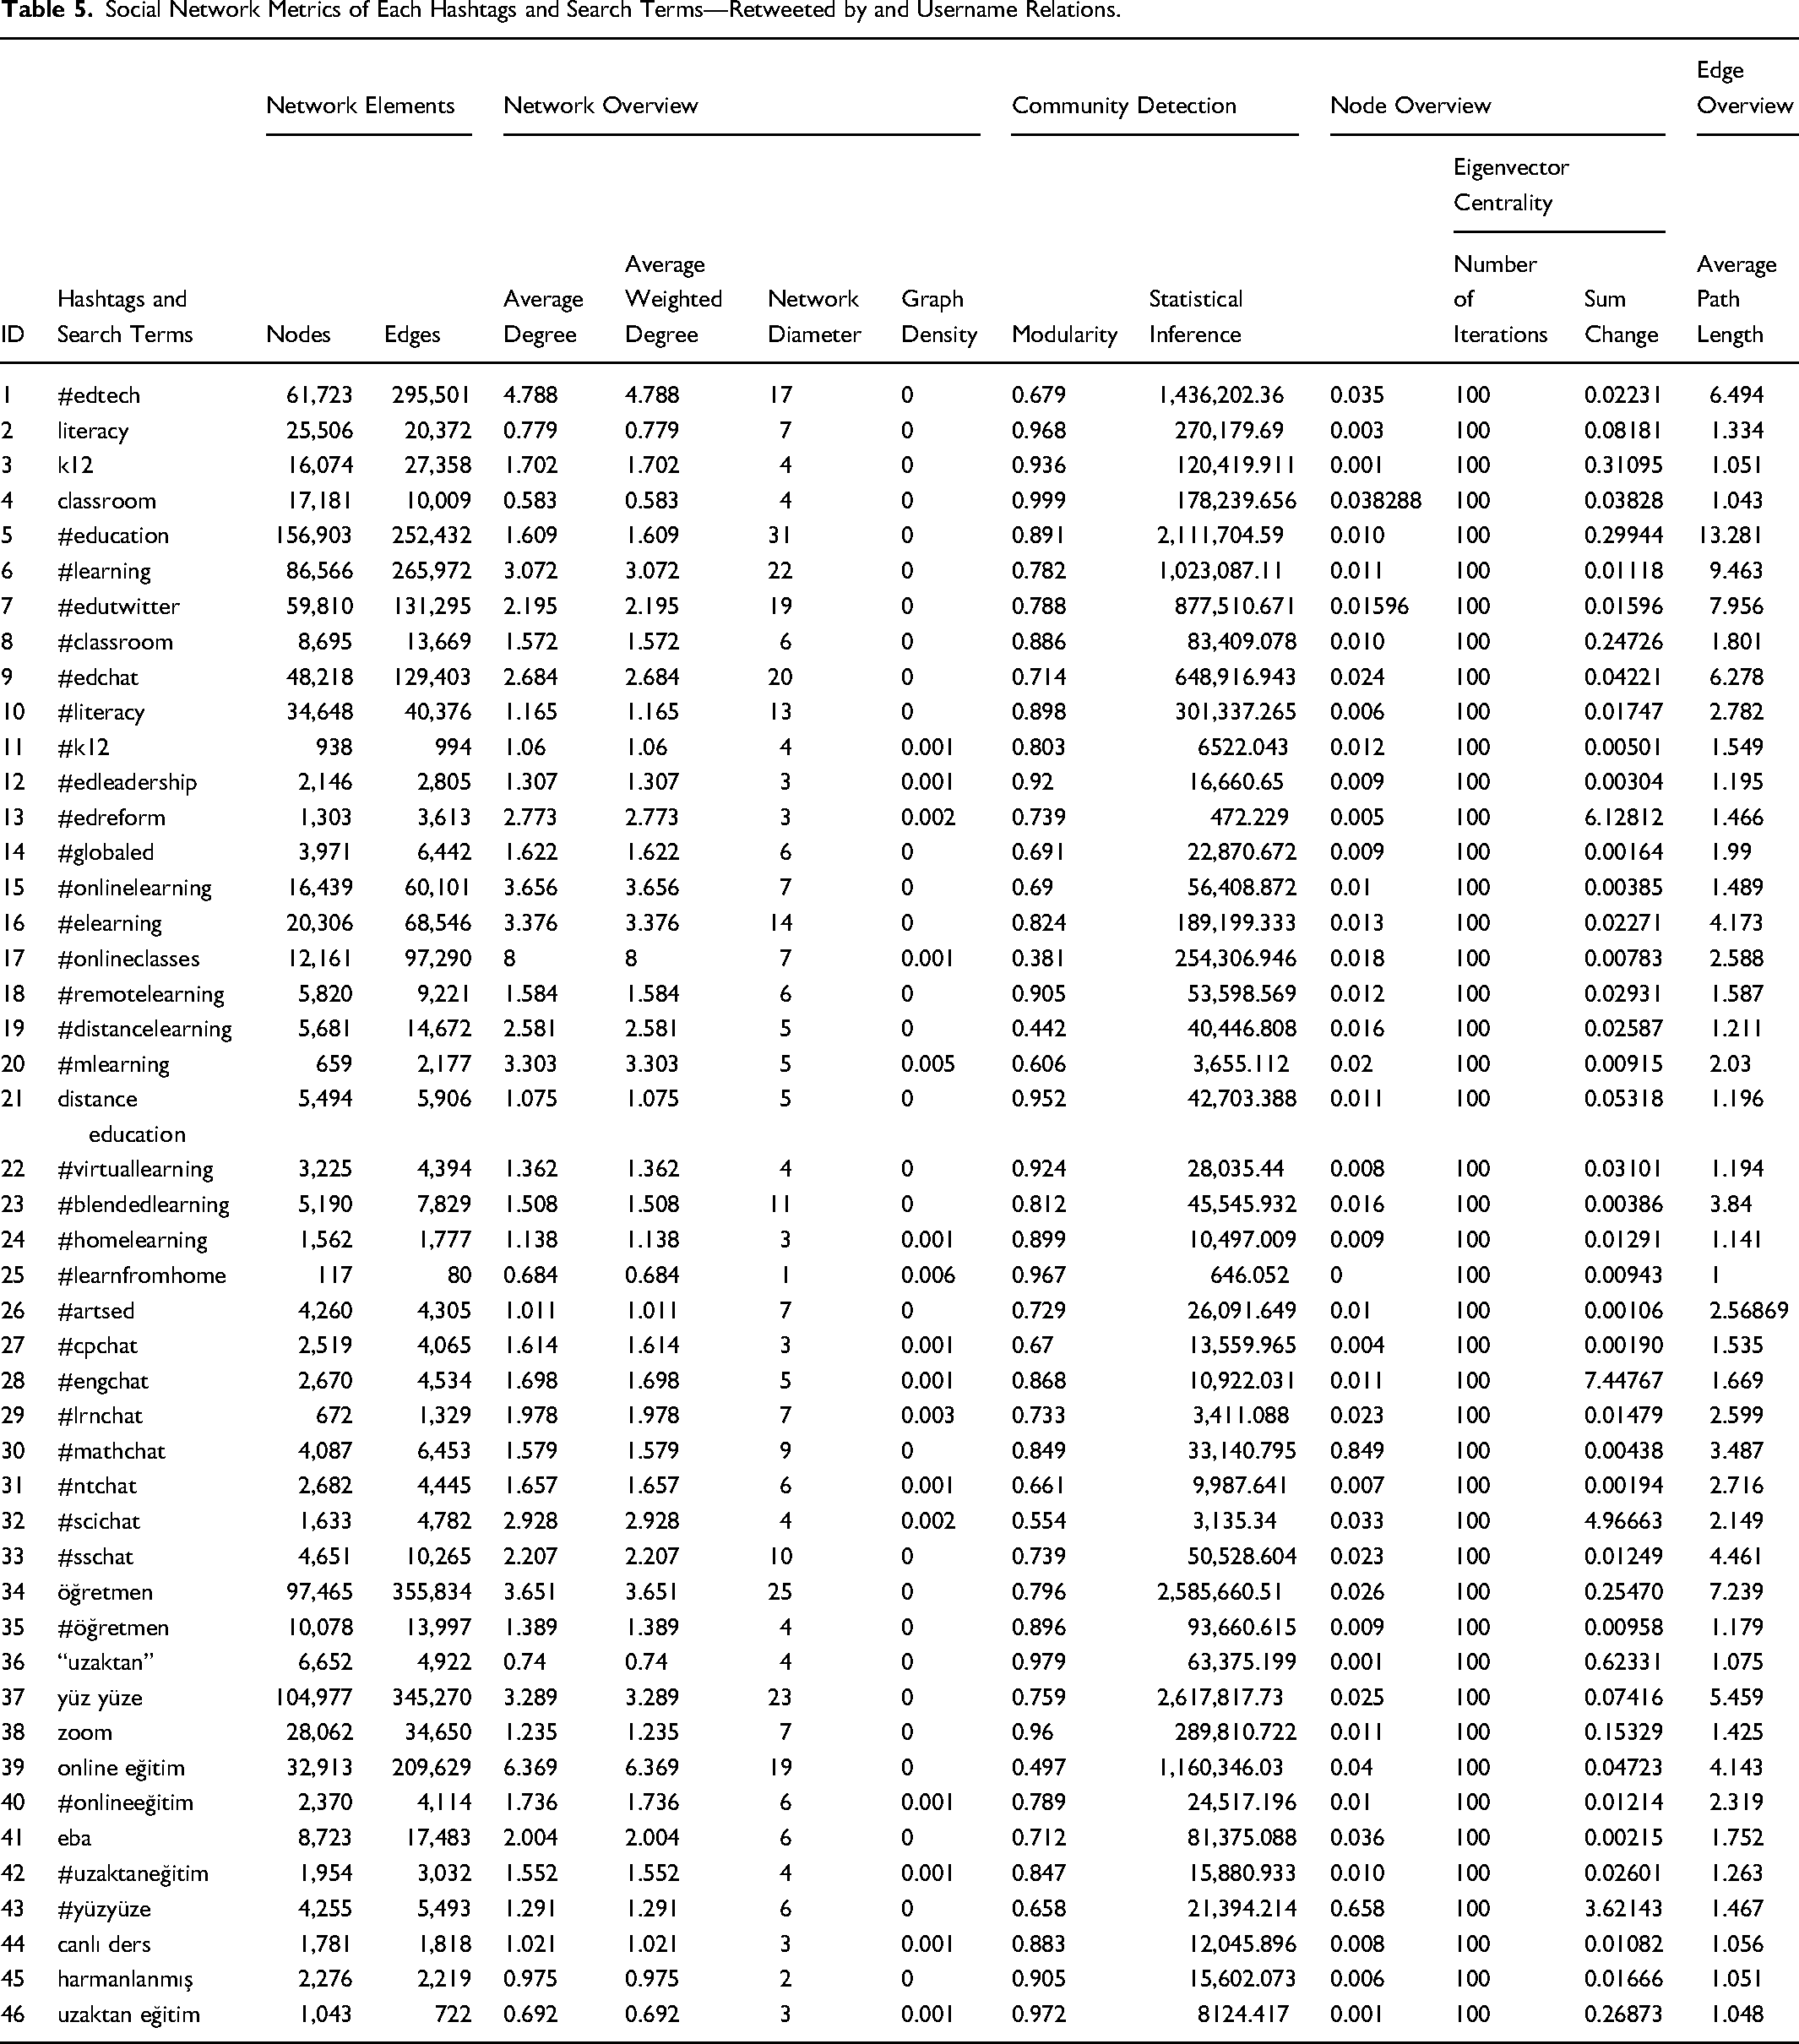
The additional metrics reported in Tables 5 and 6 are retained for transparency, but the discussion focuses primarily on node and edge counts, average degree, modularity, graph density, and network diameter because these metrics are most directly connected to the research questions. Values close to zero for graph density are expected in large Twitter networks because the number of possible ties grows rapidly as the number of nodes increases. Negative statistical inference values, where they appear, are outputs of the Gephi calculation procedure and are not used as substantive indicators in the interpretation.
Social Network Metrics of Each Hashtags and Search Terms—Retweeted by and Username Relations.
Social Network Metrics of Each Hashtags and Search Terms—between Username and Mentions Relations.
Before moving on to the sociograms of the hashtags and search terms that collect experiences related to online learning, Tables 5 and 6 provide social network metrics calculated to better understand the structure and characteristics of these networks. Table 5 presents social network metrics calculated using the “Retweeted by” and “Username” columns, revealing interaction and communication rates between those who retweet a tweet and the person who tweeted it. Table 6, on the other hand, includes social network metrics calculated using the “Username” and “Mention” columns. Usernames are listed in the “Username” column, while people mentioned in users’ tweets are listed in the “Mention” column. This allows access to the interaction and communication rates between users and the people they mention.
Taken together, the two network types allow the study to distinguish between the spread of online learning discourse through retweeting and the more direct user-to-user referencing reflected in mentions. This distinction is important because educational technology discussions on Twitter do not simply indicate volume of opinion; they also reveal whether discourse is amplified through retweets, addressed to specific actors, or clustered around particular communities.
How can Interaction and Communication Rates in Online Learning-Related Social Networks be Grouped with Social Network Metrics and Sociogram Examples?
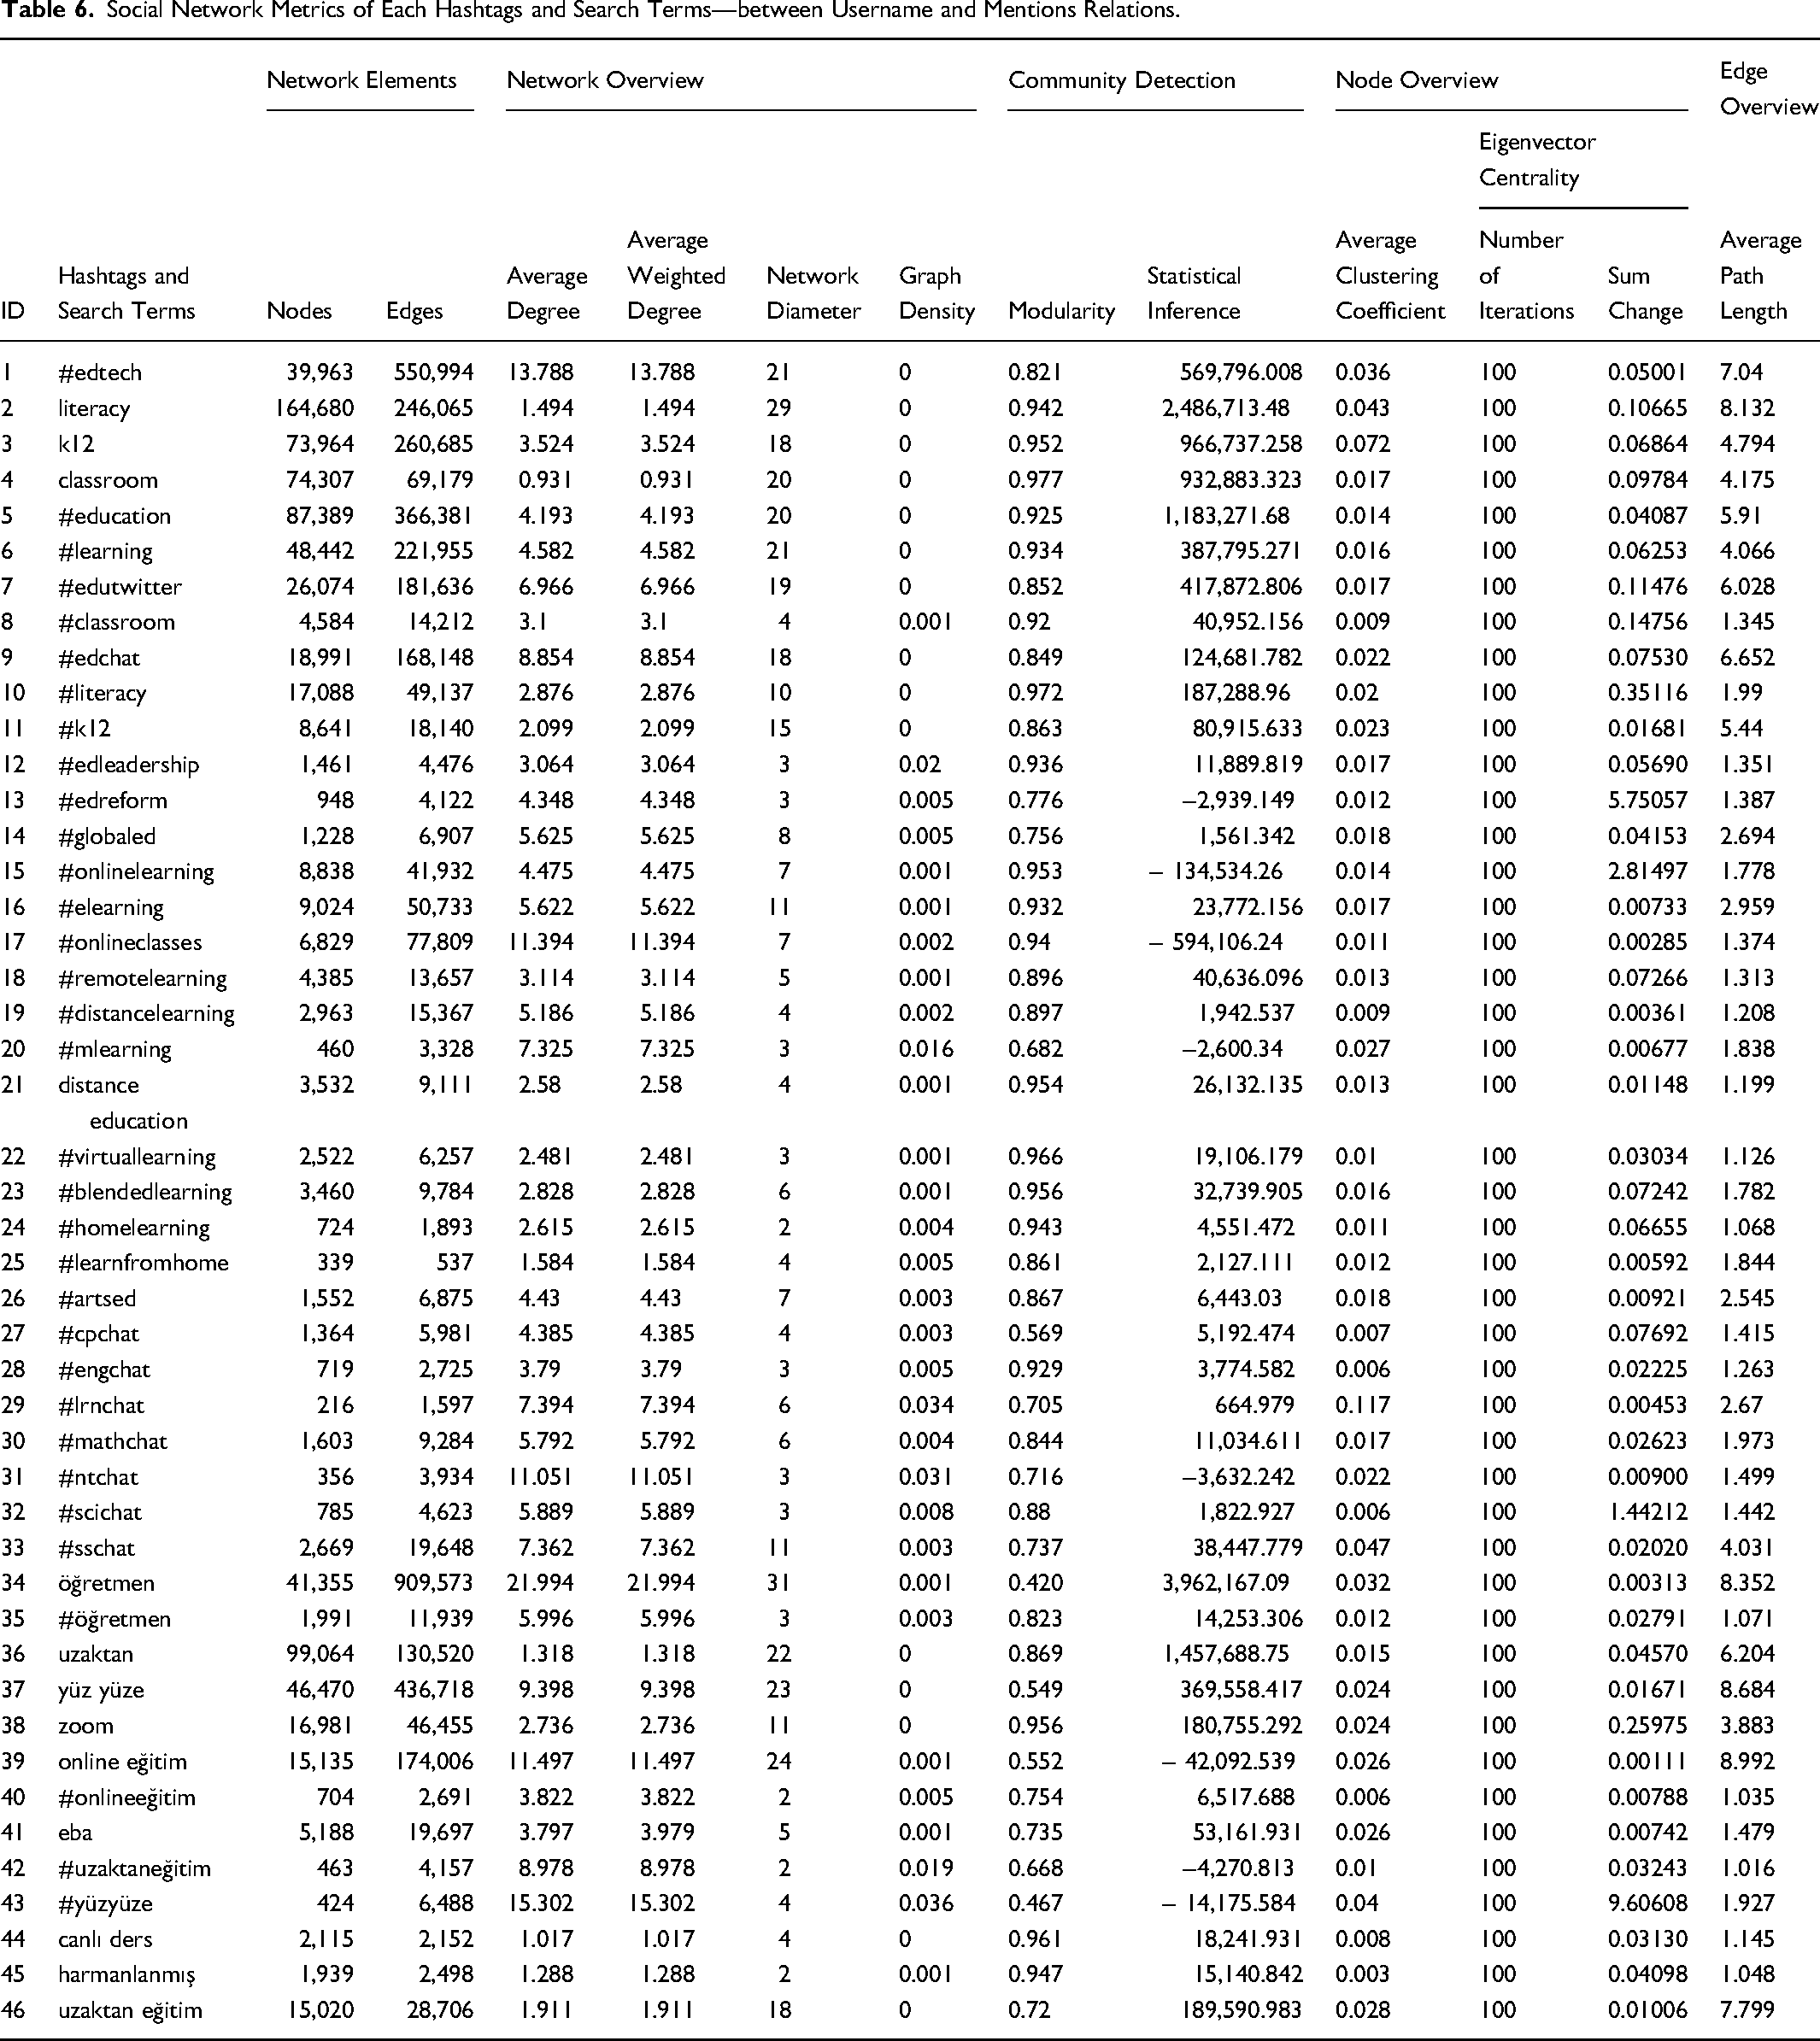
#edtech hashtag
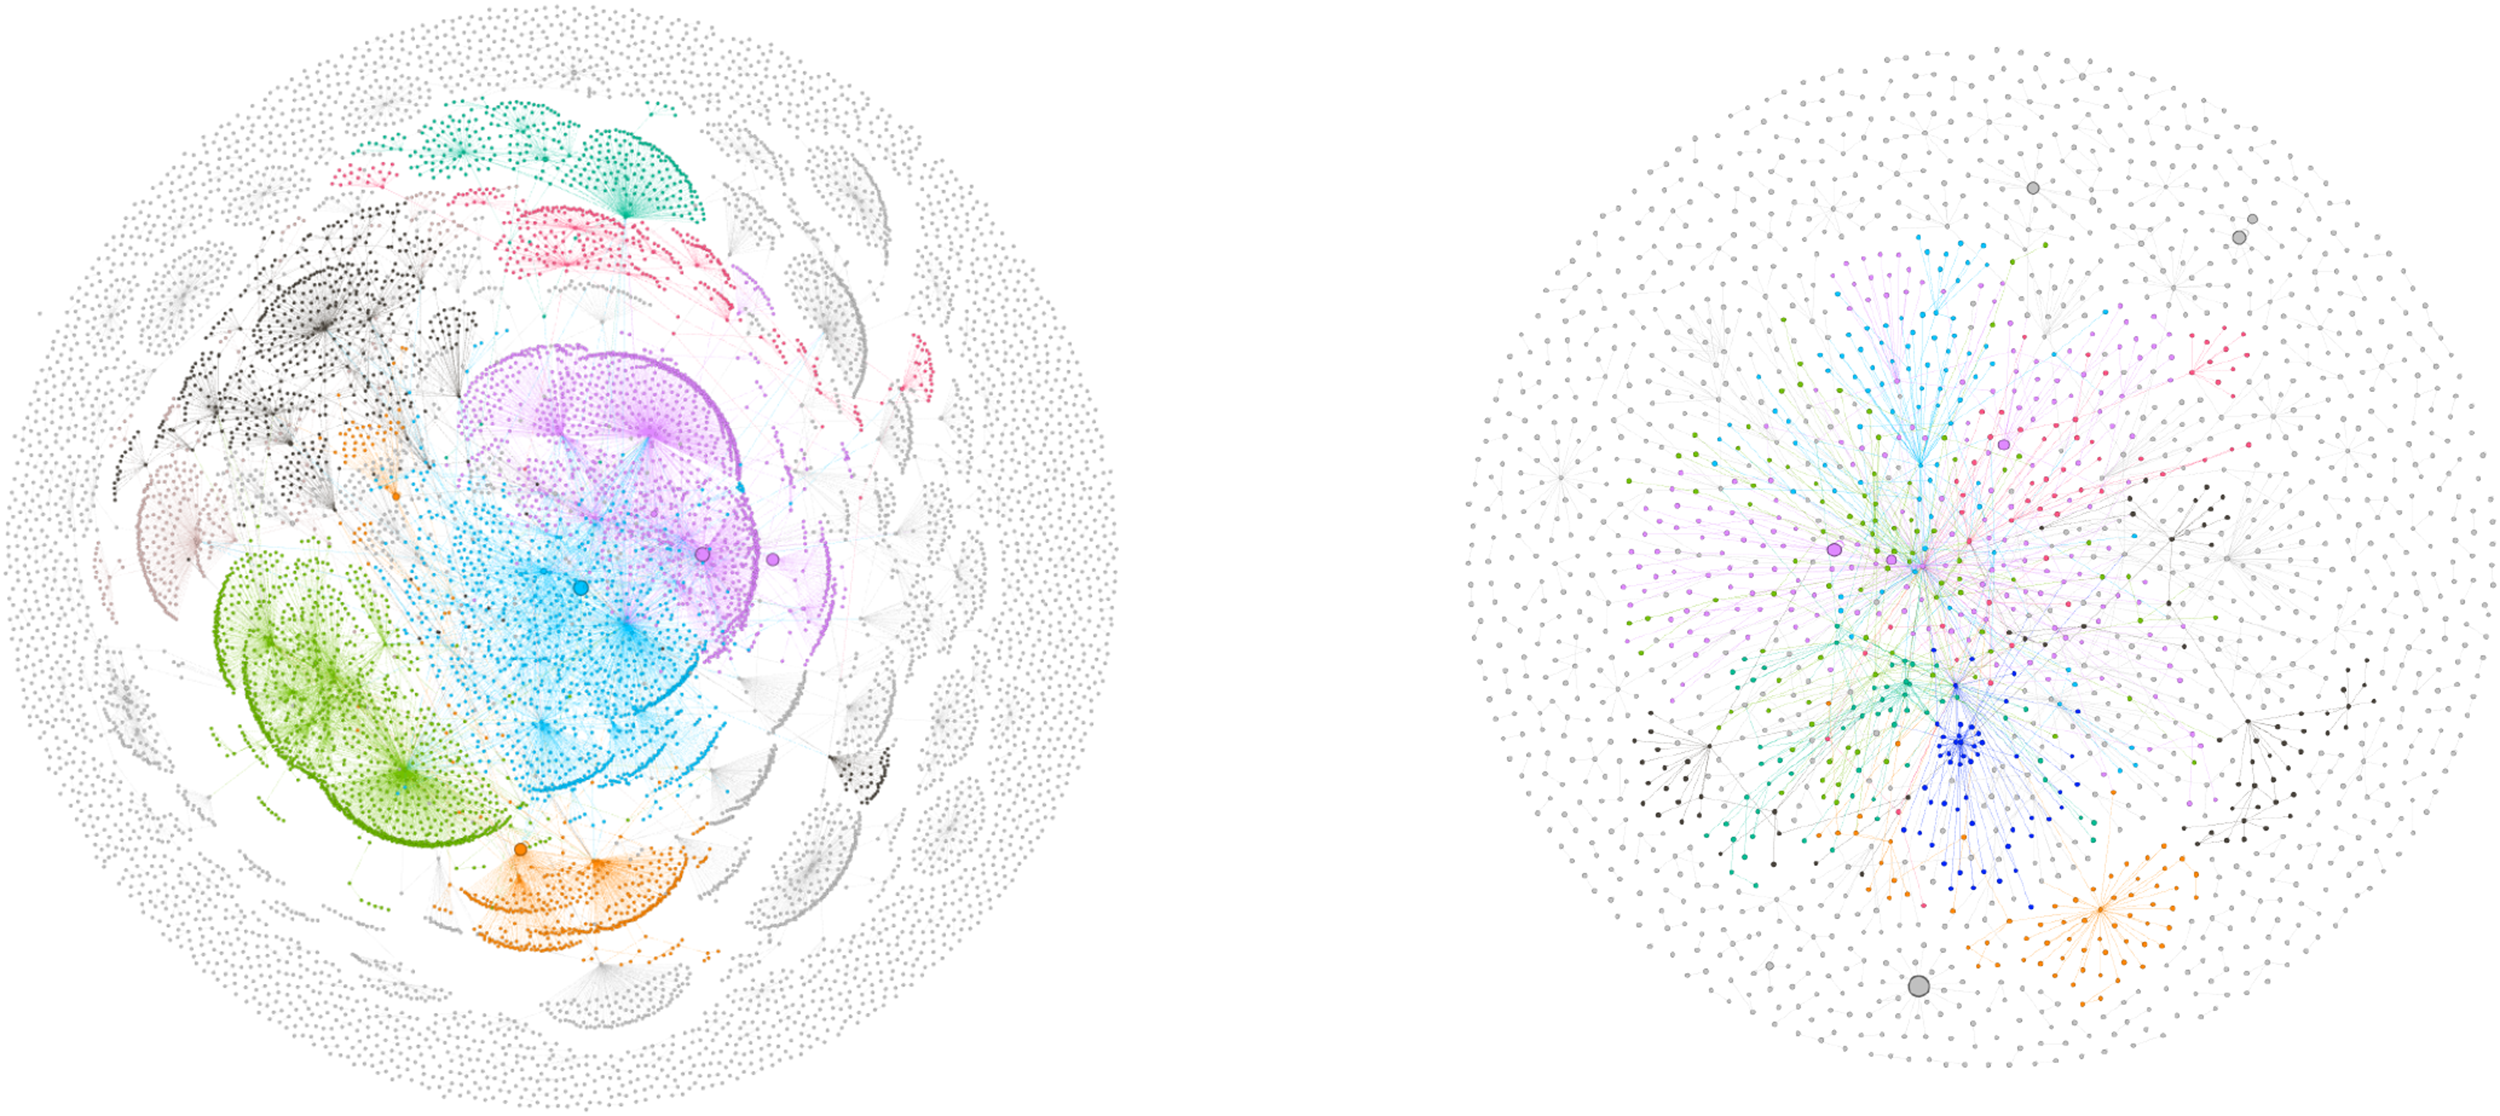
#edtech is a Twitter tag where discussions related to educational technology are gathered. Considered as a tag for conversations related to education or online learning, #edtech is in the group where dense data is collected. The relationships examined in sociograms are between retweeters and usernames (first type) or between user names and the people mentioned in the tweet content (second type). These two types of sociograms are referred to as the retweeters’ network/sociogram or the mentioned network/sociogram in subsequent comments. As the interaction and communication they establish with user names are common in both, this path has been followed. Two types of sociograms are shown in the relevant way for all tags and search terms (Figure 4).
Sociograms of #edtech.
In the retweeters’ sociogram, the number of nodes and edges is among the top 6 tags as edge numbers when it comes to mentioned people, and the average degree and average weighted degree are also in the top 6 in both sociograms. In the retweeters’ network, each node establishes an average of 4.8 relationships, while in the case of mentioned people, it is observed that different nodes are communicated with an average of 13.8. The modularity value used in calculating the clusters in the network is average for retweeters, while it is at a high level in the sociogram of mentioned people. Although this shows that the interaction among Twitter users who use the tag is respectively moderate and low, it can be considered normal when the size of the network is taken into account. Indeed, the tag has the third highest value in terms of average degree and average weighted degree, which is equal to this number in directed sociograms, and it shows that the relationships are more than the density of the data coming with the number of nodes and edges.
It has been determined that the first 8 colored clusters in #edtech sociograms account for nearly half of the users who use this tag for both sociograms. In total, there were 2174 nodes in 1852 clusters among retweeters and mentioned users. The ratio of nodes in the retweeters’ sociogram is 55.31%, while it is 40.07% in the mentioned users’ sociogram. The cluster with the most nodes in the retweeters’ sociogram is shown in blue with a percentage of 16.02%, followed by burgundy with 8.53%, light green with 7.78%, light pink with 5.41%, brown with 4.89%, dark pink with 4.81%, red with 4.59%, and dark green with 3.38%. In the mentioned users’ sociogram, these percentages are 7.28%, 5.89%, 5.4%, 5.09%, 4.67%, 3.99%, 3.9%, and 3.85%, respectively. The ratios of the colored clusters for the subsequent sociograms are not provided, and the distribution of interactions and communication among the clusters is evaluated based on the total of the first 8 colored clusters.
In both sociograms, the high group is located in the network diameter. This makes sense considering the intensity of data communication among users who use the #edtech tag and mention or retweet others. Nevertheless, there are still a large number of people and clusters with whom they can communicate. Although the network diameters are large, the communication and interaction are observed to be concentrated in certain clusters among the colored clusters.
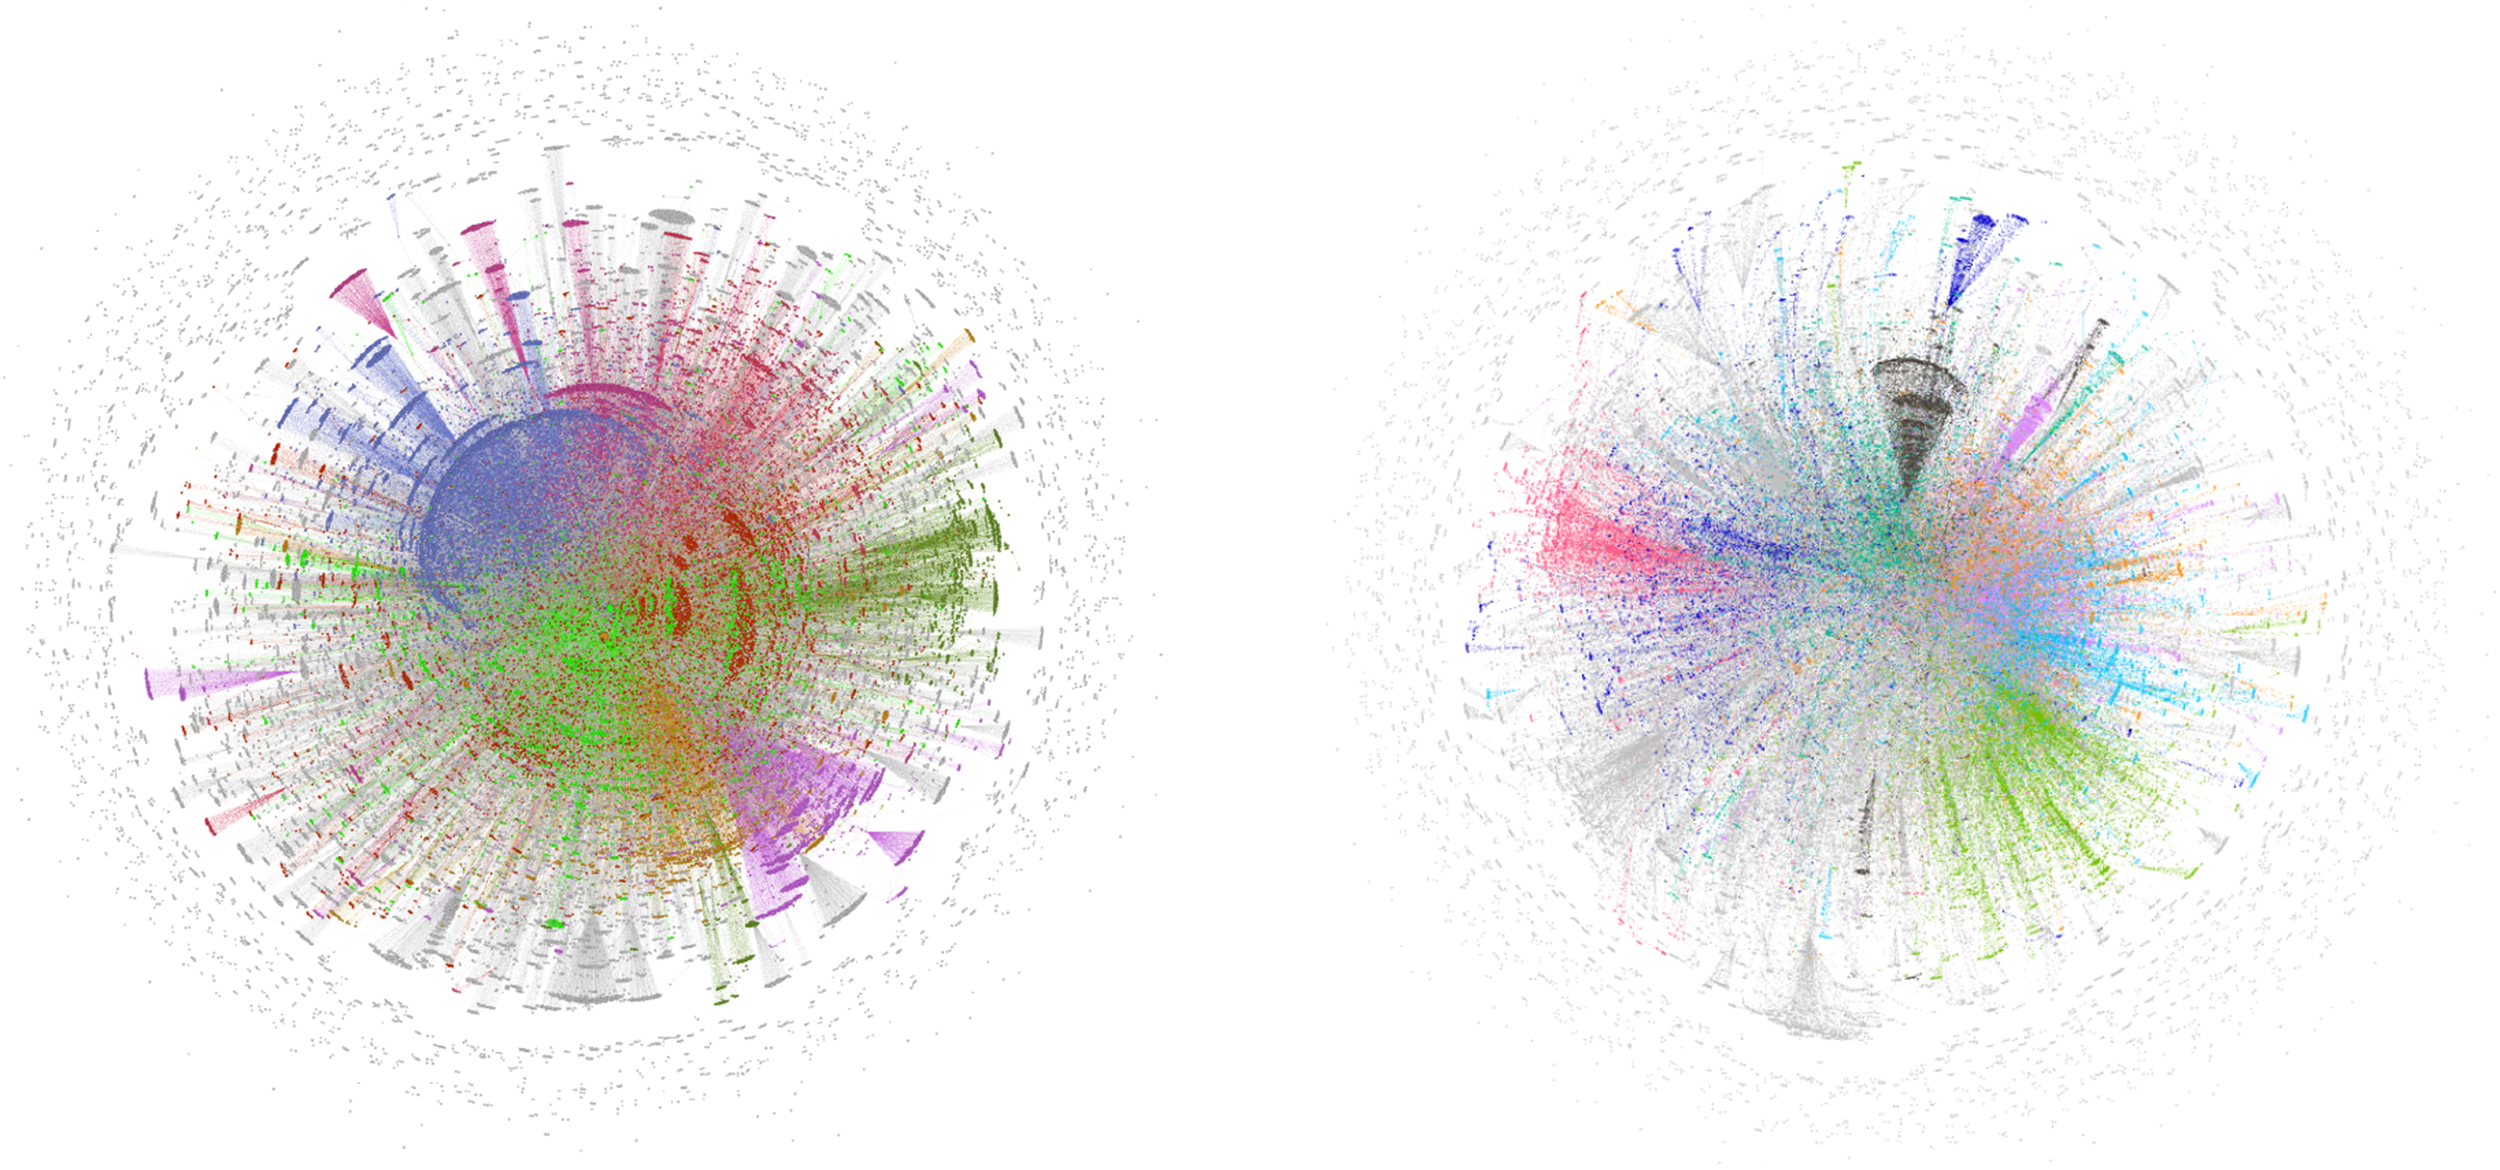
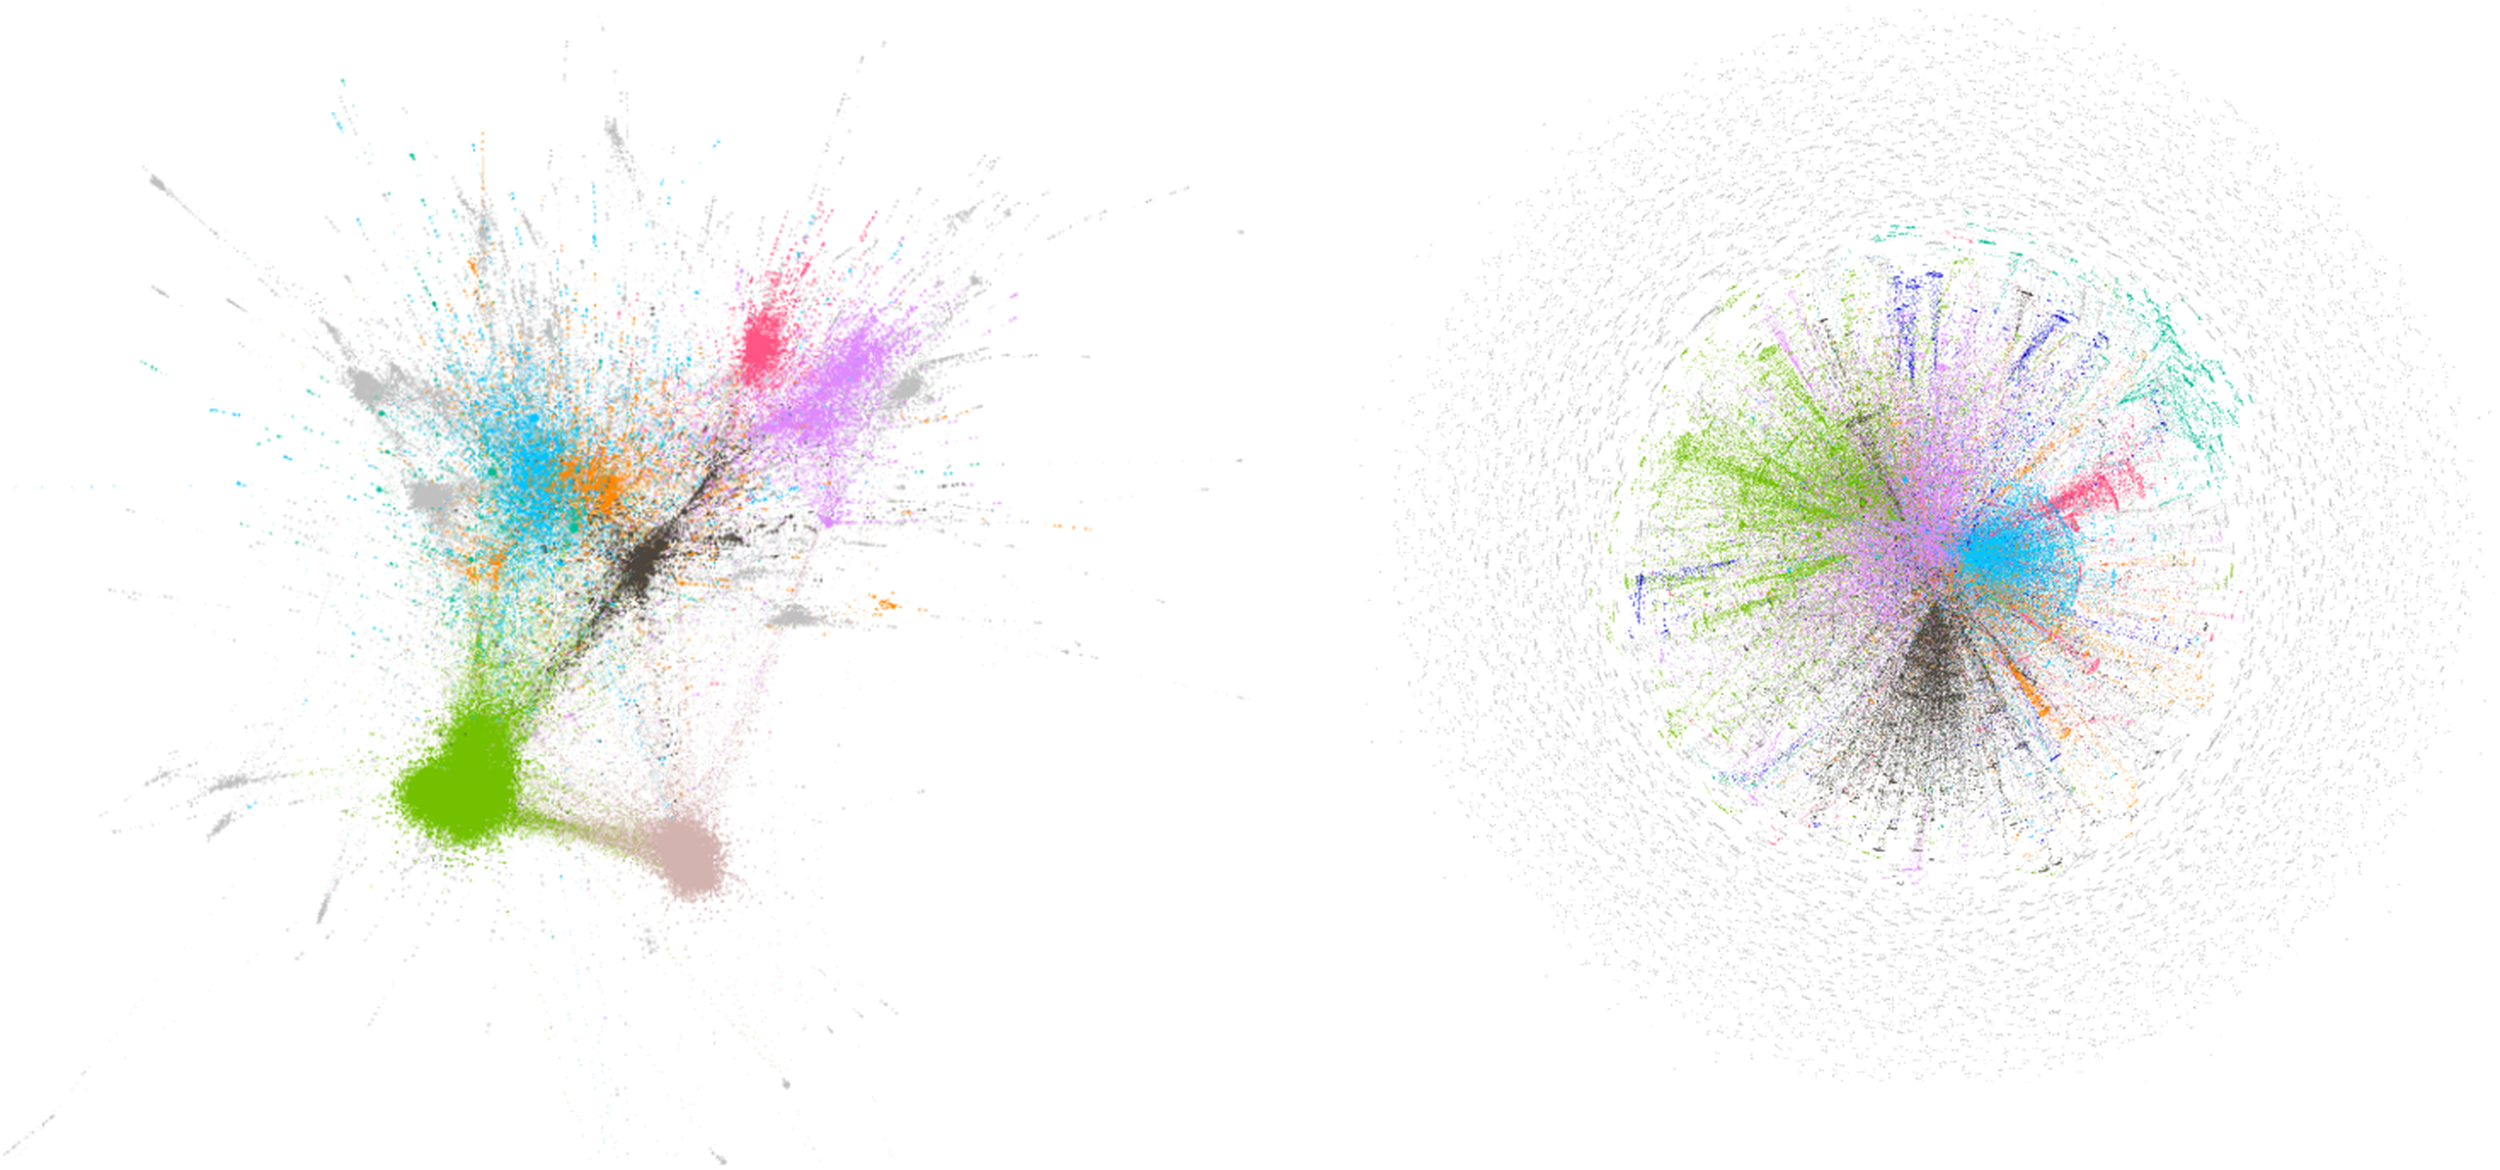
Sociograms of #onlinelearning.
#onlinelearning hashtag
The hashtag #onlinelearning is the first Twitter tag related to online learning and is semantically equivalent to the term online learning, which is also examined in this study. It is one of the data sets with intensive data collection, and in this sense. Although this intensity may not be reflected in the number of nodes and edges in sociograms, it can be said that the communication established among members in clusters is high when the average degrees are examined. The average degrees are among the first 6 hashtags, and each node in the retweeters has established 3.7 edges with different nodes in the network of mentions. Modularity values were found to be moderate in retweeters and high in mentioned groups. In the retweeters’ network, interaction occurred in 2210 clusters, while in the mentioned network, it was distributed in clusters (%19.83). The first 8 clusters highlighted in the retweeters’ network constituted a significant portion of the network (%36.57), and the interaction was average while the clusters were distributed in the mentioned sociogram. When the average degrees and highlighted clusters are considered together in the mentioned network, although it seems that there is a lot of communication because the average degrees are high in each cluster, it turned out that there are no large clusters. The network diameters were determined to be 7, and in both sociograms, communication can occur at an average level between nodes. However, it was found that there is more communication and interaction in the retweeters’ network, especially when there is no communication in the mentioned sociogram (Figure 5).
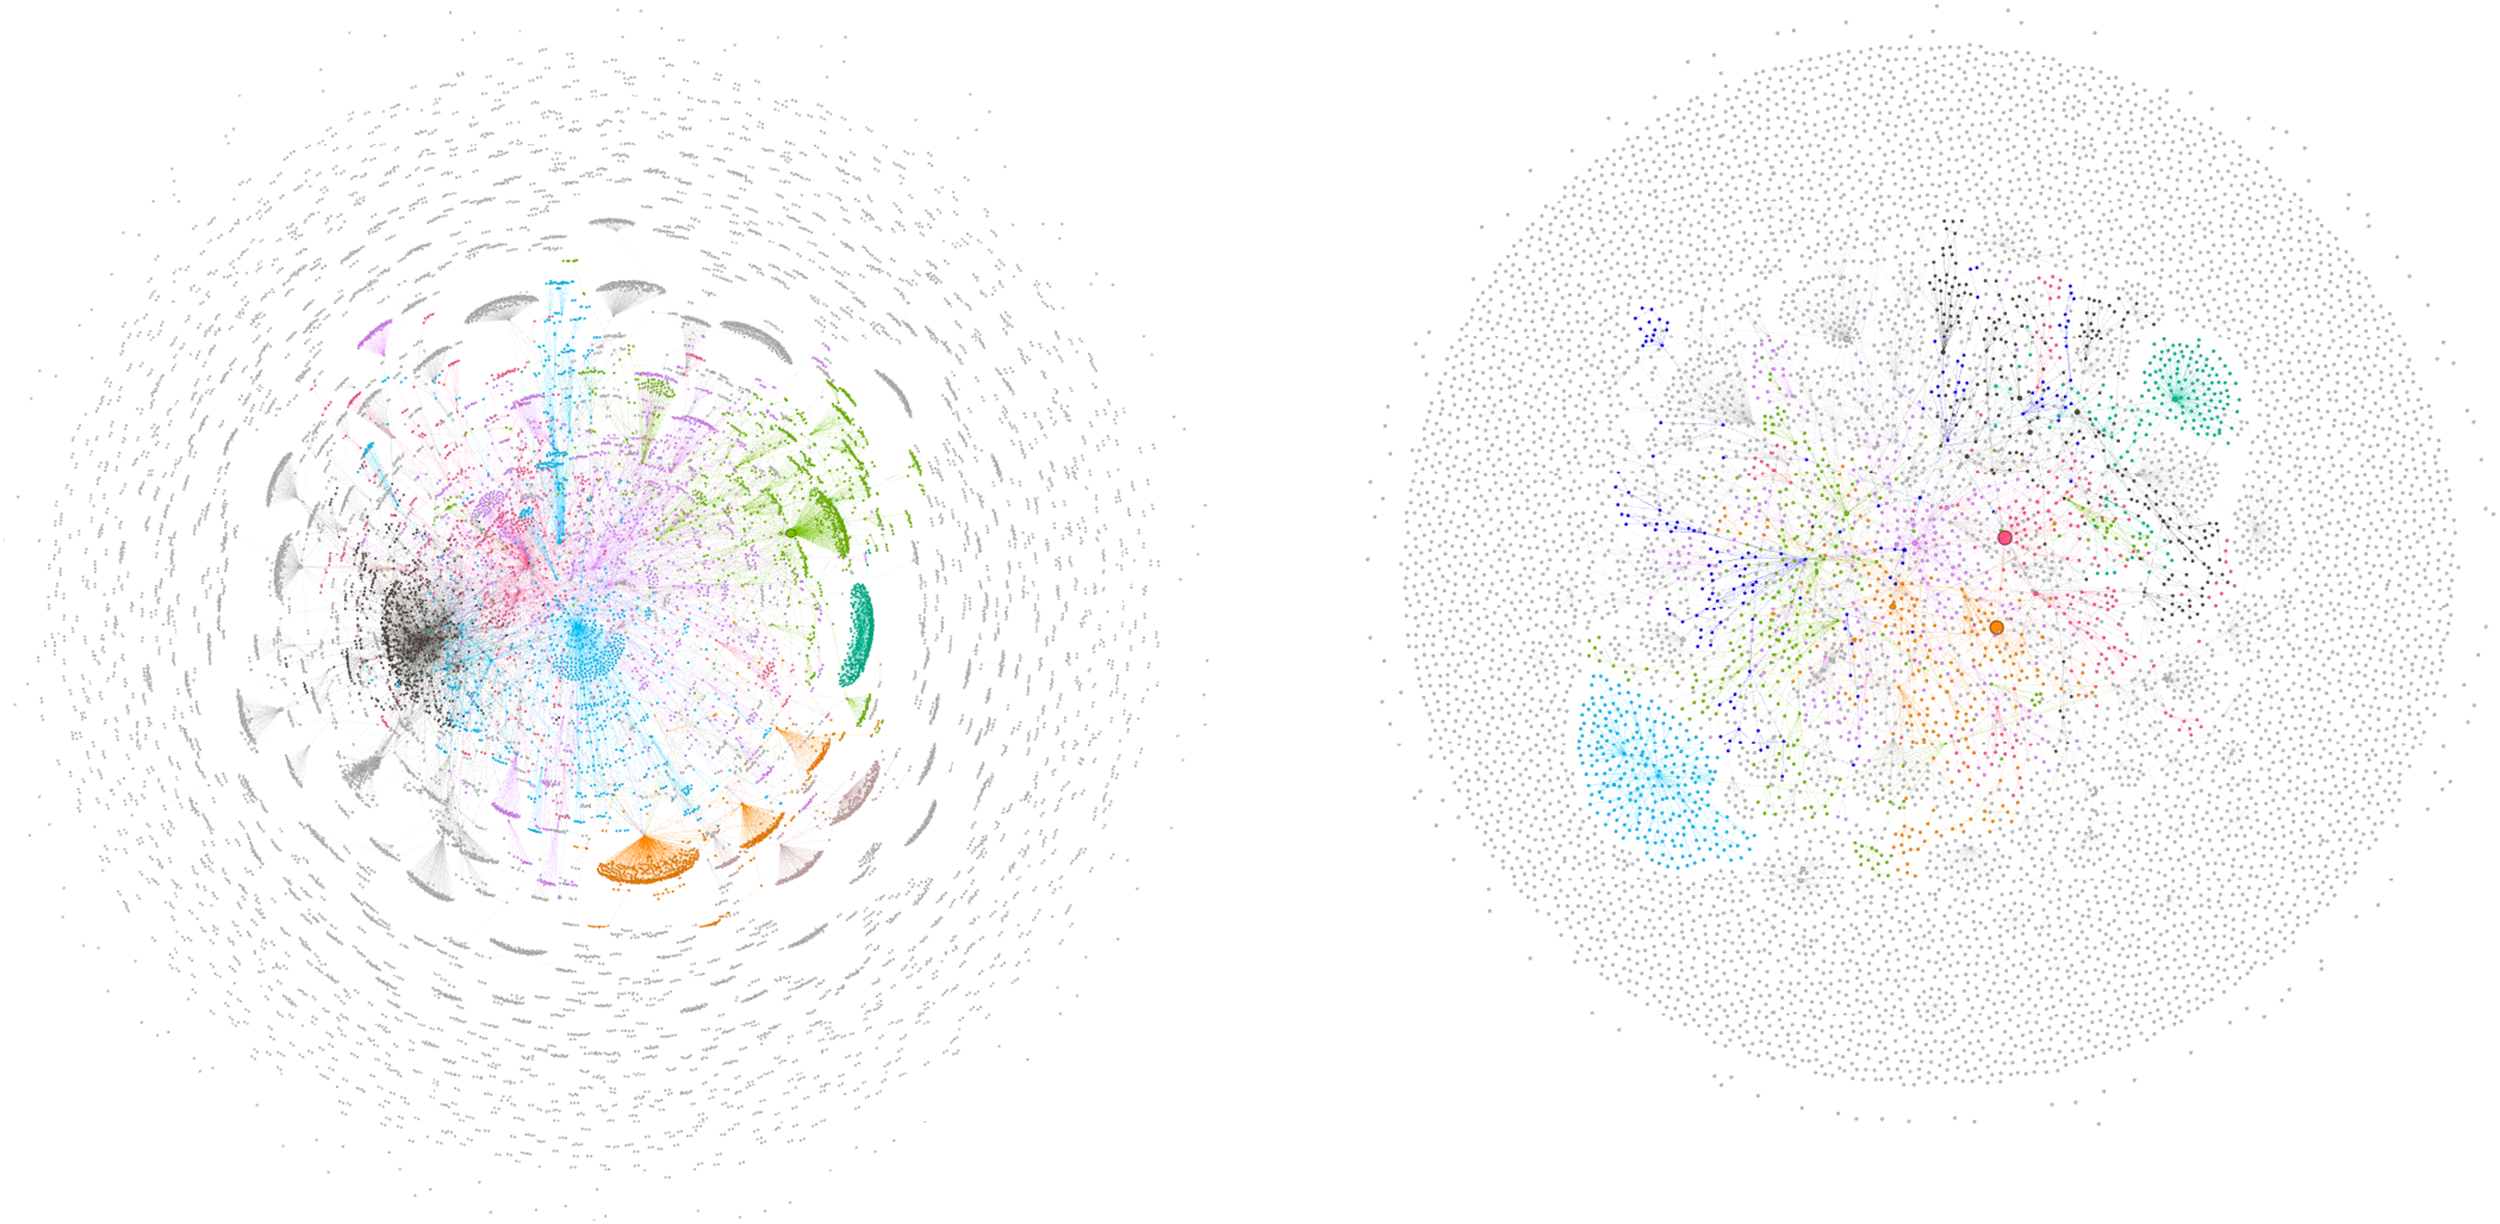
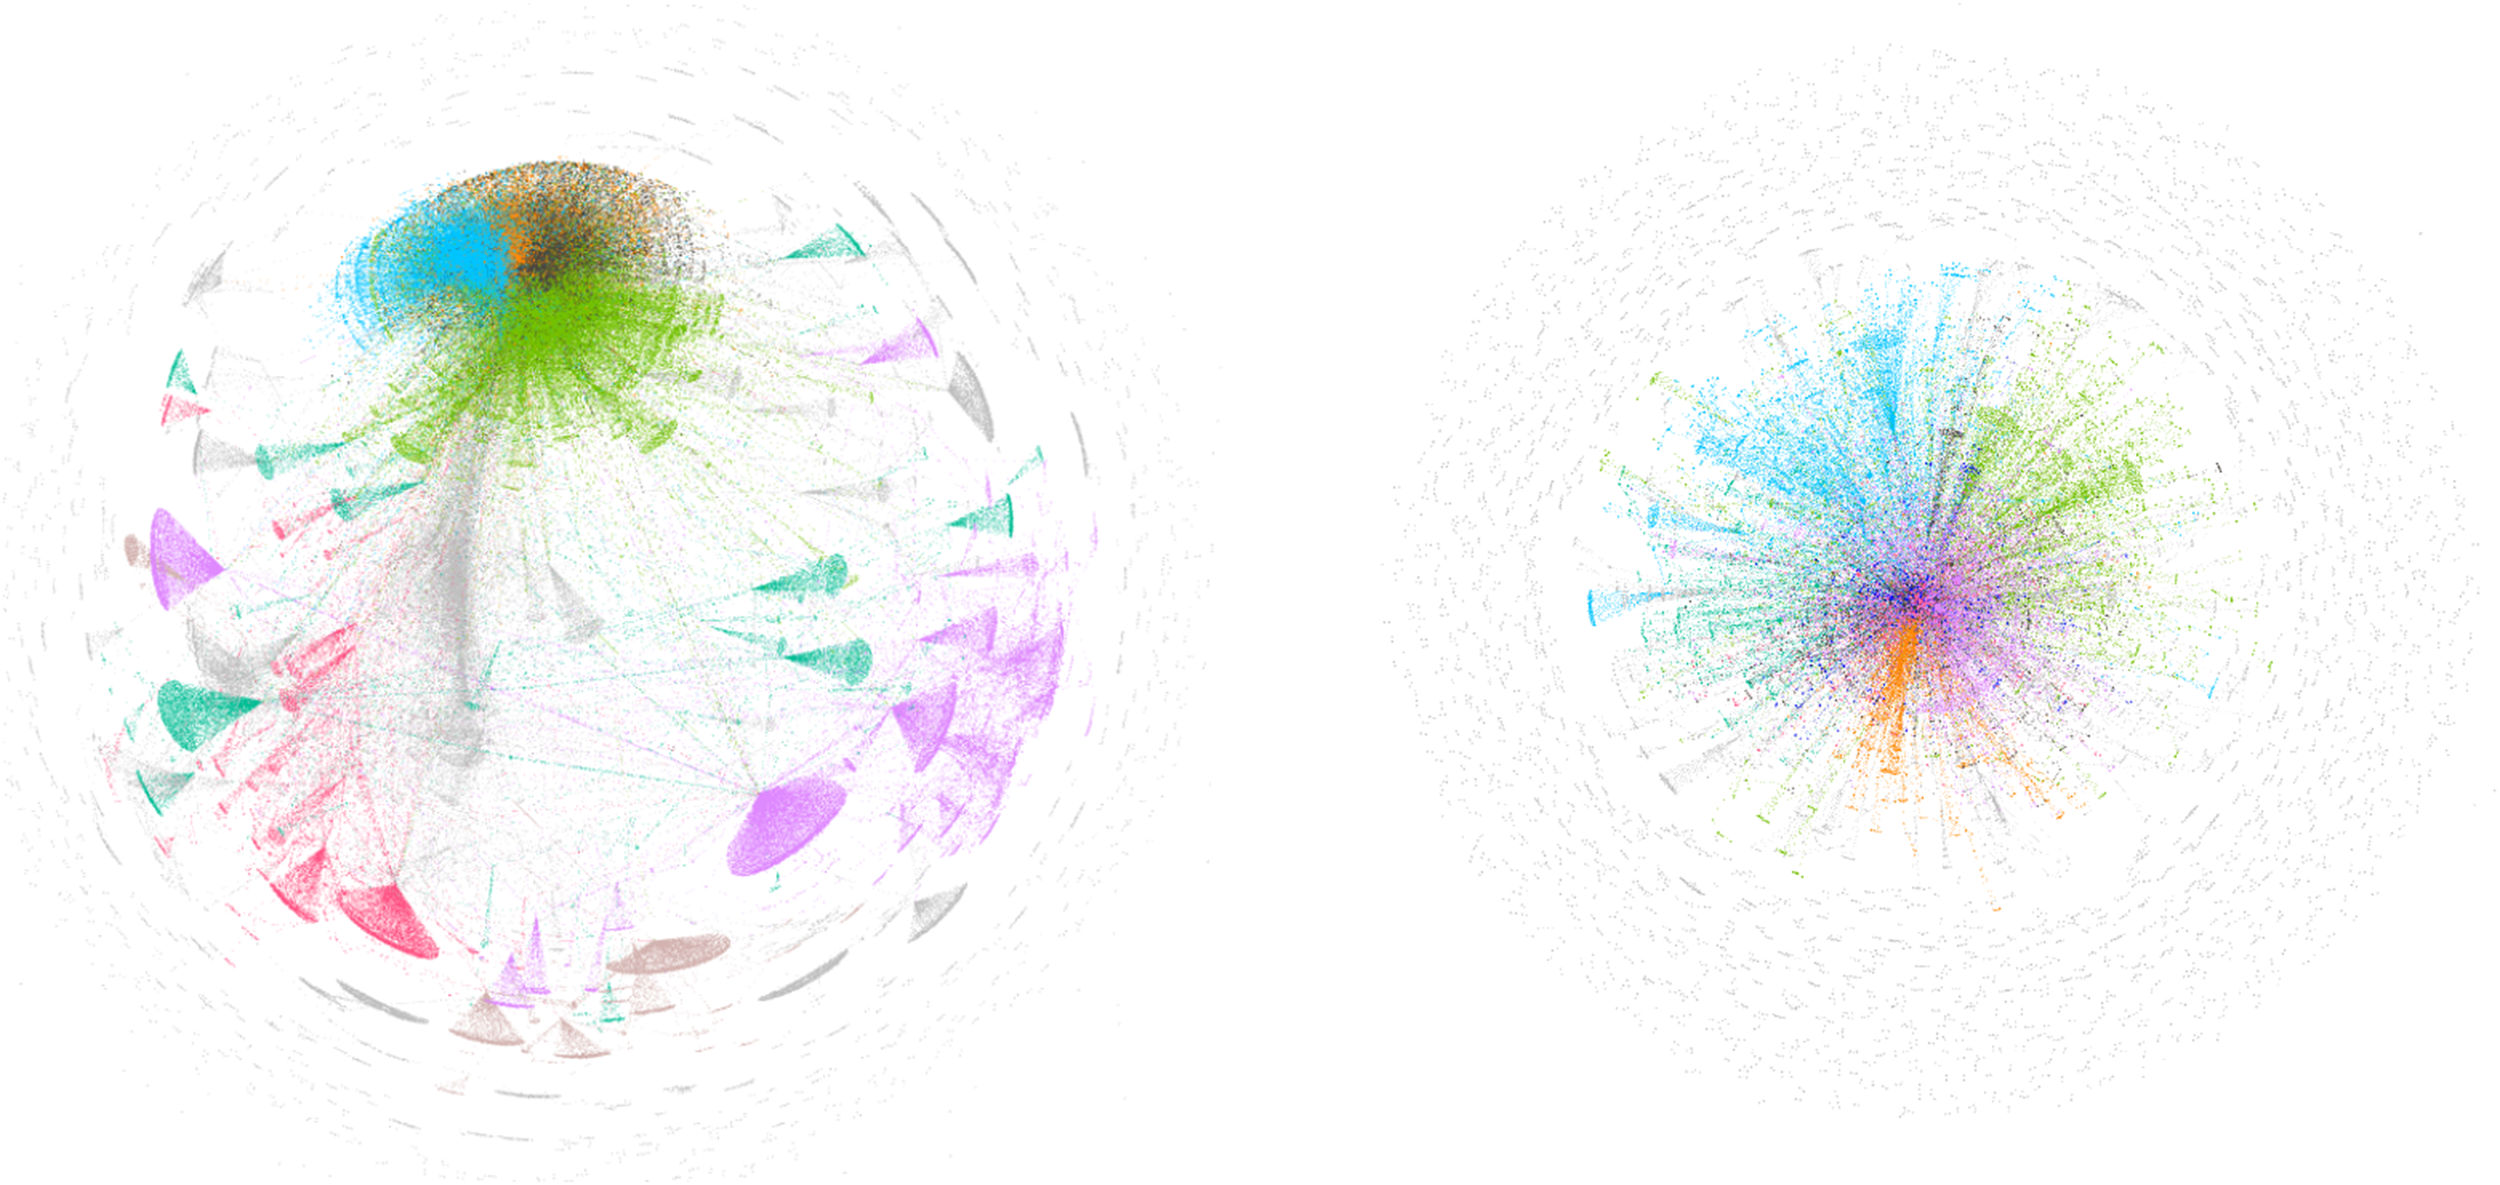
Sociograms of #artsed.
#artsed hashtag
The #artsed hashtag is used to pull tweets related to art education and to monitor discussions in this area. The data in this hashtag is sparse, as can be seen from the number of nodes and links. The average degree between nodes shows that there is an average of 1 link between users and retweeters, and an average of 4 links involving mentioned users. Communication is low among retweeters, but high among mentioned users. The modularity values are low in both cases, indicating that there are few clusters. When the 8 largest and most colored clusters are examined, it can be seen that these clusters have a high density of nodes. There are a total of 213 clusters among retweeters and 219 clusters among mentioned users. The colored clusters represent 75.84% of the retweeter network and 44.52% of the mentioned user network. Therefore, interactions between users are concentrated in certain clusters in both retweeter and mentioned user networks and are high. When the network diameter is examined, it shows average values, indicating that communication and interaction between nodes can be achieved at an average level in both networks. However, communication is low among retweeters. Other values show higher communication and interaction than expected (Figure 6).
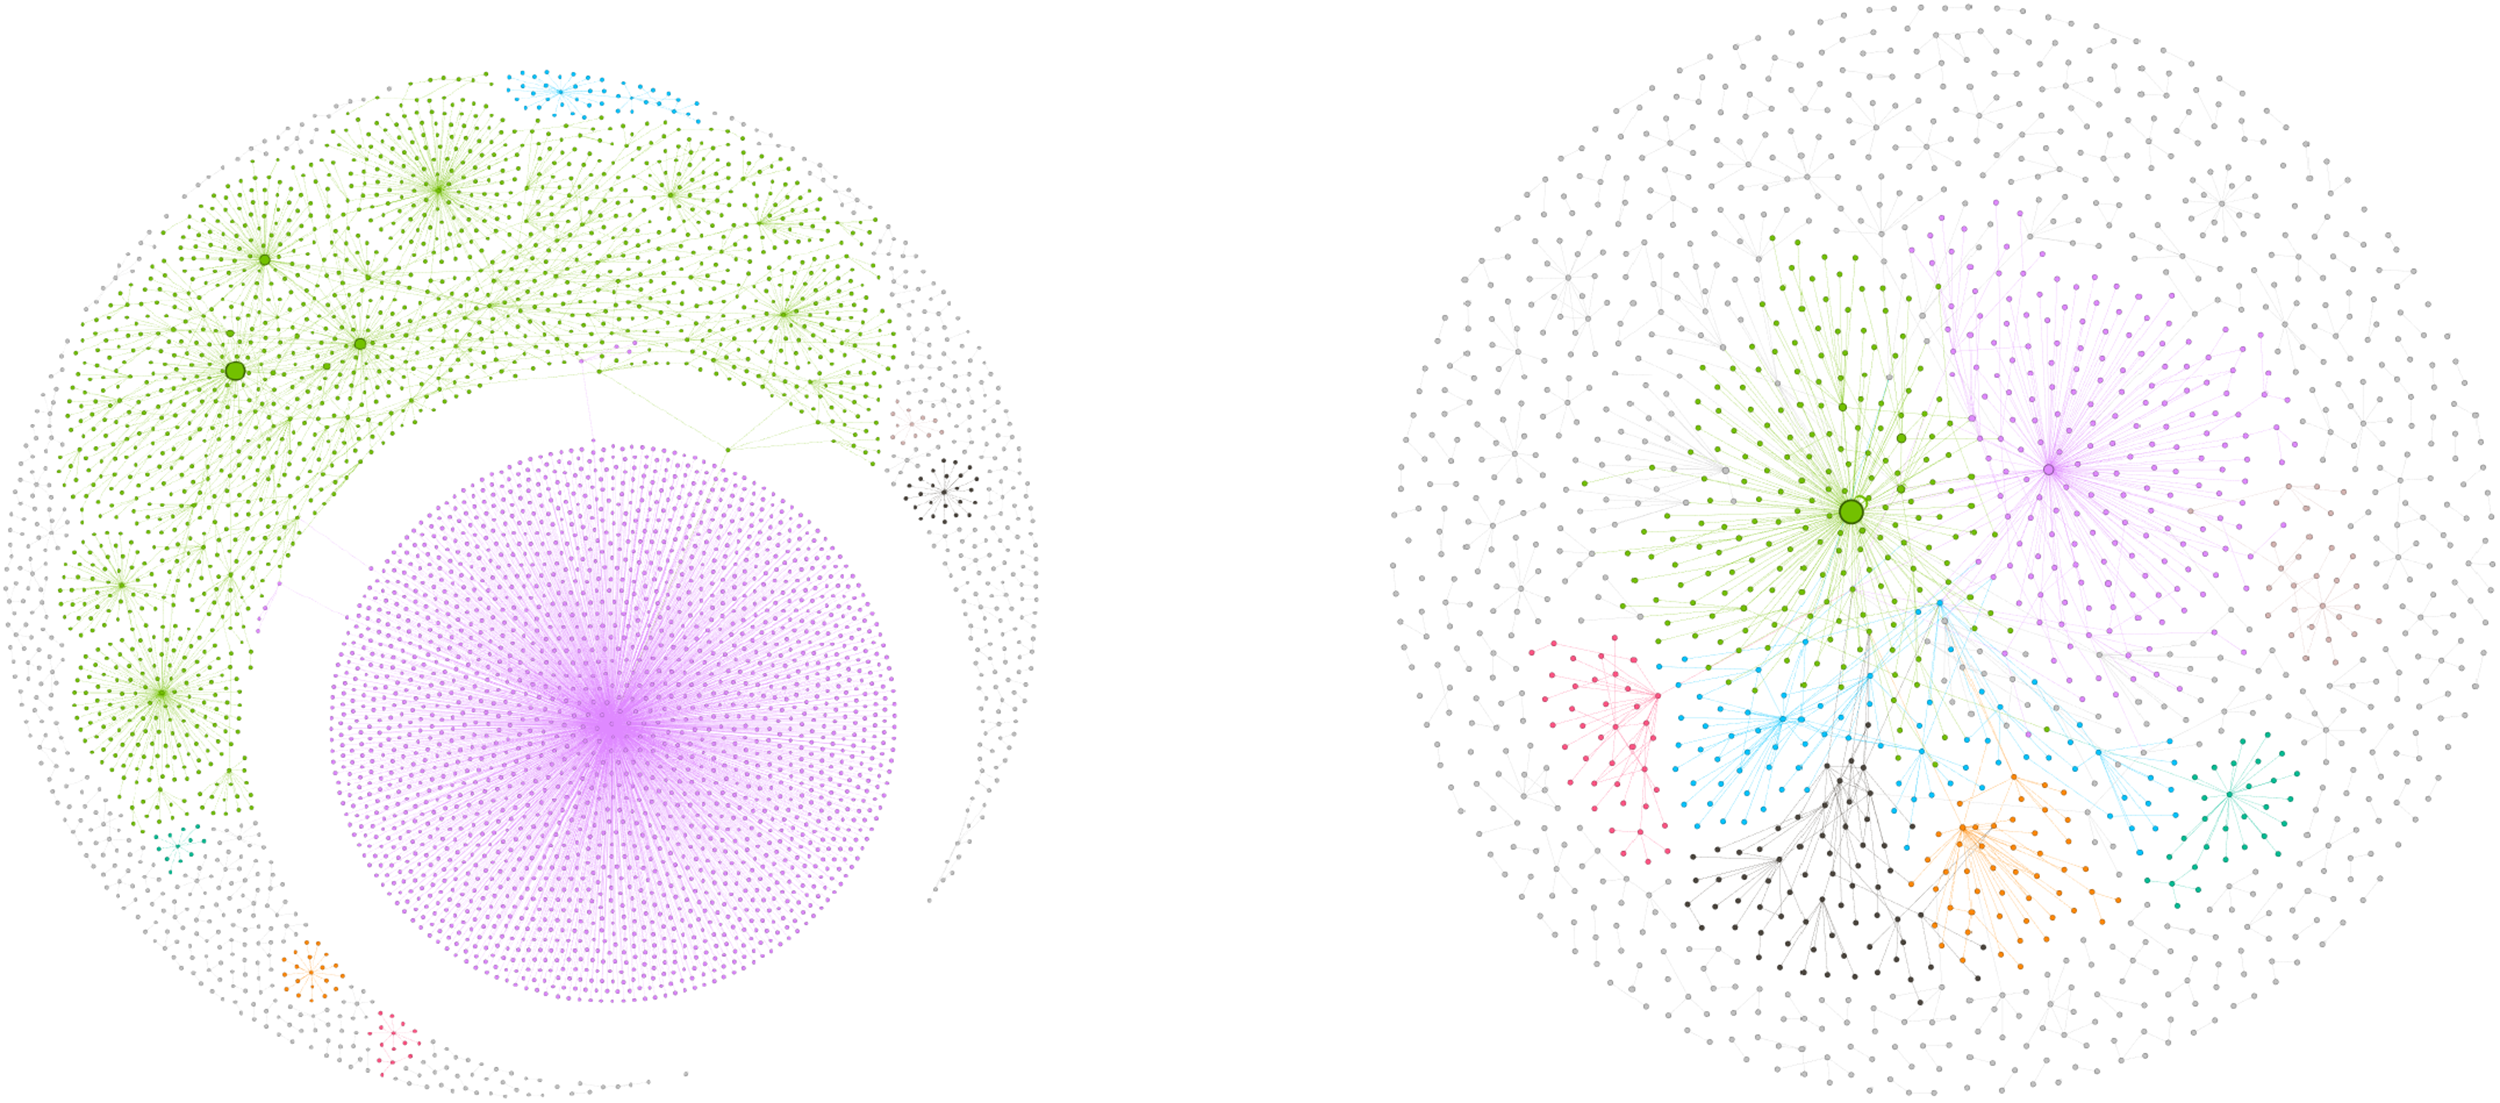
Sociograms of #öğretmen.
#öğretmen hashtag
The #öğretmen hashtag is a Twitter tag that is related to teachers and is examined for Turkish conversations, just like the “öğretmen” search term. The collected data is sparse. When the node and edge numbers were examined, it was found that they had average values. When the average degrees were examined, it was observed that each node in the retweeters’ network had 1.4 connections, while they were connected to 6 different nodes in the mentioned network. Therefore, it was determined that there was higher communication in the mentioned network. Both sociograms have high values in terms of modularity. That is, in the clusters formed, there were 798 retweeters and 325 mentioned in the network. In the first 8 colored clusters, 51.47% of the interaction occurred in the retweeters’ network and 34.15% in the mentioned network. The network diameters are low, and communication between nodes is easy. While this situation facilitates interaction and communication in retweeters, it was determined that there is less interaction and communication in the mentioned network (Figure 7).
Sociograms of “yüzyüze” search term.
“yüzyüze” search term
The search term “yüz yüze” is one of the most tweeted search terms where the data was collected, considering that it can be compared to the education given remotely with face-to-face education. This is the last tag or search term where dense data was collected. This situation is reflected in the number of nodes and edges. In the sociogram of retweeters, it is among the top 6 hashtags or search terms in terms of number of nodes and number of edges in terms of mentioned. The average degrees were found to be 3.3 (RT) and 9.4 (M) respectively. It can be said that there is high communication between nodes. The modularity values are borderline high for retweeters, while the average value is borderline for the mentioned. In the retweeters’ network, 3240 clusters were formed, and the colored clusters made up 66.12% of the entire network. In the mentioned network, 8013 clusters were formed, and the colored clusters covered 41.15% of the entire network. It can be said that there is high interaction in the colored clusters. The modularity value is the lowest among the top 6 tags or search terms related to the mentioned sociogram. It can be said that most of the total nodes in the clusters are in the first 8 colored clusters. The network diameter is high, and communication is difficult. Nevertheless, it can be said that interaction and communication are concentrated in the colored clusters with high numbers of nodes and edges (Figure 8).
Sociograms of “online eğitim” search term.
“Online eğitim” is a search term consisting of Turkish tweets about online learning, considering the frequent use of the word “online”. It is a moderately popular search term, ranked among the top 6 in the sociogram of retweeters. Both sociograms had high average degree values: 6.4 in the retweet network and 11.5 in the mention network. These values indicate relatively high levels of connectivity in both the retweet and mention networks. The modularity values were among the lower values reported for the selected sociograms, suggesting that interactions were less strongly separated into isolated communities. There were 986 clusters in the retweet network, with the largest coloured clusters comprising 72.32% of the entire network. In the mention network, there were 2,326 clusters, with the largest coloured clusters covering 51.16% of the network. The high network diameter suggests that some nodes were connected through longer paths; however, interaction remained concentrated within the largest coloured clusters. Overall, the “online eğitim” search term produced a relatively connected Turkish-language discussion space in which interaction was concentrated around visible clusters (Figure 9).
RQ2: What Sentiment Patterns are Observed in Twitter Discussions about Online Learning During the Late Pandemic Period?
This section presents the sentiment distribution of tweets across the 46 hashtags and search terms included in the analysis. As explained in the Method section, NVivo's dictionary-based sentiment analysis classified the cleaned tweet contents into positive, negative, neutral, and mixed categories. Mixed sentiment was treated as a separate category because some tweets contained both positive and negative elements within the same textual unit. Therefore, mixed sentiment was interpreted as an indicator of ambivalent or complex evaluation rather than being added mechanically to either positive or negative sentiment totals. Turkish tweets were translated into English before classification to allow sentiment patterns to be examined within a unified analytical workflow. Accordingly, the results in Table 7 should be read as corpus-level sentiment patterns across hashtags, search terms, and language groups.
Distribution of Sentiment by Each Hashtag and Search Term.
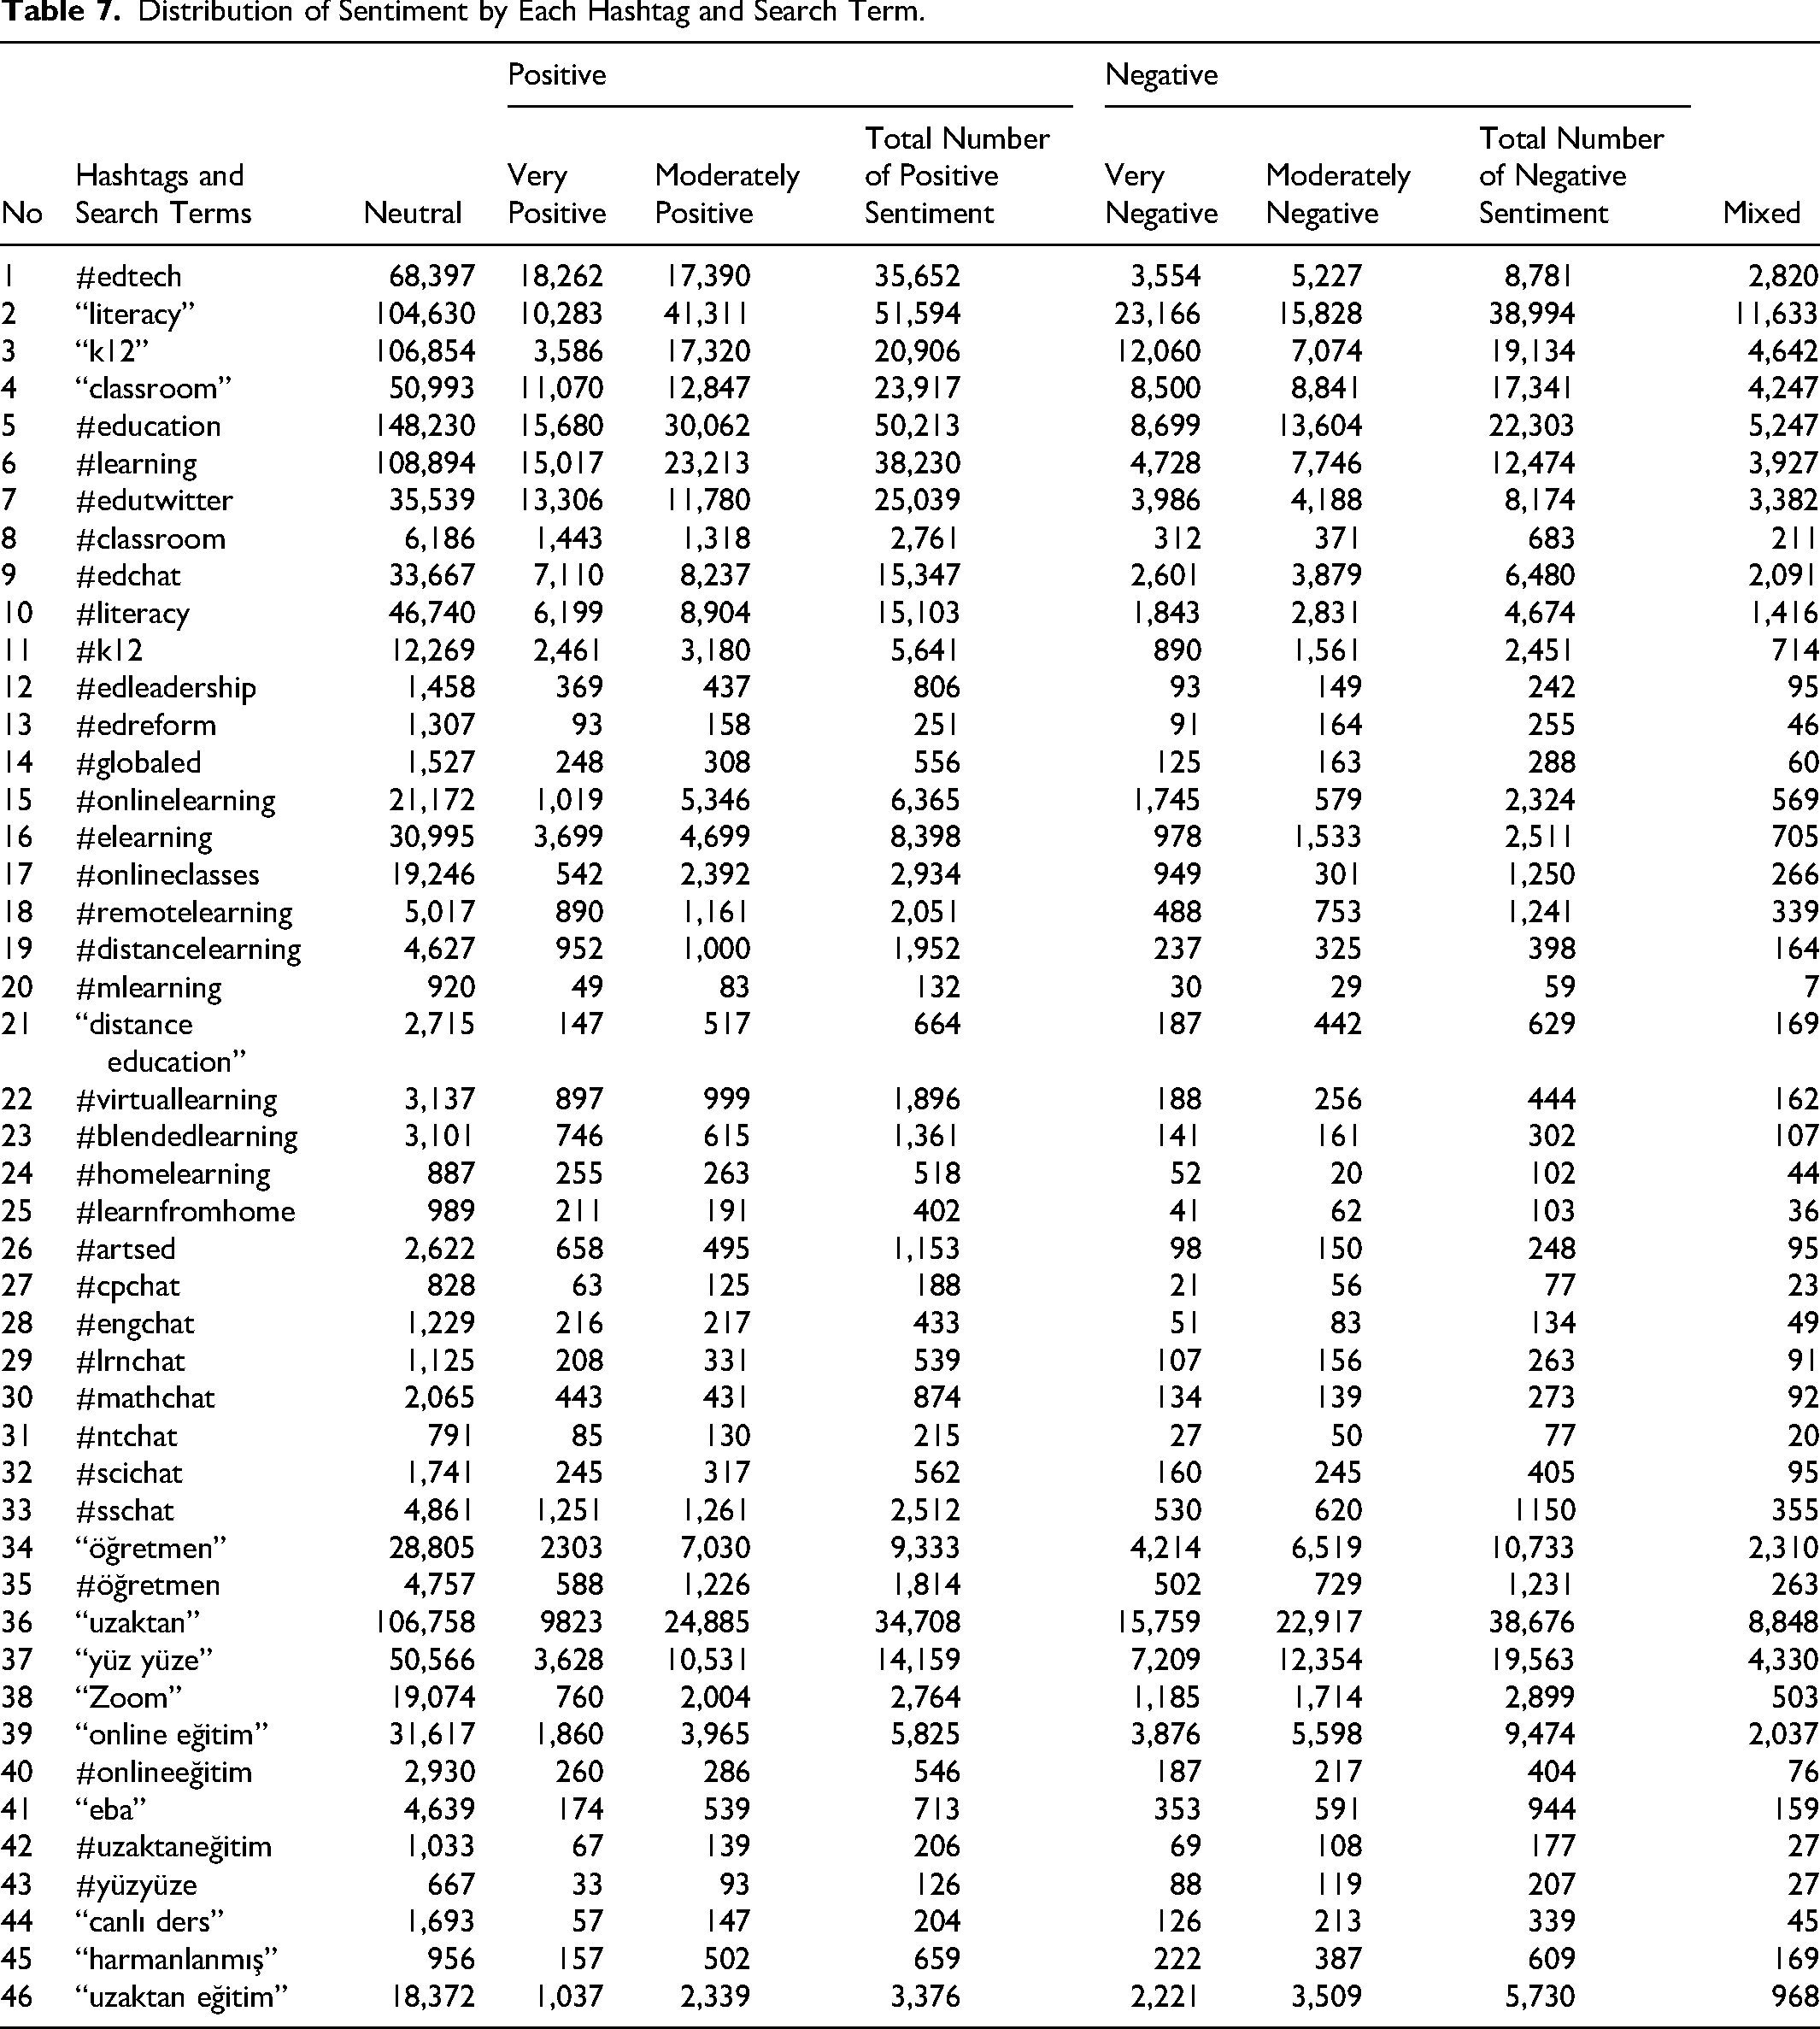
Neutral sentiment also dominated the Turkish tweet contents. However, negative sentiment was more visible than positive sentiment in several Turkish hashtags and search terms, particularly “öğretmen,” “uzaktan,” “yüz yüze,” “online eğitim,” and “uzaktan eğitim.” In contrast, positive and negative sentiment frequencies were relatively close in terms such as “zoom,” “harmanlanmış,” #onlineeğitim, and #uzaktaneğitim. Across both positive and negative categories, moderate sentiment was more frequent than strong sentiment. This pattern suggests that Turkish online learning discussions in the corpus were often expressed through moderate rather than highly polarized emotional language.
Conclusion
This study examined Twitter discussions on online learning during the late pandemic period by combining social network analysis and dictionary-based sentiment analysis. The study was based on 6,070,574 tweets collected through 46 English and Turkish hashtags and search terms between July 1 and November 28, 2021. After data cleaning, 1,689,442 unique tweets were analysed for sentiment. The study's main argument is that online learning was not discussed on Twitter only as a technical solution for continuing instruction. It was discussed through concrete educational concerns such as teachers, classrooms, online platforms, live lessons, distance education, face-to-face schooling, learning resources, access, and communication.
This argument is important because the late pandemic period was no longer the first emergency stage of school closures. Earlier work has distinguished emergency remote teaching from carefully designed online learning (Hodges et al., 2020), and global accounts of the pandemic have shown that education systems had to respond quickly to interrupted schooling, unequal access, and changing institutional expectations (Bozkurt et al., 2020). By the second half of 2021, online learning had become a familiar but still contested part of educational life. Twitter discussions therefore provide evidence not only about whether online learning was mentioned, but also about how it was circulated, who or what became visible in the discussion, and which terms carried more neutral, positive, negative, or mixed sentiment.
The findings show that online learning discourse on Twitter was organized around different types of terms. Broad educational hashtags such as #education, #learning, and #edtech produced large and heterogeneous networks. More specific online learning terms such as #onlinelearning, #remotelearning, #distancelearning, “online eğitim,” “uzaktan eğitim,” “canlı ders,” and “eba” produced more focused discussion spaces. Turkish terms such as “öğretmen,” “uzaktan,” and “yüz yüze” show that online learning was often discussed in relation to teachers, distance education, and the return to face-to-face schooling. This finding indicates that public discussion of online learning cannot be reduced to platform use alone. It also included concerns about the social organization of schooling, teacher roles, classroom routines, and the comparison between remote and face-to-face education.
The distinction between retweet and mention networks was central to the interpretation of the results. Retweet networks showed how online learning-related content was circulated and amplified. Mention networks showed how users addressed, referred to, or interacted with other users. This distinction matters because a high number of retweets does not necessarily indicate dialogue, and a mention does not necessarily indicate agreement. Instead, each relation points to a different form of Twitter activity. Retweet networks are useful for identifying which messages or accounts gained visibility, while mention networks are useful for identifying where users directed attention or communication. By analysing both network types, the study provides a more detailed account of online learning discourse than tweet counts alone could provide.
Across the 46 hashtags and search terms, the results show that online learning discourse was not one single conversation. It was distributed across several clusters, languages, and term groups. Dense tags created wider networks, while sparse and domain-specific tags created smaller but sometimes more concentrated discussion spaces. This has a practical implication for educational institutions. Monitoring only general terms such as “education” or “online learning” may miss important concerns expressed through local or context-specific terms such as “eba,” “canlı ders,” “uzaktan,” or “yüz yüze.” For this reason, institutions that use social media evidence to understand public reactions to digital education should follow both broad and context-specific terms.
The geographical findings also need to be read in a careful and descriptive way. The maps show where location-associated tweets in the captured corpus were visible; they do not show the actual geographical distribution of all online learning experiences. English-language tweets were more visible in North America and Europe, while Turkish-language tweets were concentrated in Türkiye but also appeared in Europe and the Americas. This pattern suggests that Turkish online learning discourse in the corpus was not limited to Türkiye. However, the study does not treat this as direct evidence of diaspora participation, infrastructure quality, or platform preference. User-provided location data, missing metadata, VPN use, language choice, and query design may all shape these patterns.
The sentiment findings show that neutral sentiment dominated the corpus. This should not be interpreted as a lack of public response. In educational Twitter data, neutral sentiment may reflect announcements, questions, requests, information sharing, course-related statements, or institutional communication. For example, a tweet about a live lesson, a platform link, an exam announcement, or a return-to-school update may be classified as neutral even though it is educationally meaningful. Therefore, the dominance of neutral sentiment suggests that Twitter was used not only for emotional reaction but also for practical communication about online learning.
Positive and negative sentiment varied across languages and terms. In the English corpus, positive sentiment appeared more frequently in several hashtags and search terms. In the Turkish corpus, negative sentiment was more visible in terms such as “öğretmen,” “uzaktan,” “yüz yüze,” “online eğitim,” and “uzaktan eğitim.” This pattern suggests that Turkish discussions may have contained more visible concerns around remote education, teacher-related issues, and the comparison between online and face-to-face learning. Because Turkish tweets were translated into English before sentiment classification, this finding should be treated as a directional pattern rather than a precise cross-language measurement. Still, it is useful because it shows where concerns were more concentrated within the corpus.
The mixed sentiment category also adds value to the interpretation. Mixed sentiment tweets may include both appreciation and complaint in the same message. For instance, a user may acknowledge the usefulness of online learning while criticizing platform problems, workload, internet access, or the loss of face-to-face interaction. In the late pandemic period, such mixed evaluations are expected because online learning had become both necessary and familiar. Users were no longer only reacting to sudden school closure; they were comparing online learning with previous classroom experience and with the expected return to face-to-face education. This makes mixed sentiment important for understanding online learning as a debated educational practice.
The study contributes to educational technology research in three concrete ways. First, it extends online learning research beyond surveys and interviews by examining naturally occurring public data at scale. This is consistent with work showing the value of public internet data mining for educational technology research (Kimmons & Veletsianos, 2018) and with recent Twitter-based studies that use social media data to examine public perceptions of emerging technologies (Demirel et al., 2025; Stracqualursi & Agati, 2024). Second, it combines network structure and sentiment. This makes it possible to examine not only what users felt about online learning, but also how the discourse moved through retweet and mention relations. Third, it includes both English and Turkish discourse, which allows the study to compare how online learning was discussed across different linguistic spaces.
The study also contributes to the growing literature on online learning discourse during and after the pandemic. Thakur et al. (2023), for example, examined approximately 50,000 tweets about online learning during COVID-19 and extended sentiment analysis with subjectivity, toxicity, and gender-specific patterns. The present study differs by analysing a much larger bilingual corpus and by placing retweet and mention networks at the centre of the analysis. However, Thakur et al.'s work is important because it shows that future studies can extend sentiment analysis by examining user diversity and the tone of participation more directly. Similarly, Demirel et al. (2025) analysed 1.1 million tweets about ChatGPT and showed that Twitter discussions of educational and technological innovations often contain both optimism and concern. This supports the interpretation of the present study: public discussion of educational technology is rarely only positive or negative; it often includes routine information, enthusiasm, criticism, uncertainty, and practical concerns at the same time.
The findings also have practical implications for schools, universities, and policymakers. Schools, universities, and policymakers can use social media analysis as a complementary source of evidence when evaluating online or blended learning. Neutral discourse may point to information needs, such as uncertainty about schedules, platforms, exams, live lessons, or institutional decisions. Negative discourse may point to problems related to access, platform usability, workload, assessment, internet connection, teacher support, or reduced social interaction. Positive discourse may show where online learning is associated with flexibility, continuity, resource sharing, or professional collaboration. These patterns should not replace direct feedback from students, teachers, and families, but they can help institutions identify issues that become publicly visible.
The findings also suggest that online learning policies should not focus only on technical availability. Providing a platform is not enough. Online and blended learning policies need to address teacher workload, student participation, interaction quality, platform usability, accessibility, assessment practices, and communication with families. Veletsianos and Houlden (2020) argue that crisis-period education requires flexible and relational responses. The present findings support this point in a concrete way: Twitter users discussed online learning not only in relation to technology, but also in relation to teachers, face-to-face schooling, live lessons, and the social routines of education.
The findings should be interpreted within the methodological scope of a large-scale, query-based Twitter corpus. The corpus was shaped by the selected hashtags and search terms, the late pandemic period, NCapture's data collection affordances, Twitter's platform structure, user visibility settings, and available metadata. Thus, the results indicate patterns within the captured corpus rather than population-level claims about all learners, teachers, institutions, or social media discussions on online learning.
Accordingly, the sentiment findings are best understood as corpus-level indicators of broad affective orientation. Turkish tweets were translated into English before classification because the sentiment workflow relied on English-language resources. This procedure enabled Turkish-language discourse to remain part of the analysis, while Turkish-English sentiment differences were interpreted as broad tendencies rather than exact cross-language measurements. Future studies may extend this work by using hand-coded Turkish samples, comparing translation-based results with Turkish-specific sentiment tools, and reporting agreement statistics.
Future studies should also examine demographic and role-based differences when such information can be obtained ethically and reliably. The present study did not infer gender, age, socioeconomic status, or educational role from usernames or profiles. This was an appropriate decision because such inferences may be unreliable and may raise privacy concerns. However, diversity remains important. Thakur et al. (2023) show that gender-specific analysis can provide additional insight into online learning discourse, while research on fake profile detection indicates that gender identification and profile authenticity require careful methodological handling in online social networks (Vyawahare & Govilkar, 2022). Future research could therefore combine social media analytics with survey data, verified role information, or ethically collected profile-level data to examine whether students, teachers, parents, and institutions participate differently in online learning discussions.
In conclusion, this study shows that large-scale Twitter data can help researchers understand how online learning was discussed, circulated, and evaluated during the late pandemic period. Its main contribution is not only the size of the dataset, but the combined interpretation of tweet density, retweet networks, mention networks, geographical traces, and sentiment patterns. The study shows that online learning became a visible public issue through specific terms, clusters, and emotional orientations. For researchers and decision makers, the value of this finding is practical: public social media data can help identify which parts of online learning are being shared as information, which parts are being criticized, and which parts are becoming visible through networked discussion. Online learning, in this corpus, was not only a response to school closure. It was a public educational practice negotiated through teachers, platforms, classroom expectations, face-to-face schooling, institutional communication, and user sentiment.
Footnotes
Acknowledgements
The present study is based on the corresponding author's Ph.D. dissertation with the supervision of Ebru Kılıç Çakmak.
Ethics Approval
This study analyzed publicly available content posted on Twitter. No human participants were recruited, no intervention was conducted, and no private or protected data were used. The analysis was conducted at an aggregate level, and individual users were not named, profiled, or directly quoted in the manuscript. The study followed institutional and publisher guidelines for the responsible use of publicly available social media data.
Author Contributions
Emrah Kayabaşı: Conceptualization, Methodology, Data collection, Formal analysis, Writing-original draft. Ebru Kılıç Çakmak: Supervision, Methodology, Writing-review & editing.
Funding
The authors received no financial support for the research, authorship, and/or publication of this article.
Declaration of Conflicting Interests
The authors declared no potential conflicts of interest with respect to the research, authorship, and/or publication of this article.
Data Availability
The data that support the findings of this study were derived from Twitter content collected through predefined keyword and hashtag queries within the specified date range. Due to platform terms and conditions and to protect user privacy, full tweet texts and personally identifying user information cannot be shared publicly. The final query set, aggregate tables, and workflow details are available from the corresponding author upon reasonable request and subject to platform data-sharing restrictions.
Code Availability
No custom software package was developed for this study. The analysis workflow, including data cleaning decisions, network construction logic, Gephi settings, and NVivo sentiment analysis settings, is available from the corresponding author upon reasonable request.