
Abstract
After a prolonged period of growth, driven, in part, by an increasing number of affluent consumers, the international tourism industry is now suffering the effects of a weaker world economy. These tougher market conditions have, in turn, led to increasing competition. As a result, countries, their tourism industries, and tourism businesses seek to improve the performance of the tourism industry and its constituents by vigorously promoting themselves to international tourists, cutting costs, and identifying synergies in their tourism endeavors. In seeking to improve the tourism industry, the determinants that affect tourism performance are of key interest to the stakeholders. A key obstacle toward improving performance is the multitude of determinants that can affect tourism performance. The literature has yet to provide concrete insights into the determinants of tourism performance and their relative importance. The present study addresses this important gap. We identify and rank the determinants of tourism performance. We also provide performance measures of international tourism destinations. The results are derived using the Data Envelopment Analysis (DEA) and bootstrap truncated regression models. The study also discusses the implications of the findings and highlights their importance to both the academic literature and the international tourism industry.
Introduction
Tourism is considered one of the most important export industries (Yong, Keng, and Leng 1993; Shahin and Dabestani 2010) and it has been both a cause and beneficiary of the prolonged period of economic growth seen in recent decades. Given its growing economic and social importance, stakeholders are now interested in determining what drives the performance in the industry. 1 Performance improvements can substantially contribute to the success of strategic plans for destination development. The rapid growth of the industry has gone hand in hand with increasing diversification and competition among (in particular neighboring) destinations (Ritchie and Crouch 2003; Dwyer and Kim 2003; Enright and Newton 2005; IBISWorld 2009). Consumer sophistication has also increased because of the rapid growth of the Internet and the range of tourism products and destinations on offer. Further challenges that have resulted from the global financial crisis, such as the decrease in international travel and the widespread security and safety fears, have also pushed destinations to focus more on improving the performance of their tourism industry.
The purpose of this study is to identify the key factors or determinants that contribute to industry performance. There is a need in the literature for a study that identifies the determinants of tourism performance and ranks their relative importance (Crouch and Ritchie 1999, 2005; Blanke and Chiesa 2009). Across most industries, developing an understanding of the determinants behind superior performance has been an ongoing quest of managers and scholars who deal with strategy (Durand and Vargas 2003; Delmas, Russo, and Montes-Sancho 2007). In fact, it is the analysis of performance and its determinants that drive most studies in the strategy literature (Venkatraman and Ramanujam 1986).
So far, the focus in the tourism literature has been on analyzing the competitiveness 2 of the international tourism industry (Crouch and Ritchie 1999, 2005). Private organizations also rank international tourism competitiveness using the tourism competitive index, or tourism satellite accounts. However, none of the existing studies test which determinants affect tourism performance (Fuchs, Peters, and Weiermair 2002; Wöber and Fesenmaier 2004; Cracolici, Nijkamp, and Rietveld 2006). Even studies on tourism competitiveness (Crouch and Ritchie 1999, 2005; Assaf, Barros, and Josiassen, forthcoming) emphasize that ranking destinations should be based not solely on their competitive advantage but also on their actual tourism performance.
The present research aims to extend the literature in three ways: First, we aim to identify the determinants of tourism performance. Second, we aim to rank these determinants based on their degree of contribution to tourism performance. Finally, we aim to develop a global performance index that can be used to assess and rank the tourism performance of countries. Our sample involves countries from all around the world. We use a two-step estimation procedure. First, we develop the tourism performance index with the Data Envelopment Analysis (DEA) bootstrap methodology (Simar and Wilson 2007). Then, we assess how this index varies with the different determinants of tourism performance.
The remainder of the article is organized as follows: First, we present the research design and analysis. Then, we elaborate on the methods and the data. Third, we present the results, and finally we discuss the main findings and provide directions for future studies.
Research Design and Analysis
Identification of the Determinants of Tourism Performance
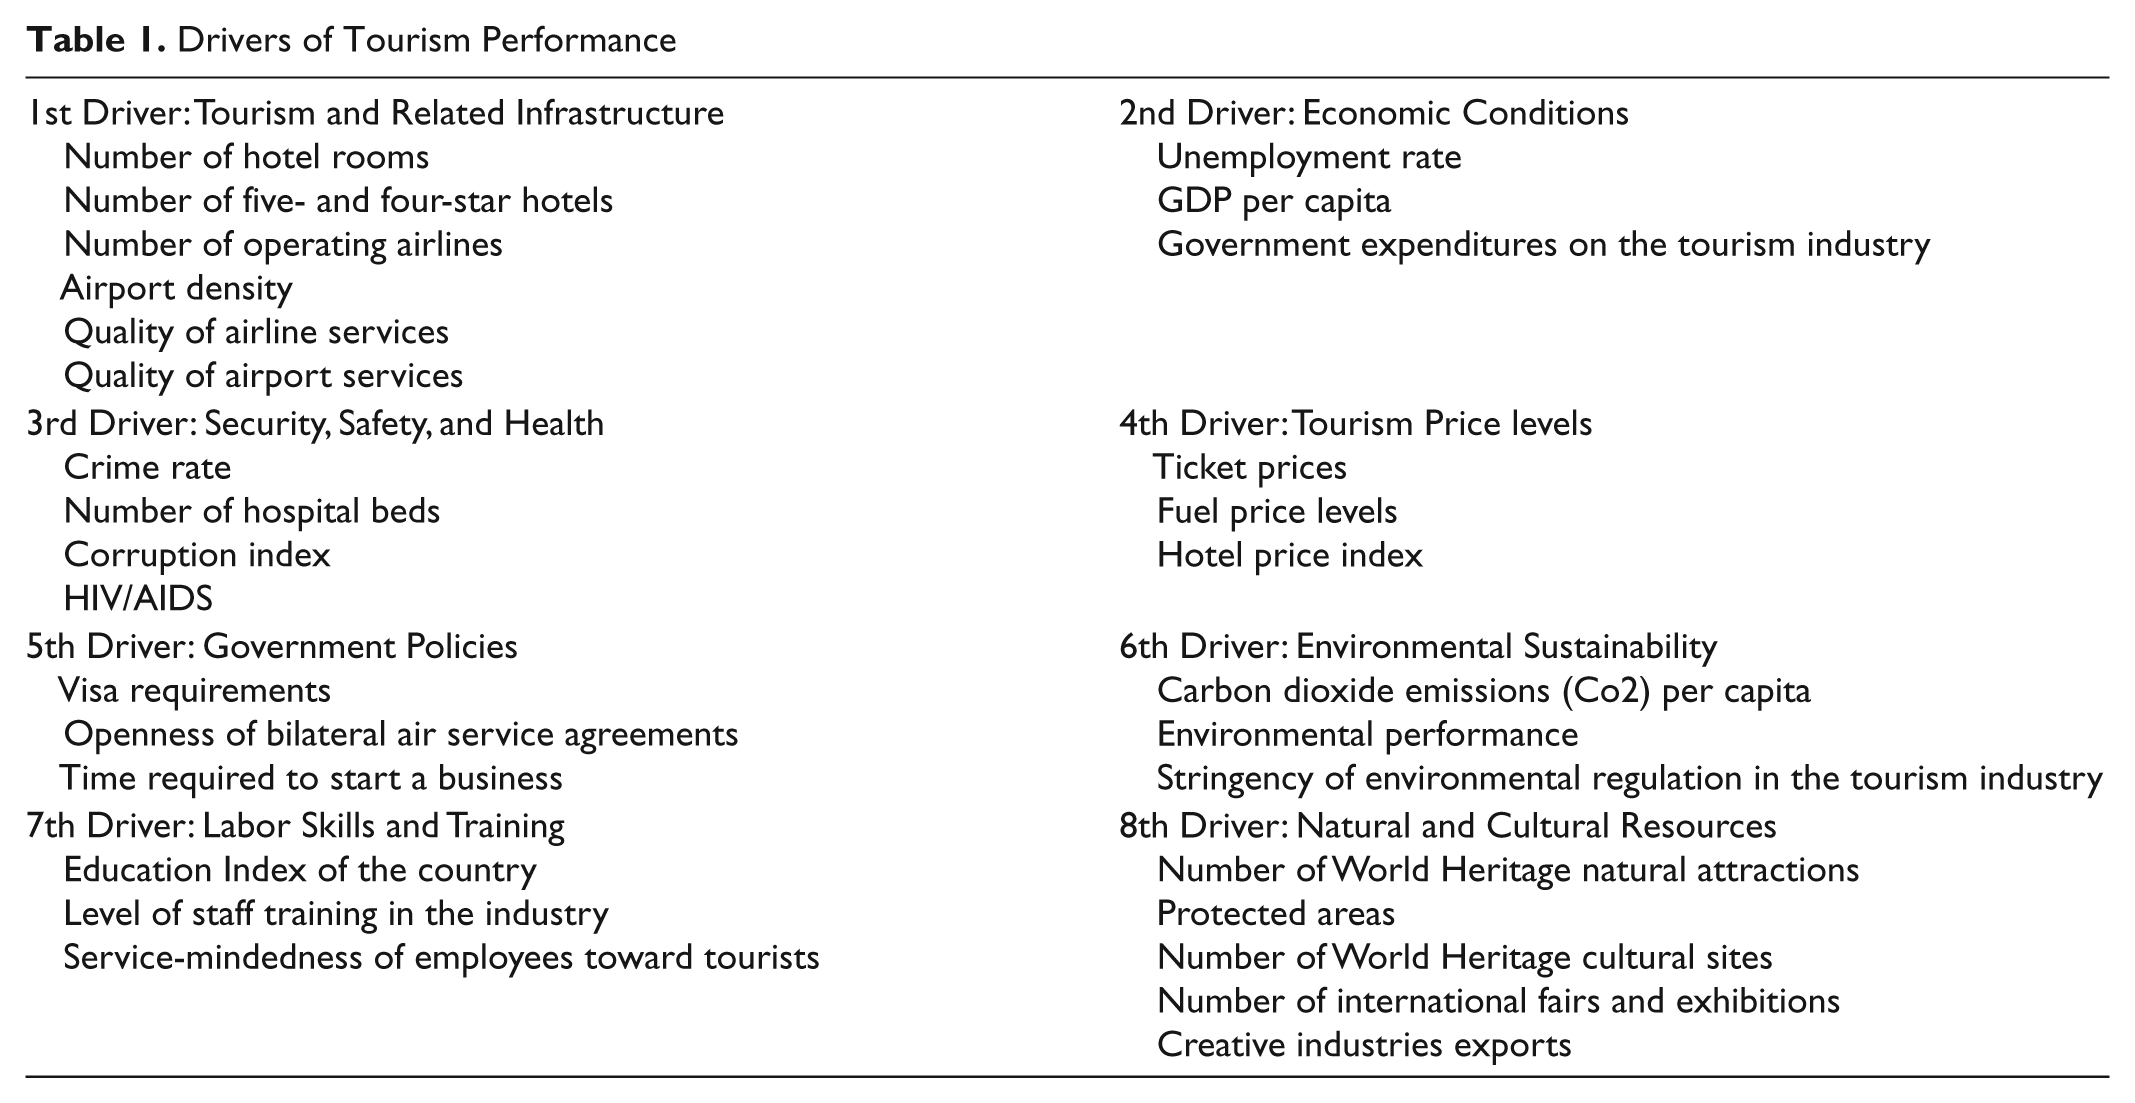
In an initial step, we developed a list of determinants with the potential to affect tourism performance. The list was informed by two sources: (1) literature review and (2) expert opinions from the industry. As stated above, the existing literature (academic and industry) does not provide a comprehensive list of determinants that drive tourism performance. We were able to adapt some determinants from related literature streams such as the competitiveness literature (Crouch and Ritchie 1999). The literature suggests that “starting with categories identified in the literature” (Srnka and Koeszegi 2007, p. 37) is useful in the process of categorizing such qualitative data. Specifically, we developed an initial classification on the basis of an interdisciplinary literature review (e.g., Crouch and Ritchie 1999). The classification that was based on the academic and industry literatures yielded six broad drivers of tourism performance. Each driver includes a set of determinants that are potential sources of tourism performance.
In light of the paucity of research in the area, we followed up with in-depth interviews to support the research purpose at hand. We conducted 45-minute in-depth interviews (Kvale 1996) with seven experts in international tourism. Semistructured interview guides (Marschan-Piekkari and Welch 2004) were developed, which enabled the interviewers to adapt to each respondent and explore respondents’ answers in detail (Patton 1990). The respondents mentioned a total of 30 determinants underlying tourism performance, which we subsequently analyzed for content. The set of determinants identified by the respondents closely overlapped the set identified in the literature review and also led to the development of two new drivers. Overall, we ended up with eight drivers, listed in Table 1. The following section elaborates in detail each of the drivers.
Drivers of Tourism Performance
Drivers of Tourism Performance
Thus, our classification scheme comprises eight broad drivers of tourism performance. Each driver is composed of several determinants that can affect tourism performance. We briefly discuss these drivers on the basis of both the relevant literature and exemplary statements from the qualitative study.
Driver 1—Tourism and related infrastructure
A number of authors have cited the infrastructure base of a country as a source of tourism attractiveness (Khadaroo and Seetanah 2007). There is also a positive link between the size and quality of tourism transportation resources (ICT, ports, roads, airport, and railroads) and the intention of a visitor to return to a certain destination (Faulkner, Oppermann, and Fredline 1999; Berli and Martín 2004). Areas with poor infrastructure frequently have low-quality tourism and might be unable to meet the demand in high seasons (Briassoulis 2002).
Most of the experts in our interviews argued that this driver is an important determinant of tourism performance as the ease of tourist movement within the country is affected by the quality of roads, railroads, ports, and airports. The literature also seems to support this argument (Prideaux 2000). In Table 1, we list the items that were identified. They reflect both the size and quality of the infrastructure.
Driver 2—Economic conditions
Factors related to the economic development and stability such as employment, and income levels have been found to be strong determinants of performance across several industries (Li 1997; Sun, Hone, and Doucouliago 2003). Tourism also seems to be sensitive to economic growth and macro-economic stability (Naude and Saayman 2005). Several experts in our interviews stressed the importance of basic economic conditions to the success of the tourism industry and its actors. Supporting this view, a number of studies have found significant differences in tourism development between developed and developing economies (Jenkins and Henry 1982; Tosun 2001). A strong economy can encourage more foreign investments in the industry, and it also enables more government support.
Driver 3—Security, safety and health
Research indicates that security and safety levels influence tourism demand (Harper 2001; George 2003). Studies on return visitation also indicate that tourists are likely to be deterred from traveling or returning to dangerous countries or regions that have security problems (Alegre and Cladera 2006). For instance, when the tragic events of September 11 occurred, international tourism was greatly affected and travelers cancelled planned visits across the world due to perceptions of increased risk (Akama and Mukethe Kieti 2003). One of the experts in our interviews mentioned that “almost regardless of other promotion efforts, tourists actively avoid destinations with high crime rates.”
The ease or difficulty of access to improved health and hygiene resources can also impact tourism demand (Cossens and Gin 1994; Carter 1998). Tourists want to feel safe and comfortable when they are at a destination. This issue became particularly important following recent scares such as SARS, bird flu, and H1N1 flu which pushed several governments to focus on the health risks associated with travel and tourism.
Driver 4—Tourism price competitiveness
It is widely accepted that the number of tourists is strongly affected by the price competitiveness of a particular destination. This issue is also widely established in the economic literature, which argues that tourism demand is relatively responsive to price factors. When selecting a destination, tourists consider the price to get to the destination and the cost of living at the origin relative to substitute destinations (Dwyer, Forsyth, and Rao 2000). The intention to return to a destination can also be affected by the prices experienced by tourists in their previous visits (Barros and Machado 2010). In our interviews, the experts often mentioned price as an important determinant of the willingness to visit.
It is possible to argue that the determinants identified by the respondents are important indicators of price competitiveness. For instance, when exchange rate rises, the tourism price competitiveness falls. Fuel price, ticket price, and hotel price are also important determinants of tourism expenditures and can affect the tourist’s choice of a particular destination.
Driver 5—Government policies
All respondents agreed that government policy and regulation influences the tourism performance of a particular destination and that it is an essential stakeholder in terms of creating the conditions that lead to the development of a successful tourism industry. The literature seems to support the argument that government policies may drive tourism development and may provide a general setting that actively encourages growth and at the same time removes unnecessary restrictions or burdens (Jenkins and Henry 1982; Holden 2003). Effective government policies would also benefit the industry in terms of attracting international investments, and facilitating the movement of tourists in and out of the country (Crouch and Ritchie 1999). We note that some studies outside the tourism literature also found a positive link between effective government policies and industry performance (Jacobsson 1991; Das and Ghosh 2006).
Driver 6—Environmental sustainability
Most experts seem to agree that sustainable tourism development has become a strategic goal for world-class destinations. Major destinations are seeking preservation for future generations and exploring sustainable development strategies and techniques. The literature also seems to support the suggestion that environmentally sustainable destinations can positively affect tourism performance (Andereck et al. 2005). The interviews indicated that tourists exhibit increasing environmental conscientiousness when shopping for tourist destinations. Governments are now seeking sustainable tourism development since it is critical to the conservation of the natural environment. Sustainable tourism can also help improving the image of a particular destination (Hassan 2000).
Driver 7—Labor skills and training
It is widely recognized across many industries, including tourism, that superior labor skills is an important source of competitive advantage for business (Bird 1995). Training is also essential in delivering the strategic objectives set by managers in the industry and it plays an important role in improving the knowledge, skills, and abilities of employees within the industry (Blake, Sinclair, and Soria 2006).
It became clear during our interviews that the service level that tourists perceive is an important determinant. Some tourists simply would not even consider visiting a country that they perceive as having a poor level of service mindedness. The tourism industry is a perfect context for the consideration of skills in services. Although technology has replaced labor skills in the transformation of inputs in some industries, it has not eliminated demand for higher order skills within the tourism industry (Baum 2002). Recent studies have shown that tourists are more likely to return to those destinations that provide a higher level of service (Alegre and Cladera 2006).
Driver 8—Natural and cultural resources
It is also possible to argue that the success of tourism destinations is affected by natural and cultural/heritage resources to form their attractions bases (Hassan 2000; Deng, King, and Bauer 2002). The experts highlighted that some destinations “virtually sell themselves.” Australia, for instance, relies heavily on the general quality of its natural assets (Huybers and Bennett 2003), which includes some World Heritage listed natural attractions such as the Great Barrier Reef and Wet Tropics Rainforests—as well as the general scenic landscapes and natural areas.
Recent literature on destination choice discusses that many tourists consider natural attractions as essential drivers behind the selection of a destination (Buhalis 2000). The respondents also emphasized that the volume of creative industries in a particular destination (e.g., art, crafts, design, fashion, film, music, performing arts) is becoming a major source of attraction for tourists. Figure 1 illustrates the proposed framework.
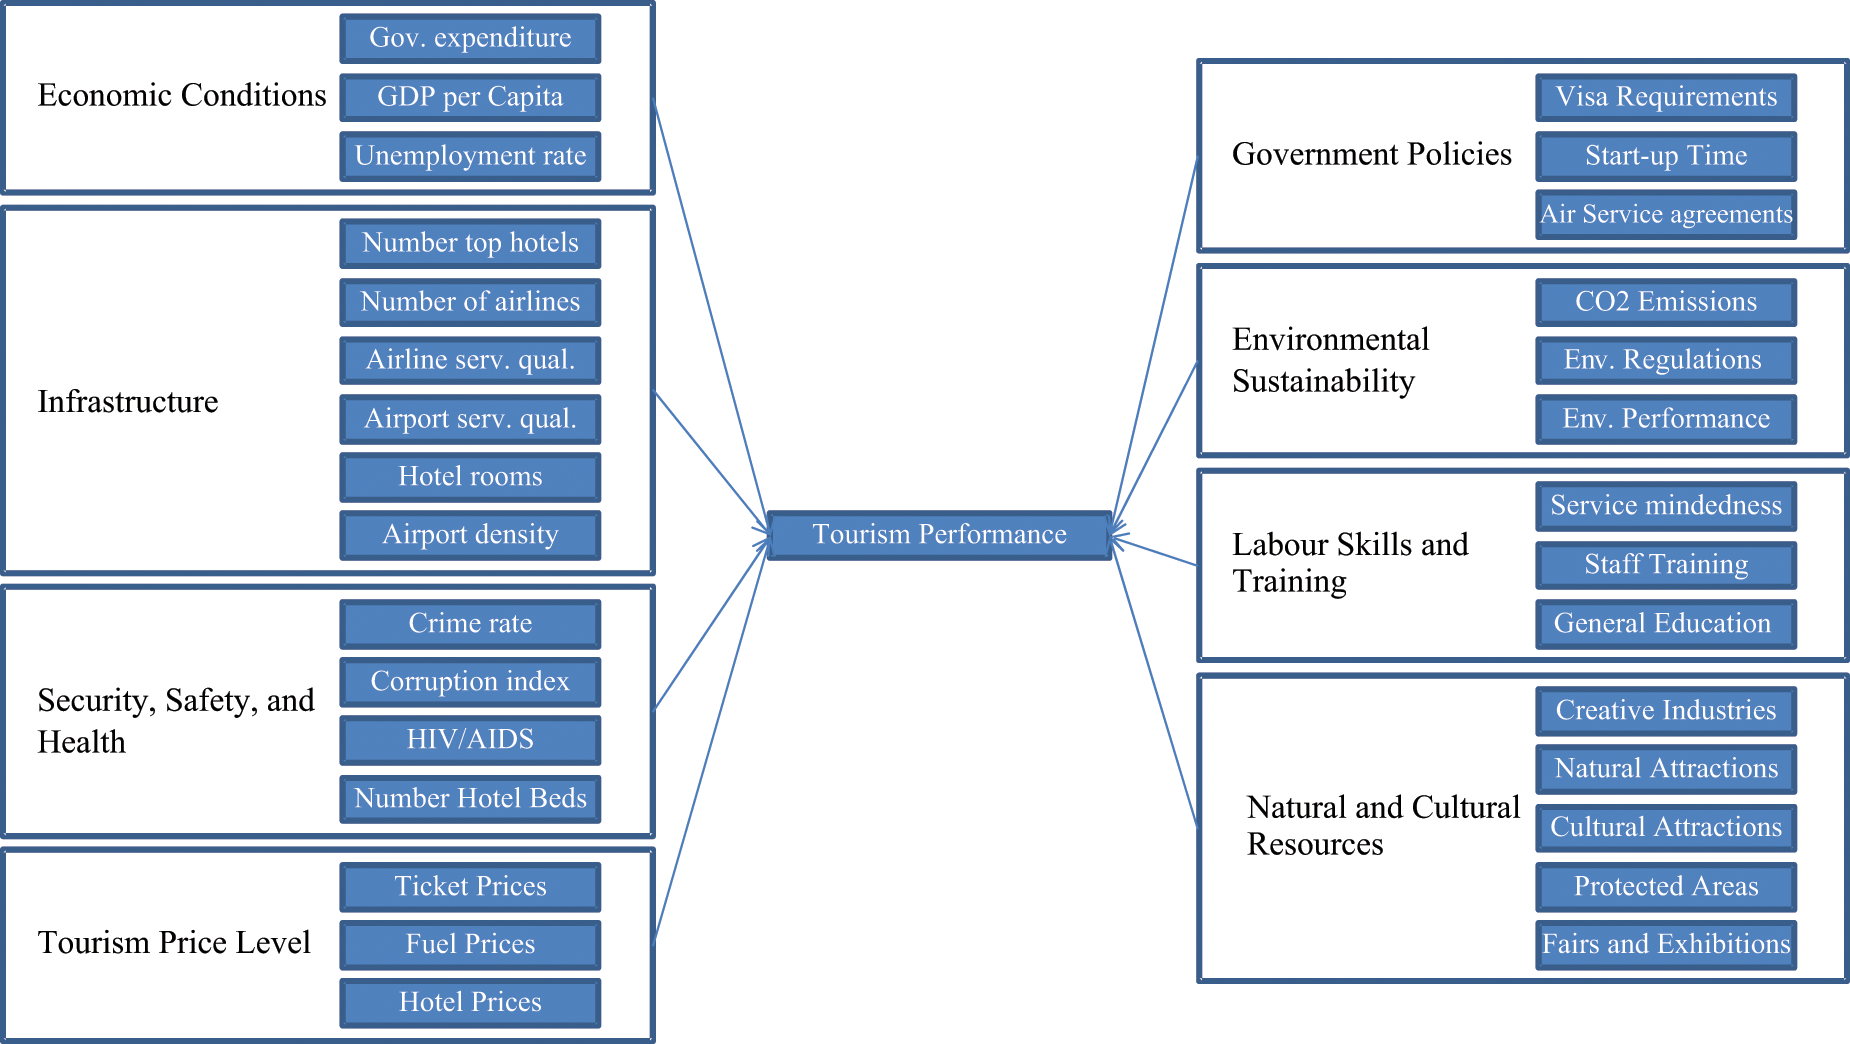
The proposed framework
Methods
Performance Estimation
We obtain performance measures in this study using the Data Envelopment Analysis (DEA) methodology (Banker, Charnes, and Cooper 1984). DEA uses linear programming to convert multiple input and output measures into a single measure of relative performance for each observation. It basically identifies a benchmark frontier, which consists of the best-performing firms (or countries in our case). If a firm is not on the frontier, its radial distance from the frontier is a measure of its inefficiency in performance. The firms with maximum performance (100% efficient) are those for which no other firms or linear combination of firms can generate at least the same amount of each output (given inputs).
A DEA performance measure (
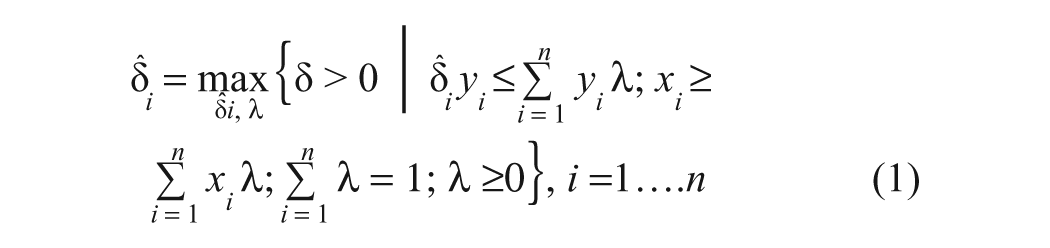
where y
i
is vector of outputs, x
i
is s vector of inputs, λ is a I × 1 vector of constants. The value of
Truncated Regression Model
The next step in the analysis is to estimate the impact of the determinants on tourism performance. DEA performance measures are truncated from below at one, and thus a truncated regression model is more suited for the present context, since OLS regression could predict scores greater than 1, and as such produce biased and inconsistent parameter estimates. The model can be simply expressed as

where
As the performance scores generated by DEA are strongly dependent on each other in the statistical sense, using them in a second-stage regression (as identified in Equation 2) might violate the basic model assumption required by regression. To address this problem, we use here the bootstrap procedure of Simar and Wilson (2007). We describe in Appendix A the bootstrap algorithm.
Data
In order to address our research questions, we first needed input and output data to measure tourism performance. As stated above, the advantage of the DEA method is that it allows the inclusion of multiple inputs and outputs. We distinguish between three types of inputs and four types of outputs. On the inputs side, we use the number of employees working in the tourism industry, the capital investments made by governments on the tourism industry in a particular year, and the total number of accommodation establishments available in a particular country for a particular year. On the outputs side, 4 we use the total number of international tourists, the total number of domestic tourists, the average length of stay of international tourists, and the average length of stay of domestic tourists. All these variables are well recognized as important and critical inputs and outputs variables for the tourism industry (Fuchs, Peters, and Weiermair 2002; Bosetti et al. 2006; Cracolici, Nijkamp, and Rietveld 2006).
To construct the database on the above inputs and outputs, we used several sources, including the World Tourism Organization, Euromonitor database, tourism satellite accounts of some countries, as well as Eurostat database. Our final sample consisted of 120 countries located in Africa, the Americas, Asia, Europe, and Oceania, for the period 2005-2008 (120 × 4 = 480 observations). We present in Table 2 the countries included in the study. Note that the inclusion of more countries was not possible because of data unavailability.
Countries Included in the Study

We used many sources to collect data on the different determinants that form the drivers of tourism performance identified in Table 1. These include the World Bank, World Economic Forum, United Nations Office on Drugs and Crime, World Health Organization, Booz and Company, Transparency International, International Energy Agency, International Air Transport Association, Deloitte, Euromonitor, Skytrax, Eurostat database, and Penn World Table. We provide more details in Appendix B about the model specification and the units of measurement of each of the identified determinants.
Results
First, we present a ranking of the different countries based on the performance scores of their tourism industry (Table 3). Because of space considerations, we only include the top 20 performing countries as well as the lowest 20 performing countries. 5 It is difficult to provide a country-by-country analysis of the results because of the large number of countries analyzed in this study. However, we noticed that the top performers are those countries that have high scores on the determinants outlined in Table 1, particularly Switzerland, Austria, Spain, France, Germany, the United States, the United Kingdom, and Australia. Generally, all these countries have well-established tourism industries and are also consistently ranked among the top destinations in the world in terms of their tourism arrivals (Blanke and Chiesa 2009).
Ranking of Countries Based on Their Tourism Performance Index
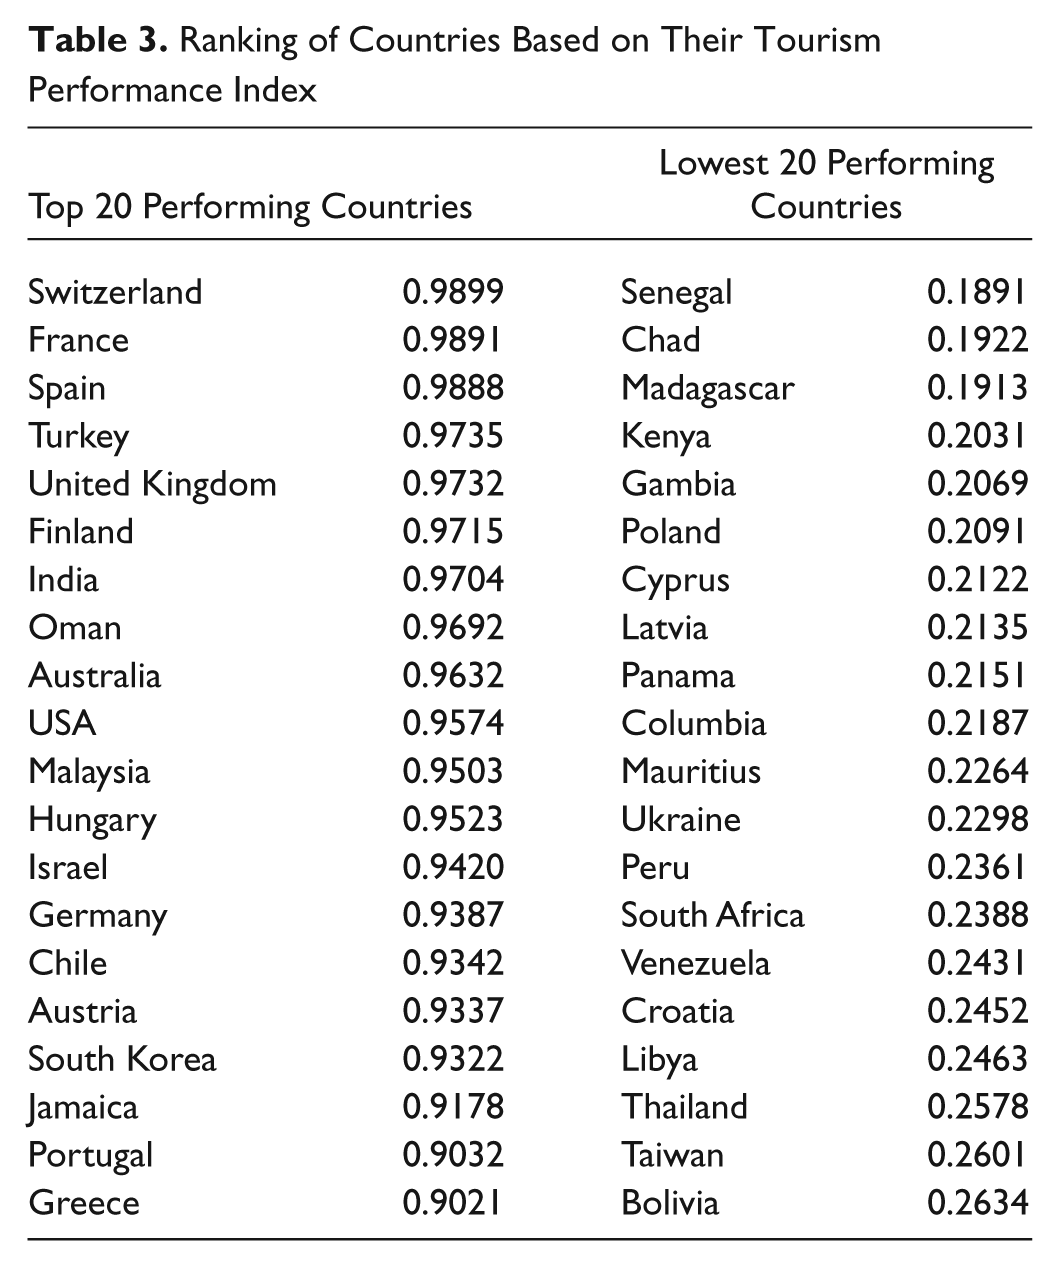
Table 4 presents the truncated regression results obtained from 2,000 bootstrap iterations. The first column presents the variables, the second column presents the coefficients, and the third column presents the t statistics. Finally, in the last column we present the elasticity of each variable, which expresses the percentage change in tourism performance for 1% change in each of the variables included. We use elasticity to rank the importance of each determinant in terms of their contribution to tourism performance. 6
Bootstrapped Regression Results
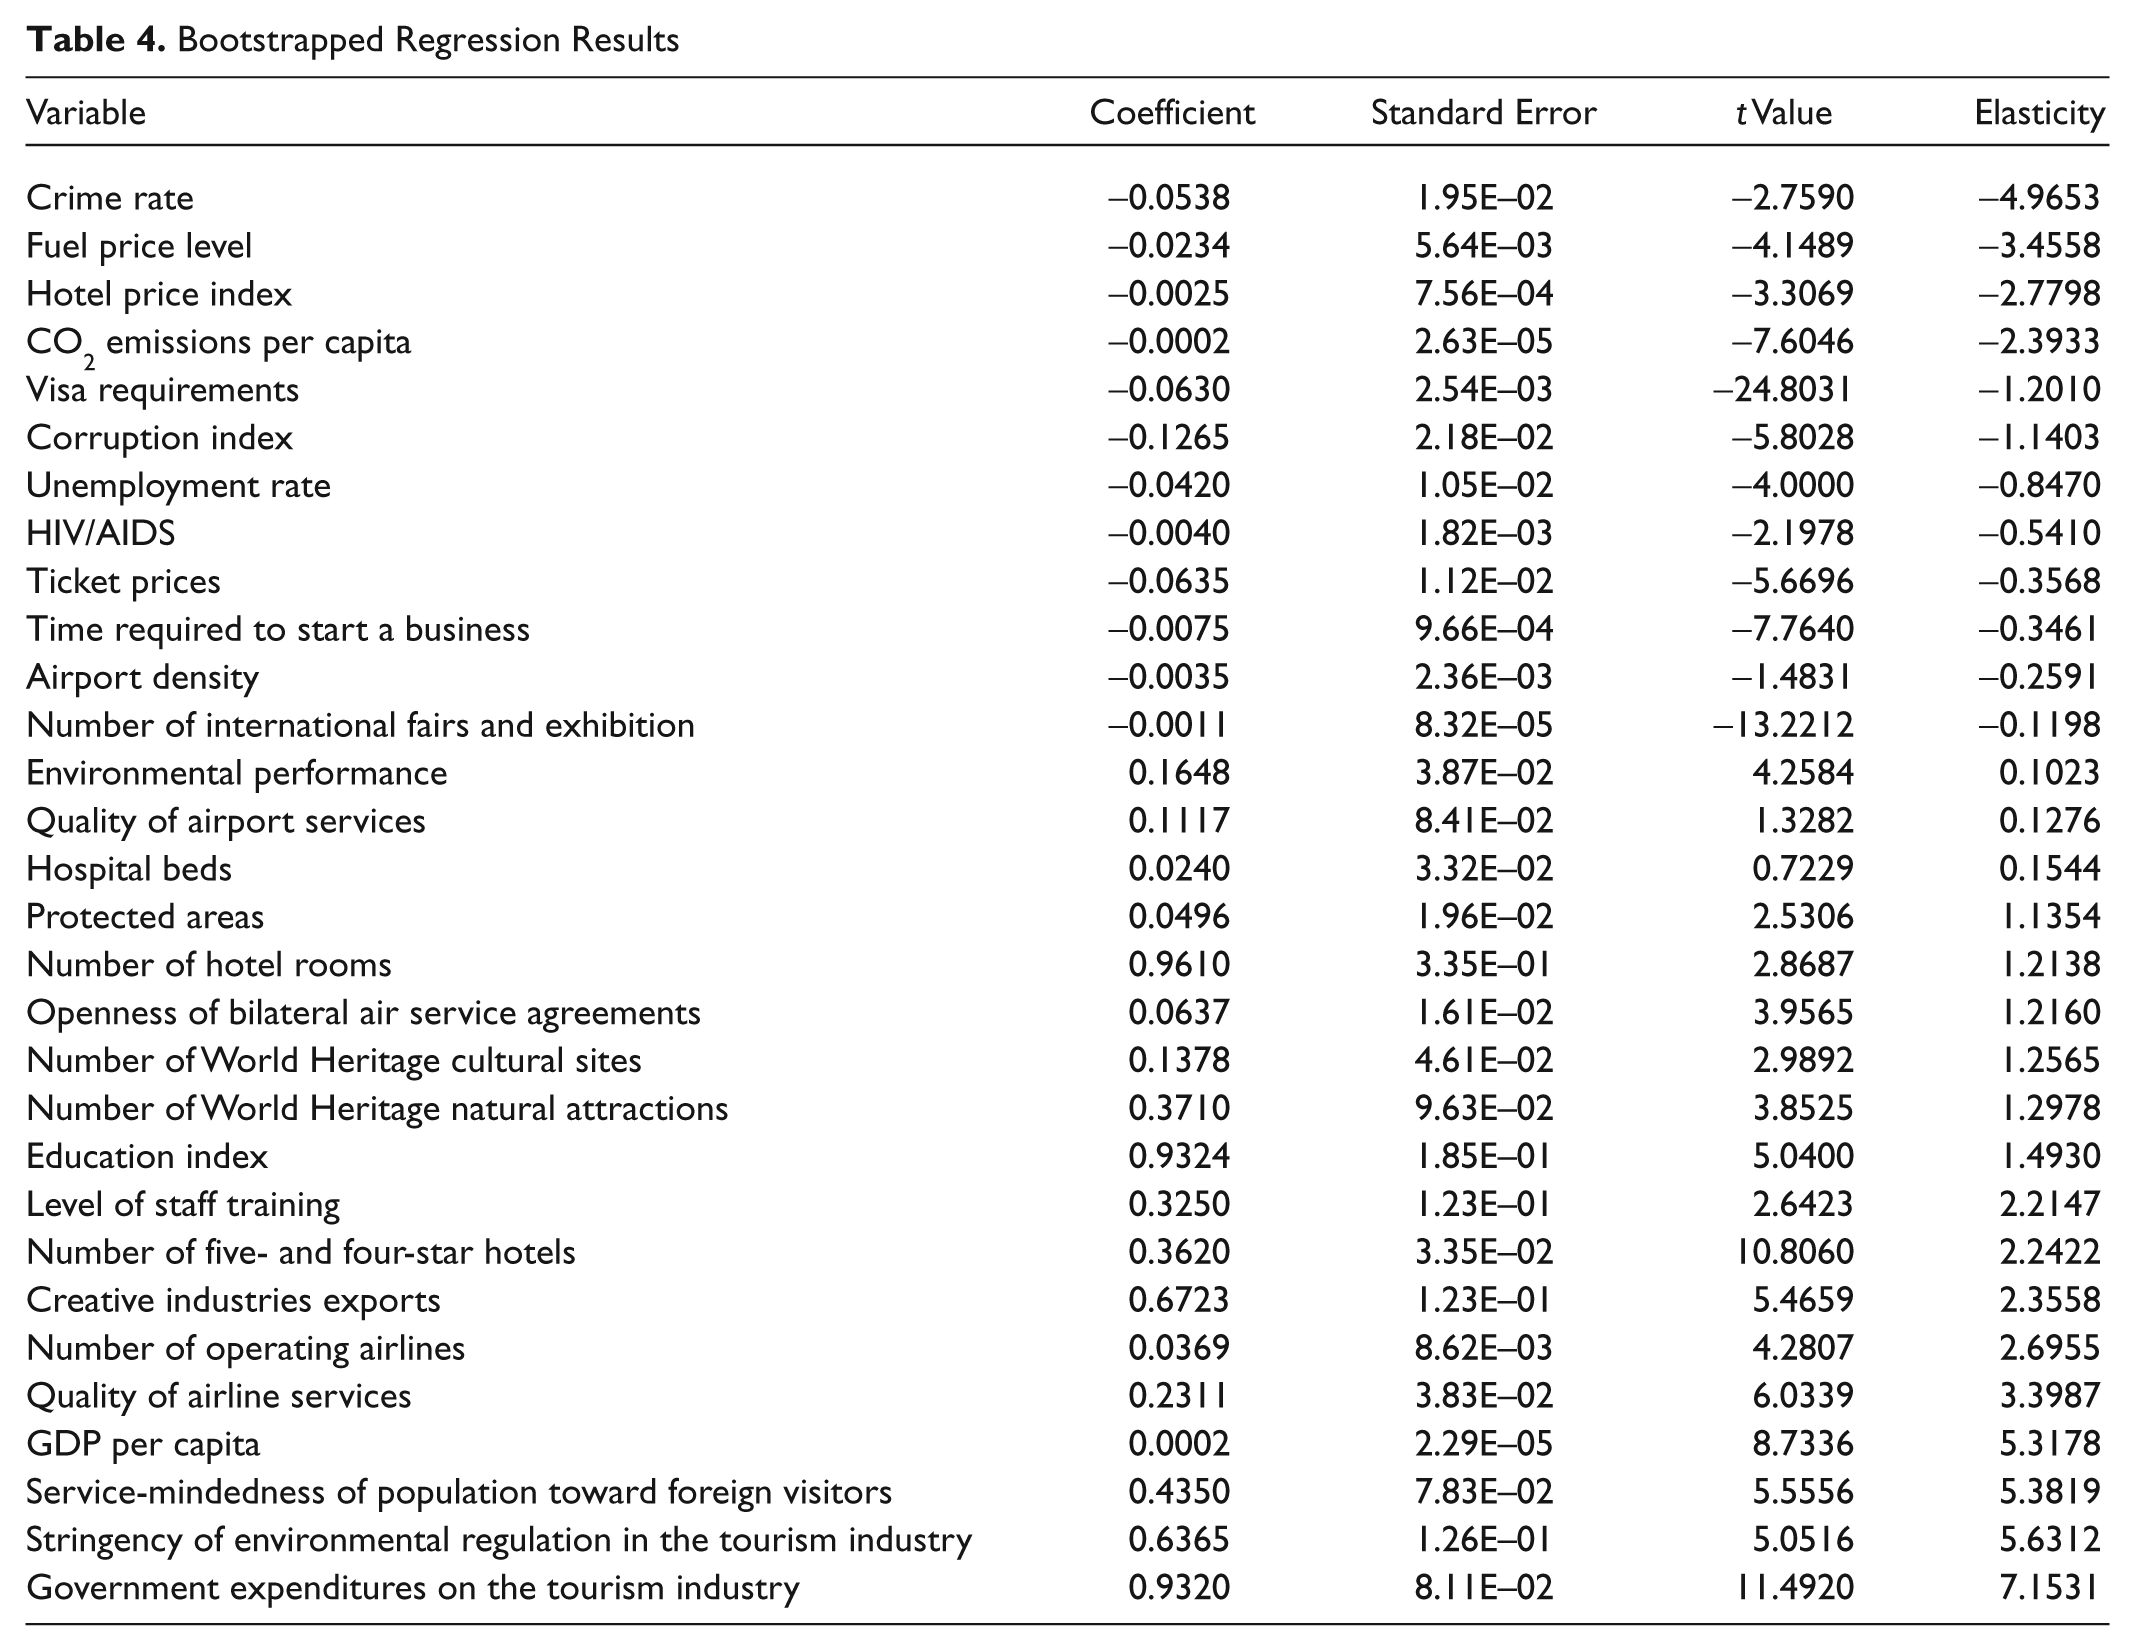
Note that we also checked the correlation matrix and calculated the VIF coefficients and confirmed that collinearity was not a problem. The results in Table 4 indicate that the model fits the data well as most coefficients are significant except for four variables (airport density, hospital beds, number of international fairs and exhibitions, and quality of airport service). 7 Furthermore, all variables, except international fair and exhibitions, were signed as we expected; an increase in international fair and exhibitions in the country should help attracting more tourists. However, as the variable is insignificant it is uncertain whether an increase in international fair and exhibitions has a significant impact on tourism performance. Thus, for all other variables, the sign of the coefficients is in line with the theoretical expectations. We do not intend here to give a detailed explanation about the proposed directions between tourism performance and each of the variables as they were explained directly or indirectly in the Methods section. For example, we expected from the literature that an increase in HIV/AIDS and crime rate deters tourists from visiting a particular destination and our results demonstrate that these two variables have a negative impact on tourism performance (Kozak and Rimmington 1999; Harper 2001).
The first major aim of the present research was to ascertain the percentage contribution of each of the determinants toward tourism performance. The determinants in Table 2 are listed based on their elasticity score. The 10 most negatively impacting determinants of tourism performance are crime rate, fuel price level, hotel price index, CO2 emission per capita, visa requirement, corruption index, unemployment rate, HIV/AIDS, ticket price, and time required to start a business, while the 10 most positively impacting determinants of tourism performance are government expenditures on the tourism industry, stringency of environmental regulation in the tourism industry, service-mindedness of the population toward foreign visitors, GDP per capita, quality of airline services, number of operating airlines, creative industries exports, number of five- and four-star hotels, level of staff training, and education index. In the next step, we examined each of the broad categories (drivers) to ascertain how many determinants within each driver rank in the top 10 enabling or top 10 inhibiting determinants. The results show that the drivers that have all their determinants ranking among the top 10 positive and negative determinants are “Tourism Price Competitiveness,” “Economic Conditions,” and “Labor Skill and Training.” Other drivers with strong presence are “Tourism and Related Infrastructure,” “Environmental Sustainability, “Security, Safety and Health,” and “Government Policies.”
Discussion and Managerial Implications
The formulation of firm strategy and tourism public policy can directly benefit from identifying the factors that have the most significant impact on the future performance of the tourism sector. Although several recent studies (Crouch and Ritchie 2005; Blanke and Chiesa 2009) have highlighted this important issue, the present study provides the first comprehensive analysis of the determinants of tourism performance. The strain on resources that usually accompany tough market conditions makes it essential for managers involved in firm strategy making (as well as for public policy makers) to identify the key leverage points where their strategies and interventions are most likely to maximize overall performance.
Several versions of the tourism competiveness report published by the World Economic Forum emphasized the need for a study that identifies and ranks the determinants of tourism performance. While the TTCI is probably the best-known instrument used to rank nations according to their travel and tourism competitiveness, it is important to note that it is not a performance index. Rather, it is an index of broad categories of variables that may facilitate tourism competitiveness. Thus, it is not possible from this index to determine which inputs can be translated into industry performance most efficiently, nor is it possible from the TTCI to gauge how efficient a nation is in transforming its tourism inputs into outputs.
Thus our findings indicate that the 10 most important determinants were distributed among 6 drivers; those that have all their determinants ranking in the top 10 most important (either positive or negative) are “Tourism Price Competitiveness,” “Economic Conditions,” and “Labor Skill and Training.” The “Tourism and Related Infrastructure” and “Environmental Sustainability,” “Security, Safety and Health,” and “Government and Policies” drivers had also a strong presence among the top 10.
It is possible to provide literature support for all these findings. There is widely accepted evidence, for instance, that price is one of the most important factors in decisions about whether, and where, to undertake trips (Dwyer, Forsyth, and Rao 2000; Dwyer and Kim 2003). The health of the domestic economy is also a main determinant of activity in the tourism industry. This is particularly relevant in relation to business travel spending. Consideration should also be given to investments in tourism and related infrastructure (e.g., hotels, airplanes, recreation sites) (Prideaux 2000). Finally, the reason that all determinants in the “labor and skill training” driver are important could be related to the fact that many destinations still struggle to attract skilled employees to the tourism industry. Thus, destinations that score higher on this driver are expected to have a tourism performance advantage. In Figure 2, we summarize the results graphically. This framework could provide a useful foundation for further studies in the area. The framework should facilitate discussion and communication among the stakeholders involved in the management of tourism destinations. It can also be employed as a basis for auditing tourism performance.
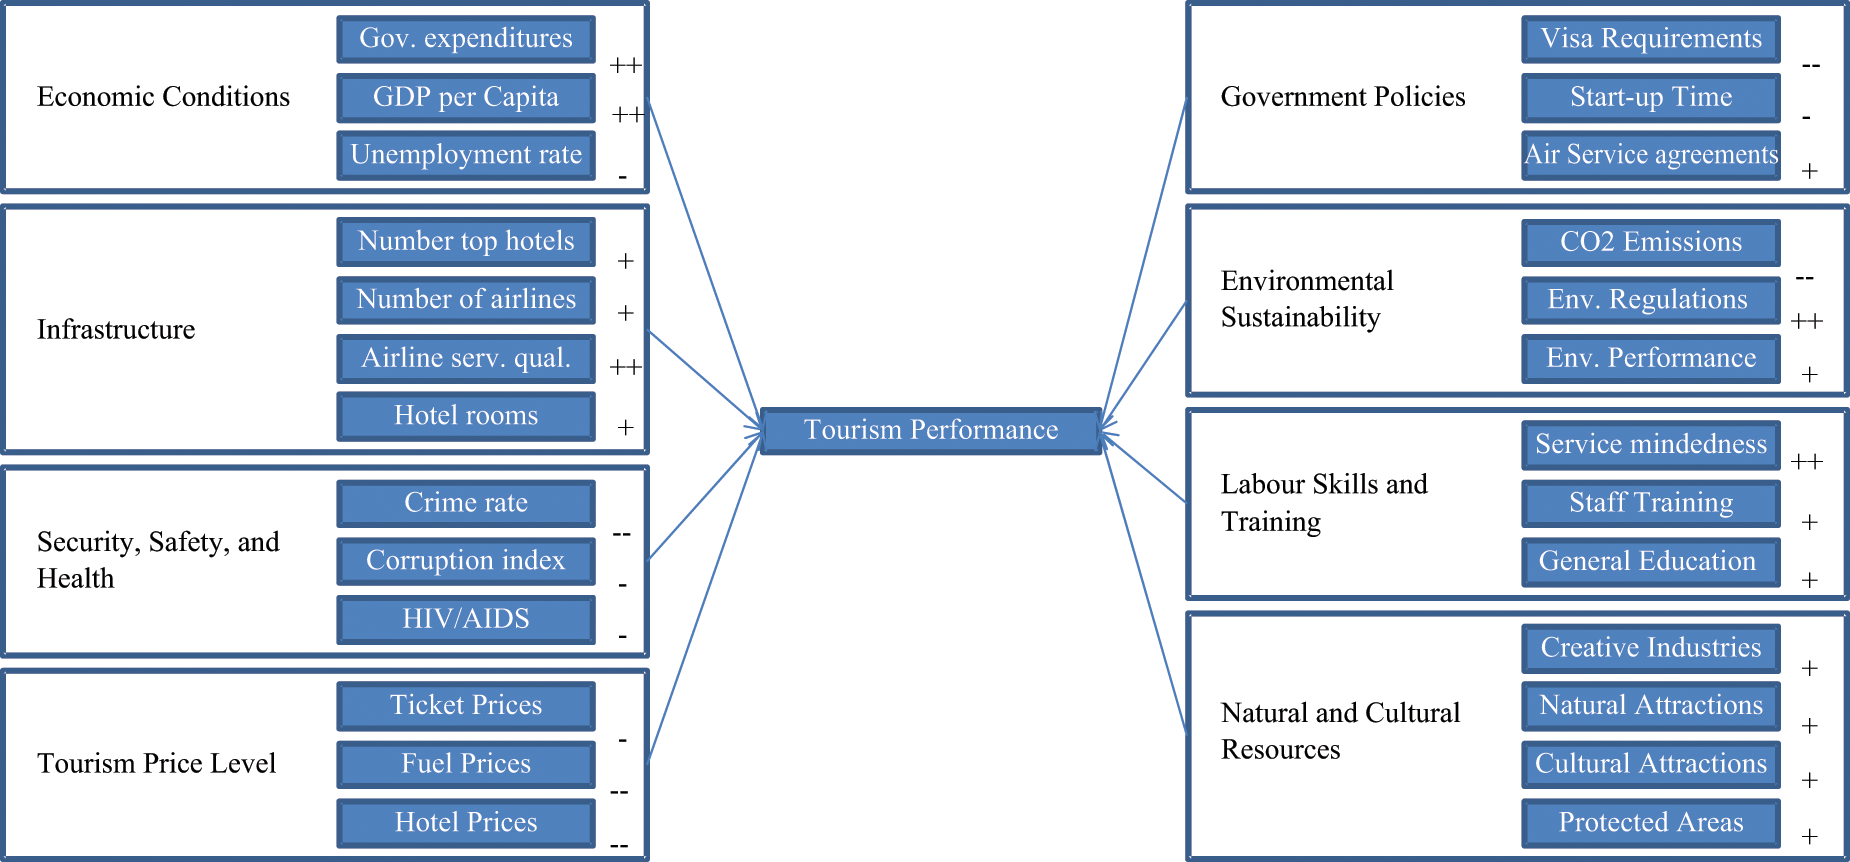
The tourism industry performance framework
Concluding Remarks
In this paper we identified and ranked the determinants of tourism performance using data on 120 countries located across Africa, the Americas, Asia, Europe, and Oceania. Our sample included four years of data ranging from 2005 through to 2008.
The study started with an identification of the determinants underlying tourism performance, relying on both the extant literature as well as on several expert interviews. In total we identified 30 determinants of tourism performance, which were then classified into eight broad drivers of tourism performance on the basis of an interdisciplinary literature review. We measured tourism performance with the DEA bootstrap method using multiple tourism inputs and outputs. Finally, we assessed the impact of the different determinants on tourism performance using a bootstrapped truncated regression model. As the determinants were measured on different scales, we relied on the elasticity measures to rank the importance of each of the different determinants.
Our results indicated that the 10 most negative determinants of tourism performance are crime rate, fuel price level, hotel price index, CO2 emission per capita, visa requirement, corruption index, unemployment rate, ticket price, HIV/AIDS, and the time required to start a business, while the 10 most positive determinants are government expenditures on the tourism industry, stringency of environmental regulation in the tourism industry, service-mindedness of the population toward foreign visitors, GDP per capita, quality of airline services, number of operating airlines, creative industries exports, number of five- and four-star hotels, level of staff training, and education index.
Finally, we also ranked the top 20 international countries based on their tourism performance. We discussed the importance of this study in terms of its contribution to both the industry and academic literature. We also highlighted the economic and competitive challenges facing the industry and their effect on resource allocation. Our central argument is that while some studies have measured tourism performance, none have focused on the global scale, and none have also identified the determinants of tourism performance. From here, this study should provide tourism businesses and policy makers with a clear framework for highlighting areas for resource allocation and future investments. We also expect the results to be used by leading tourism associations such as the United Nation World Tourism Organization and the World Travel and Tourism Council.
Undoubtedly, future studies might consider revalidating the results of this study, and include and test if possible other determinants of tourism performance. It might be useful to include other possible inputs and outputs (e.g., management-related variables) in the calculation of tourism performance. This was not possible in this study because of data unavailability. Finally, the results might also benefit from using a more extended data set and including more countries into the analysis.
Footnotes
Appendix A
Appendix B
Declaration of Conflicting Interests
The author(s) declared no potential conflicts of interest with respect to the research, authorship, and/or publication of this article.
Funding
The author(s) received no financial support for the research, authorship, and/or publication of this article.