
Abstract
This study reviewed use of covariance-based structural equation modeling (SEM) in 209 articles published in nine tourism journals between 2000 and 2011. Time-series analysis suggested that the number of SEM publications is explained by linear and quadratic time effects. Results indicated that although SEM practices have improved in some areas, tourism researchers do not always engage in the recommended best practices. Problematic areas were related to testing of alternative a priori models, reporting of multivariate normality, estimating effect size, and assessing reliability and validity. Some of the recommended fit indices were also underutilized. The review also found few differences in SEM practices between top-tier journals and other publications in the tourism field. On the basis of these results, suggestions to improve use of SEM in tourism studies are discussed in the light of recent developments in this technique.
Introduction
A primary objective of any research is to make sense of some aspects of the world of experience. Structural equation modeling (SEM) allows researchers to study real-life phenomenon and “provides a useful forum for sense-making and in so doing link philosophy of science to theoretical and empirical research” (Bagozzi and Yi 2012, p. 12). SEM is a statistical procedure for testing measurement, functional, and predictive hypotheses that approximate world realities (Bagozzi and Yi 2012). Its ability lies in the assessment of latent (unobservable) variables at the observation level (measurement model) and testing hypothesized relationships between latent variables at the theoretical level (structural model) (Hair, Sarstedt, Ringle, and Mena 2012). SEM has become increasingly popular in social and behavioral sciences and is considered one of the most widely used statistical techniques for testing complex models that involve several dependent and independent variables (Heene, Hilbert, Draxler, and Ziegler 2011; MacCallum and Austin 2000).
SEM has also gained popularity in tourism studies where it is used to test various types of theoretical models (e.g., Nunkoo and Ramkissoon 2011, 2012a; Nunkoo, Ramkissoon, and Gursoy 2012; Vargas-Sanchez, Porras-Bueno, and Plaza-Mejia 2011). However, the full benefits of SEM in tourism research can be achieved only if it is used correctly. Despite being an established statistical technique in social and behavioral sciences, SEM practices have been subject to much debate and controversy, particularly with respect to reporting of fit indices (Heene et al. 2011; Hu and Bentler 1998; Nye and Drasgow 2011; Williams and O’Boyle 2011), sample size issues, multivariate normality, and estimation methods (Iacobucci 2010; Ory and Mokhtarian 2010; Ryu 2011; Sun, Konold, and Fan 2011; Zhong and Yuan 2011). MacCallum and Austin (2000, p. 202) argue that application of SEM “has given rise to a variety of problems and chronic misuses and oversights in practice.” Existing reviews on SEM reveal several discrepancies in its applications.
Baumgartner and Homburg’s (1996) review of SEM-based articles in marketing and consumer research revealed a number of misapplications related to initial specifications of theoretical models, data screening, and testing of structural models. A review by Shook et al. (2004) of SEM in strategic management research suggested that reporting of results has been less than ideal and concluded that researchers have been making erroneous conclusions about relationships with variables. Martens’s (2005) study on applications of SEM in counseling psychology revealed that researchers did not engage in various best practices recommended by SEM experts. More recently, Hair et al. (2012) assessed the state of SEM-based research in marketing and concluded that SEM methodological properties are widely misunderstood, leading to misapplications of the technique. Similar concerns have also been expressed in other reviews of SEM (e.g., Holbert and Stephenson 2002; MacCallum and Austin 2000; Shah and Goldstein 2006). Thus, researchers from several disciplines have established critical reflections on SEM to ensure high-quality research and publication outputs (Hair, Ringle, and Sarstedt 2011).
SEM experts emphasize on the need to constantly evaluate the art and practice of multivariate analysis methods such as SEM in different disciplines (Bagozzi and Yi 2012; Hair et al., forthcoming). However, to date, the practices of SEM in tourism studies have not yet been assessed. Given the flaws uncovered and concerns raised by previous reviews and the growing use of SEM by tourism researchers, a critical analysis of use of SEM in tourism studies seems timely and warranted. This study achieves this by systematically reviewing applications of SEM in articles published in nine tourism journals between year 2000 and 2011. Differences in practices over time are analyzed, results are discussed in the light of recent developments in SEM, and a number of recommendations regarding future uses of this technique in tourism studies are made. As study background, the fundamentals and good practices of SEM are discussed which serve as a basis for evaluating the findings of this review.
There are two issues that readers of this article should take into account. First, only covariance-based SEM articles were included in the review while articles based on partial least squares SEM were excluded. Although these techniques share the same roots, partial least squares SEM is a causal modeling approach aimed at maximizing the variance in the dependent variable while covariance-based SEM reproduces the theoretical covariance matrix without focusing on explained variances (Hair, Ringle, and Sarstedt 2011; Hair et al. 2012). Second, it is not the purpose of this research to offer suggestions for innovative SEM practices. Rather, the study reviews existing applications of SEM with a view to identify areas of good practices and common pitfalls and provides recommendations for improving future use of this technique. The study serves several purposes for tourism research. First, the review allows tourism scholars to judge and gauge the quality of SEM research that has been published within the field. Second, it helps to identify problematic areas and provides guidance on preventing common pitfalls in using SEM for tourism research. Third, by comparing use of SEM over time, the study allows researchers to determine if practices related to SEM have improved. Finally, the study also educates researchers, journal editors, and reviewers by highlighting areas of concern regarding use of SEM in tourism research.
Fundamentals and Good Practices of SEM
A structural equation model is a complex composite statistical hypothesis that consists of the measurement model and the structural model (McDonald and Ho 2002). The measurement model of SEM, also known as the confirmatory factor model, depicts the pattern of observed variables for the latent variables in the hypothesized model. It represents a set of p observable variables as multiple indicators of a set of m latent variables. Confirmatory factor analysis is used to measure the adequacy of the measurement model (Schumacker and Lomax 2004). Items with high factor loadings most accurately represent the latent variable in the model and those that are weakly correlated with others poorly define the variable. The structural component of SEM is a hypothetical model that prescribes relationships among latent variables and their observed variables (Hoyle 1995). It relates the variables to other variables by providing path coefficients for each hypothesized relationships (see Bagozzi and Yi 2012; Crockett 2012; McDonald and Ho 2002; Nunkoo and Ramkissoon 2012b; Weston and Gore 2006 for further discussions on measurement and structural models)
Two-Step Approach to SEM
Structural equation models can be tested using a one-step or a two-step approach. The one-step approach involves simultaneous testing of the measurement and structural models in a single analysis. However, researchers have reported several limitations with this approach with respect to interpretational confounding resulting from misspecification (Anderson and Gerbing 1998; Burt 1976). Interpretational confounding “occurs as the assignment of empirical meaning to an unobserved variable which is other than the meaning assigned to it by an individual a priori to estimating unknown parameters” (Burt 1976, p. 4). Given this limitation, Anderson and Gerbing (1998) argue there is much to be gained in terms of theory testing and construct validity from separate estimation and respecification of the measurement model prior to simultaneous testing of the measurement and structural models. Consequently, the two-step approach, where the measurement and structural models are estimated separately, has gained wide acceptance among researchers and scholars across several disciplines (see Anderson and Gerbing 1998 for further discussions on the two-step approach to SEM).
Reliability and Validity
Reliability and validity of the measurement model should be assessed when using SEM (Bagozzi and Yi 2012). This is based on the premise that if one is not confident that the measures represent the constructs, then there is little reason to use them to evaluate and examine the structural model (Hair, Ringle, and Sarstedt 2011). Broadly defined, reliability is the degree to which measures are free from error, and therefore yield consistent results. Reliability of a construct is assessed by examining the indicator reliability and composite reliability (Bagozzi and Yi 2012; Hair, Ringle, and Sarstedt 2011; Hair et al. 2012). There are no universally accepted cut-off values for indicator and composite reliability (Bagozzi and Yi 2012). However, composite reliability values of between 0.60 and 0.70 in exploratory research and between 0.70 and 0.90 in advanced research are considered as desirable (Nunnally and Bernstein 1994). For indicator reliability, it is recommended that each indicator’s absolute standardized loadings should be higher than 0.70, and indicators with loadings between 0.40 and 0.70 should be considered for removal if this improves the composite reliability of the scale above the recommended values (Hair, Ringle, and Sarstedt 2011). In lieu of composite reliabilities, some researchers report Cronbach’s alpha values or both (Bagozzi and Yi 2012).
The validity of the measurement model is assessed by convergent validity and discriminant validity. Convergent validity is determined by examining the average variance extracted, which indicates the amount of variance explained by a latent variable. An average variance extracted value of 0.50 or higher indicates that convergent validity has been achieved (Hair, Ringle, and Sarstedt 2011). Discriminant validity can be assessed in three ways. The first method compares the squared correlation between a pair of constructs against the average variance extracted for each of the two constructs (Fornell and Larcker 1981). Discriminant validity is achieved when for each pair of constructs, the squared correlation is smaller than both the average variance extracted values. The second method examines the difference in the chi-square values between the unconstrained measurement model and the nested measurement model where the correlation between each pair of constructs is constrained to unity. A significantly lower chi-square for the unconstrained model indicates that discriminant validity is achieved (Anderson and Gerbing 1988). The third and more liberal method involves an examination of the indicators’ loadings, which should be higher than the loadings of all the remaining constructs (Hair, Ringle, and Sarstedt 2011; see Bagozzi and Yi 2012 and Hair, Ringle, and Sarstedt 2011; Hair et al. 2012 for further discussions on validity and reliability). Previous assessments of the use of SEM in marketing (e.g., Baumgartner and Homburg 1996; Hair et al. 2012), operations management (e.g., Shah and Goldstein 2006), and strategic management (Shook et al. 2004) raise concerns on the reporting of validity and reliability measures by researchers.
Alternative A Priori Models
A number of alternative models exist for any set of data (Jöreskog 1993; McDonald and Ho 2002). These are models that fit the data equally well. Before running an SEM analysis, it is important that researchers determine alternative models that will yield equally good fit to the theorized model (MacCallum, Wegener, Uchino, and Fabrigar 1993). In a robust SEM analysis, alternative models should be specified a priori (Boomsma 2000; MacCallum et al. 1993), and these typically reflect one or more previously specified competing models indicated by other theoretical propositions and/or contradictions in empirical findings (Hoyle and Panter 1995). Specifying alternative models a priori is also important when one or more hypothesized relations in the researcher’s favored model have been specified arbitrarily (Quintana and Maxwell 1999). It is recommended that the fit indices of the plausible competing models are reported (McDonald and Ho 2002). Researchers have expressed concerns that specification of alternative models a priori is often ignored and represents one of the most disturbing issues in application of SEM (MacCallum et al. 1993).
Multivariate Normality and Estimation Methods
The majority of statistics in SEM requires the data set to be multivariate normal. This can be assessed by verifying the kurtosis and skewness values of each variable (Weston and Gore 2006) and in some instances, researchers can also examine the z-scores and look for extreme values on each dependent variable (Burdenski 2000). A more rigorous method for assessing multivariate normality is the Mahalanobis distance statistics, which can be used to detect scores that deviate from the mean for a group of dependent variables (Burdenski 2000). One of most widely used estimation methods in SEM is maximum likelihood (ML) based on normal theory (Ryu 2011). ML estimation provides parameter estimates that are most likely to represent the population values, given that the data have a multivariate normal distribution in the population. Use of ML in SEM requires normally distributed data (Bagozzi and Yi 2012; Hair et al. 2012; Ory and Mokhtarian 2010). Violations of this assumption may lead to distorted results (Ryu 2011). Thus, it is important that SEM researchers report potential issues and concerns related to multivariate normality in their study. Other estimation methods in SEM include generalized least square, weighted and unweighted least squares, asymptotically distribution free, and ordinary least square. Multiple estimation techniques should be used if the assumption of multivariate normality is violated (Ory and Mokhtarian 2010). Reporting of normality is one of the most disturbing issues reported in previous reviews on SEM (e.g., Hair et al. 2012; Marten 2005; Shah and Goldstein 2006).
Model Evaluation: Fit Indices
Structural models are approximations of reality, and not all hypotheses may be true. Consequently, a number of fit indices that reflect the goodness or weakness of SEMs has been developed. One of the most common fit indices is chi-square which is a likelihood ratio statistic for testing a hypothesized model against the alternative that the covariance matrix is unconstrained (Bagozzi and Yi 1988). However, although widely reported by majority of SEM researchers, chi-square is sensitive to sample size, data nonnormality, and model complexity (Bentler and Bonett 1980; Byrne 1998; Gerbing and Anderson 1985; Hu and Bentler 1995). Consequently, other types of fit indices have been developed to compensate for the weaknesses of chi-square statistic. These include the comparative fit index (CFI), root mean square error of approximation (RMSEA), root mean square residual (RMSR), standardized RMSR (SRMSR), goodness-of-fit index (GFI), adjusted GFI (AGFI), normed-fit-index (NFI), non-NFI (NNFI) or Tucker–Lewis index (TLI), parsimonious GFI (PGFI), parsimonious NFI (PNFI), incremental-fit-index (IFI), and relative-fit index (RFI). Because these fit indices are covered extensively in other publications (e.g., Bollen 1989; Hu and Bentler 1998, 1999; Nunkoo and Ramkissoon 2012b; Schumacker and Lomax 2004), we do not provide a detailed discussion here. Evaluation and reporting of model fit are some of the most controversial issues in SEM practices, and considerable disagreement exists among researchers about the value of the different fit indices (see, e.g., Heene et al. 2011; Iacobucci 2010; Nye and Drasgow 2011; Sun, Konold, and Fan 2011; Williams and O’Boyle 2011).
Post Hoc Modifications
A common approach to model comparison in SEM is post hoc modifications. This involves the respecification and modification of a target model post hoc, based on misspecification revealed after the target model has been estimated and examined (MacCallum and Austin 2000; MacCallum, Roznowski, and Necowitz 1992). Models that display poor fit can be modified using modification indices to improve fit by adding parameters or deleting insignificant paths (Martens 2005). Development in SEM packages has made modifications very easy, but at the same time, it has also encouraged researchers to abuse the process (MacCallum and Austin 2000; Quintana and Maxwell 1999). Researchers generally recommend against using post hoc modifications in SEM analysis unless there are strong theoretical and empirical justifications (Hoyle and Panter 1995; MacCallum and Austin 2000; MacCallum, Browne, and Sugawara 1996; MacCallum, Roznowski, and Necowitz 1992; McDonald and Ho 2002). Their concerns stem from the fact that post hoc modification in SEM analysis is seen as the misapplication of essentially a confirmatory process for exploratory purposes (MacCallum et al. 1993). Researchers also suggest that there is no guarantee post hoc modifications will eventually lead to the true model (Quintana and Maxwell 1999). MacCallum, Roznowski, and Necowitz (1992) also argue that models modified using the same sample data may not cross-validate well. Given these concerns, SEM experts note that specifying alternative models a priori is generally safer than post hoc modifications (Boomsma 2000; Hoyle and Panter 1995; McDonald and Ho 2002).
Reporting of Effect Size
The R2 value is a primary criterion for evaluating structural models (Hair, Ringle, and Sarstedt 2011). One of the goals of SEM is to explain and predict the endogenous latent variables in a structural model. Thus, it is important for researchers to report the amount of variance in the endogenous variables that is explained by the exogenous (predictor) variables (Martens 2005). The R2 value provides such an indication, although what its value should be depends on the discipline. Generally, R2 values of 0.75, 0.50, or 0.25 for the endogenous constructs are considered high, moderate, and weak, respectively (Hair, Ringle, and Sarstedt 2011). Researchers have expressed concerns over incomplete reporting of R2 values or disturbance associated with endogenous latent variables in SEM studies (Hoyle and Panter 1995; MacCallum and Austin 2000; McDonald and Ho 2002). Martens’s (2005) review on use of SEM in counseling research revealed that only around 46% of studies provided some indication of effect size associated with the outcome variables.
Decomposition Effects
The total effect of one variable on another can be decomposed into a direct effect (no intervening variables involved) and an indirect or mediating effect (through one or more intervening variables). According to Baron and Kenny (1986), a mediator is a third intervening variable that changes the association between a predictor and an outcome variable. Mediation analysis attempts to “identify the intermediary process that leads from the independent variable to the dependent variable” (Muller, Judd, and Yzerbyt 2005, p. 852). Thus, in a mediation model, the predictor variable is presumed to cause the mediator that in turn causes the outcome variable (Wu and Zumbo 2008). It is for this reason that a mediation effect is also known as an indirect effect. Mediators provide useful information about how, why, or when a phenomenon occurs. SEM allows for the simultaneous estimation of direct, indirect, and total effects with multiple exogenous and endogenous variables (Stage, Carter, and Nora 2004). Holbert and Stephenson’s (2002) review of SEM in communication sciences noted that researchers rarely discussed indirect and total effects.
Sample Size
Sample size in SEM is one of several areas where there is no consensus among researchers (Bagozzi and Yi 2012). Some researchers argue that SEM analysis based on samples smaller than 200 should not be considered for publication, unless the population from which the sample is drawn is itself small (Barrett 2007). Others (e.g., Iacobucci 2010) suggest that a sample size of at least 50 is acceptable and argue that the rule of thumb suggesting sample size should be greater than 200 is too simplistic. Still other researchers (e.g., Kline 1998) argue that 10 to 20 respondents per parameter estimates will result in a sufficient sample. Bentler and Chou (1987) suggest 5 to 10 participants per parameter estimate, while Mueller (1996) argue that the ratio of respondents to the number of parameters should be 10:1. However, Costello and Osborne (2005) note that the 10:1 ratio is not adequate and suggest a ratio of 20:1 as ideal. Thus, considerable disagreements exist among researchers regarding the appropriate sample size for SEM. Despite these divergences, in a recent article, Bagozzi and Yi (2012) argue for a sample size of above 200, noting that “an exclusive focus on sample size may miss the point. Other issues are often more important under certain circumstances” (p. 29). Estimation methods, distributional properties of measures, desired power, and model complexity should be taken into account when determining sample size.
Methodology
Our review focuses on use of SEM in nine tourism journals: Journal of Travel Research, Annals of Tourism Research, Tourism Management, Journal of Travel and Tourism Marketing, Journal of Sustainable Tourism, Journal of Vacation Marketing, Asia Pacific Journal of Tourism Research, Tourism Analysis, and International Journal of Tourism Research. These journals were selected because apart from being the leading publication outlets for tourism research, they have different foci, aims, and objectives. These ensured that SEM-based articles with different tourism orientations (e.g., marketing, planning, psychology, sociology) were included in the study. All issues between 2000 and 2011 were searched for empirical-based applications of covariance-based SEM. Existence of the structural component of SEM was a necessary condition for articles to be included in the study. Articles that used SEM uniquely for confirmatory factor analysis, conceptual papers on SEM, partial least squares SEM, and research notes were excluded from the review.
Coding of Variables and Data Analysis
Each article was treated as the unit of analysis, and the variables of interest were coded in SPSS by two researchers independently. Disagreements on coding were discussed and expert advice was sought where necessary. For descriptive purposes, the year an article was published was simply coded by the year of publication. To assess whether SEM practices have changed over time, articles were grouped in two time periods depending on year of publication: 2000-2008 and 2009-2011, representing the past and the present years, respectively. This grouping ensured that the two time periods had a roughly equal number of papers published, making it meaningful for comparison purposes. Chi-square difference test was used to assess significant changes in SEM practices over time. In situations where a chi-square test was not appropriate (e.g., where there were very few cases), Fisher’s exact test (Fisher 1922) was used to calculate statistical significance. To assess growth of SEM over time, we used time-series analysis, examining linear and quadratic effects of time on number of papers published.
Results and Discussion
Two-hundred and nine articles (N = 209) that used SEM were published between 2000 and 2011 in the nine tourism journals (Table 1). Around 52% (n = 109) of papers were published between 2000 and 2008, while around 48% (n = 100) were published between 2009 and 2011 (Table 1). In terms of output per journal, Tourism Management (69 articles, 33%), Journal of Travel Research (35 articles, 16.7%), Journal of Travel and Tourism Marketing (27 articles, 12.9%), and Annals of Tourism Research (24 articles, 11.5%) published the highest number of SEM-based articles (Table 1). To statistically assess growth trend over time in use of SEM, we follow Hair et al. (2012) and Shah and Goldstein (2006) who applied time-series analysis in their review of marketing research and operations management research, respectively. We regressed the number of articles on an index of year of publication (beginning with 2000) and used both linear and quadratic effects of time in the regression model. Model estimation using a linear term resulted in a significant model (F = 58.65, p < 0.001) in which time effect was significant (t = 7.66, p < 0.001). The model indicated that 85% of SEM application in tourism research could be explained by time effect.
SEM-Based Articles Published by Journal and by Year of Publication (N = 209).
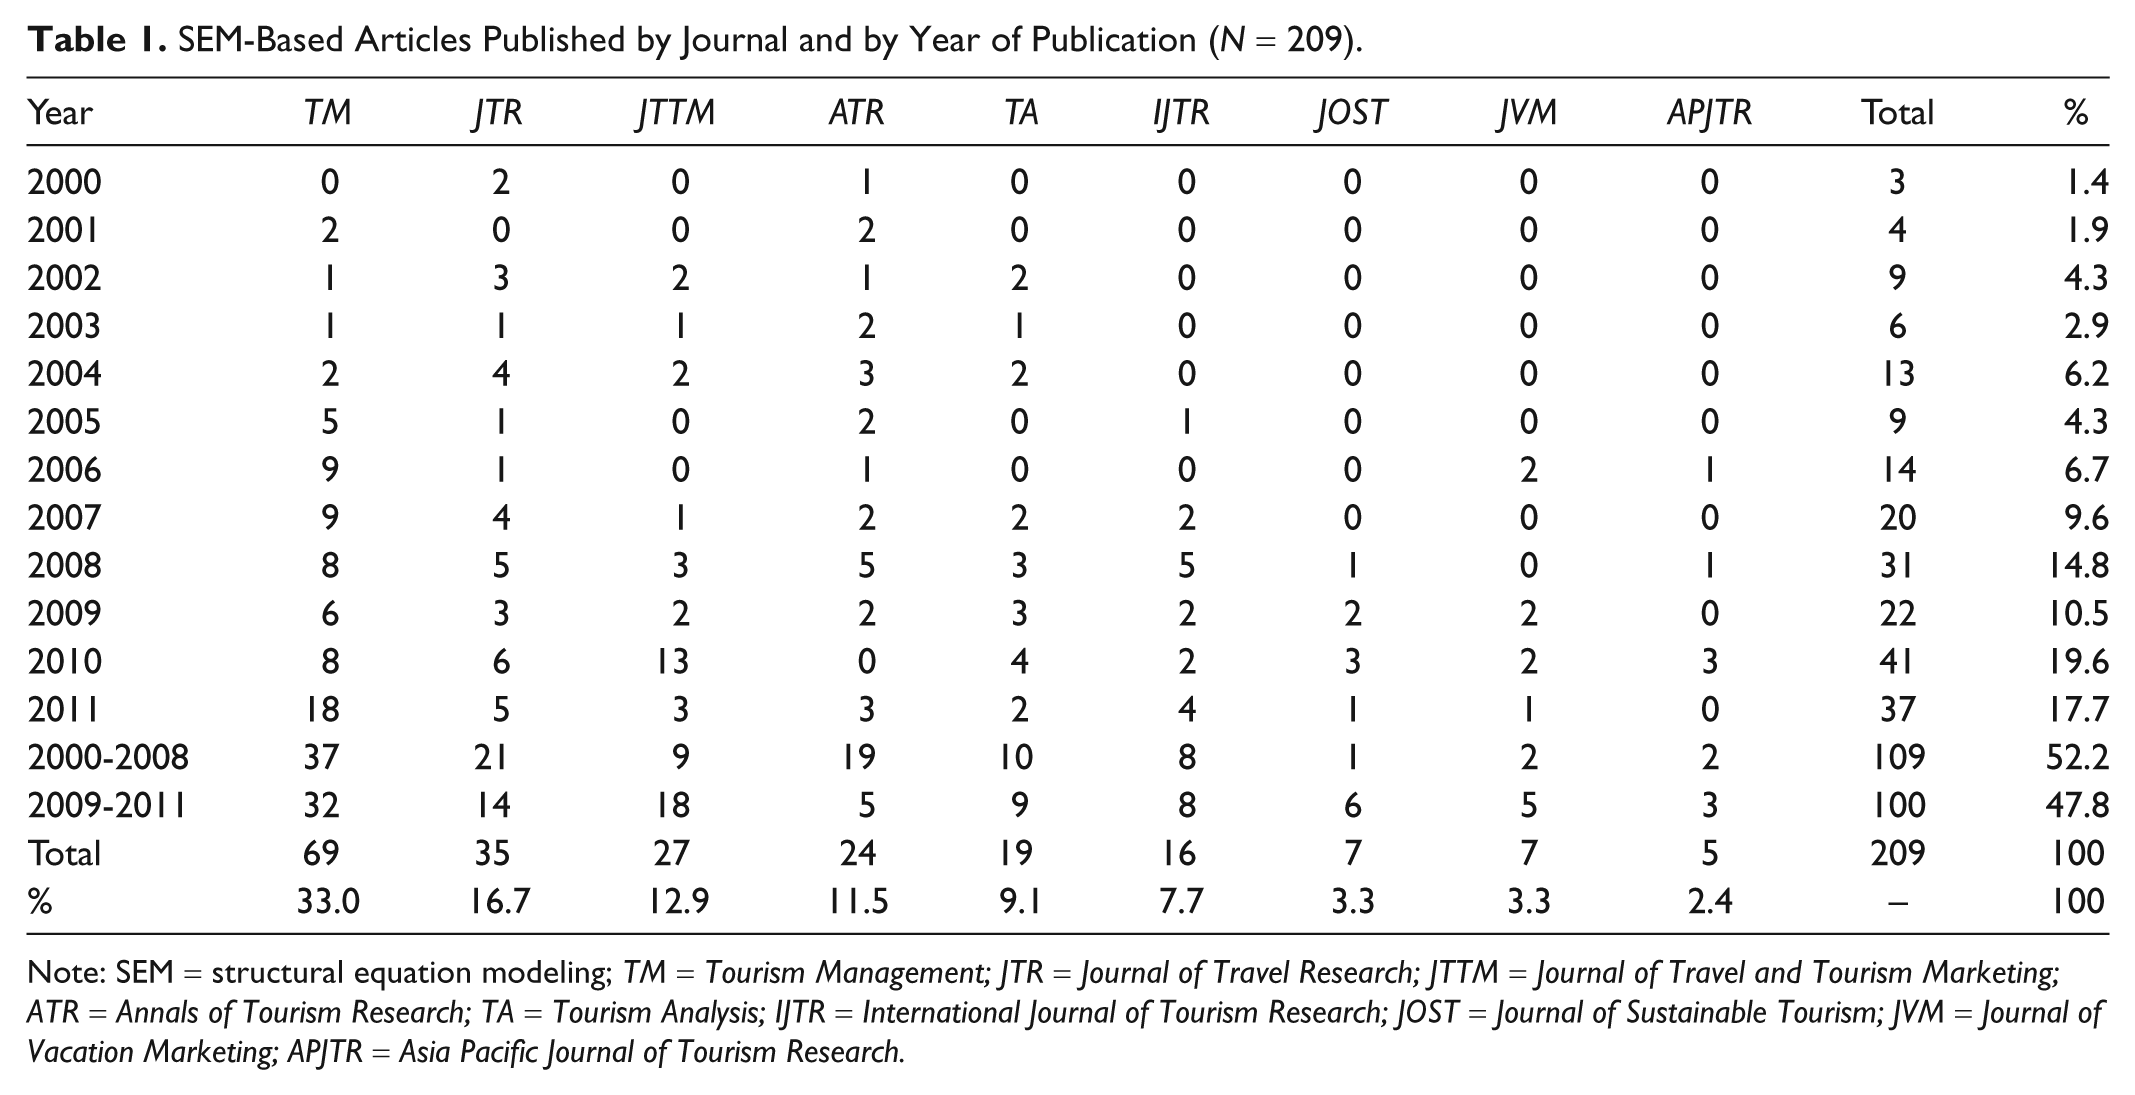
Note: SEM = structural equation modeling; TM = Tourism Management; JTR = Journal of Travel Research; JTTM = Journal of Travel and Tourism Marketing; ATR = Annals of Tourism Research; TA = Tourism Analysis; IJTR = International Journal of Tourism Research; JOST = Journal of Sustainable Tourism; JVM = Journal of Vacation Marketing; APJTR = Asia Pacific Journal of Tourism Research.
Next, we used both linear and quadratic time effects. The regression model was significant (F = 38.94, p < 0.001) and indicated that 90% of SEM applications could be explained by linear and quadratic time effects. The quadratic effect was also significant (t = 1.91, p < 0.10), indicating that growth of SEM has accelerated over time. Our results are consistent with Hair et al. (2012) and Shah and Goldstein (2006), who found a significant quadratic effect in SEM-based marketing research and operations management research, respectively, although the latter also reported an insignificant linear effect of time on number of articles published. In general, our results suggest that SEM has remained a popular technique among tourism researchers. This can be attributed to the fact that tourism scholars are highly involved in testing complex theoretical models containing multiple dependent and independent variables. Also, many concepts such as attitudes, perceptions, satisfaction, behavioral intention, loyalty, value, etc. commonly used in tourism studies are latent variables that are ideally measured by several indicators (Reisinger and Mavondo 2007; Reisinger and Turner 1999). SEM is known for its ability to test theories and deal with multiple latent variables (Anderson and Gerbing 1988; Bagozzi and Yi 2012; Crockett 2012).
Sample Size
Sample size is a crucial issue in SEM and has a significant impact on reliability of parameter estimates, model fit, and statistical power. The sample size utilized in the SEM-based articles reviewed is presented in Table 2. The majority of studies (99 articles, 47.4%) used a sample of between 151 and 400 respondents, 56 articles (26.8%) used a sample of between 401 and 650 cases, and 25 articles (12.0%) used a sample of more than 900 respondents. No significant change was noted over the two time periods (p > 0.05) over use of these sample range. Use of samples between 651 and 900 respondents was more prevalent during past years (p < 0.05). Very few studies (nine articles, 4.3%) relied on a sample of 150 respondents or less. These findings are more favorable than those reported by researchers from other disciplines. Holbert and Stephenson (2003) reported 27% of SEM models in communication sciences used a sample below 150, while MacCallum and Austin (2000) found 18% of studies used samples fewer than 100 respondents in psychological research.
Sample Size and SEM Software Packages Utilized by Year of Publication: Past (n = 109) versus Present (n = 100).
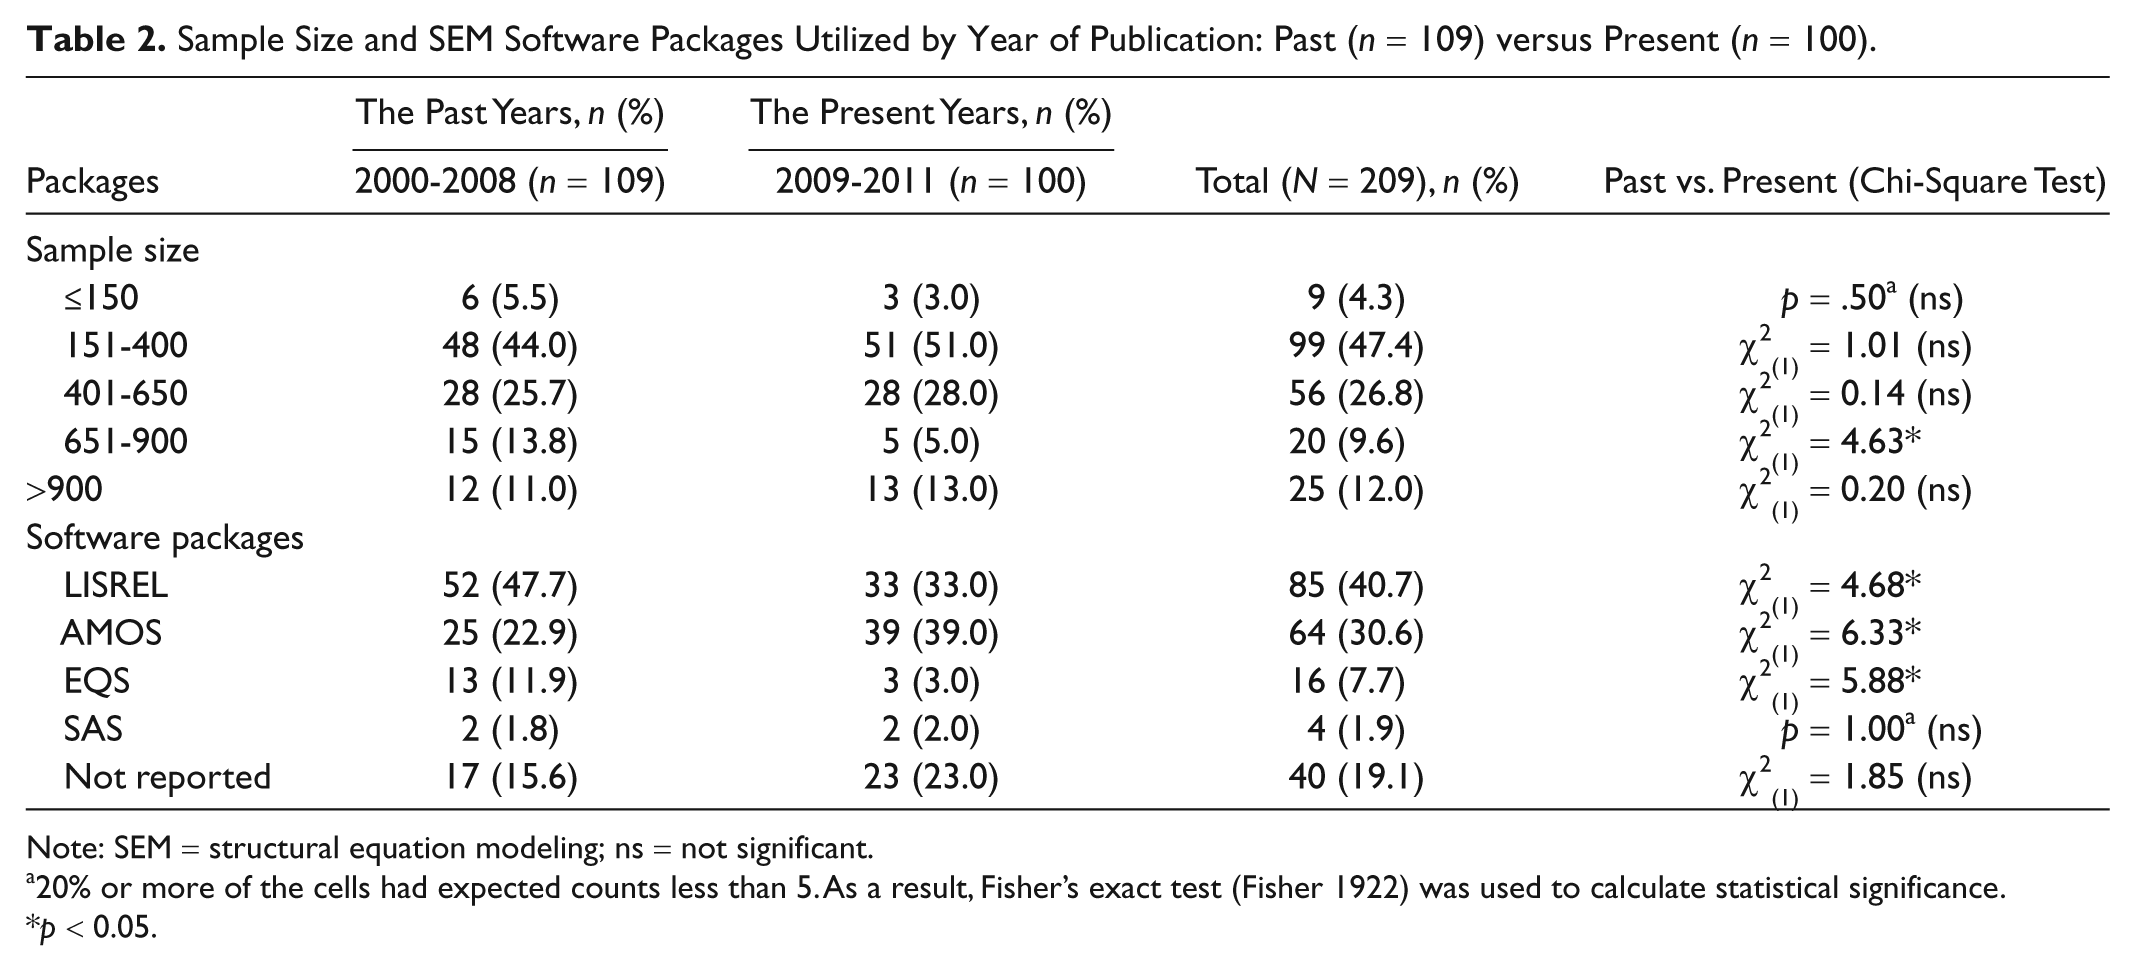
Note: SEM = structural equation modeling; ns = not significant.
20% or more of the cells had expected counts less than 5. As a result, Fisher’s exact test (Fisher 1922) was used to calculate statistical significance.
p < 0.05.
Software Packages
LISREL (Jöreskog and Sörbom 1996), AMOS (Arbuckle 1999), and EQS (Bentler 2000) are some of the SEM software packages available to researchers. Reporting of the software used is important because of licensing agreement requirements and also because different programs exhibit different default settings (Hair et al. 2012; Hair et al., forthcoming). For example, SEM packages differ in the way data are processed with respect to model specification, assessment, and misspecification (Byrne 2001). We reviewed the packages used by tourism researchers and the results are presented in Table 2. Forty articles (19.1%) did not indicate which software package was used and this practice did not change over the two time periods (p > 0.05). The most popular software package was LISREL (85 studies, 40.7%), although its use was more prevalent in past studies (p < 0.05). This finding confirms that of Shah and Goldstein (2006) and Shook et al. (2004), who found LISREL to be the most popular package in operations management and strategic management research, respectively. Use of EQS was also more prevalent in past studies (p < 0.05), while use of AMOS was significantly more common in recent studies (p < 0.05). The growing popularity of AMOS may be attributed to the fact that it is more user-friendly and produces clear graphics (Byrne 2001), while path diagrams generated by LISREL cannot be imported into a manuscript without substantial revisions.
SEM Practices
A visual illustration of the hypothesized/structural model is recommended in SEM articles (Hoyle and Panter 1995). Findings from Table 3 suggest the majority of articles (205 articles, 98.1%) contained a visual illustration of either the conceptual model or structural model, or both. This finding is more favorable than that of Holbert and Stephenson (2002), who reported that only 54% of SEM-based articles in communication sciences contained a visual illustration of the model. SEM experts have also been advocating the need to evaluate alternative models a priori. Surprisingly, a very small proportion of the articles reviewed (25 articles, 12.0%) specified more than one model a priori, and no improvement was noted over the two time periods (p > 0.05) (Table 3). This finding confirms researchers’ concerns that evaluation of alternative models is underutilized in SEM studies (MacCallum et al. 1993). Martens (2005) and MacCallum and Austin (2000) also reported that several SEM studies in counseling and psychological research respectively did not specify alternative models a priori, although they reported a higher percentage of articles that did so (47.6% and 55%, respectively) compared to what our findings reveal.
SEM Practices and Fit Indices by Year of Publication: Past (n = 109) versus Present (n = 100).

Note: SEM = structural equation modeling; ns: not significant.
20% or more of the cells had expected counts less than 5. As a result, Fisher’s exact test (Fisher 1922) was used to calculate statistical significance.
Only fit indices reported in more than five articles are presented.
p < .10; **p < 0.05; ***p < .01.
Surprisingly, only a small proportion of studies discussed or reported multivariate normality (36 articles, 17.2%), and this practice did not change over time (p > 0.05) (Table 3). Generally, previous reviews on SEM have also expressed serious concerns over the very low proportion of articles that report multivariate normality. Hair et al.’s (2012) recent study on use of SEM in marketing research revealed that only 9.3% of articles discussed normality issues. Martens’s (2005) review of applications of SEM in counseling psychology indicated that only 19% of studies reported multivariate normality. Likewise, Shah and Goldstein’s (2006) review noted that only 26.6% of studies discussed normality issues in operations management research. Reporting of normality seems to be a major concern across several disciplines, including tourism. Findings from Table 3 further suggest that the majority of articles (174 articles, 83.3%) used the two-step approach to SEM, and this practice was significantly more prevalent recently (p < 0.05). This suggests that tourism researchers understand the benefits offered by the two-step approach advocated in the seminal work of Anderson and Gerbing (1998) as well as in more recent studies on SEM (e.g., Bagozzi and Yi 2012; Crockett 2012; Hair et al. 2012). However, we note that some researchers still use the one-step approach to model testing, a malpractice that should be discouraged.
The most common model estimation method among tourism researchers was ML (98 articles, 46.9%), and there was no significant change in its use over time (p > 0.05) (Table 3). The weighted least square method was used in only three articles (1.4%). A cause for concern is that the majority of articles (108 articles, 51.7%) failed to report the estimation method used, and this malpractice did not change over the two time periods (p > 0.05). These findings are similar to those of Shah and Goldstein (2006) and Baumgartner and Homburg (1996), who reported ML as the most popular estimation method in operations management research and marketing research, respectively. Shah and Goldstein (2006) also expressed concerns over the high proportion of articles that did not report the estimation method used. The popularity of ML among researchers may be attributed to the fact that it can accommodate some degree of nonnormality (Bollen 1989), although it produces distorted results in case of severe normality violations (Ryu 2011). The reason for this preference may also be that ML technique is the default program in most SEM software packages.
Reliability and validity of the measurement model should be assessed and reported in SEM studies. Findings described in Table 3 reveal that the majority of articles (151 articles, 72.2%) assessed reliability and validity of their measures, a practice that was more common during recent years (p < 0.05). Although this finding is encouraging for the tourism field, the number of articles that did not report measures of reliability and validity (21 articles, 10%), and those that assessed only reliability (36 articles, 17.2%), is a cause for concern. These malpractices did not change over the two time periods (p > 0.05). Concerns over reliability and validity issues have also been expressed in SEM reviews in other disciplines such as marketing (e.g., Baumgartner and Homburg 1996; Hair et al. 2012) and operations management (e.g., Shah and Goldstein 2006).
We also assessed the extent of research that involved post hoc model modifications. Results suggest only around 13% of articles reported engaging in this practice and there was no significant change over the two time periods (p > 0.05). Martens’s (2005) review reported a higher percentage (40%) of SEM studies in counseling psychology that used post hoc modifications. The small proportion of tourism studies that involved post hoc modifications can be attributed to the fact that SEM experts have generally recommended against this practice (Hoyle and Panter 1995; McDonald and Ho 2002), which has been described as “potentially misleading and easily abused,” unless such modifications are theoretically meaningful (MacCallum and Austin 2000, p. 216). Research has shown that models generated by post hoc modifications often lack validity and are highly susceptible to capitalization on chance (MacCallum, Roznowski, and Necowitz 1992). In addition to this, limited use of post hoc modifications in the articles reviewed may also be due to the fact that researchers fail to report model modification issues although it may be a common practice among them.
Results from Table 3 raise concerns regarding the limited number of studies (98 articles 46.9%) that reported effect size. No significant change was observed between the two time periods (p > 0.05) regarding this practice. These results are consistent with Marten (2005) and Holbert and Stephenson (2002), who reported less than half (46.7% and 35.6%, respectively) of SEM articles in counseling psychology and communication research respectively discussed measures of effect size. Findings from Table 3 also suggest only a small proportion of studies (46 articles, 22.0%) estimated indirect or total effects (or both), and this practice did not change over time (p > 0.05). Holbert and Stephenson (2002) also reported a very low proportion of articles that discussed indirect and total effects.
Fit Indices
The indices used by tourism researchers to evaluate model fit are presented in Table 3. As expected, chi-square was the most common fit statistics reported (199 articles, 95.2%). Its popularity can be attributed to the fact that it is “the most fundamental” (Bagozzi and Yi 2012, p. 28) and the most “direct and obvious test of model fit” (Barrett 2007, p. 818). CFI (177 articles, 84.7%), RMSEA (173 articles, 82.8%), GFI (130 articles, 62.2%), and NNFI (108 articles, 51.7%) were also reported in the majority of articles. The popularity of these fit indices have also been confirmed in previous reviews of SEM in communication sciences (e.g., Holbert and Stephenson 2002), marketing (e.g., Baumgartner and Homburg 1996), strategic management (e.g., Shook et al. 2004), counseling psychology (e.g., Martens 2005), and operations management (e.g., Shah and Goldstein 2006). Other common fit indices reported in tourism studies (although not used in most articles) included NFI, AGFI, RMSR, IFI, and SRMSR.
Results from Table 3 also suggest changes in the reporting of some fit indices over time. These results should also be understood taking into account the fact that researchers are usually selective over which fit indices to report in journal articles. They generally report only those fit measures that show support for their model and choose not to report on those fit indices that fail to show that the model is a good fit to the data. Use of CFI (p < 0.05) and RMSEA (p < 0.05) was more prevalent in recent studies, and this can be attributed to the fact that SEM experts have advocated for their use through several publications (e.g., Bagozzi and Yi 2012). GFI, AGFI, and RMSR were more common in past studies (p < 0.05). Martens’s (2005) study also reported that use of GFI and AGFI in counseling psychology decreased over time, and he attributed this decrease to the problematic nature of these indices. For example, GFI and AGFI are dependent on sample size and research shows that they do not perform as well as RMSEA, CFI, and NNFI (Bagozzi and Yi 2012). Although SEM experts (e.g., Bagozzi and Yi 2012) recommend the use of SRMSR as a measure of model fit, it is surprising to note that very few studies (34 articles, 16.3%) reported this fit index. PNFI, PGFI, and RFI were least common among the various fit indices reported (Table 3). This is probably because PNFI and PGFI are parsimonious fit measures that are used to establish the impact of additional parameters to the model; that is, these indices established whether adding additional model parameters is worth the decrease in the degrees of freedom (Crockett 2012). As such, they are best used to compare two or more models, and given that our results indicate that very few tourism studies involved model modifications, low usage of PNFI and PGFI is not surprising.
Impact of Journal Quality on the Use of SEM
In a recent article, Hair et al. (2012) assessed the differences in SEM practices between top-tier journals and lower-tier journals in the marketing field. We also compared use of SEM in top-tier tourism journals (Annals of Tourism Research, Journal of Travel Research, and Tourism Management; 128 articles, 61.2%) with those in other leading publication outlets in the field (Journal of Travel and Tourism Marketing, Journal of Sustainable Tourism, Journal of Vacation Marketing, Tourism Analysis, International Journal of Tourism Research, and Asia Pacific Journal of Tourism Research; 81 articles, 38.8%) (McKercher, Law, and Lam 2006). Consistent with Hair et al. (2012), our findings reveal only few significant differences. Post hoc modifications were more often reported (p < 0.01) in top-tier journals (25 articles, 19.5%) than in the other publications (3 articles, 3.7%). Reporting of effect size was also significantly more common (p < 0.10) in top-tier journals (66 articles, 55.6%) than in other publications (32 articles, 35.5%). Estimation of decomposition effects was significantly more prevalent (p < 0.10) in top-tier journals (33 articles, 25.8%) than in the other leading publication outlets (13 articles, 16.0%). In terms of fit indices, use of PNFI(p < 0.01), RFI (p < 0.05), and PGFI (p < 0.10) was significantly more common in the top-tier journals. The popularity of PNFI and PGFI in top-tier journals can be attributed to the fact that post hoc modifications were more prevalent in these journals. No significant differences were noted in the reporting of other fit indices and SEM practices between the two groups of journals.
Future of SEM in Tourism Research
The findings of this study provide an important basis for improving future use of SEM in tourism studies to ensure high-quality research. While parts of the results are encouraging for the field, others are disconcerting and raise concerns that need to be addressed if rigorous research and publication practices are to be achieved. A cause for concern is the limited number of studies that reported measures of multivariate normality. Lack of considerations for normality may be attributed to the fact that the majority of tourism researchers use ML estimation, which performs well under moderate violations of normality (Bollen 1989). However, recent simulation research on SEM suggests ML requires the data to be multivariate normal (Hair et al. 2012; Zhong and Yuan 2011) and that severe violations of this assumption produce distorted results such as biased standard errors, inaccurate test statistics, and inflated Type I error (Chou, Bentler, and Satorra 1991; Hu, Bentler, and Kano 1992; Ryu 2011). Thus, we recommend that every SEM-based article should contain a discussion on normality/nonnormality issues. Researchers should also provide a rationale for their chosen estimation method, and such decisions should not be arbitrary, but rather, should depend on factors such as extent of nonnormality of data and sample size. It is also important for researchers to use multiple estimation techniques if nonnormality or sample size is a concern as recommended by recent simulation research on SEM (e.g., Ory and Mokhtarian 2010).
Testing multiple models a priori is one of the strengths of SEM (Hoyle and Panter 1995; MacCallum and Austin 2000). Yet, our findings indicate that very few studies tested multiple a priori models and no significant improvement in this practice. Testing alternative models a priori may uncover new relationships among variables that are important for further theoretical developments in tourism research. Thus, we recommend that tourism researchers engage more frequently in testing alternative theoretically plausible models a priori. It is also important for tourism researchers to report the software application used to run SEM because different programs have different default settings (Hair et al. 2012). Some studies omitted this information and we recommend that future tourism studies on SEM state the software package used to carry out the analysis. Although it is encouraging to note that most studies used the recommended two-step approach to SEM (Anderson and Gerbing 1988) and that this good practice was more prevalent in recent studies, there still remains a small number of articles that use the one-step approach to model testing. There is much to be gained from the two-step approach in terms of assessment of construct validity (Bentler 1978), and thus, we recommend that future SEM tourism scholars consider the use of this approach in their research.
Reliability and validity issues underlie use of SEM (Bagozzi and Yi 2012; Hair, Ringle, and Sarstedt 2011; Hair et al. 2012). Yet, some studies reported only reliability of their measures, while others did not report either of them, although it is encouraging to note that recent studies were more likely to report reliability and validity of the measures. Hair et al. (2012, p. 424) note that “if measures lack reliability and validity, inner model estimates may be substantially biased, leading researchers to overlook relationships that could be significant.” As such, since SEM often serves as a basis for theory development in tourism research, future research avenues could be compromised or undermined if models lack reliability and validity. Thus, it is indispensable that future SEM articles report measures of reliability and validity. The recommended measures of reliability include composite reliability and indicator reliability. For validity, researchers should assess convergent and discriminant validity (Hair, Ringle, and Sarstedt 2011). The small number of studies that reported measures of effect size also raises concerns. A model may have acceptable fit indices, yet accounts for below 1% of the variance in the primary endogenous variable (Tomarken and Waller 2003). Many researchers and scholars find it of value to know the amount of variance accounted for in the endogenous variables by the exogenous ones. The R2 statistic is an important criterion for evaluating structural models (Hair et al. 2012). It is recommended that future tourism studies using SEM report the variance accounted for in each endogenous variable.
SEM offers substantial advantages over other multivariate statistical techniques in the evaluation of mediating (indirect) effects (Crockett 2012; Quintana and Maxwell 1999). However, tourism researchers using SEM have not taken full advantage of this given the low proportion of articles that estimated mediating effects. The study of tourism phenomenon often requires that researchers go beyond understanding simple bivariate relationships by looking at one or more intervening variables. Mediators allow a more precise description of the relationship between the predictor and the outcome variables (Wu and Zumbo 2008). In doing so, they allow the refinement of theoretical relationships among variables and are thus useful for further theoretical developments in tourism. SEM provides researchers the flexibility of including multiple causes and mediators in one single model (Lau and Cheung 2012; MacKinnon et al. 2002). As such, it is important that tourism researchers consider use of SEM for mediation analysis to ensure that the full benefits offered by this technique are achieved for the advancement of tourism research.
Although there is considerable debate about fit indices, SEM experts agree on the usefulness of chi-square, RMSEA, NNFI, CFI, SRMSR, and RMSR as measures of model fit (Bagozzi and Yi 2012; Hu and Bentler 1995; MacCallum and Austin 2000; Weston and Gore 2006). Taking these recommendations into account, our findings suggest that the majority of articles reviewed (although not all) reported chi-square, CFI, and RMSEA, while use of NNFI, SRMSR, and RMSR was very low. Thus, future tourism studies should report each one of these fit indices to enable readers to fully evaluate their models and improve credibility of their findings. However, this recommendation should by no means be taken for granted. Researchers should note that recent developments in SEM suggest that RMSEA may be influenced by sample size, leading to Type I and Type II errors (Nye and Drasgow 2011), SRMSR is most sensitive to nonnormality, while NFI, CFI, and NNFI are most sensitive to model misspecification (Sun, Konold, and Fan 2011). In contrast, NFI appears to be least sensitive to nonnormality, RMSR and AGFI are likely to be the least sensitive to model misspecification (Sun, Konold, and Fan 2011), and RMSEA and SRMSR appear to be robust against nonnormality (Nye and Drasgow 2011). Recent research also suggests that simple rules of thumb regarding fit indices do not always work, and that it is important for researchers to decide how much emphasis should be placed on each type of evidence in their particular study, taking into account sample size, multivariate normality, and desired statistical power (Iacobucci 2010; Nye and Drasgow 2011; Williams and O’ Boyle 2011).
Conclusion and Limitations
SEM is becoming an increasingly popular statistical technique among social science researchers. This study is an assessment of its use in tourism research. The results suggest that while some aspects of SEM are applied correctly, there are a number of misapplications that are common across other disciplines such as marketing, consumer behavior, and psychology. Tourism researchers seem to have adopted the practices and malpractices in use of SEM from other disciplines, probably because the use of SEM is comparatively recent in tourism studies compared to other fields where it is a more established statistical technique. The problems identified in this review can have substantial impact on the quality and validity of findings, and it is important that these are addressed in future tourism studies that use SEM. It is hoped that the quality of SEM-based studies in tourism will be enhanced by this review and our recommendations so that empirical research is improved and ultimately advances theory and practice. It is important for tourism researchers to keep abreast of latest developments in SEM by consulting statistical journals (e.g., Structural Equation Modeling: A Multidisciplinary Journal; Multivariate Behavioral Research) that frequently publish simulation exercises presenting new innovations on this technique. Tourism scholars should also refer to specialized statistical textbooks on multivariate statistics that contain a more comprehensive and detailed explanation of the different statistical techniques than refereed articles, which are constrained by word and page limitations.
Readers should evaluate results of this study taking into account some of its limitations. There are other complex statistical issues with SEM that were beyond the scope of this study. There may be value for future tourism researchers to investigate the magnitude of the fit indices reported, ratio of observed variables to latent variables, an indicator’s absolute contribution to a construct, ratio of sample size to number of parameters estimated, and percentage of recursive and nonrecursive models. These would allow for a more thorough assessment of use of SEM in tourism studies. An important assumption of SEM is that it is theory driven, where the technique is used to evaluate a substantive theory with empirical data. Misuse of this technique can occur if it is used as a theory-generating approach. It was not within the scope of this review to assess the extent to which use of SEM in tourism is linked to underlying theory, and thus, we recommend this as an area of future investigations by tourism researchers. Finally, the study reviewed use of SEM in tourism studies only and excluded articles published in hospitality journals. SEM is also a popular technique in hospitality research and future research should assess its use in this field. It may also be of value to compare use of SEM between the two allied fields.
Footnotes
Declaration of Conflicting Interests
The author(s) declared no potential conflicts of interest with respect to the research, authorship, and/or publication of this article.
Funding
The author(s) received no financial support for the research, authorship, and/or publication of this article.