
Abstract
China outbound tourism contributes substantial foreign receipts but also creates carbon and water footprints at destinations. This study is set out to analyze whether this tourist segment is a preferred market from the economic and environmental perspectives. Using Taiwan as an example, the direct carbon emission per dollar and total carbon footprint per Chinese inbound visitor is about 20% more efficient than other markets because of a high consumption pattern, longer length of stay, and closer distance between the two regions. However, one unsatisfactory area is the total water footprint because of their high spending on food-related souvenirs that generates substantial water requirements from the agriculture sector. When forecasting the estimated growth of Chinese visitors in Taiwan to 2016, an additional 0.8% increase in economic output is expected at the expense of a 2.7% increase in CO2 emissions and a 3.0% increase in water use.
Keywords
Introduction
The sustainability of the tourism sector has grown in importance for many destinations. The World Tourism Organization (2004) proposed 12 baseline issues and indicators to monitor and evaluate sustainability within each destination. Among these indicators, the economic benefits of tourism, energy and carbon management, and water availability and conservation are the three most important components that are closely linked with national and regional tourism sustainability. Although the WTO’s baseline system of indicators was proposed almost a decade ago, the applicability and prominence of these indicators have grown in significance, especially with the current global emphasis on adapting to and mitigating influences of climate change while pursuing economic development through international arrivals and receipts.
The balance between tourism’s economic benefits and its consumption of natural resources is especially critical for the Asia Pacific as this region has experienced strong growth rates of international tourist arrivals of 13%, 6%, and 7% in 2010, 2011, and 2012, respectively. This is roughly double the world average, and international arrivals reached a historic high of 234 million in 2012 (World Tourism Organization 2011, 2012, 2013). Among the eight North Asian destinations covered by the WTO statistics, Taiwan ranked number one in terms of the annual growth rate of inbound arrivals between 2008 and 2012 at around 18%. The inbound visits to Taiwan increased from 3.8 million in 2008 to 4.4 million during the 2009 financial crisis and continued to 7.3 million in 2012. This strong inbound growth is primarily due to the emerging and crisis-resistant Mainland Chinese market (Blanke and Chiesa 2012).
The development of this Chinese market in Taiwan is highly significant; it accounts for the largest inbound visitor numbers in 2012, with rapid growth of an 86% annual rate from 2008 to 2012 for leisure visitors, and contributes high spending per person per trip (Taiwan Tourism Bureau 2012a). While expanding the Chinese inbound market is the long-term goal for Taiwan tourism, environmental resource requirements need to be considered alongside the economic impacts of international tourism receipts. In other words, the policy of whether the Chinese segment is a preferred market and whether it should be expanded needs to be considered from multiple perspectives.
The purpose of this study is to provide an evaluation of the economic impacts, the carbon footprint, and the water footprint of Chinese tourism consumption in Taiwan. Two objectives are proposed here. First, the eco-efficiency of Chinese visitors is compared against four other major source markets for Taiwan: Japan, Hong Kong/Macao, United States, and Malaysia. Eco-efficiency is measured via the per dollar CO2 emission and per dollar water consumption. Such a comparison not only helps to determine the efficiency level for sustaining an additional tourism dollar, it also provides a guideline for prioritizing market segments in the future.
The second objective is to simulate the midrange economic and environmental influences based on the projected number of Chinese tourists to Taiwan in 2016. A Computable General Equilibrium (CGE) model combined with environmental accounts of Taiwan is applied to evaluate the economic and the natural resource impact for the Chinese market by four segments: package tourists (PT), free and independent travel (FIT), business, and visiting friends and relatives (VFR). While many countries want to position themselves as the choice destination for the Mainland Chinese market for purely economic reasons, this study provides a balanced perspective with respect to natural resource use and waste output for sustaining such rapid tourism development.
China Tourism Market in Taiwan
Because of urbanization, rising disposable incomes, and government support for foreign travel, China’s outbound tourism volume has grown vigorously in the past decade. This strong demand for outbound travel, starting from 2000, has grown at an annual average rate of 22.0% and tourists’ expenditures on outbound travel have expanded eightfold (World Tourism Organization 2013). In 2012, China surpassed Germany and the United States by becoming the largest international tourism spending market with a total expenditure of US$102 billion abroad (World Tourism Organization 2013). Because of this strong growth in tourist arrivals and spending power, many of the 104 countries that Chinese residents are currently allowed to visit have targeted marketing activities toward the Chinese and have sought to foster bilateral economic and political cooperation regarding visa applications and border passes (Zhang, Song, and Liu 2010). However, the current travel patterns of China visitors reveal that they predominantly visit neighboring regions and countries. In 2005, the Asia Pacific region accounted for 91% of total Chinese outbound arrivals, most notably, Hong Kong (44%) and Macao (27%), while Europe and Americas only reported 6% and 3%, respectively (Uren 2009). This pattern continued in 2011 as Hong Kong and Macao accounted for 40% and 28% of total outbound Chinese visits, followed by South Korea (3.4%), Taiwan (2.6%), and Malaysia (2.5%) (China Tourism Academy 2012).
Taiwan (Republic of China), being geographically close to and maintaining a similar cultural background with mainland China (the People’s Republic of China), is eager to capture this potential market as well. The initial cross-strait tourism flow from Mainland China to Taiwan occurred at a much slower pace because of political and security considerations (Mainland Affairs Council 2009). Qualified Chinese candidates to Taiwan were differentiated into three groups.11 The majority of Chinese nationals fall into the first category, type 1, and their permission to travel to Taiwan was only granted in 2008, marking the official initiation for large-scale Chinese inbound tourism to this destination.
In Taiwan, the preparatory measures for responding to an influx of tourists from mainland China included a daily visitation quota, limits on the maximum length of stay, and stringent authorization of travel visas (Lin and Lin 2006). Initially, Chinese tourists were required to enter Taiwan on a package tour (PT), where group tours are arranged through a travel agency, with a preapproved itinerary. The FIT format was introduced in 2011. The initial daily quota of PT visitors was set at 3,000 but was raised to 4,000 visitors in January 2011. Similarly, the initial daily quota of FIT visitors was 500 and was raised to 2,000 in August 2013.
The annual Chinese visitor numbers in Taiwan increased from 89,000 visits in 2008 to 2.57 million in 2012; this corresponded with a surge from 360 daily visitors to 5,400 visitors per day in 4.5 years (Taiwan Tourism Bureau 2012a). During the same period, inbound visitors to Taiwan from other major tourist countries, such as Japan, Hong Kong, Macao, Korea, and the USA, reported a small average growth ranging from 0.4% to 11%. By 2010, the Chinese market surpassed Japan, the largest source market for Taiwan in the past 50 years, and currently contributes around one-third of total international visitors to Taiwan.
The arrivals of Chinese visitors rapidly approached the daily maximum quota set by the Taiwan Tourism Bureau (TTB), even after the quota was adjusted upward every year. This pattern demonstrates that the burgeoning demand of Chinese visitors for Taiwan is yet to be satiated. Based on this trend, TTB forecasted that Chinese tourists could reach an ambitious but feasible 4.4 million visits in 2016 or 12,000 persons per day (China Times 2012), if regulations permitted. To accommodate this projected business, Taiwan will relax regulations on FIT and business tourists by lowering the FIT application requirement for personal financial credit, and by granting multiple-entry visas for business tourists. In addition, Chinese nationals are now allowed to enter Taiwan for medical examinations or cosmetic surgery; this furthers Taiwan’s intentions to promote its world-renowned medical procedures toward medical tourism (Hsu, Tsai, and Wu 2009). These policies will gradually lift the stringent regulations on Chinese inbound visits and are predicted to result in a daily Chinese visitor volume of 12,000 tourists by 2016. This increase will expand China’s tourists to 45%–50% of Taiwan’s total annual inbound tourism.
The Carbon Footprint
While the economic bonus from this increase in tourism is enticing, decision makers must also consider the environmental impact. There is a growing recognition that the tourism industry consumes a great amount of energy for transportation, accommodation, and amenities directly serving visitors, in addition to the energy consumption associated with indirect and induced materials and services—a carbon footprint concept (Gossling 2000). In 2008, the WTO-UNEP-WMO published the first estimate of greenhouse gas (GHG) emissions from global tourism in the base year of 2005. Tourism is estimated to account for 26,400 million tons (Mt) of CO2 and to contribute around 5% of total global carbon emissions for international and domestic tourist trips. Since then, GHG estimates for tourism have been studied extensively, including applications at the national level (Becken and Patterson 2006; Dwyer et al. 2010; Patterson and McDonald 2004), at regional scales (Farreny et al. 2011; Kelly and Williams 2007; Konan and Chan 2010; Kuo and Chen 2009; Whittlesea and Owen 2012), targeting a single industry (Becken 2002), and for tourism events (Collins, Jones, and Munday 2009; Hanandeh 2013).
Two general conclusions are drawn from the literature. First, the eco-efficiency of the tourism sector as measured by the total energy consumption or CO2 emission per dollar is generally worse than the national industry average. For example, the CO2 eco-efficiency of the tourism sector in New Zealand ranked 17th out of 25 sectors, where 25th is the worst, or ranked 22nd if including the overseas transportation of international tourists from their origin to New Zealand (Patterson and McDonald 2004). Similarly, the tourism total carbon emissions, including production, private motor vehicle use, and inbound and outbound international aviation, placed Australian tourism as the 5th most GHG emitting sector among 29 sectors in their home economy (Dwyer et al. 2010). These national studies demonstrate that the supply of tourism products and services may incur more environmental burdens than is generally perceived.
Second, as for the components that are closely related to the carbon emissions, Gössling et al. (2005) reviewed several regional and national scenarios of carbon efficiency and concluded that distance traveled and the mode of transport are the two critical factors related to the unfavorable eco-efficiency and to total emissions in tourism. The best example is the long-haul air travel, which is the most problematic of environmental impacts. This can be demonstrated through the WTO-UNEP-WMO (2008) global estimates that long-haul air travel constituted 2.7% of the worldwide tourist trips but contributed 17% to tourism-related CO2 emission in 2005. Overall, air transportation may account for as high as 40% of total tourism carbon emissions globally and, in some instances, is projected to increase to 86% of total emissions for certain countries by 2050 (Dubois and Ceron 2006). To improve the eco-efficiency of travel, several studies have sought to prioritize specific inbound tourism markets, which are those from neighboring countries (short-haul travel) and from visitor segments with extended lengths of stay and higher expenditures per day (Gössling et al. 2005; Peeters, Gossling, and Becken 2006; Dubois and Ceron 2006; Jones 2013).
The Water Footprint
The concept of water footprint has developed at a much slower pace than the carbon footprint has but it is getting more attention because of rising global water usage and inequality of water resource distribution geographically and temporally. The definition of water footprint is “an indicator of freshwater use that looks not only at direct water use of a consumer or producer, but also at the indirect water use” (Hoekstra et al. 2009, p. 8). In Gössling et al.’s (2012) extensive review of tourism and water usages across major countries, they concluded that the direct water usage per tourist per day ranges between 80 and 2,000 liters (L), and the indirect water consumption per day was tripped to 5,500 L. The tremendous indirect water requirement is mainly a result of the production process for food and fuel, each, on average, contributing more than 2,000 L per tourist per day. For food consumption, a greater amount of water is embedded in agricultural irrigation, which accounts for more than 70% of the total water withdrawn and 90% of water consumed (Bates et al. 2008). For energy production, the process requires 18 L of water to produce 1 L of gasoline or 2,500 L of water for 1 L of liquid biofuel. Although tourism’s direct water use is estimated to be less than 1% of global consumption, Gössling et al. (2012) indicated that the indirect water use embodied in each product and service is the key to mapping out the bigger picture of water consumption across industry sectors, including tourism.
Current studies on water use focus mainly on a country or region’s total water consumption pattern differentiated by domestic water intake and water embedded in imported goods (a virtual water concept). Such examples can be found for China (Guan and Hubacek 2007), Spain (Garrido et al. 2010), and Andalusia (Velazquez 2006). However, specific water analysis for tourism development is quite limited. Patterson and McDonald (2004) reported that the water intake of international tourists per trip in New Zealand was around 1,500 L for direct pressures and 17,800 L for indirect pressures. The total water usage of the tourism industry consumed around 2.7% of the national fresh water withdrawals, ranking 14th out of 25 sectors. Hadjikakou, Chenoweth, and Miller (2013) analyzed water use of tourism in the eastern Mediterranean and simulated the global and local pressure of tourism demands on water resources for five specific visitor types. The authors demonstrated that food consumption by tourists is the most significant factor, much more influential than distance traveled and accommodation types, on the overall water footprint at a destination. They recommend that a flight closer to home and a largely vegetarian diet would help to ease the pressure on carbon emission and water resources in the Middle East.
From the above literature, it can be concluded that the carbon footprint of travel is strongly related to the distance traveled and the mode of transport while the water footprint rests mainly on the indirect water use for agricultural supplies on tourists’ menus. To systematically and extensively address the direct and indirect resources used and the pollutants produced of tourism, an environmentally extended input–output (EEIO) framework is adopted in this paper to address the eco-efficiency by visitor segment. Given the current eco-efficiency status and the governmental policy for future Chinese tourists, the Computable General Equilibrium (CGE) model is then employed to calibrate the projected economic impacts, the carbon impact, and the water impact of Chinese tourism in Taiwan for 2016. The carbon and water intensity reflects the relationship of an economic/technical relationship between tourism and resources consumption while the carbon and water impact in 2016 reflects the composition and adjustment of the Taiwan industry sales following a demand shock.
Model and Analysis
Environmentally Extended Input–Output Model (EEIO)
The eco-efficiency of GHG emissions and water use of tourism is determined by the weighted average of various products and services consumed during the trip. We proxy visitors’ energy and water needs by their spending patterns based on the assumption that more money spent on one sector implies more physical quantity is consumed (e.g., longer distance of a taxi ride or more purchased boxes of candy) or choosing a higher level of quality (e.g., five star hotels vs. a budget room). The larger the quantity consumed, the larger the environmental load (energy and water use). Also, the higher quality the service is, generally, the more natural resources are required to provide these luxury experiences per service unit. This is especially the case for the accommodation sector in which energy and water use decreases incrementally from five-star hotels, general hotels, motels, hostels, to campgrounds (Bates et al. 2008; Becken and Patterson 2006; Gössling et al. 2005; Hadjikakou, Chenoweth, and Miller 2013; WTO-UNEP-WMO 2008). Thus, total GHG emissions is calculated by multiplying the industry sector GHG emission intensity (Q) by the trip expenditure in Taiwan by visitor segment on accommodation, food, domestic transportation, shopping, entertainment, and others. This value is then divided by total trip spending to derive the eco-efficiency of GHG emissions. The same process is carried out for calibrating the overall water intensity (R). To address the total effects, the IO multiplier is employed to trace the interindustry relationship, as the following equations:
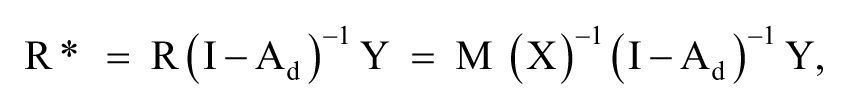
where X = total output
Ad = domestic technical input coefficients
M = flow-in resource matrix, such as water
N = flow-out commodity matrix, such as GHG emission
R = M(X)−1 = the amount of resource required per dollar’s worth of output by industry—the water resource requirement intensity
Q = N(X)−1 = the amount of commodity emitted per dollar’s worth of output by industry—the GHG emission intensity
R* = the total amount of resource required, directly and indirectly, by industry
Q* = the total amount of ecological commodity emitted, directly and indirectly, by industry
This framework allows us to trace the carbon emission and water use associated with direct consumption at the tourism providers, and the indirect effects associated with the supply chains. In this research scope, the carbon emissions and water use regarding the imported products to Taiwan are not included.
To compare the carbon efficiency of air transportation between origin countries and Taiwan, a bottom–up approach is employed by calculating the following two variables: the weighted distance between airports of origin and destinations (O/D), and the emission parameter per passenger per kilometer (pkm). The weighted distance is computed using the flight distance of routine routes between major departure airports of each country and Taipei (the capital of Taiwan), weighted by the total number of seats each route offers (Civil Aeronautics Administration 2012). The emission factors used in this analysis represent the emission performances of Taiwan national airlines (Huang 2011). It is assumed here that international airlines operating between O/D would contain the same emission efficiency as Taiwan-based airlines. Because the air emission quantity is calculated using the bottom–up approach, combining the physical distance traveled and the emission intensity of aircraft, this estimation cannot be fed into the EEIO model directly. Consequently, for air emissions, the indirect carbon impact on suppliers is not available in this approach.
In this study, the GHG emission is reported as CO2e (carbon dioxide equivalent) estimates, which measures the amount of CO2, CH4, and N2O emissions, weighted according to their global warming potential (GWP). This ratio was calculated for 50 input–output industry sectors of Taiwan by first summing the energy uses of coal, petroleum products, natural gases, and electricity, multiplied by the corresponding GHG emissions rate, and then divided by total sales output for each industry. Parameters of energy use, CO2e emissions rate, and input–output sales data were obtained from the Taiwan government statistics in the base year of 2006 (Bureau of Energy 2012; Directorate-General of Budget Accounting and Statistics 2009).
The water consumption intensity data are based on the recent research in Taiwan for measuring the tap water, surface water, and ground water use by industry (Chou 2011). Spending profiles (Y) are analyzed from the annual national inbound visitor surveys of 2009 and 2010, provided by the TTB. For trip expenditures in Taiwan, visitors were asked to itemize their spending by 15 categories, including hotel, food, domestic transportation, entertainment, miscellaneous expenses, and 10 shopping types.
CGE Model and Environmental Accounts
To simulate the midrange economic and environment influences based on the projected Chinese tourists to Taiwan in 2016, a static CGE model is combined with environmental accounts of Taiwan to evaluate the economic contribution and the natural resource requirements for the Chinese market by each of the four segments: package tourists, FIT tourists, business tourists, and VFR. The policy scenario is outlined above with Chinese visitors expected to reach 12,000 persons per day or 4.38 million annual visits in 2016. The 50-sector 2006 Taiwan input–output table was used as the benchmark economy to calibrate the model, which was updated to 2011 prices. The visitor expenditures associated with these additional visitors was augmented into the model to project the economic impact of the additional Chinese tourists. The four visitor segments have been modeled separately to provide a more realistic estimation of future demand as their expenditures and energy and water usage differs. After running the scenarios, the postsimulation output/sales values by sector are estimated and the associated CO2e and water usage figures calculated. These data are reported in the Results section and show the incremental economic output, GHG emissions, and water usage as a result of the additional Chinese visitors by segment estimated using a CGE model.
CGE models have become recognized as the most appropriate way of providing detailed estimates of the effects of a range of actual or possible tourism-related events on economies, both at the macroeconomic level and on a sector-by-sector basis (Blake et al. 2004; Dwyer, Forsyth, and Spurr 2004, 2006). A CGE model takes into account not only the structural effects like an input–output model does but also price transmission mechanisms that show how changes in prices affect sales (Yeoman et al. 2007). Further, CGE models can allows for capacity constraints. This is important when considering large increases in visitor arrivals. CGE scenario models have been used to examine a wide range of issues relating to tourism, from mega-events (Li, Blake, and Thomas 2013) to disasters, such as the September 11 terrorists attacks (Blake and Sinclair 2003) and the UK’s foot and mouth disease outbreak (Blake, Sinclair, and Sugiyarto 2001). More recently, CGE scenario models have been used to link events to the impact on the environment. Dwyer et al. (2013) used a CGE model to estimate the economic impact of a carbon tax on Australian tourism, finding that the tax is projected to lead to changes in key macroeconomic variables.
The tourism-augmented CGE model used in this analysis is a relatively standard CGE model, with the general modeling approach being described elsewhere in the tourism literature (Blake 2000; Pratt 2012). The model follows the interactions and relationships of an open market economy. It solves for a set of prices including production prices, factor prices and exchange rates, and levels of production that clear all markets. It can consider the direct economic effects of policy initiatives as well as the feedback effects between different economic agents such as industries, households, and government and production factors (Li, Blake, and Cooper 2010; Pratt 2011).
The CGE model replicates the workings of the circular flow of income and has microeconomic theoretical underpinning. Taiwanese households derive utility from tourists’ consumption of goods and services. Expenditures are allocated by minimizing costs subject to the preferences for the different goods and services. Taiwanese households are endowed with labor and capital. Both factors are in inelastic supply and fully employed. Similarly, Chinese tourists are assumed to maximize their tourist consumption subject to their budget constraints. Taiwanese firms are assumed to maximize their profits/minimize their costs subject to the prevailing technologies. The production of goods and services is divided into 50 sectors. Each sector produces two varieties of output: one for domestic markets and one for world markets. Goods and services are produced combining labor and capital and intermediate inputs. Labor and capital are perfectly mobile across all domestic sectors of production but not mobile to other economies.
Production technologies are characterized by constant-returns-to-scale and all markets are perfectly competitive. The model represents a small open economy, so world market prices are exogenous. The schedules for export demand and import supply are thus horizontal. Imports are paid for with foreign exchange. The imported and domestic varieties within a given sector are perceived as imperfect substitutes (the so-called Armington assumption). Investment demand and government demand for goods and services are assumed to be exogenous. Similarly, the balance of payments in relation to the rest of the world is also assumed to be exogenous. In a CGE model, prices are normalized so only relative prices matter and there is no money illusion.
Results
Eco-efficiency of Visitors from China and Other Major Inbound Markets
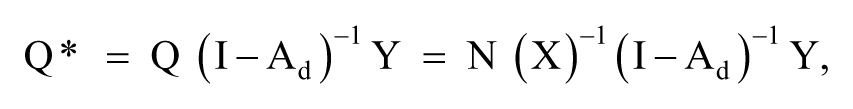
Among five inbound source markets, Chinese visitors are one of the top spenders in Taiwan, averaging around US$260 (not including international airfare) per person per day or US$2050 per trip, only after the U.S. segment (Table 1). In terms of spending patterns, Chinese visitors report a greater proportion of their budget on shopping (57%), much higher than visitors from Malaysia (32%), Hong Kong/Macao (28%), and Japan (22%). This shopping spree phenomenon is consistent with observations from Chinese visits to Australia (Wang and Davidson 2010), United States (Jang, Yu, and Pearson 2003), and Hong Kong (Huang and Hsu 2005). Within the shopping component, Chinese visitors spent around 15% of the overall trip expenditure on “featured food, special products and tea” and 10% on “jewelry or jade.” In comparison, U.S. visitors spent two-thirds of their expenses on the lodging (65%) but were quite limited in other categories. This is in part due to a very high proportion of U.S. business and VFR tourists in Taiwan, so their itinerary either involves more with business activities or their local expenses have been covered by friends and relatives (Taiwan Tourism Bureau 2012b).
The Spending Profiles, and the Direct and Indirect Effects of Five Major Inbound Markets in Taiwan, 2011.
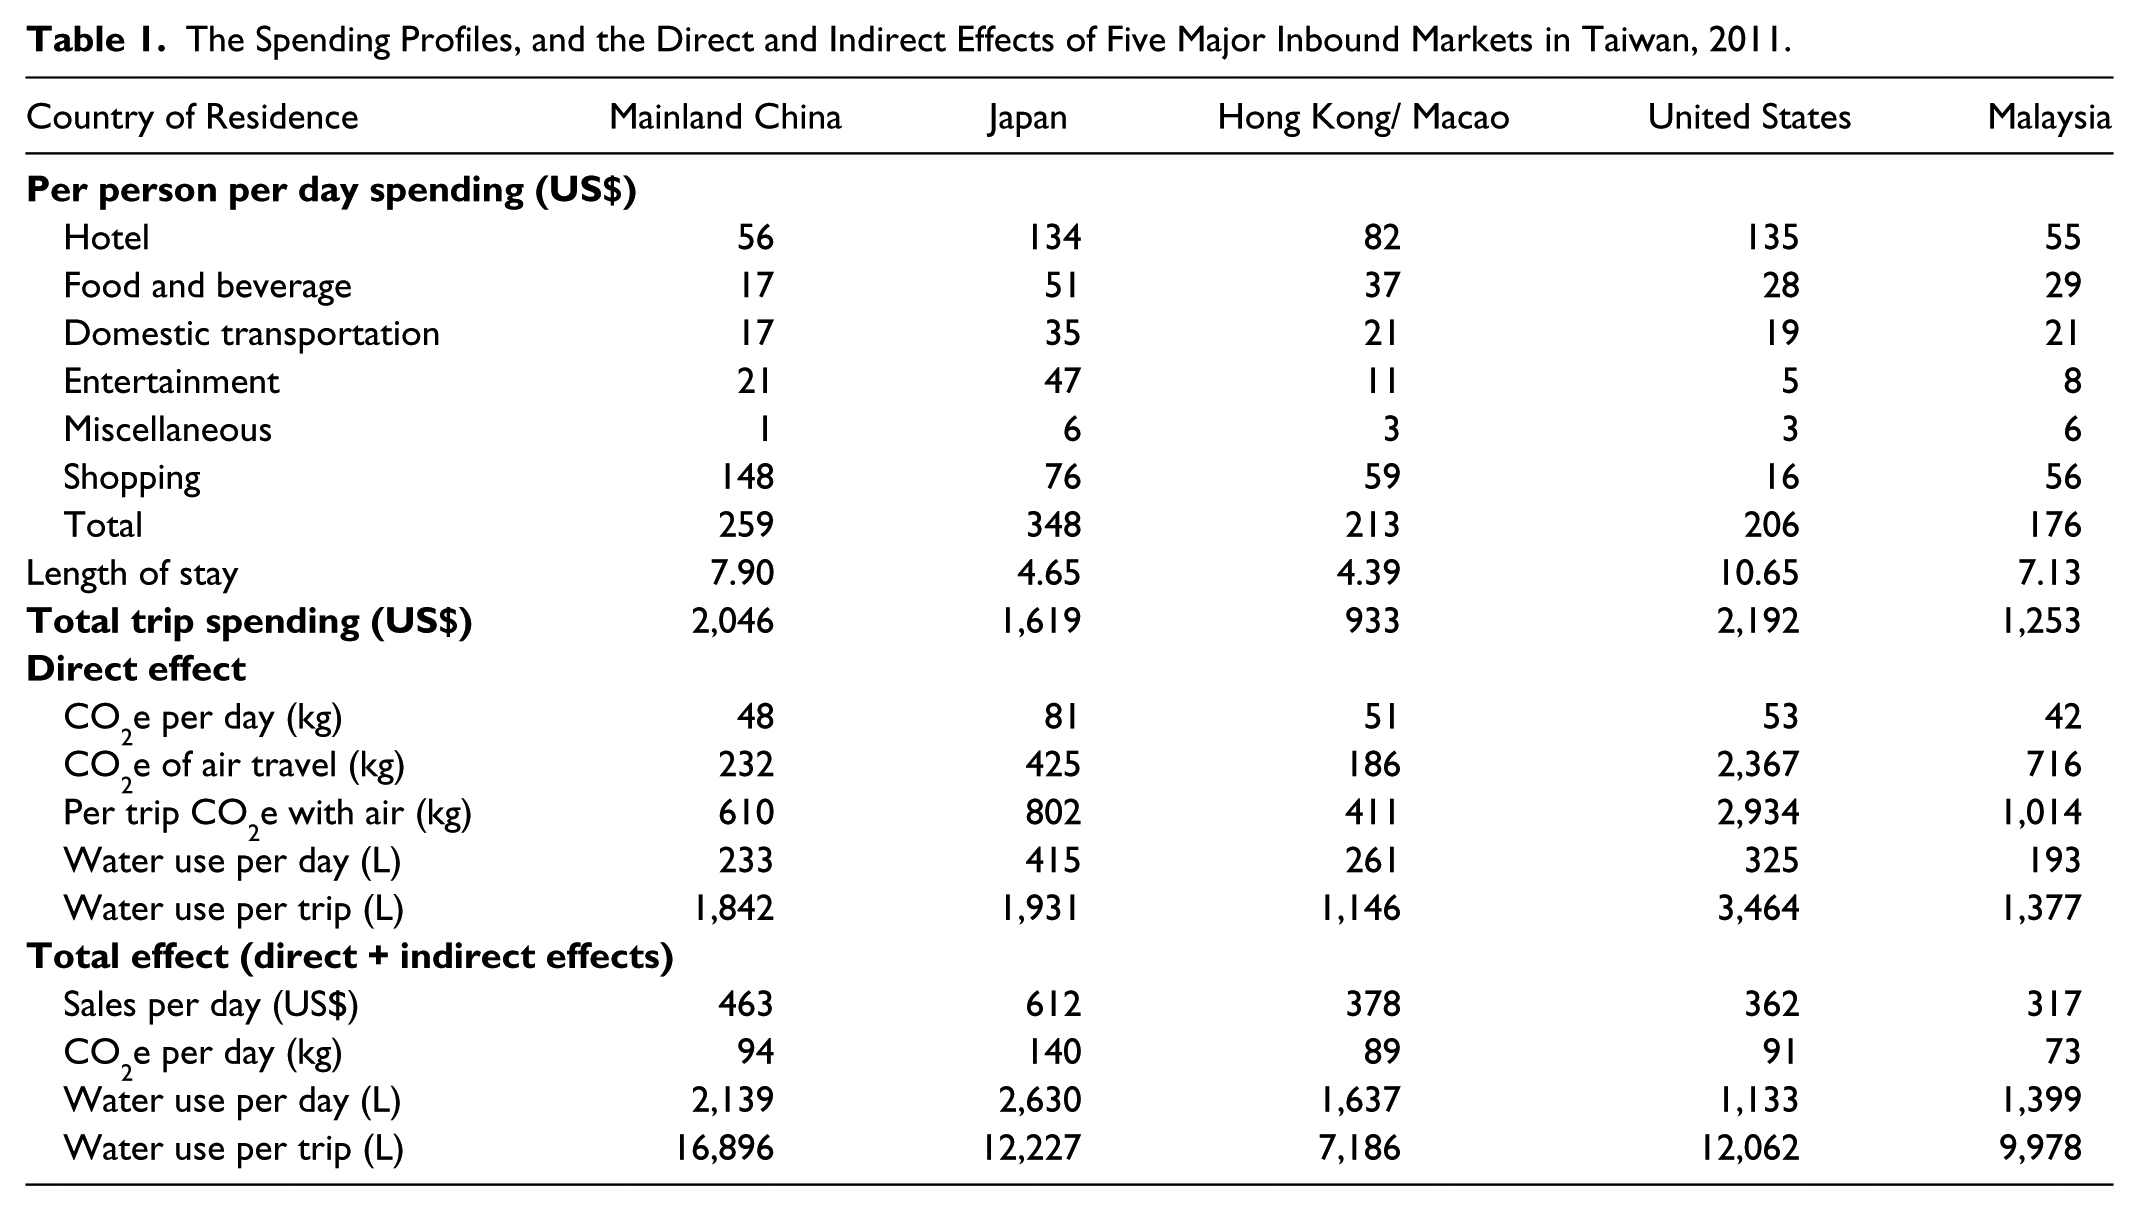
The local CO2e emission caused by Chinese visitors is estimated to be 48 kg per visitor per day. This is calibrated by multiplying Chinese visitors’ spending on different sectors in Taiwan with its corresponding CO2e intensity. The emissions of the round-trip air transportation between Taipei and major airports from the origins are displayed in Table 2. Because of its geographic proximity, round-trip air transportation from China to Taiwan produces 232 kg GHG per person, respectively. This value is half of the emissions for trips from Japan, one-third of the value from Malaysia, and one-tenth from the United States. The per trip CO2e for Chinese visitors is estimated to be 377 kg locally or 610 kg if including the round-trip air transportation from O/D. When considering total trip expenditures, Chinese visitors spend 7% less than U.S. visitors, but they generate 80% less CO2e emissions (including round-trip air). Similarly, visitors from Hong Kong/Macao reported 33% less GHG emissions per trip than the Chinese segment but their economic contribution to Taiwan per person is 54% less.
CO2 Emission for Flights between Taipei and Major Inbound Countries.
Computed based on routine flights between 34 airports in China and Taipei.
Computed based on routine flights between 9 airports in Japan and Taipei.
Computed based on routine flights between Seattle, Los Angeles, San Francisco, New York and Taipei.
Computed based on routine flights between Kuala Lumpur and Taipei.
The direct water use for Chinese visitors is estimated to be 230 L per day or 1,800 L per trip. Forty-six percent of water is used by the accommodations sector, followed by 17% in “other products,” and 14% in “food and beverage.” After considering the indirect water use, the water consumption increases astonishingly, amounting to 2,000 L per day or 17,000 L per trip, of which 77% is associated with the agriculture sector.
The eco-efficiency of Chinese visitors on both CO2e and water use in Taiwan is superior to the other four major markets, except for total water use intensity (Table 3). For direct and total CO2e intensity per dollar, Chinese visitors are around 21% and 10% more efficient than the second-best performing market. For the direct water use intensity, Chinese visitors also ranked number 1, 32% more efficient than their counterparts. However, after taking into account the indirect water use, Chinese visitors become water-intensive users, requiring 8.26 L of water per dollar, the worst among all five inbound markets.
The Eco-Efficiency of Carbon and Water for Five Major Inbound Markets to Taiwan, 2011.
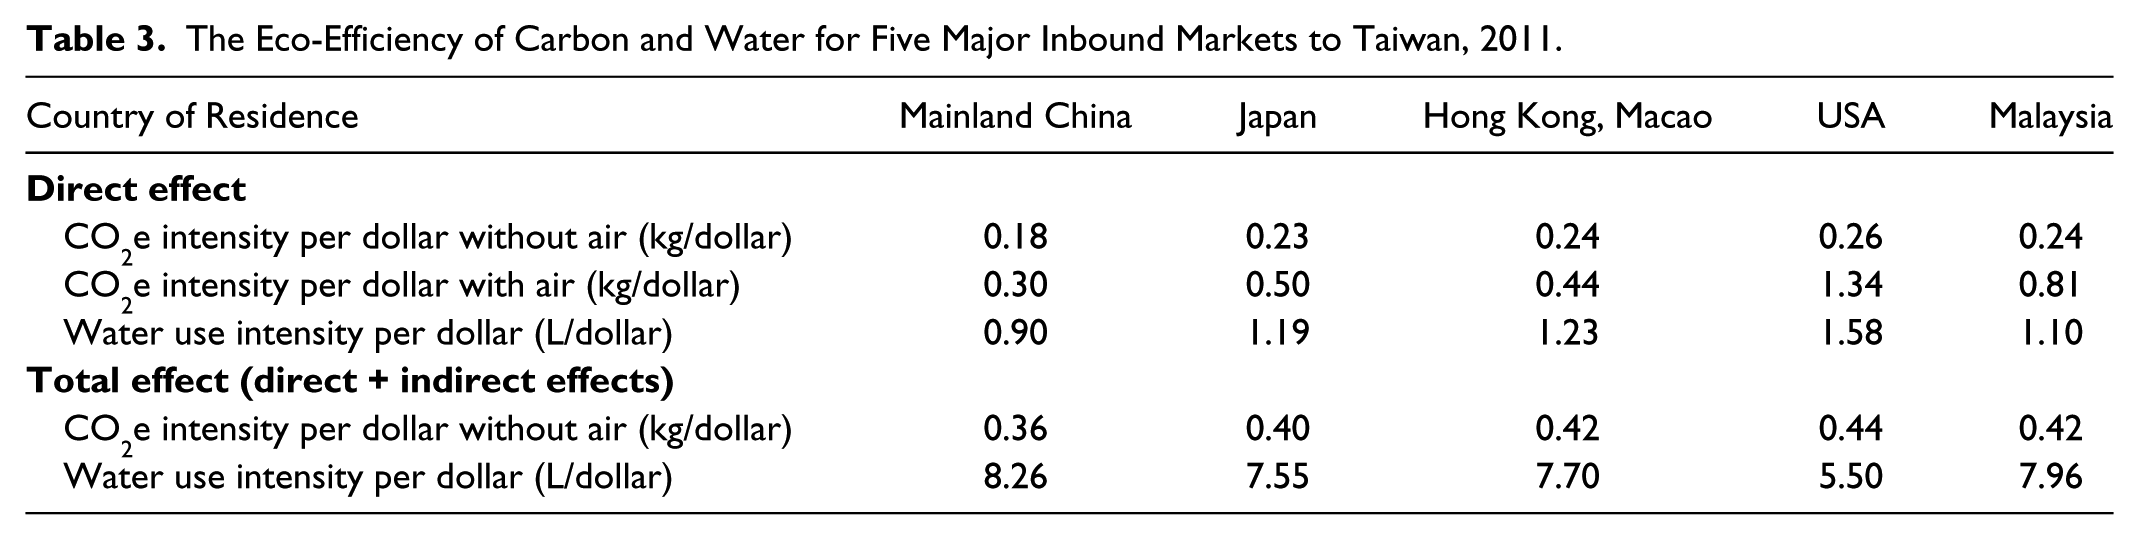
In conclusion, in terms of economic importance, Chinese visitors ranked the first or second of the five major source markets, much higher than residents from Japan, Hong Kong/Macao, and Malaysia. From an environmental perspective, Chinese visitors are more efficient on the carbon and water pressure per dollar. However, this market is inefficient in terms of its total water usage, making the water footprint per trip 50% higher than the best-performing market, the U.S. visitor.
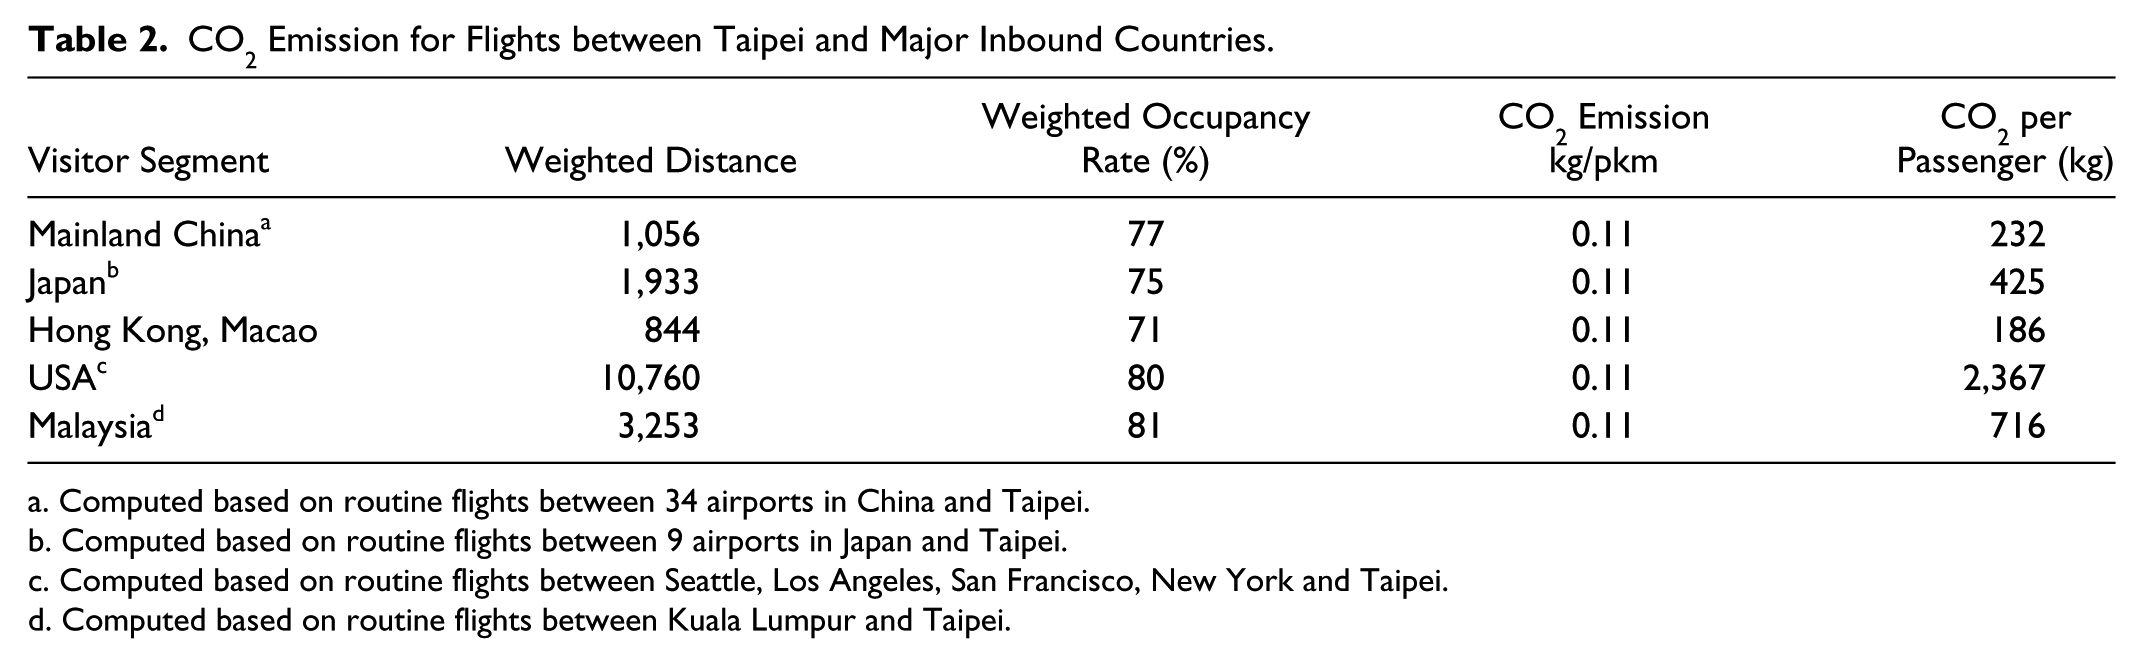
Economic, Carbon, and Water Impacts of Chinese Visitors to Taiwan in 2016
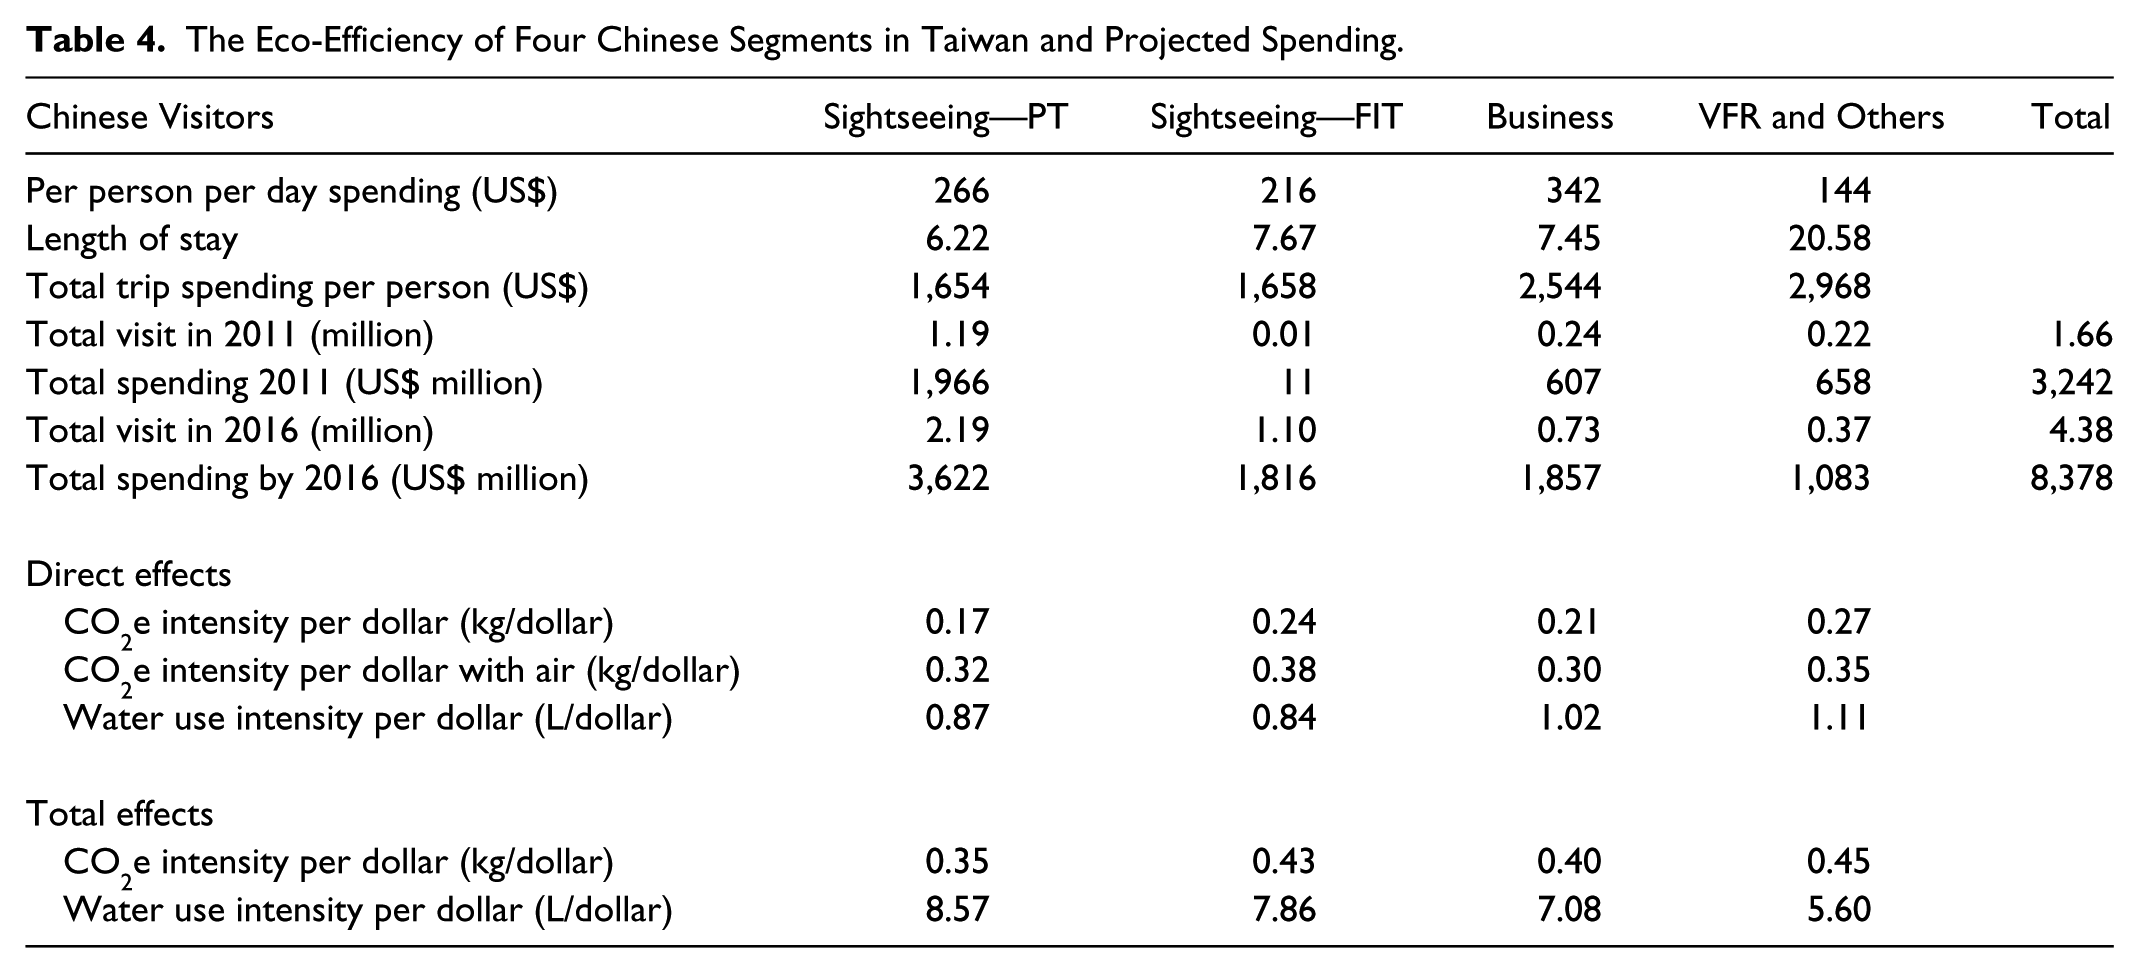
The 2016 scenario for the Chinese market in Taiwan is based on the following projections: daily volume of 6,000 PT, 3,000 FIT, 2,000 business, and 1,000 VFR travelers. Apart from the volume increase from the current level of 1.66 million to 4.38 million, the composition of Chinese visitors is expected to change because the Taiwan Tourism Bureau intends to encourage the subsegment of FIT and business tourists. Based on the government objectives, the FIT group is projected to account for 22% of total Chinese visits while the PT group will shrink from its current share of 61% to 43% in 2016. The projected volume is expected to contribute US$8,378 million in Taiwan (Table 4). Among these four segments, VFR is the group with the highest yield on the total trip expenditure in Taiwan while package tourist (PT) is the most efficient segment on CO2e emissions and water use per dollar in direct effect. The only area where the package tourists’ (PT) performance was unsatisfactory is the water footprint per dollar because of their high spending on food-related souvenirs.
The Eco-Efficiency of Four Chinese Segments in Taiwan and Projected Spending.
The results from the CGE analysis show that an increase in Chinese visitors to Taiwan is overall beneficial to the economy: the Taiwanese household’s welfare would increase by US$145.1 million (0.06%); the Taiwanese household’s consumption would increase by US$160.7 million (0.07%), and their investment would increase by US$64.0 million (0.07%) (Table 5). Output is estimated to increase by US$8,706.8 million or 0.8% from 2011 to 2016 as a result of the increase in Chinese visitors with corresponding CO2e emissions estimated to increase by 6 million tons, or an additional 2.7% over 2011 figures. The Chinese visitors are estimated to use an additional 591 million tons of water (3.0%).
The Simulation Results for Economic, CO2e, and Water Impact in 2016 for Taiwan.
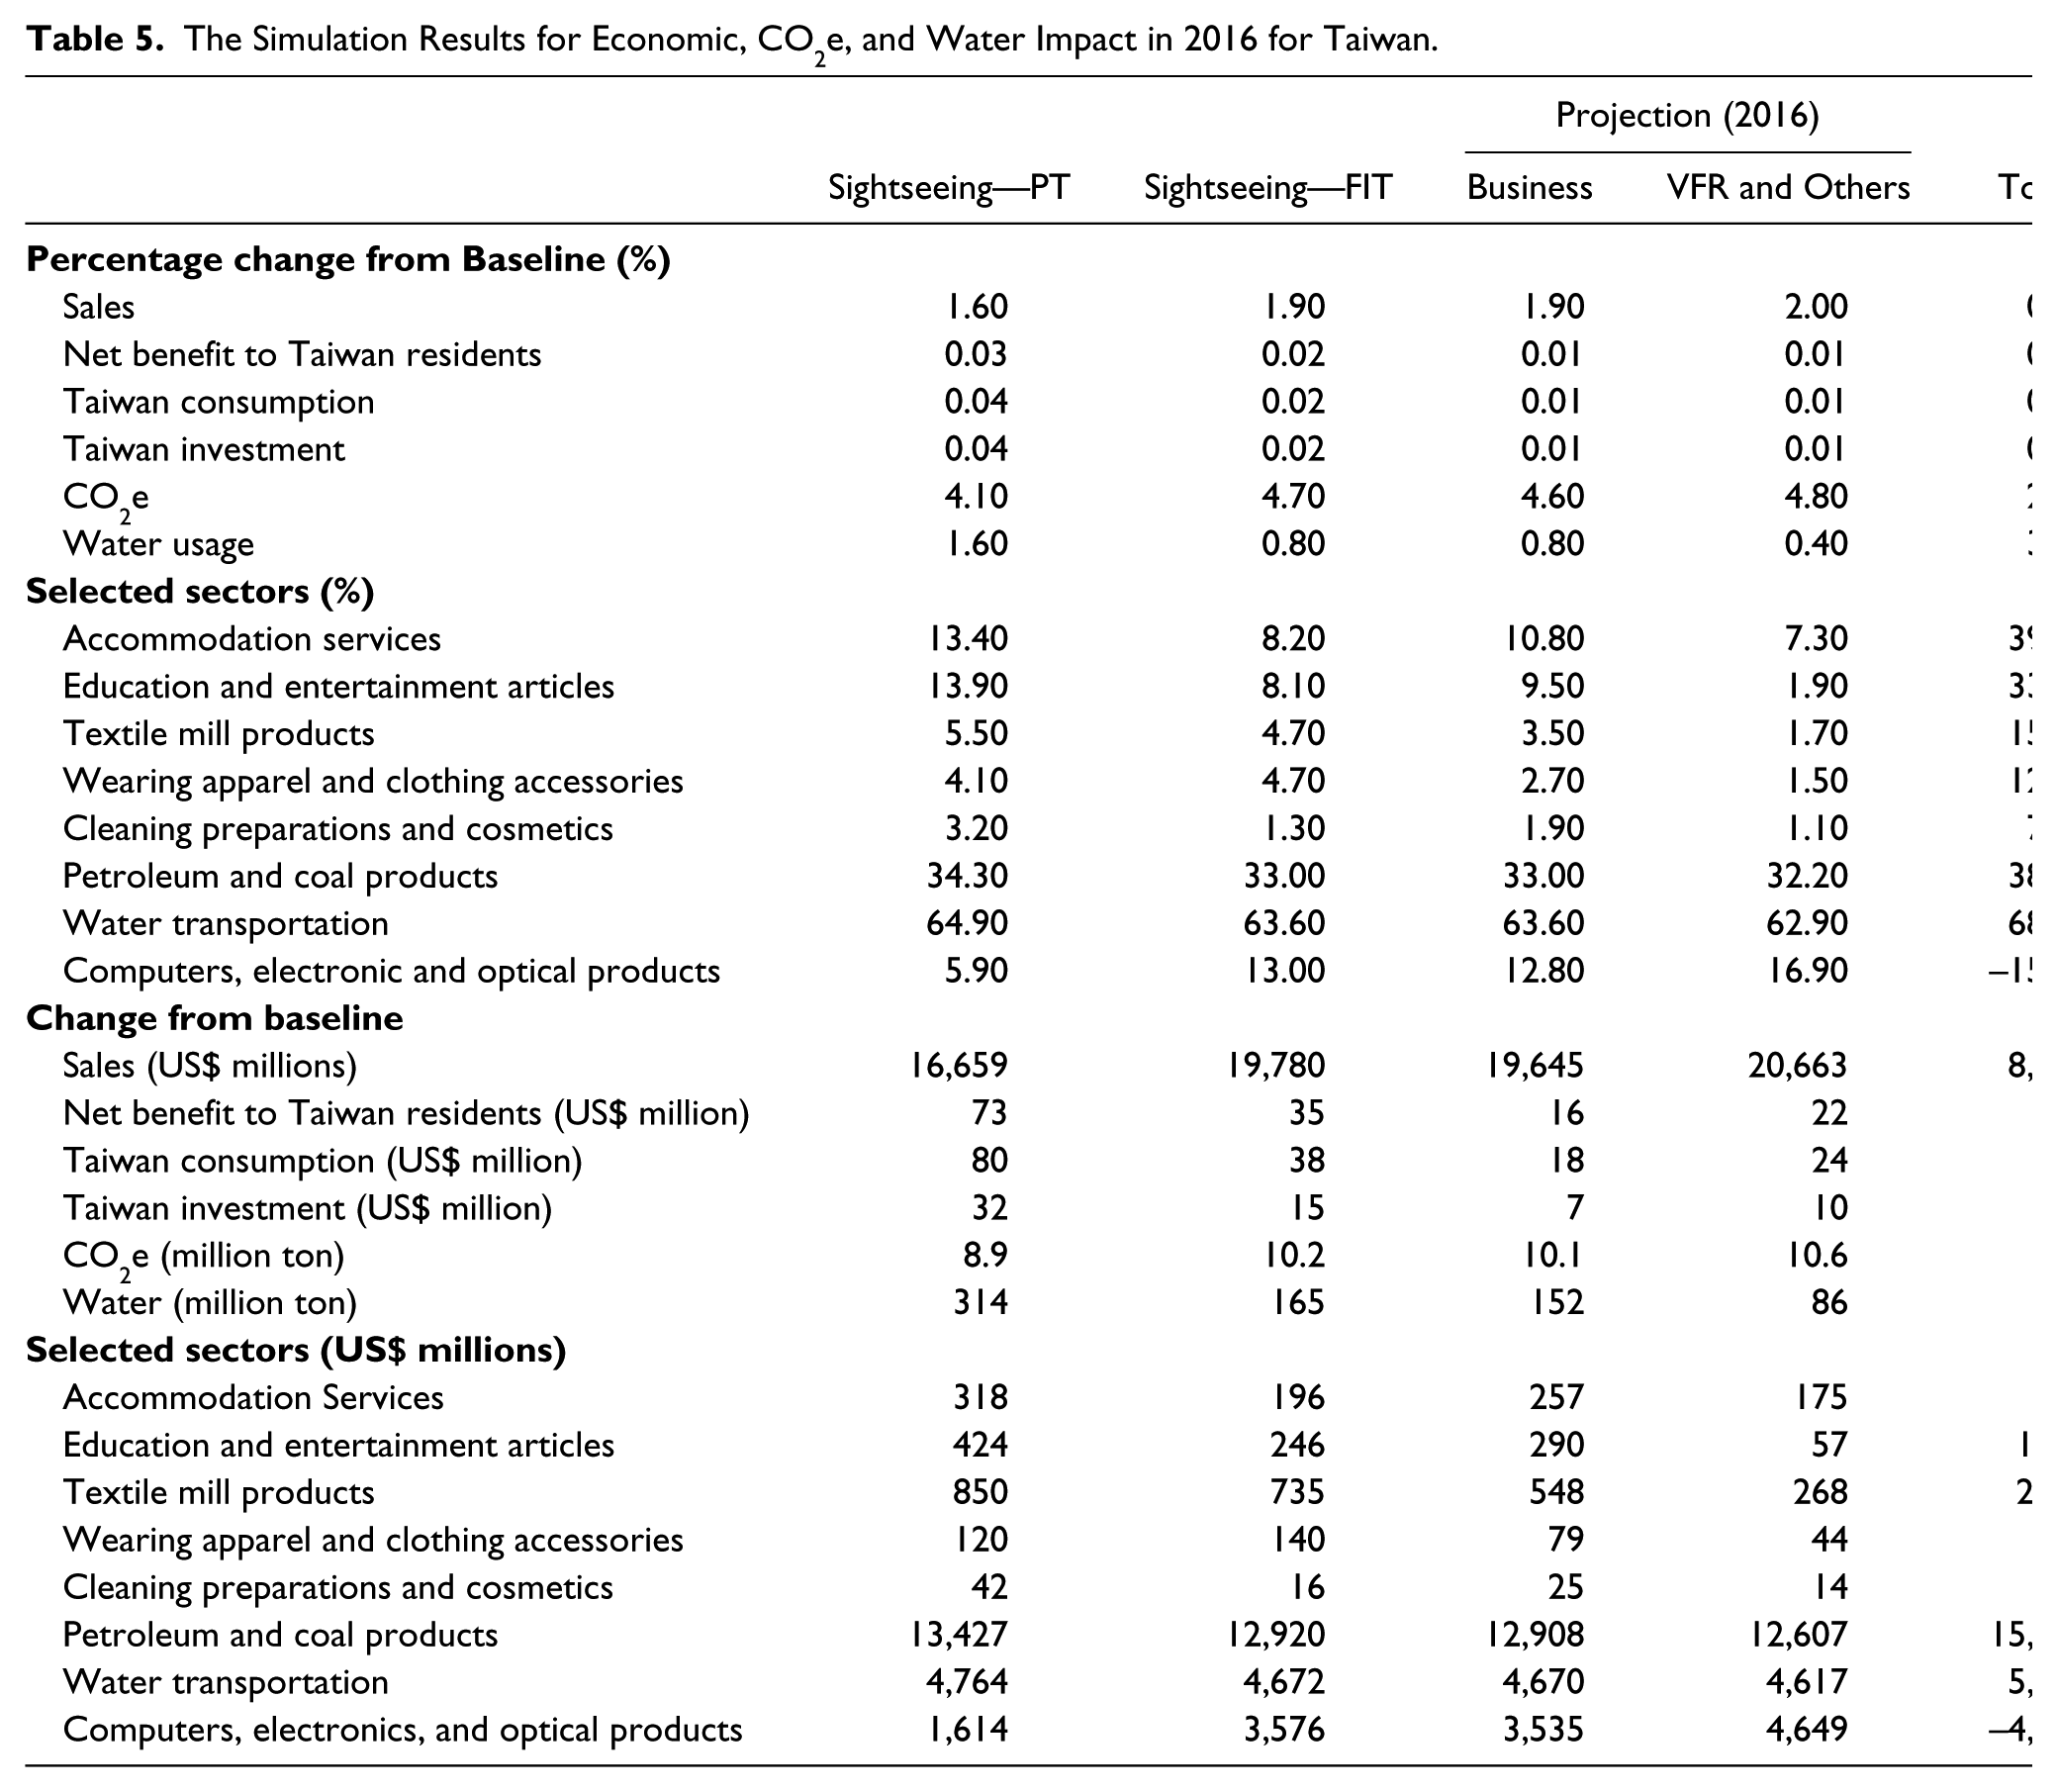
As also found in other tourism studies (Adams and Parmenter 1995; Blake 2000; Pratt and Blake 2009), there are important distributional impacts as a result of a large influx in tourism arrivals. The increase in tourism demand leads to an appreciation in the exchange rate, which leads to import substitution and the contraction of the traditional export sectors. Not surprisingly, the increase in tourism demand expands the tourism-oriented sectors as the increases in prices attract resources (capital and labor) to these sectors. The accommodation services sector (+40%) and the education and entertainment articles sector (+33%) as well as the industries supplying souvenirs such as the textile mill products (+15%), wearing apparel and clothing accessories (+13%), and cleaning preparations and cosmetics (+7%) experience increases in output and hence GHG emissions and water usage. Further, the sectors that will experience the largest growth due to an increase in tourists are not the most resource intensive.
Other sectors to experience large increases in output and hence GHG emissions and water usage are the petroleum and coal products sector (+39%) and the water transportation sector (69%). The expansion of the petroleum and coal sector is a response to the increasing energy demands of the additional Chinese visitors while the large percentage increase in the water transportation sector is more related to the relatively low base from which the percentage is calculated and reflects a lower importance of the sector to the overall economy. With the increase in Chinese tourist arrivals, the water transportation sector will still comprise only 1.2% of total economic output.
An interesting finding occurs with the computers, electronics, and optical products sector. Taiwan exports more than 70% of its production in this sector. In considering the economic impact of each visitor segment, this sector is expected to expand. For example, for the increase in VFR visitors, output is expected to increase by 17% in this sector as tourists and tourism-related businesses demand more computers and electronic goods. This increase in demand falls to 13% for both the business and FIT tourists segments and to 6% for the PT tourists segment. However, in estimating the total impact of 12,000 additional visitors per day in 2016, the large increase in visitor arrivals in this scenario results in this sector being “crowded out” by increases in other sectors. This, coupled with an expected appreciation in the Taiwanese dollar, means that Taiwanese computers and electrical goods become more expensive on the world market. The overall effect is a contraction of this sector with a high export component. This nonlinear nature of CGE models is able to take into account supply constraints and factor in the competition for limited resources.
Discussion
From the economic and eco-efficiency perspective, Chinese visitors are the top 1 or 2 spenders22 on trip expenditures (excluding international airfares) and ranked number one on the direct carbon efficiency and water efficiency, around 20% and 30% better than their counterparts, respectively. Based on these perspectives, overall, the Chinese segment contributes to a larger economic impact with a lower environmental burden, making it a preferable segment to expand when developing inbound tourism is placed as a priority for the country.
Carbon Emissions
These desirable characteristics of Chinese visitors to Taiwan are a result of their consumption preferences, longer length of stay, and geographic proximity between the two regions. This observation echoes previous literature that nations have to prioritize tourist markets from their neighboring regions, encourage visitors to stay extended periods of time, and to provide competitive services and products to entice higher spending (Peeters and Schouten 2006; Gössling et al. 2005). In practice, longer length of stay and geographic proximity tend to conflict as there is generally a positive correlation between distance traveled and length of stay for international tourism (Mckercher and Lew 2003). Targeting nearby destinations thus inevitably leads to a shorter stay, which will intensify the carbon emission volume per dollar in transportation, especially for island destinations where air travel is a necessity.
Chinese visitors to Taiwan however are characterized by both higher spending per trip as well as longer lengths of stay for a short-distance international travel, making this phenomenon unique when compared to other tourism literature. These characteristics are mainly a result of highly specialized tourism policies toward Chinese visitors. The incentive of package tours, the eligibility of travel visas, and the inbound quotas not only regulate the Chinese visitor volume but also influence their travel patterns to selected itineraries (Sun, Sun, and Yu 2011). The typical arrangement involves an islandwide tour, which predominantly consists of cheap and small accommodations, budget restaurants, multiple stops at local souvenir stores, and using coaches as major local transportation vehicles. Not consuming high-end accommodations, restaurants, taxi, car rental, or domestic air transportation avoids energy-intensive and water-dependent services. In addition, the operation of package tours ensures most Chinese visitors stay at least 7 to 8 days in Taiwan, double the length of time than a typical FIT visitor from Japan or Hong Kong/Macao. Combining the policy context and its proximity to Taiwan makes the Chinese market very competitive in terms of air carbon emissions per day, leading to a high spending but low carbon intensity performance.
Looking to the future, the current environmentally efficient characteristics of the Chinese tourists are expected to wane because of product diversification and repositioning as the propensity to consume luxury goods and services will increase while their average length of stay will shorten. With an intended policy to develop Chinese FIT, medical tourists, and business travelers while shrinking the market of discounted package tours, the share of high-end services, taxi, and car rental is expected to rise in their spending profiles. This type of tourism generally consumes more energy per unit (Becken, Frampton, and Simmons 2001), and the above-mentioned transportation types are 25% to 75% more energy-intensive per person-kilometer than coach (Huang 2011). Further, the Taiwan Tourism Bureau intends to encourage high-quality package tour itineraries which stay at star-credited hotels, involve fewer mandatory shopping stops, and offer diversified dining and recreational opportunities. In sum, Taiwan’s policy is gradually directing visitors to purchase a basket of goods and services that is more energy-intensive in the future.
Water Consumption
The total water footprint of the Chinese tourist market, including both direct and indirect water usage, is environmentally unsatisfactory, consuming 30% more than their counterparts. This pattern is mainly due to their high spending on food-related souvenirs, such as pineapple cake, pastries, and Chinese teas, leading to a large water footprint embedded from the farming process. The question in response to this issue is whether such a water footprint would create a significant burden for Taiwan businesses and residents. To answer, the distribution of water supply temporally and geographically has to be considered first (Gössling et al. 2012).
From a temporal perspective, Taiwan currently has sufficient water supply year round from surface and ground water (Water Resources Agency 2012). If water mitigation practices are deemed necessary, the water supply for households and service sectors are the first priority, ensuring travel-related amenities will be maintained. Geographically, the only areas in Taiwan facing constant water shortage and poor water quality are the small offshore islands, requiring fresh water brought by tanker ships. The current travel pattern of Chinese visitors is limited to mainland Taiwan, where the direct water requirement is considered to be minimal with respect to the national overall water capacity.
For the indirect water requirement, solutions to temporal and spatial concerns about food-related products, which have vast water requirements, can also be found. Food processing and manufacturing firms have the ability to store products by halting the manufacturing process in response to the availability of water sources. Agricultural products can be harvested, stored, and shipped to regions that face constant water scarcity, the concept of virtual water, by allowing agricultural products from different regions to supplement each other. Using this supply network, the manufacture of good quality and sufficient quantity of food-related souvenirs will not create a localized water burden, even for arid regions.
In terms of future research, the issue of shopping sprees among Chinese visitors and a possible larger water footprint at destinations deserves further attention. Previous literature focuses on the water use patterns originating from accommodation, restaurants, and recreational activities (Gössling et al. 2012; Hadjikakou, Chenoweth, and Miller 2013), but ignores the water use associated with manufactured goods that are typically purchased by visitors. Although substituting imported products for domestic materials can relieve the local water burden, the leakage effect will also siphon away the economic benefits generated for the region. This trade-off of maintaining a balance between water usage and economic contribution becomes more critical for tourists receiving destinations, especially for arid areas.
Policy Implication
The economic development of Taiwan has experienced a stagnation period from 2008 to 2011, averaging around 2.3% growth rate in GDP annually, much slower than the development of Hong Kong, Singapore, and South Korea, the so-called Four Asian Dragons (National Statistics 2013). Contrary to the stagnated economy, the emerging Chinese market helped to raise the tourism foreign receipts to Taiwan from US$5.9 billion in 2008 to US$11.1 billion in 2011, supporting a 16.8% annual growth rate (Taiwan Tourism Bureau 2012b). The economic contribution of the Chinese market is particularly significant when compared with other slow-growing source markets. Because of Chinese tourists’ preference for Asian destinations with similar cultural and linguistic backgrounds, the inflow of Chinese visitors to Taiwan over the next five years is expected to remain strong. Nevertheless, overdependency on any one particular market segment might raise some concerns. Chinese nationals are projected to account for 50% of total inbound visitors and to exceed 60% of international tourism receipts for Taiwan in 2016. With the exception of Hong Kong and Macao, Taiwan is the most dependent country on China’s outbound tourism in terms of market share, which subsequently creates concern for market diversification. In light of foreseeable strong demand and the desire for increased economic injection, the overdependence on the China market seems unavoidable at present.
It should be noted that although the Chinese inbound market is more environmentally friendly than other foreign visitors, its carbon efficiency is worse than the national carbon emission per dollar output across all sectors. In addition, the total carbon footprint of Chinese tourism is expected to grow more than 10% annually because of strong demand, large volume, and the potential to purchase more high-end services. From the legislative viewpoint, the development of the Chinese tourism market may become more critical under the framework of Taiwan “GHG Reduction Act,” initiated in 2008 (Bureau of Energy 2012). Although Taiwan is not an official signatory to the Kyoto Protocol, the country is determined to mitigate its GHG emissions with the following objectives: reduce the 2020 total GHG emissions to the level of 2008 and to further decrease GHG emission to the 2000 level by 2025. Based on the projected growth of the Chinese market, the total tourism carbon footprint poses a challenge to the national carbon reduction target. The trade-off between economic yield versus environmental burden, not only for the expansion of the Chinese tourism market, but also for the overall development of tourism activities will continue to present a political and managerial dilemma.
Final Reflection
For futures research (projecting trends and behaviors), a consistent effort is made to discern (1) what kind of future, (2) what kind of signals are being considered, and (3) what are the various ways of connecting and making sense of these features (Miller, Rossel, and Jorgensen 2012, p. 197). In this study, using scenario analysis with a CGE model helps to identify possible outcomes in a midrange time period given a feasible and ambitious tourism objective on an island economy. This “strategic discontinuity” reflects not only a moderate departure by relaxing the Chinese visitor inbound quota but is also consistent with the extrapolation based on their past visitation pattern. Forecasting techniques, such as CGE models, can anticipate these discontinuities and be used to examine the consequences of this opportunity (Holopainen and Toivonen 2012).
From the simulated results of this study, economic changes among industries resulting from Chinese tourists’ consumption can be perceived as “strong signals” or “trends,” based on Ansoff’s terminology (Ansoff 1975). Ansoff defines “trends” as an expected and easily recognized phenomenon from the general public as well as with a high probability to be realized. The carbon emission and water consumption, on the other hand, fall between “strong signals” and “weak signals” on several perspectives: they are generally ignored by tourism industries, infrequently discussed among tourists, and hardly incorporated into the national tourism policies for mitigation purposes, although these figures are based on hard evidences (Holopainen and Toivonen 2012; Mendonça, Cardoso, and Caraça 2012). Of the two natural environmental attributes, we argue that it is more challenging to prompt action for the carbon emissions associated with the expanding Chinese tourism. This is due to the blurred responsibility of production and consumption in energy uses, the inefficient emission trading system, and the rigidity of mindsets and political filters (Meltzer 2012). Few viable alternatives are effective for changing the courses of action regarding the volume of carbon footprint for a fast-developing tourism pattern, especially for an island economy where aviation is a necessity.
Based on Bergman’s (Bergman, Karlsson, & Axelsson, 2010) typology of forecasts, this study makes a “prognosis”; that is, it makes truth claims and but does not make explanatory claims. This future event is burdened with uncertainty—about the preferences of Chinese tourists, the geopolitical climate of the region, the socioeconomic environment of both China and Taiwan, the global financial situation, and a myriad of other unknown events. As noted by Bergman et al. (2010), it is not whether the forecasts are good or bad but whether they are good enough. We believe they are good enough for Taiwan policy makers to plan for these increases because the visitor segment increment is closely linked with national policies, and the parameters of spending, energy intensity, and water intensity are stable and critically generated. Researchers could make more or less qualified assumptions or claims about society and social patterns but can never claim that a forecast is the way it will actually be. Even if we accept the economists’ mantra of others being equal (ceteris paribus), we can still say that this is a way to artificially close an open social system. Society is not a laboratory; that is, multiple variables can be controlled for only be done statistically. Forecasts should be seen as a means more than an end (Bergman et al. 2010).
Conclusion
The assessment of current status and future development is a core issue of tourism sustainability. This study first compares several tourism markets on their economic and environmental performance (GHG emissions and water usage) using the environmentally extended input–output model. Policy factors that attempt to balance the economic injection, carbon emissions, and water consumption under the China–Taiwan context are provided. The study then extrapolates this trend from the projected volume of Chinese visitors to Taiwan to the year 2016, using a CGE model to estimate the economic and environmental impact of additional Chinese visitors.
This study first contributes to the literature by examining the trade-off of the Chinese outbound segments using both economic and multiple environmental measures in the case of rapid tourism development. For countries seeking to ‘court’ the China market, it should be noted that the carbon efficiency of the inbound Chinese visitor consumption generally is higher than the national average carbon emissions per dollar output. From a national development perspective, this will present a dilemma for destinations that seek to achieve their carbon mitigation targets when receiving a large and fast-expanding volume of Chinese arrivals.
Over time, the average carbon efficiency per Chinese tourist is expected to rise because of the expansion of mid- and long-haul travel as well as the product diversification of high-end services and amenities. Based on Burton’s four phases of tourism participation (1995), which depicts the relationship between economic development and travel patterns, China is currently defined as a Phase Two country, one that is industrializing fast along with a rapid growth of urbanization and expansion of the middle class (Li et al. 2010). With China’s economic progress expected to continue, the demand for large-scale short-haul international travel will occur first and remain strong, followed by cross-continental travel. The current ratio between aviation carbon emission and local carbon emission for Chinese visitors to Taiwan is around 1:2. The first component of this ratio will increase substantially for destinations that are located farther than the distance between Taiwan and China and for those with no substitution for aviation in transportation. The overall China outbound tourism is expected to contribute to a fast-rising aviation GHG in the future.
The second contribution of this study is it provides an analytical framework that takes into account multiple criteria—economic significance, carbon emissions, and water consumption—for examining the performance of international markets based on nationality for their direct and indirect influences at destinations. The framework model can be further extended to address additional environmental variables, such as water discharge, garbage, or land use (Lundie, Dwyer, and Forsyth 2007). This type of analysis not only helps to identify markets that are more profitable and environmentally sustainable but helps to put market development and destination marketing into perspective.
When using multiple criteria to prioritize visitor markets, several considerations arise: (1) the number and types of endogenous criteria that are considered in the model; (2) the measurement attributes that are used to rank the markets; (3) the relative importance of each criterion based on collective opinions; and (4) the achievement function to maximize or minimize specific outcomes. While the economic impact is generally measured by sales, the scope of environmental criteria (variables) is more complex. For example, Patterson and McDonald’s research (2004) on the environmental impacts of New Zealand tourism evaluation included up to eight indicators.33 Such assessments are needed to provide a comprehensive baseline; however, using this information to rank tourism against other sectors presents a real challenge in applicability.
One critical issue with ranking is the incomparability in measurement units: money spent versus tons of carbon emitted versus liters of water consumed. In addition, rankings are concerned with “measurement attribute,” “weight,” and “the achievement function” (Wierzbicki 2010). Measurement attribute refers to the boundary where the criterion is assessed. For example, carbon emission can be compared for different markets based on either direct effect or total effects, by whether air emissions are included or excluded, or whether the eco-efficiency or total pressure is considered. Choosing one single criterion and measurement attribute as the basis for ranking against other criterion can result in misleading conclusions. To avoid comparing apples to oranges, a weighted aggregation of criteria is recommended. Under these circumstances, weights have to be assigned to each standardized criterion. The challenge then rests on how the weights are determined collectively through public discussion, expert opinions, and managerial agencies. The current literature provides relatively little information under what circumstances one criterion (spending vs. carbon emissions vs. waste production) is more important than the other.
With the availability of a multiple criteria decision analysis model (Wierzbicki 2010), the establishment of general guidelines on these perspectives would greatly assist the objective ranking of prioritizing inbound tourist markets, thus enhancing the value and contribution of the economic and environmental model.
Footnotes
Acknowledgements
We thank the three anonymous reviewers for their helpful comments on an earlier version of this article.
Declaration of Conflicting Interests
The author(s) declared no potential conflicts of interest with respect to the research, authorship, and/or publication of this article.
Funding
The author(s) disclosed receipt of the following financial support for the research, authorship, and/or publication of this article: The authors are grateful to the Taiwan National Science Council for their financial support (under NSC 101-2410-H-390-030).