
Abstract
The notion of multifaceted image, composed of cognitive, affective, and sensory dimensions, has attracted growing scholarly interest in recent years. However, general understanding of the roles of the senses (i.e., sight, hearing, taste, smell, and touch) in image processing remains scarce. Little attention has also been paid to the effects of visual stimuli related to design features on the construction of multifaceted image. This study investigated viewers’ perceived multifaceted destination image upon exposure to different photo formats (i.e., animated vs. static). A mixed method approach was employed to collect data using a between-subjects experimental design. Findings revealed that moving visual presentation exert stronger impacts on three image dimensions in several aspects and associations were also observed between photo contents and sensory arousal. Results enrich the body of knowledge on destination image in terms of image structure and the features of visual stimuli. Practical implications are discussed as well.
Introduction
The notion of destination image has been extensively researched given its role in effective marketing (Deng and Li 2018). Numerous studies have investigated the conceptualization, antecedents, and consequences of this construct (e.g., Kim and Perdue 2011; Lai and Li 2016). Typically, destination image evaluation is based on cognitive and affective models (Kim and Richardson 2003). However, as early as the 1990s, Echtner and Ritchie (1991) stressed the need to consider the five senses in relation to image processing, as “destination” is a composite concept. In other words, image interpretation relies on sensory information to create a holistic impression.
Based on Pocock and Hudson’s (1978) research, Son and Pearce (2005) proposed an enhanced conceptual framework of destination image containing cognitive, affective, and sensory components (otherwise known as multifaceted image). However, this framework has received scarce attention. Only recently, as the embodied cognition theory became increasingly popular in tourism, have scholars acknowledged the need for research on bodily sensory dimensions. More effort must now be devoted to the senses in tourism studies (Buzova, Cervera-Taulet, and Sanz-Blas 2020).
Direct experience appears fundamental to individuals’ sensory perceptions; however, research in psychology and neuroscience suggests that sensory images can be conveyed through visual elements, which help people develop mental imagery without having actual sensory experiences (Elder et al. 2017; Pearson et al. 2015). That is, multisensory feelings can be triggered by mental imagery in the absence of corresponding stimuli (Lee and Shin 2020). Yet how these sensory perception are elicited may depend on the modality of visual presentation (Krishna, Morrin, and Sayin 2014; Lee and Kim 2020).
Many scholars have investigated the effects of visual content on image construction (Nixon, Popova, and Önder 2017). Due to the intangible nature of tourism products, photos can communicate images to viewers (Kim and Richardson 2003). These portrayals can facilitate virtual experiences (Marlow and Dabbish 2014) and stimulate one’s imagination about a pictured place (Eckler and Bolls 2011). Tourism is highly “dependent on imagery-laden advertisements” (Kim, Kim, and Bolls 2014, p. 64); therefore, precisely how different visual stimuli affect viewers’ image perceptions requires further exploration (Kim, Kim, and Bolls 2014).
Technological advances have led various visual formats (e.g., videos) to be accessible online and to create immersive environments (Lee, Gretzel, and Law 2010). However, because video production necessitates careful dedication, it may not always be convenient. Images presented in graphics interchange format (GIFs) have thus become a popular marketing tool. GIFs present more visual imagery compared with static photos but take less time to produce than videos. GIFs are common on mobile apps and websites. These images have come to provide increasingly critical visual presentations and may enhance people’s product-related impressions (Guido et al. 2016).
Despite the proliferation of visual presentations and their roles in image perception, studies concerning visual elements—whether involving visitor-employed or researcher-employed photos—are limited to static stimuli. Such work often focuses solely on the cognitive and affective attributes of destination image, providing little insight into the impact of multimodal image presentation on websites. Various types of stimuli deserve closer academic attention due to their contributions to viewers’ initial impressions, especially during the pre-visit stage of tourism (Bell and Davison 2013). Yet studies exploring how different visual stimuli formats shape image perception are rare (Li et al. 2020). The following question hence remains unanswered in the tourism domain: How will individuals’ perceptions of multifaceted image vary when these viewers are exposed to different visual modalities?
To fill the abovementioned knowledge gaps, this study aims to assess the effects of photo formats (i.e., moving vs. static) on the construction of multifaceted image. The objectives of this study are as follows: (1) to investigate differences in potential visitors’ multifaceted image perceptions (cognitive, affective, and sensory dimensions) when exposed to two photo formats (moving vs. static); (2) to delineate the interrelationships among dimensions included in multifaceted image based on the influences of pictorial elements; and (3) to examine how different visual stimuli induce or strengthen the multifaceted image of a destination.
Literature Review
Image Perception
Multifaceted image
A bevy of research has highlighted the theoretical and practical importance of destination image (Josiassen et al. 2016). Most relevant studies have pertained to the cognitive and affective attributes of destination image (e.g., Kim and Perdue 2013) or to the cognitive-affective-conative framework (e.g., Kladou and Mavragani 2015), failing to extend this topic beyond a two- or three-pronged conceptualization. Early scholars argued that diverse attributes should be woven into destination image investigations since it is a multi-dimensional phenomenon (San Martín and Rodríguez del Bosque 2008): it includes tangible objects such as attractions and accommodation (Buhalis and Spada 2000) as well as intangible factors such as sensory characteristics (e.g., air quality and temperature) (Ferrari 2015).
In essence, “image” is one’s overall mental representation of a place (Frías, Rodríguez, and Castañeda 2008). The notion of image not only encompasses visual pictures held in the mind’s eye but also sound from the mind’s ear and the olfactory, gustatory, and tactile mental representations of various senses (Downs and Stea 1977; Son and Pearce 2005). The five senses often provide information concurrently, which becomes integrated to create a multisensory perceptual experience (Adaval, Saluja, and Jiang 2018); this experience is vital to the construction of destination image (Beerli and Martín 2004). Destination image processing is thus contingent on the absorption of multisensory information (Xiong, Hashim, and Murphy 2015). Pearce (1988) contended that travelers are attracted by a destination’s visual attributes as well as by associated sensory stimulation and affective qualities that satisfy psychological needs. Therefore, richer insight remains to be unearthed about destination image perception.
In a tourism context, Son and Pearce (2005) first proposed adopting the multifaceted image assessment (MIA) framework to investigate destination image and its varied cognitive, affective, and multisensory elements, which is defined as “An individual’s subjective beliefs, feelings, and multi-sensory representations toward a tourist destination” (p. 24). In particular, cognitive image refers to people’s beliefs about and knowledge of a destination; affective image reflects individuals’ feelings or emotions about a place; and multisensory image captures people’s destination perceptions based on sight, hearing, taste, smell, and touch (Son and Pearce 2005).
Several tourism researchers have begun to consider the roles of sensory dimensions in image perception. Huang and Gross (2010) adopted the MIA framework to compare image perceptions of Australia among visitors and non-visitors in terms of the five senses; however, the study’s small sample of 37 respondents precluded wide generalizability of the authors’ findings. Their use of a focus group interview, which solicited participants’ perceptions directly, also failed to reveal the influencing mechanism behind multifaceted image perception. Similarly, Xiong, Hashim, and Murphy (2015) held interviews to assess on-site visitors’ sensory images about an ancient town in China but provided limited insight into travelers’ pre-visit multisensory image construction.
Different from these two studies which concerned the five senses, Nghiêm-Phú and Bagul (2020) considered visual and auditory dimensions only. They sought to understand how these forms of sensory image could inform individuals’ cognitive and affective feelings as well as behavioral intentions. However, studies from neuroscience have shown that the multisensory brain area is a “convergence zone” where input from different sensory modalities interacts and is reciprocally influential (Driver and Noesselt 2008, p. 11); as such, the effects of the five senses should not be isolated (Adaval, Saluja, and Jiang 2018). Nghiêm-Phú and Bagul (2020) did not cast light on the interaction among and impacts of the five senses on destination image perception. Overall, extant studies have centered on the content and consequences of multifaceted image but have rarely illuminated its antecedents. Moreover, although the aforementioned studies emphasized the need to evaluate multisensory image, few scholars have applied this construct for deeper analysis in tourism (Nghiêm-Phú and Bagul 2020).
Photos and image perception
A large body of research has revolved around the formation of image perception (e.g., Baloglu and McCleary 1999; Kim and Chen 2016). In the early 1970s, Gunn (1972) put forth a conceptual framework rooted in organic image and induced image. Based on this pioneering model, Fakeye and Crompton (1991) conceptualized image formation as an evolving process including three stages: organic, induced, and complex. Their model suggests that presented information plays a critical role in potential visitors’ image formation. Studies have also confirmed that among different types of media, photos influence tourists’ perceptions of a destination most (Stepchenkova and Zhan 2013).
Numerous studies have addressed the relationship between the photographic representation of a place and image perception (Garrod 2009; Zhang, Chen, and Li 2020). Visual symbols can create, enhance, and communicate images to potential visitors (Stepchenkova and Zhan 2013). Through photos, visitors can imagine an associated experience and become interested in consumption (Dionyssopoulou, Pridezi, and Mylonakis 2014). Pictures’ roles in image perception hence merit further study (Önder and Marchiori 2017).
The literature on pictorial elements and image perception can be broadly classified into two groups. The first concerns how tourism photos (often visitor-employed photos) reflect visitors’ image perceptions. For instance, Pan, Lee, and Tsai (2014) explored how visitors’ photos submitted to the New York Times mirrored individuals’ inner affective feelings about a pictured destination. This literature stream is largely beyond the scope of this study. The present research focuses instead on the second group, which considers the effects of photos on visitors’ destination image perceptions. Modern websites and social media are inherently image-centered; consequently, scholars and practitioners have begun to ponder how to effectively convey images to potential tourists (Nixon, Popova, and Önder 2017). An important aspect of this task is investigating the impacts of visual stimuli (i.e., pictorial elements) in tourism advertising (Manfredo, Bright, and Haas 1992).
In the early 1990s, MacKay and Fesenmaier (1997) scrutinized how different types of visual stimuli influence individuals’ image perceptions. They found that projected image perceptions vary with photos’ attributes. For instance, a photo featuring unique scenery can evoke an affective image of excitement; a photo of nature, without any people or signs of entertainment, can produce a cognitive image of a peaceful place. Other studies have followed a similar path (e.g., Bernkopf and Nixon 2019; Nixon, Popova, and Önder 2017), tapping into the effects of different pictorial elements (e.g., cultural factors) on viewers’ image perceptions. Researchers have generally found that visuals shape viewers’ cognitive and affective images of a pictured place.
Despite notable progress, scholarly attention to photos’ impacts on destination image is somewhat limited (Bernkopf and Nixon 2019). Studies have yet to move beyond the roles of presented content in photos; therefore, the implications of different stimuli for effective visual marketing remain ambiguous. Ongoing digital advances have birthed myriad approaches to visual presentation. Gaining insight into the effects of diverse visual modalities is accordingly critical. Studies in other domains have implied that different types of visual presentation can evoke distinct responses among viewers (e.g., Haase, Wiedmann, and Bettels 2020; Lee and Kim 2020). Thus, it is necessary to examine the effectiveness of different forms of visual stimuli in producing destination-related perceptions rather than focusing on specific photo categories.
Sensory Marketing
Marketing approach
An increasingly competitive business environment has driven industry practitioners to adopt creative marketing strategies to distinguish products that appeal to customers (McNally, Akdeniz, and Calantone 2011). In this regard, the roles of sensory cues in consumers’ behavior and experiences have gained growing attention. A new marketing mode, sensory marketing, has gradually entered the research mainstream (Krishna, Cian, and Sokolova 2016). Krishna (2012) defined sensory marketing as “marketing that engages the consumers' senses and affects their perception, judgment, and behavior” (p. 332). This form of marketing is intended to enhance brand–customer interaction by capitalizing on the human senses to strengthen brand identity and brand image (Moreira, Fortes, and Santiago 2017).
Advertisements can stimulate consumers’ senses via sensory stimuli. According to Haase, Wiedmann, and Bettels (2020) and Krishna, Cian, and Sokolova (2016), sensory marketing includes two main approaches: direct and indirect. In terms of direct sensory marketing, many researchers have assessed how the sensory features of products or retail spaces influence consumers’ emotions, thoughts, and behavior. Such studies have also investigated the antecedents and consequences of sensory experiences. For example, Brasel and Gips (2014) considered the tactile features of a computer interface and found that consumers’ sense of psychological ownership improved upon interacting with the screen physically. Yet because sensory cues have tended to be interrelated rather than isolated in certain contexts, combining multisensory features can enrich this research area. Currently, despite burgeoning interest in sensory marketing, studies integrating numerous sensory cues are needed (Helmefalk 2019).
Indirect sensory marketing concerns how advertising mediums, such as text and pictures, can evoke mental (sensory) imagery similar to actual experiences (Ghosh and Sarkar 2016; Lv, Li, and Xia 2020). Mental imagery requires information processing; that is, sensory images are depicted in one’s mind in the absence of corresponding sensory stimuli or based on other available information (Lee and Kim 2020). Mental imagery can be visual, olfactory, auditory, gustatory, or tactile. It can also involve all five senses, enabling people to “pre-experience” upcoming activities (Holmes et al. 2016). Studies have demonstrated that imagery can positively influence customers’ product-related attitudes, impressions, and preferences (Ghosh and Sarkar 2016; Lee and Shin 2020) as well as their behavioral intentions (Lv, Li, and Xia 2020). Given the importance of sensory imagery in marketing, scholars have explored the effectiveness of different sensory stimuli in affecting sensory imagery. For example, Zamudio and Jewell (2021) found that scent-related brand names (as verbal cues) can elicit olfactory imagery and influence viewers’ purchase intentions. Online consumption is increasingly popular today. Using indirect marketing approaches to evoke non-actual sensory feelings is therefore critical—especially in the online pre-consumption stage, when customers consider numerous alternatives before making a purchase.
Sense of sight in elicitation
Scholars have claimed that vivid sensory images can be triggered via all sensory modalities (Schifferstein 2009) and that imagery can be induced by stimuli via other senses (Nanay 2018). However, exactly how the senses function and interact to evoke different sensory perceptions remains under investigation. Several studies have shown that sight can trigger other sensory feelings and compensate for missing sensory stimuli (e.g., Koubaa and Eleuch 2021; Krishna, Morrin, and Sayin 2014). Visual material can include text, pictures, or other visual metaphors (Lv, Li, and Xia 2020). Krishna, Morrin, and Sayin (2014) discovered that the visual presentation of an odor referent can induce and enhance individuals’ olfactory imagery. Relatedly, Lv, Li, and Xia (2020) noted that descriptions of guests’ tactile experiences in online hotel reviews can activate people’s imagination about a corresponding experience. Neuroscience research has also revealed an association between visual references and other sensory evocation. For instance, when participants are exposed to odor-congruent pictures, neurons related to the processing of visual input can activate olfactory neurons via cross-modal interaction (Gottfried and Dolan 2003).
Mounting empirical evidence of the role of sight in eliciting other sensory perceptions has led researchers to question whether visual presentation formats differentially affect sensory activation. Haase, Wiedmann, and Bettels (2020) compared the effect of a simple and enhanced picture (i.e., one with more supplementary elements) of lemonade on triggering gustatory and olfactory imagery. They found that the degree of such imagery varied with exposure to different visual stimuli. The role of vision has garnered extensive interest in tourism as well: destination-related imagery appears positively correlated with destination image construction. In other words, individuals construct a destination image based on various imagery (Josiassen et al. 2016). Even so, how distinct visual formats elicit other sensory perceptions via mental imagery remains understudied. Technical limitations currently preclude the use of certain sensory cues; visual advertising thus remains prevalent in sensory perception construction. In light of these disparate foci, it is necessary to clarify the impacts of specific visual stimuli in eliciting sensory images to better understand this topic.
Animated Visuals
Today’s fiercely competitive business environment mandates that industry practitioners engage in creative marketing to showcase products. Animated visuals, namely those assuming a moving visual form, statement, or structure (Baecker and Small 1990), have been widely adopted as a result.
Animation is preferred in visual marketing owing to its power in capturing viewers’ attention and promoting information processing (Cleland and Carmichael 1997). Motion effect theory explains this advantage; put simply, people prefer moving objects (Sundar and Kalyanaraman 2004). Motion is a fundamental attribute (Reeves and Nass 1996) which the human brain is equipped to perceive and process via specialized nerve pathways (Goldstein 1989). Therefore, moving images readily attract individuals’ attention and encourage the processing of related information. This information consumption can then lead to psychological changes (Diao and Sundar 2004).
Animated visuals take many forms, of which GIFs are one. The term “GIF” refers to a file format and the animation itself: a looped video featuring a set of frames generated from a movie, cartoon, TV series, or other video-based medium (Schneebeli 2019). GIFs have enjoyed growing popularity online in the digital age thanks to their dynamic content, storytelling ability, emotional expression, and accessibility (Bakhshi et al. 2016; Shu et al. 2021).
Studies of GIFs have tended to apply one of two disciplinary lenses: computer science or linguistics. In the first field, scholars have performed novel GIF-related sentiment analyses from the perspectives of senders (e.g., Liu et al. 2020) and viewers (Jou, Bhattacharya, and Chang 2014). Linguistics researchers have documented various aspects of GIFs’ linguistic functions. Miltner and Highfield (2017) found that within online discourse, GIFs can convey emotions, demonstrate cultural knowledge, and elaborate on verbal and textual expression. These animations have been shown to facilitate viewers’ evaluation and perlocution as well. GIFs also represent brief expressions of users’ cognition and emotions, which may influence how people convey their mental states (Wagener 2021). These animations can present diverse imagery. Accordingly, linguistic studies have examined how people (mis)interpret GIFs and the associated influencing factors (Jiang, Brubaker, and Fiesler 2017). GIFs’ roles in communication are well-established overall.
Research into consumers’ reactions to GIFs is sparse despite these snippets’ online ubiquity. As an exception, Mulier, Slabbinck, and Vermeir (2020) investigated whether GIFs affect impulse consumption and brand attitude by inducing a sense of urgency and anticipated regret. Marketing studies have mostly considered other moving elements, such as animated banners or moving logos online. Findings indicate that dynamic visuals offer more advantages than static ones. Specifically, dynamic images can attract more viewers’ attention (e.g., Li, Huang, and Bente 2016), generate greater recall (e.g., Hamborg et al. 2012), produce more positive attitudes (e.g., Rakrachakarn and Moschis 2015), elicit better recognition memory (Buratto, Matthews, and Lamberts 2009), and evoke stronger emotional responses (Jou, Bhattacharya, and Chang 2014). Yet results appear inconsistent—some empirical research has come to opposing conclusions, suggesting that animation can detract from individuals’ experiences (de Sa, Navalpakkam, and Churchill 2013) or fail to capture viewers’ attention (Hernández-Méndez and Muñoz-Leiva 2015).
These conflicting findings could be partly attributed to divergent definitions of animation (Argyriou 2012), as animated visuals can include moving elements of any kind (e.g., product rotation, flash-enabled banners, or moving text). Research has also spanned multiple contexts and website environments; for instance, studies of online animated banners have included different webpage content as supplementary materials. The intensity of animation plays a role as well. Yun Yoo and Kim (2005) suggested that the relationship between the level of animation and viewers’ memory exhibited a U-shaped effect, indicating different responses to varying animation conditions. However, irrespective of presentation, animated visuals’ effects on individuals’ cognition, behavior, and affective responses are well documented (Argyriou 2012).
Moving stimuli have been empirically examined to varying degrees. Yet emerging topics such as GIFs can be explored further. Most dynamic advertising images feature tangible products such as CDs, whereas tourism products are intangible. Exactly how different visual formats can stimulate viewers’ imagination about such products warrants consideration—especially because related conclusions can enable marketers to better tailor advertisements to customers’ demands prior to purchase. Tourism research appears to have neglected this line of inquiry.
Research Hypotheses
As implied, the above literature review reveals several knowledge gaps. First, the formation of sensory images, especially during the pre-visit stage, has long been ignored in tourism settings despite its impact on potential tourists’ behavior. Second, studies regarding how different visual stimuli (particularly animated stimuli) affect destination image perception are rare in spite of images’ effects on tourism product consumption.
The literature across disciplines has provided theoretical and empirical evidence of visual elements’ influences on people’s cognitive information processing (e.g., MacKay and Fesenmaier 1997), affective responses (e.g., Nixon, Popova, and Önder 2017), and sensory impressions (e.g., Haase, Wiedmann, and Bettels 2020) as reviewed above. However, no studies have scrutinized these dimensions of experiential products comprehensively. Analyzing these factors holistically can reveal their variance and interactive effects, casting new light on the construction of multifaceted image perception.
Additionally, studies suggest that animated GIFs differ from other visuals. GIFs can engage viewers through several unique features compared with text and video: moving elements, silence, low bandwidth, minimal time consumption, and storytelling (Bakhshi et al. 2016). From a practical standpoint, GIFs are visual modalities that can be easily integrated in destination applications and websites; this format is also prevalent on social media and is popular among online users (Bakhshi et al. 2016). Therefore, because visuals serve as primary factors in communicating images to people (Stepchenkova and Zhan 2013), the effectiveness of different visual stimuli in shaping image perception should be taken into account.
In light of the preceding discussion, this study presumes that, when people are exposed to different visual stimuli (i.e., animated photos vs. static photos), their multifaceted image perceptions (on the basis of cognitive, affective, and sensory dimensions) vary. The following hypotheses are thus proposed:
H1: The perceived cognitive image of a destination will differ significantly between individuals who are exposed to animated GIFs and those who are not.
H2: The perceived affective image of a destination will differ significantly between individuals who are exposed to animated GIFs and those who are not.
H3: The perceived sensory image of a destination will differ significantly between individuals who are exposed to animated GIFs and those who are not.
Methodology
Research Design and Sample
The objectives of this study were addressed through a two-group randomized experimental design. Specifically, participants were divided into two groups randomly and exposed to two types of visual stimuli (moving vs. static) separately. After viewing photos, participants completed a questionnaire regarding cognitive, affective, and sensory image.
Multiple factors influence destination image formation; however, this study focused on the impacts of different picture formats. The possible effects of participants’ demographic characteristics (e.g., age, education level) were therefore controlled. Additionally, as this research involved moving images which are common online, individuals who were actively involved in online environments were deemed suitable target participants. According to Statistical Reports on Internet Development in China (2019), as of June 2019, people aged 20–29 represented the largest proportion of internet users. Students accounted for the largest user segment in terms of occupation.
Accordingly, the target population of this study consisted of Chinese people aged 20–29 who held a bachelor’s degree or higher and who had never visited the pictured destination. The sample included 200 participants per group. The number of survey respondents in prior randomized two-group experimental studies in tourism and hospitality ranged between 44 and 349 (22–186 participants per experimental cell). For the purposes of the current study, 200 participants per condition (N = 400) were considered sufficient to generate statistically valid results.
Settings and Stimuli
Georgia, in the southwestern part of Asia between Russia and Turkey, is the eastern gateway to Europe (Figure 1). The country possesses abundant tourism resources such as a remarkable variety of landscapes, stunning mountain villages, ancient architectural monuments, and rich wildlife. It is also home to unique customs and traditions, whose cultural richness is reflected in national churches, music, dance, cuisine, and so forth. Georgia has been called the homeland of wine thanks to its storied wine culture. In addition, with an enviable geographic location, Georgia has long functioned as a bridge between Asia and Europe: many routes have traversed its territory, including the famous Silk Road.
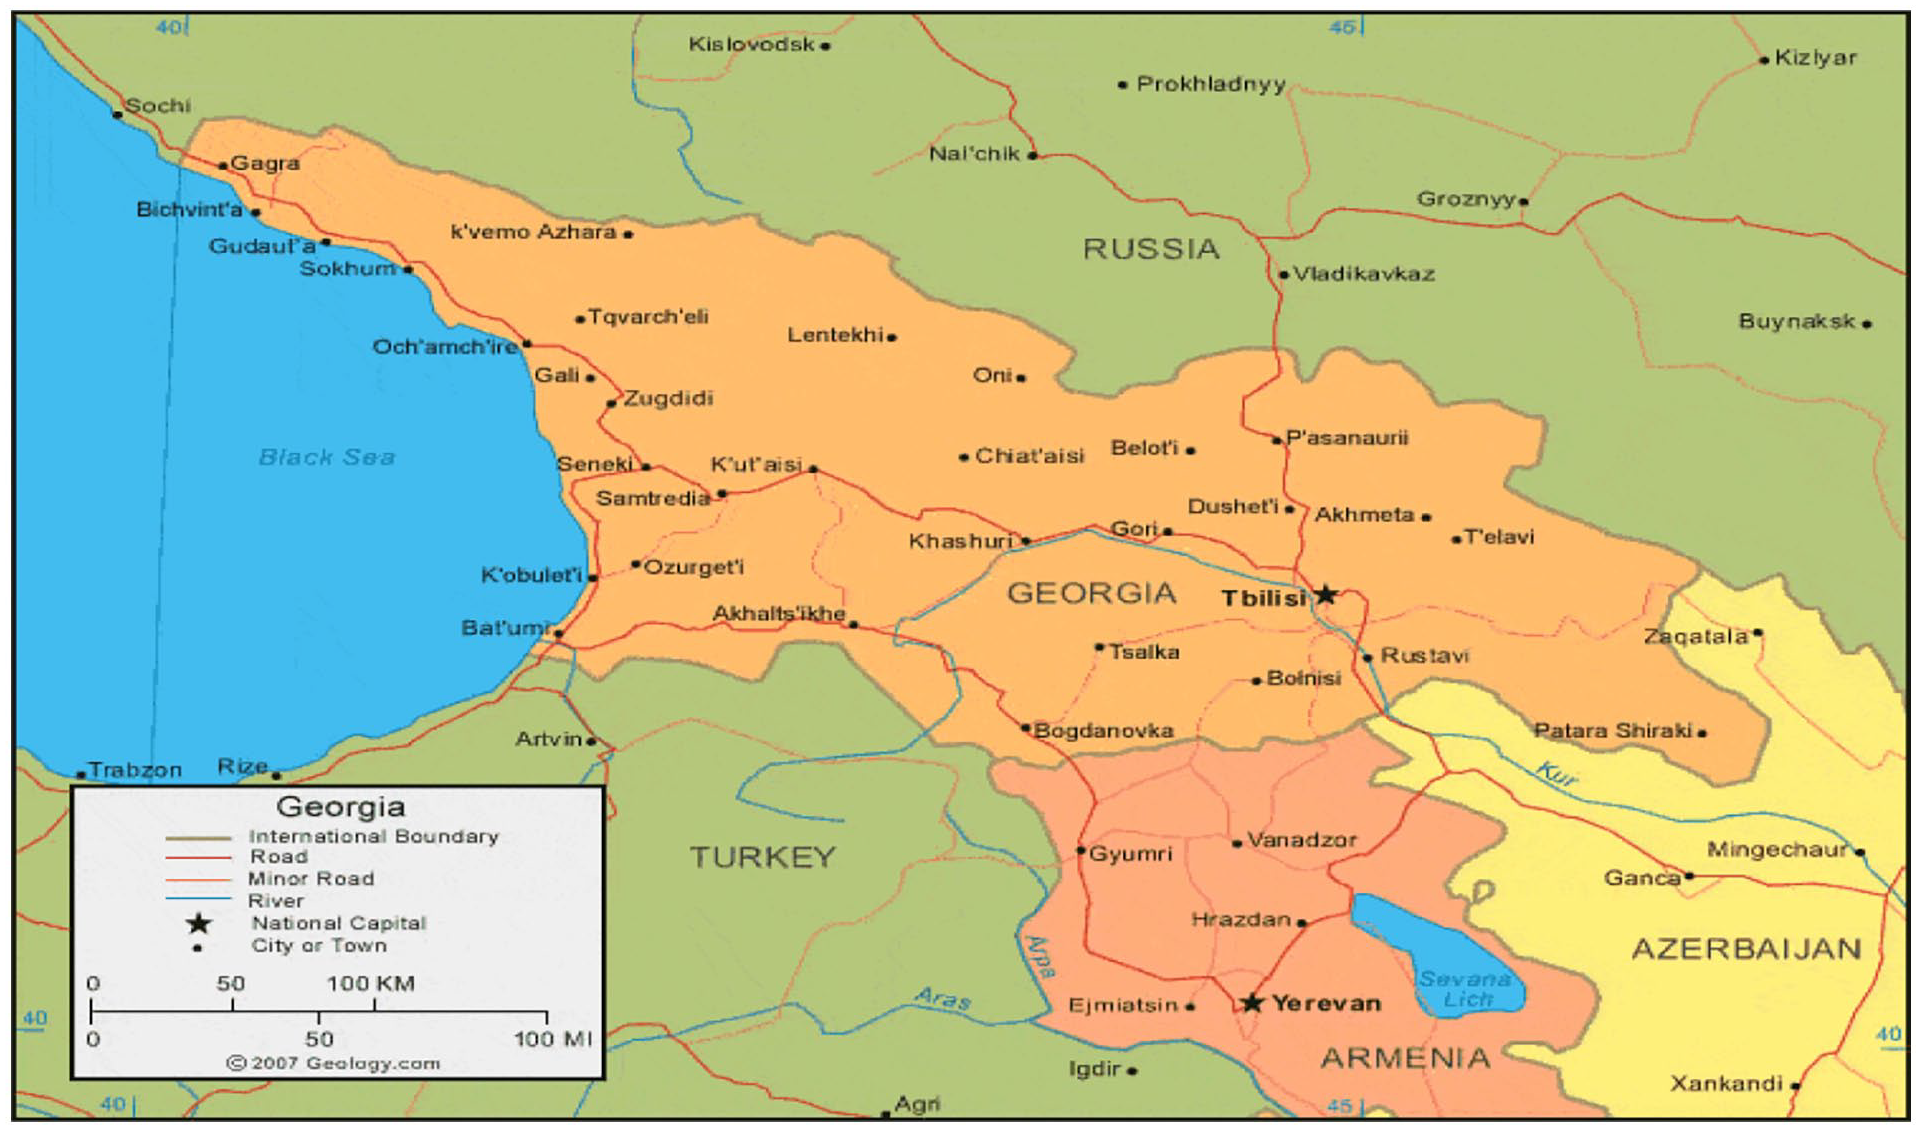
Map of Georgia.
Before the COVID-19 outbreak, Georgia’s international tourism industry was booming as the annual number of visitors continued to balloon. According to the Georgian National Tourism Administration (2019), international travelers reached a peak of 9,357,964 in 2019 with 7.8% annual growth. Roughly 71% of Georgia’s service export revenue is from the tourism industry. In 2018–2019, the total value added in the tourism sector jumped by 16.9%; tourism’s contribution to the country’s GDP rose from 7.6% to 8.1% in the same period.
Georgia also plays an active role in the China-initiated “One Belt and One Road” project. However, this country is unfamiliar to many Chinese. The Georgian National Tourism Administration (2019) indicated that while the number of Chinese travelers has increased in recent years, these visitors still account for a small proportion of Georgia’s inbound tourists. Participants’ prior knowledge about and experience with the country was thus expected to exert little influence on their destination perceptions in this study, enabling the researchers to maximize the effects of photos in shaping participants’ destination image due to minimal familiarity.
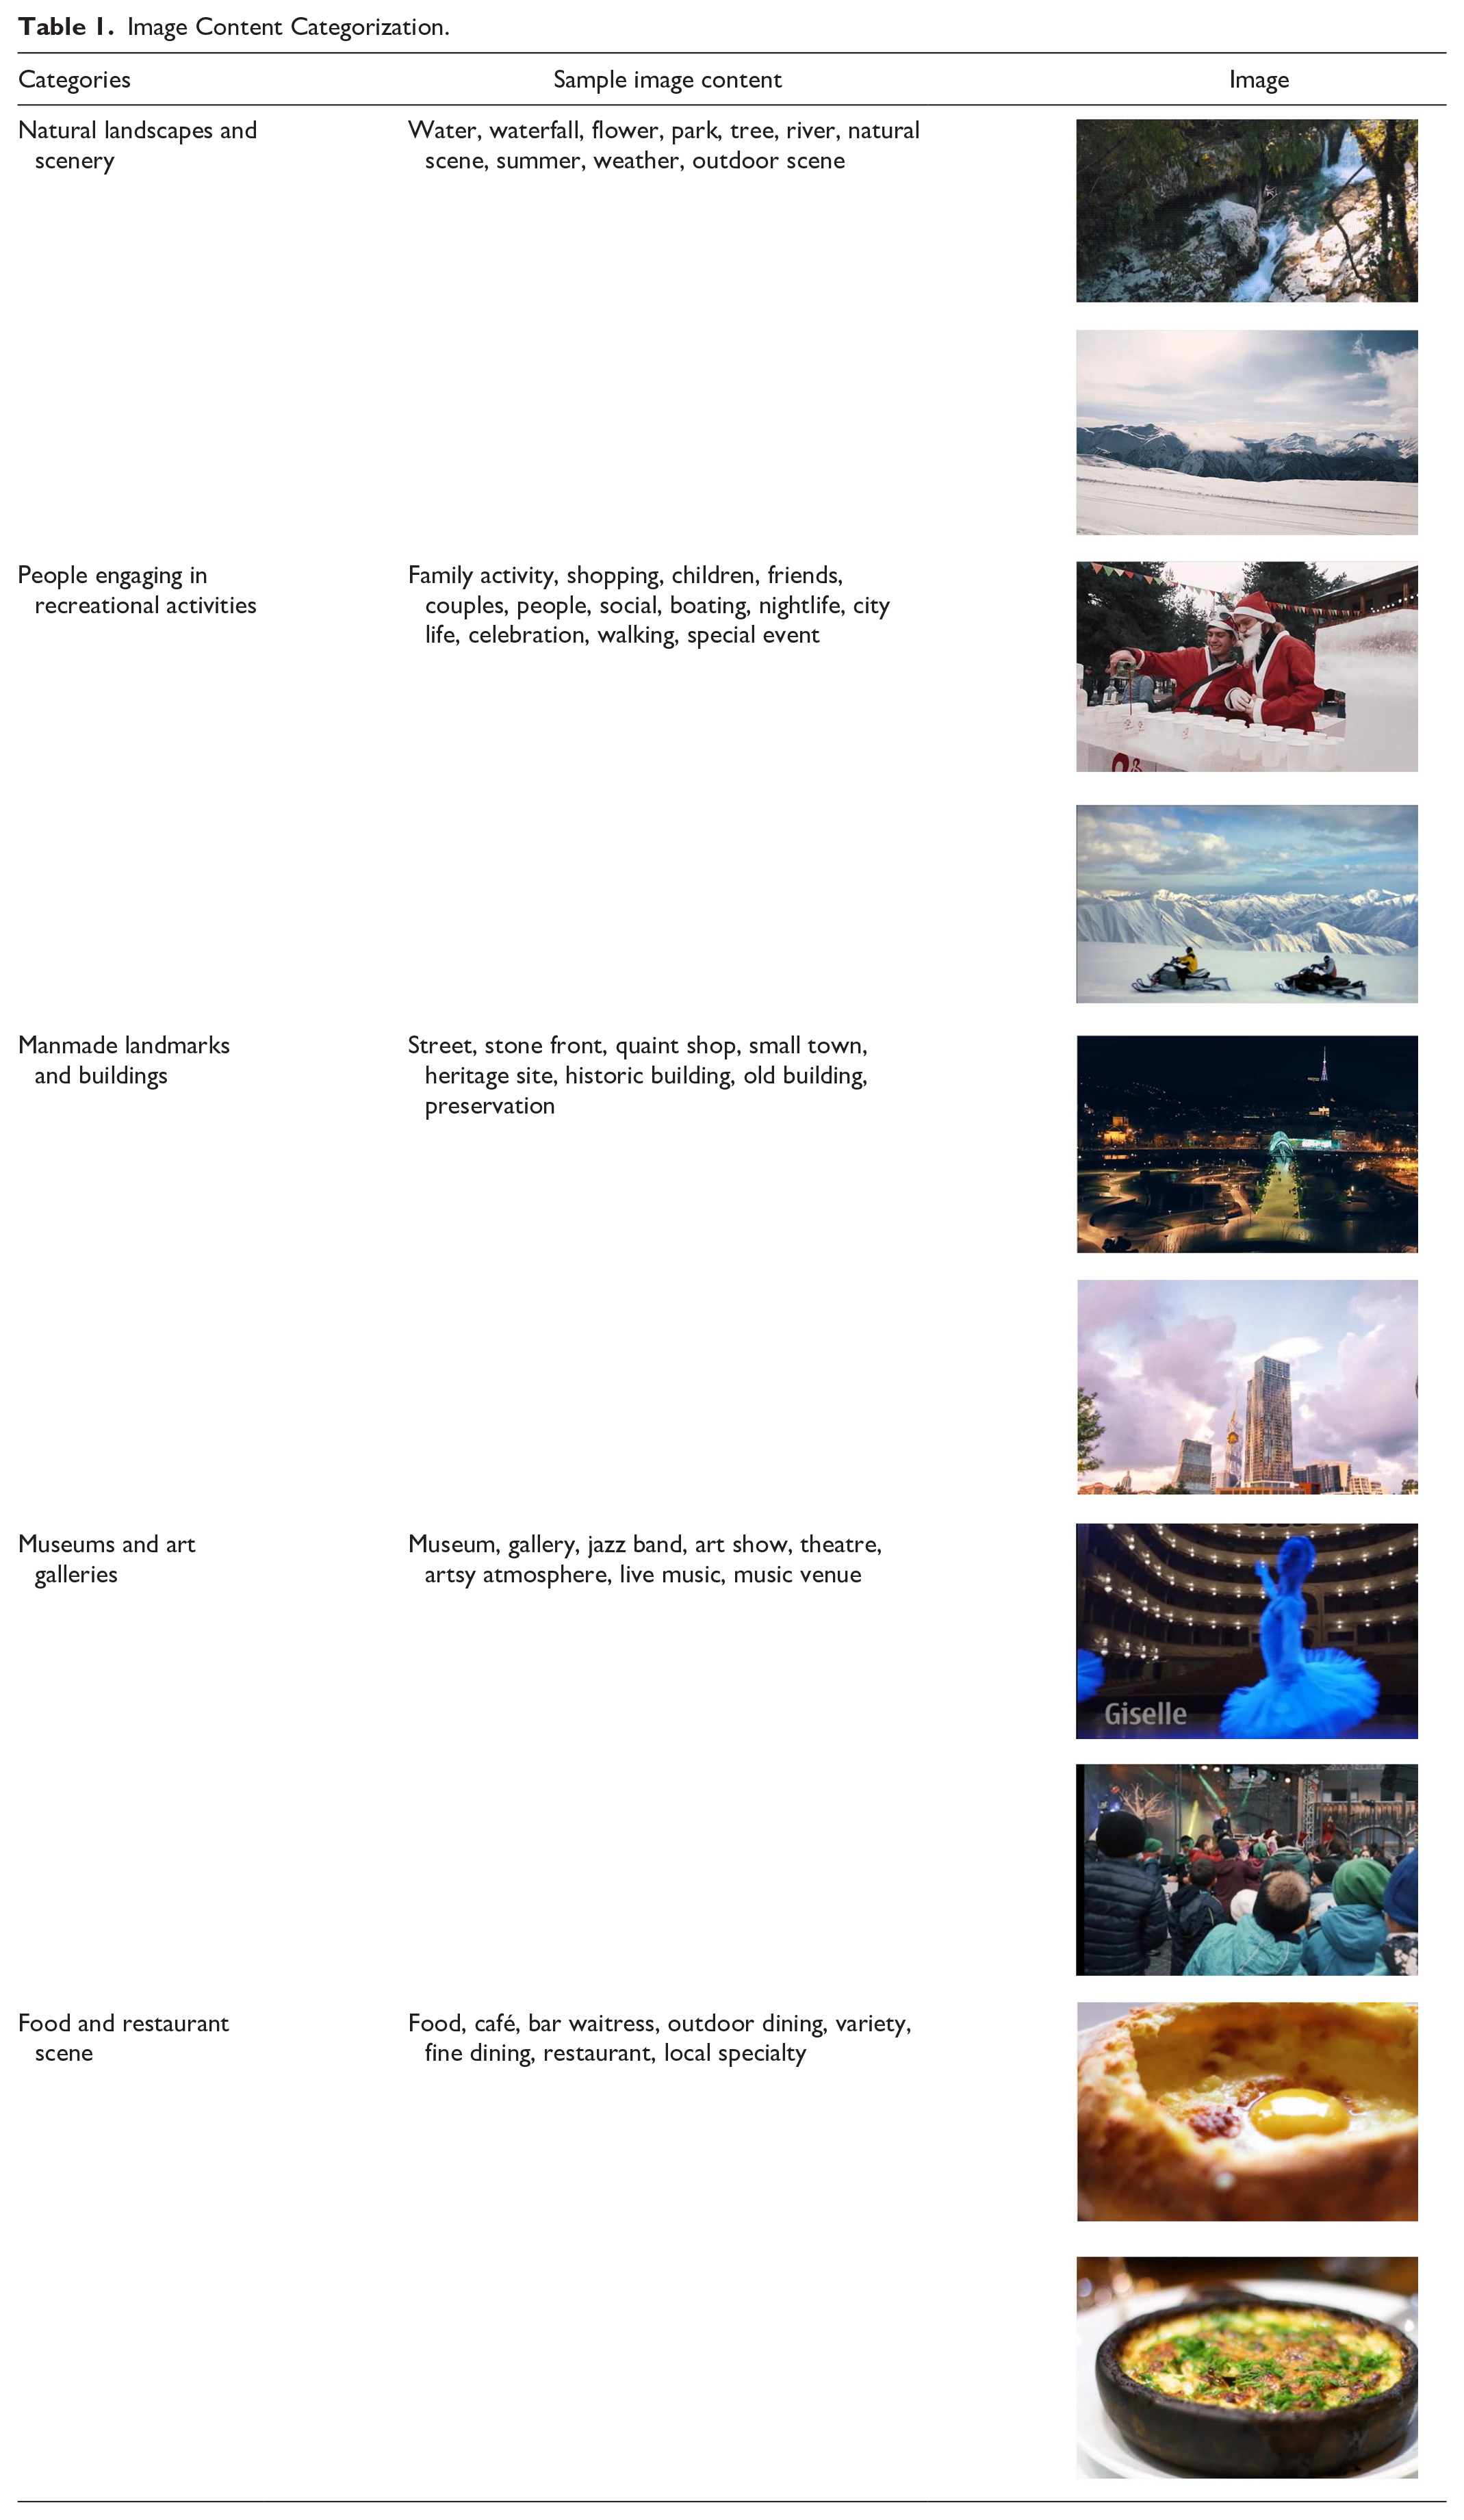
Ye and Tussyadiah (2011) outlined several image categorizations from prior studies (Table 1). Tourism photos representing each category in Georgia were used in this research with slight modifications. Ten typical tourism photographs (two pictures per type, single frame) were taken from a Georgia tourism video advertisement presented on its tourism department’s official social media account. To investigate the effects of dynamic images, professional companies were asked to digitally manipulate the photos into moving versions (GIFs) for this study. The time of each moving image is 17 hundredths of a second between frames. To ensure a clear comparison, visual stimuli consisted of static and dynamic photos depicting the same tourism attraction.
Image Content Categorization.
Survey Instrument
The questionnaire included four sections. The first section consisted of screening questions. Considering the factors that influence image perception, such as individuals’ demographic characteristics, familiarity, and previous experience (Beerli and Martín 2004), this section contained four items partly inspired by Guerrero-Rodríguez, Stepchenkova, and Kirilenko (2020): (1) tourist attributes including age, gender, and education level (demographic characteristics); (2) the number of trips taken for leisure purposes in the past three years before participating in this study (previous travel experience); (3) whether the participant had visited Georgia for any reason and engaged in tourism activities during the trip (actual visitation); and (4) the participant’s extent of knowledge about Georgia (familiarity).
Baloglu (2001) and Prentice (2004) noted the critical role of familiarity in destination image formation. Therefore, familiarity was rated in this study on a 5-point Likert-type scale (1 = “strongly disagree,” 5 = “strongly agree”) regarding the description of Georgia’s physical environment and lifestyle, inspired by Kim and Richardson (2003).
The second section focused on sensory data. Questions were adapted from earlier research (Huang and Gross 2010; Xiong, Hashim, and Murphy 2015). Each sensory perception (sight, hearing, smell, taste, and touch) was measured separately through open-ended questions: “Do you have any visual/(auditory/gustatory/olfactory/tactile) image/perception/impression in your mind after viewing these photos? Please specify as much as possible.” Because sensory attributes are rich (Piqueras-Fiszman 2015), the associated intrinsic content deserves particular attention. However, using a pre-established list of sensory descriptors can lead to biased findings as individuals’ sensory perceptions about a product (destination) vary (Mahieu et al. 2020). Participants might choose provided descriptive words that are similar to their perceptions but do not exactly reflect them (Mahieu et al. 2020).
Closed-ended questions can render it difficult to capture information embedded in a person’s mind. Comparatively, open-ended questions can elicit participants’ understanding and generate in-depth information (Ten Kleij and Musters 2003). Open-ended questions are thus effective for clarifying individuals’ product-related sensory perceptions along with underlying spontaneous and genuine reasoning (Piqueras-Fiszman 2015). This method is especially appropriate when researchers seek to compare the differences and similarities in respondents’ sensory, hedonic, and emotional perceptions of a product/destination (Piqueras-Fiszman 2015).
Additionally, nearly all studies investigating destination multisensory image have employed open-ended questions for data collection (Huang and Gross 2010). This study followed this pattern to capture participants’ sensory perceptions of Georgia and then summarized and calculated the number of words for further hypothesis testing.
The third questionnaire section was intended to measure cognitive components. The selection of image items was based on a comprehensive review of the literature, which guided the development of a list of destination attributes. By reading Georgia’s promotional brochures and browsing its official tourism website, a definitive list proposed by Chi and Qu (2008) was adopted in this study with minor modifications. The 19 items covered the country’s travel environment, natural landscape, entertainment and activities, cultural and historic attractions, and tourism facilities. These items were scored on a 5-point Likert-type scale.
The final section was used to evaluate Georgia’s affective image via four bipolar items assessed on a 5-point semantic-differential scale, as in previous studies (Russell, Ward, and Pratt 1981). Word pairs consisted of “unpleasant—pleasant,” “sleepy—arousing,” “distressing—relaxing,” and “gloomy—exciting.”
Procedure
A professional consulting company in China was hired to distribute the questionnaire to qualified respondents. In the online survey, photos were presented after screening questions and before the image evaluation section. All 10 photos were professionally programmed to appear in a random order in each questionnaire. To limit participants’ time spent viewing photos and to prevent them from moving to the next page accidentally, each photo was displayed on the screen for at least five seconds before participants could go to the next page. In sum, participants proceeded through five steps during the survey: (1) screening questions, (2) photos, (3) sensory image–related questions, (4) cognitive image–related questions, and (5) affective image–related questions.
A pretest was conducted with 22 master’s students and one academic expert in tourism. Minor adjustments were made to the questionnaire in terms of the order of questions, word limits for open-ended questions, and the time for which photos were displayed. Once the finalized questionnaire was distributed, 400 valid copies were returned within two weeks by late March 2020.
Data Analysis
Data analysis involved three procedures. First, independent t-tests were employed to uncover differences in participants’ educational background, occupation, previous travel experience, and familiarity between the two groups to ensure there were no differences in other variables. Second, repeated measures analysis of variance (ANOVA) was performed to identify differences in participants’ cognitive and affective image perceptions when exposed to different visual stimuli. All statistical analyses were carried out in IBM SPSS version 22.
Lastly, for the open-ended questions, data cleaning was conducted prior to data analysis. Piqueras-Fiszman (2015) identified several steps to facilitate the analysis of open-ended questions, which were followed in this study. First, each participant comment was imported into an Excel spreadsheet to check spelling. Second, sentence coding was used to divide sentences into words; sensory-relevant words were also identified in this step. Because participants’ original descriptions were written in Chinese, the study authors first reviewed all terms and then summarized key words related to specific sensory impressions in each narrative in English based on earlier literature. For example, in the visual section of the questionnaire, the description “这里的雪好漂亮,我好想打雪仗!(the snow is great, I really want to have a snowball fight!)” was truncated to “snow.”
During this process, a lemmatization step that transformed each word into a standardized form was also adopted. Given that participants may use different words to describe the same elements, such as using the nouns “stream” or “spring” to refer to a picture of a natural landscape, the authors conducted uniformization of such words. To ensure the objectivity of data, sentence coding should be performed via triangulation (Modell 2005). Researchers who were proficient in English and Chinese took part in this process until reaching a consensus about word summarization. Finally, after data cleaning, the frequency of different words related to each sense was computed for content analysis, and the number of sensory cues reported by every participant based on different sensory modalities between both groups (animated and static) was evaluated via repeated measures ANOVA.
Results
Sample Profile
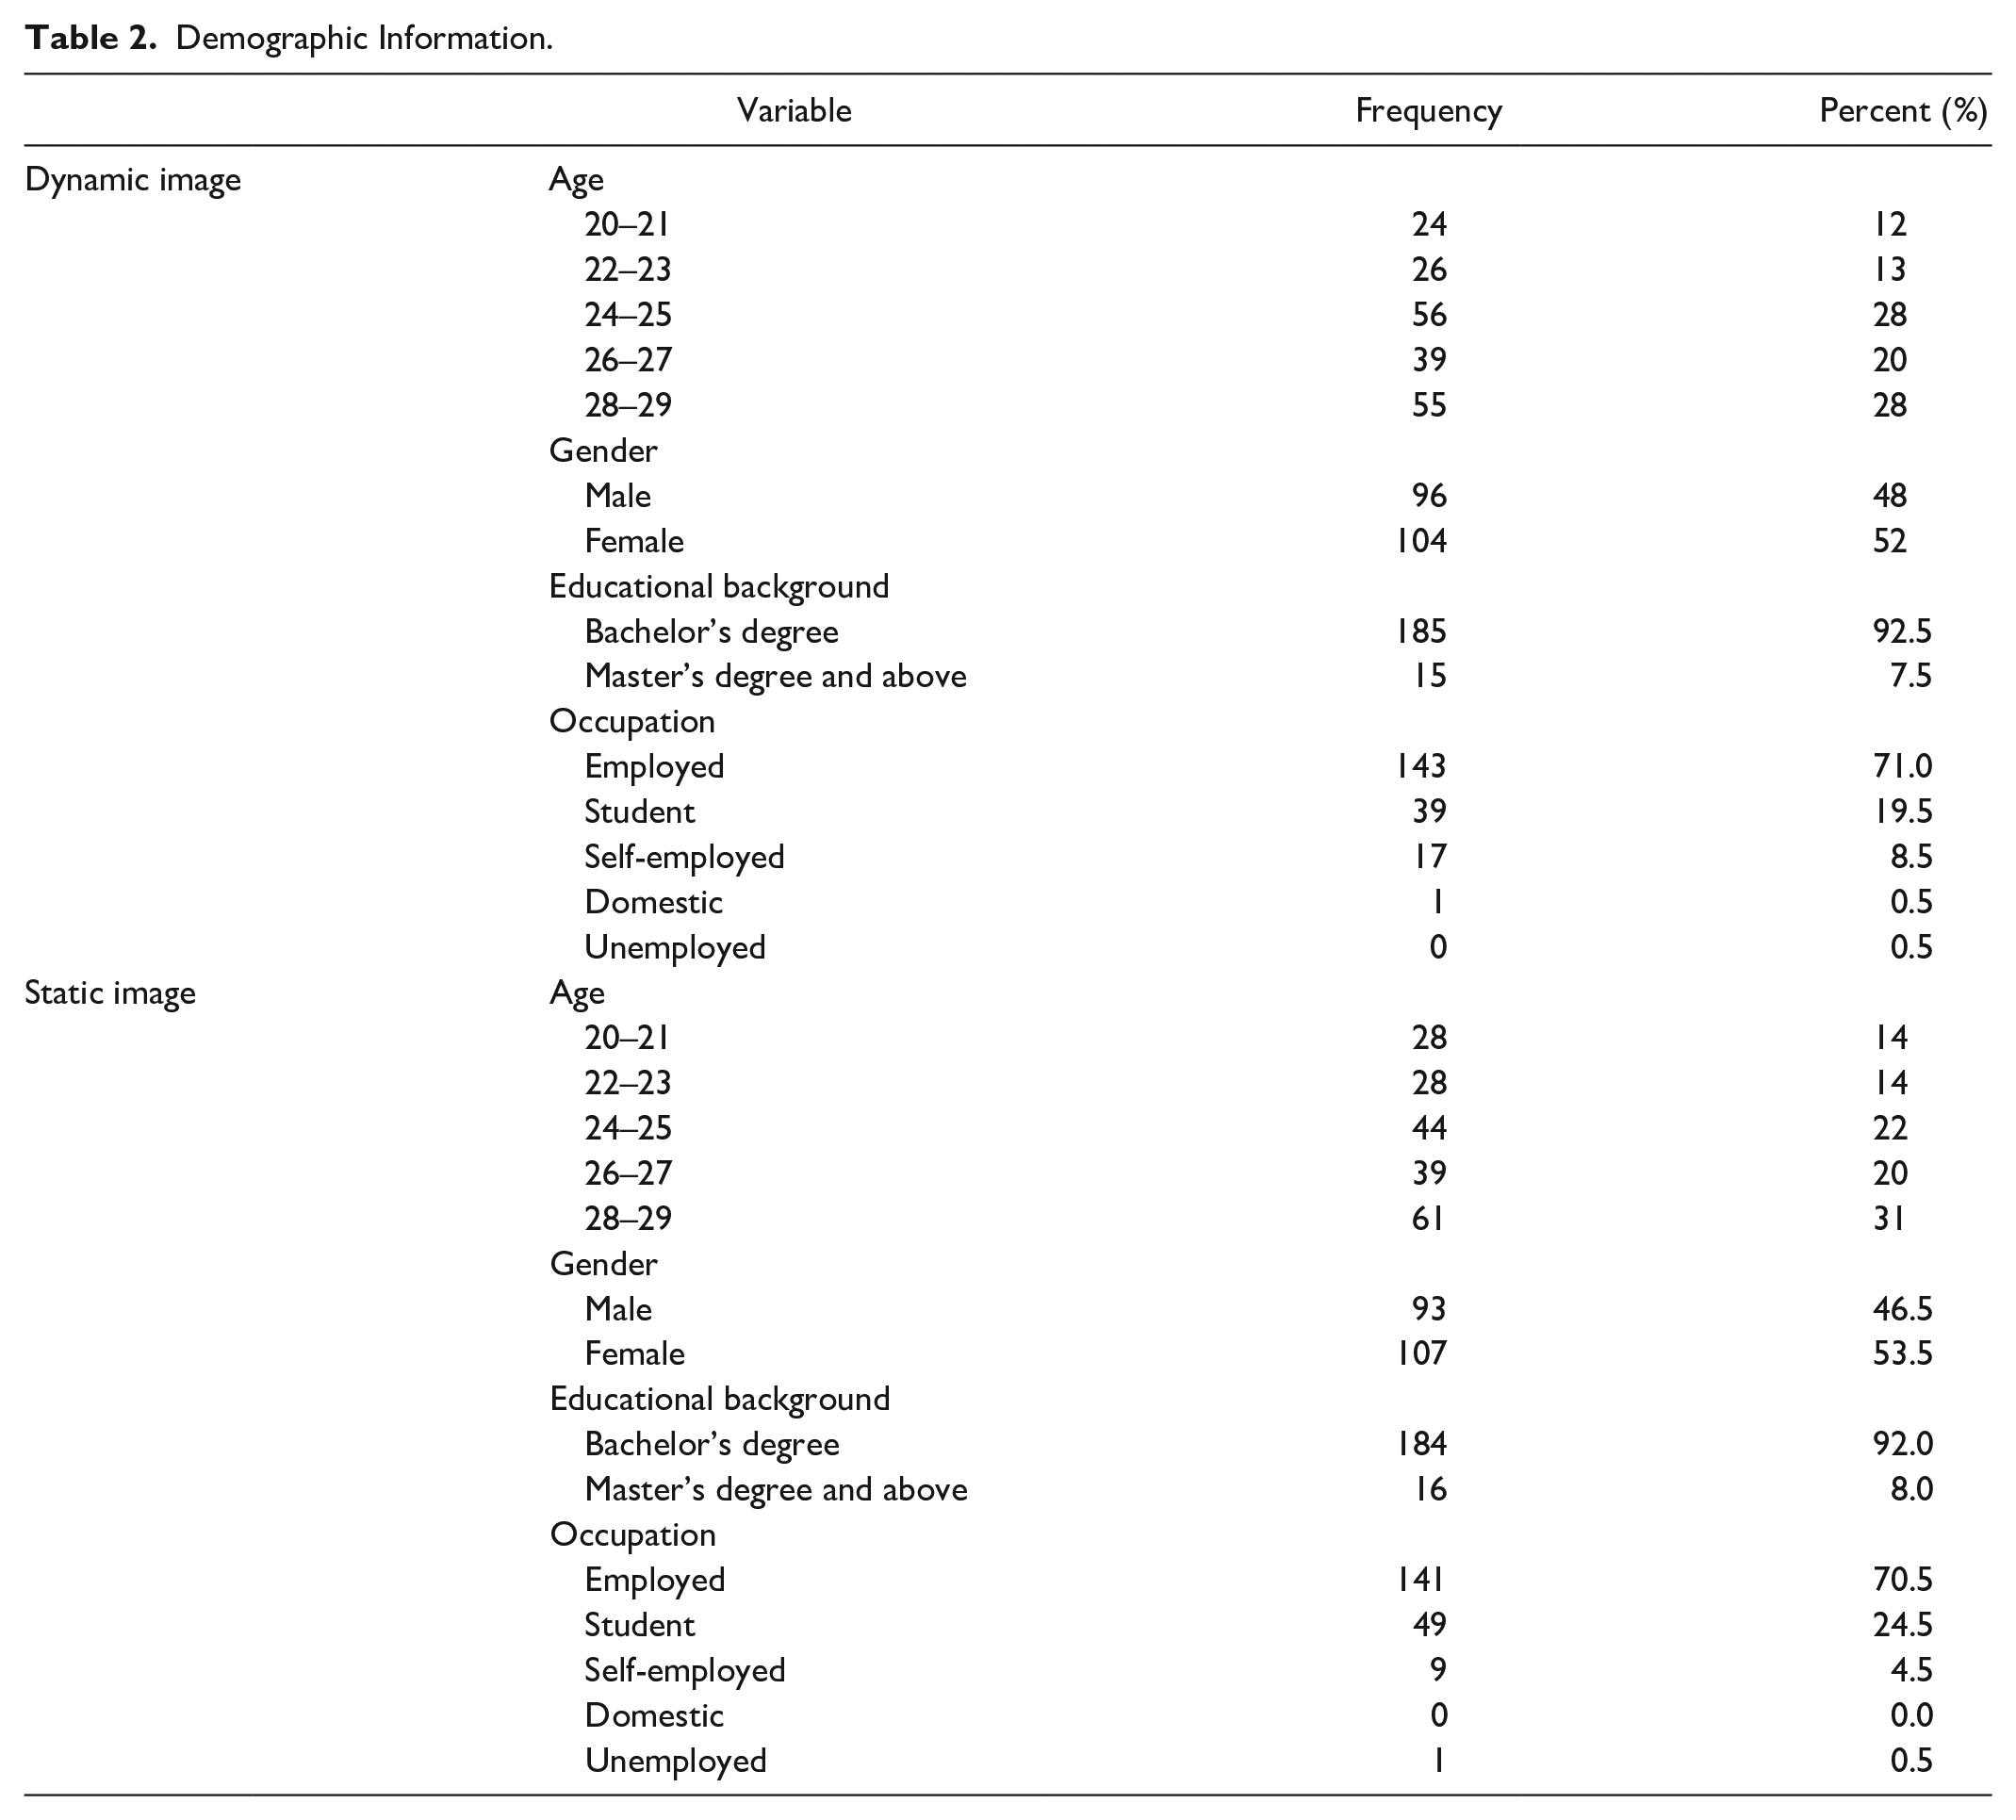
The two groups’ sociodemographic characteristics are summarized in Table 2. In the dynamic image sample, 48% of participants were men and 52% were women. In terms of occupation, most participants were employed (71%), followed by students (19.5%); comparatively few were self-employed. The vast majority of participants held a bachelor’s degree (92.5%). Sociodemographic data were quite similar in the static image sample, although the percentage of men (46.5%) was slightly lower than that of women (53.5%). Most were employed (70.5%) and held a bachelor’s degree (92%).
Demographic Information.
Descriptive statistics for the number of previous trips (in the past three years) and familiarity items appear in Table 3. As indicated, participants’ familiarity with Georgia was low with a score fluctuating around 2 (2 = “unfamiliar”).
Descriptive Statistics of Familiarity and Previous Travel Experience.
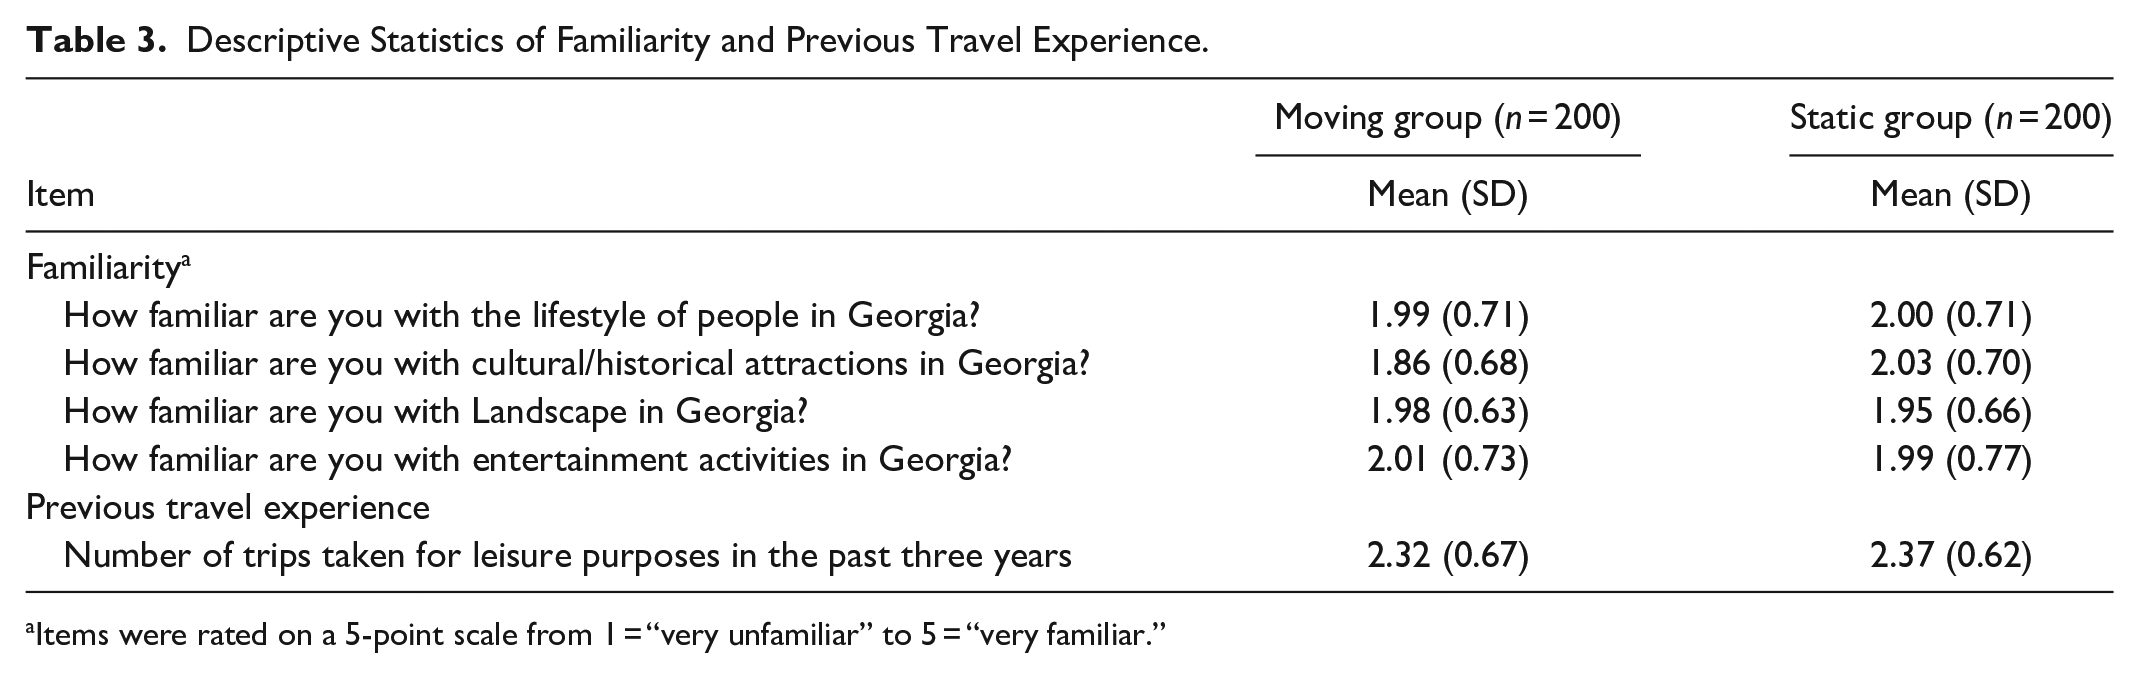
Items were rated on a 5-point scale from 1 = “very unfamiliar” to 5 = “very familiar.”
As mentioned in the Methodology section, because this study involved a between-subjects design, independent t-tests were conducted to test whether differences existed between the two groups in terms of participants’ age, gender, educational background, previous travel experience, and destination familiarity. No significant differences were observed in these factors. Subsequent image analyses were then performed.
Cognitive Evaluation
H1: The perceived cognitive image of a destination will differ significantly between individuals who are exposed to animated GIFs and those who are not
To test this hypothesis, repeated measures ANOVA was performed to determine whether the two groups demonstrated statistically significant differences. As discussed, 19 items covering cognitive image perception had been classified into five categories (tourism environment, natural landscape, entertainment activities, cultural and historical attractions, and tourism facilities), and the average mean of each cluster was tested. Bonferroni correction was adopted to control for Type I error. The alpha level of 0.05 was adjusted to 0.01 (0.05/5). Visual stimuli (animated vs. static) served as the between-subjects variable, and cognitive image dimensions represented within-subject factors.
A sequential 2 × 5 (visual stimuli × cognitive image dimension) mixed ANOVA was conducted. As the results of Mauchly’s test suggested a violation of sphericity, Huynh-Feldt correction was applied (epsilon [ε] > 0.75). Results indicated a main effect of visual stimuli [F(1,398) = 8.288, p < .01, η2 = 0.020] and cognitive image [F(4,1592) = 83.781, p < .001, η2 = .174]; however, their interaction effect was not significant [F(4,1592) = 1.488, p = .212, η2 = .004].
Follow-up analysis of the simple effect is shown in Table 4. The scores on each item in the moving group were higher than those for the static sample, revealing significant differences for “entertainment activities” [F(1,398) = 13.426, p < .001, η2 = .013]. No variance was observed between the two groups for other attributes.
Cognitive Image (N = 400).
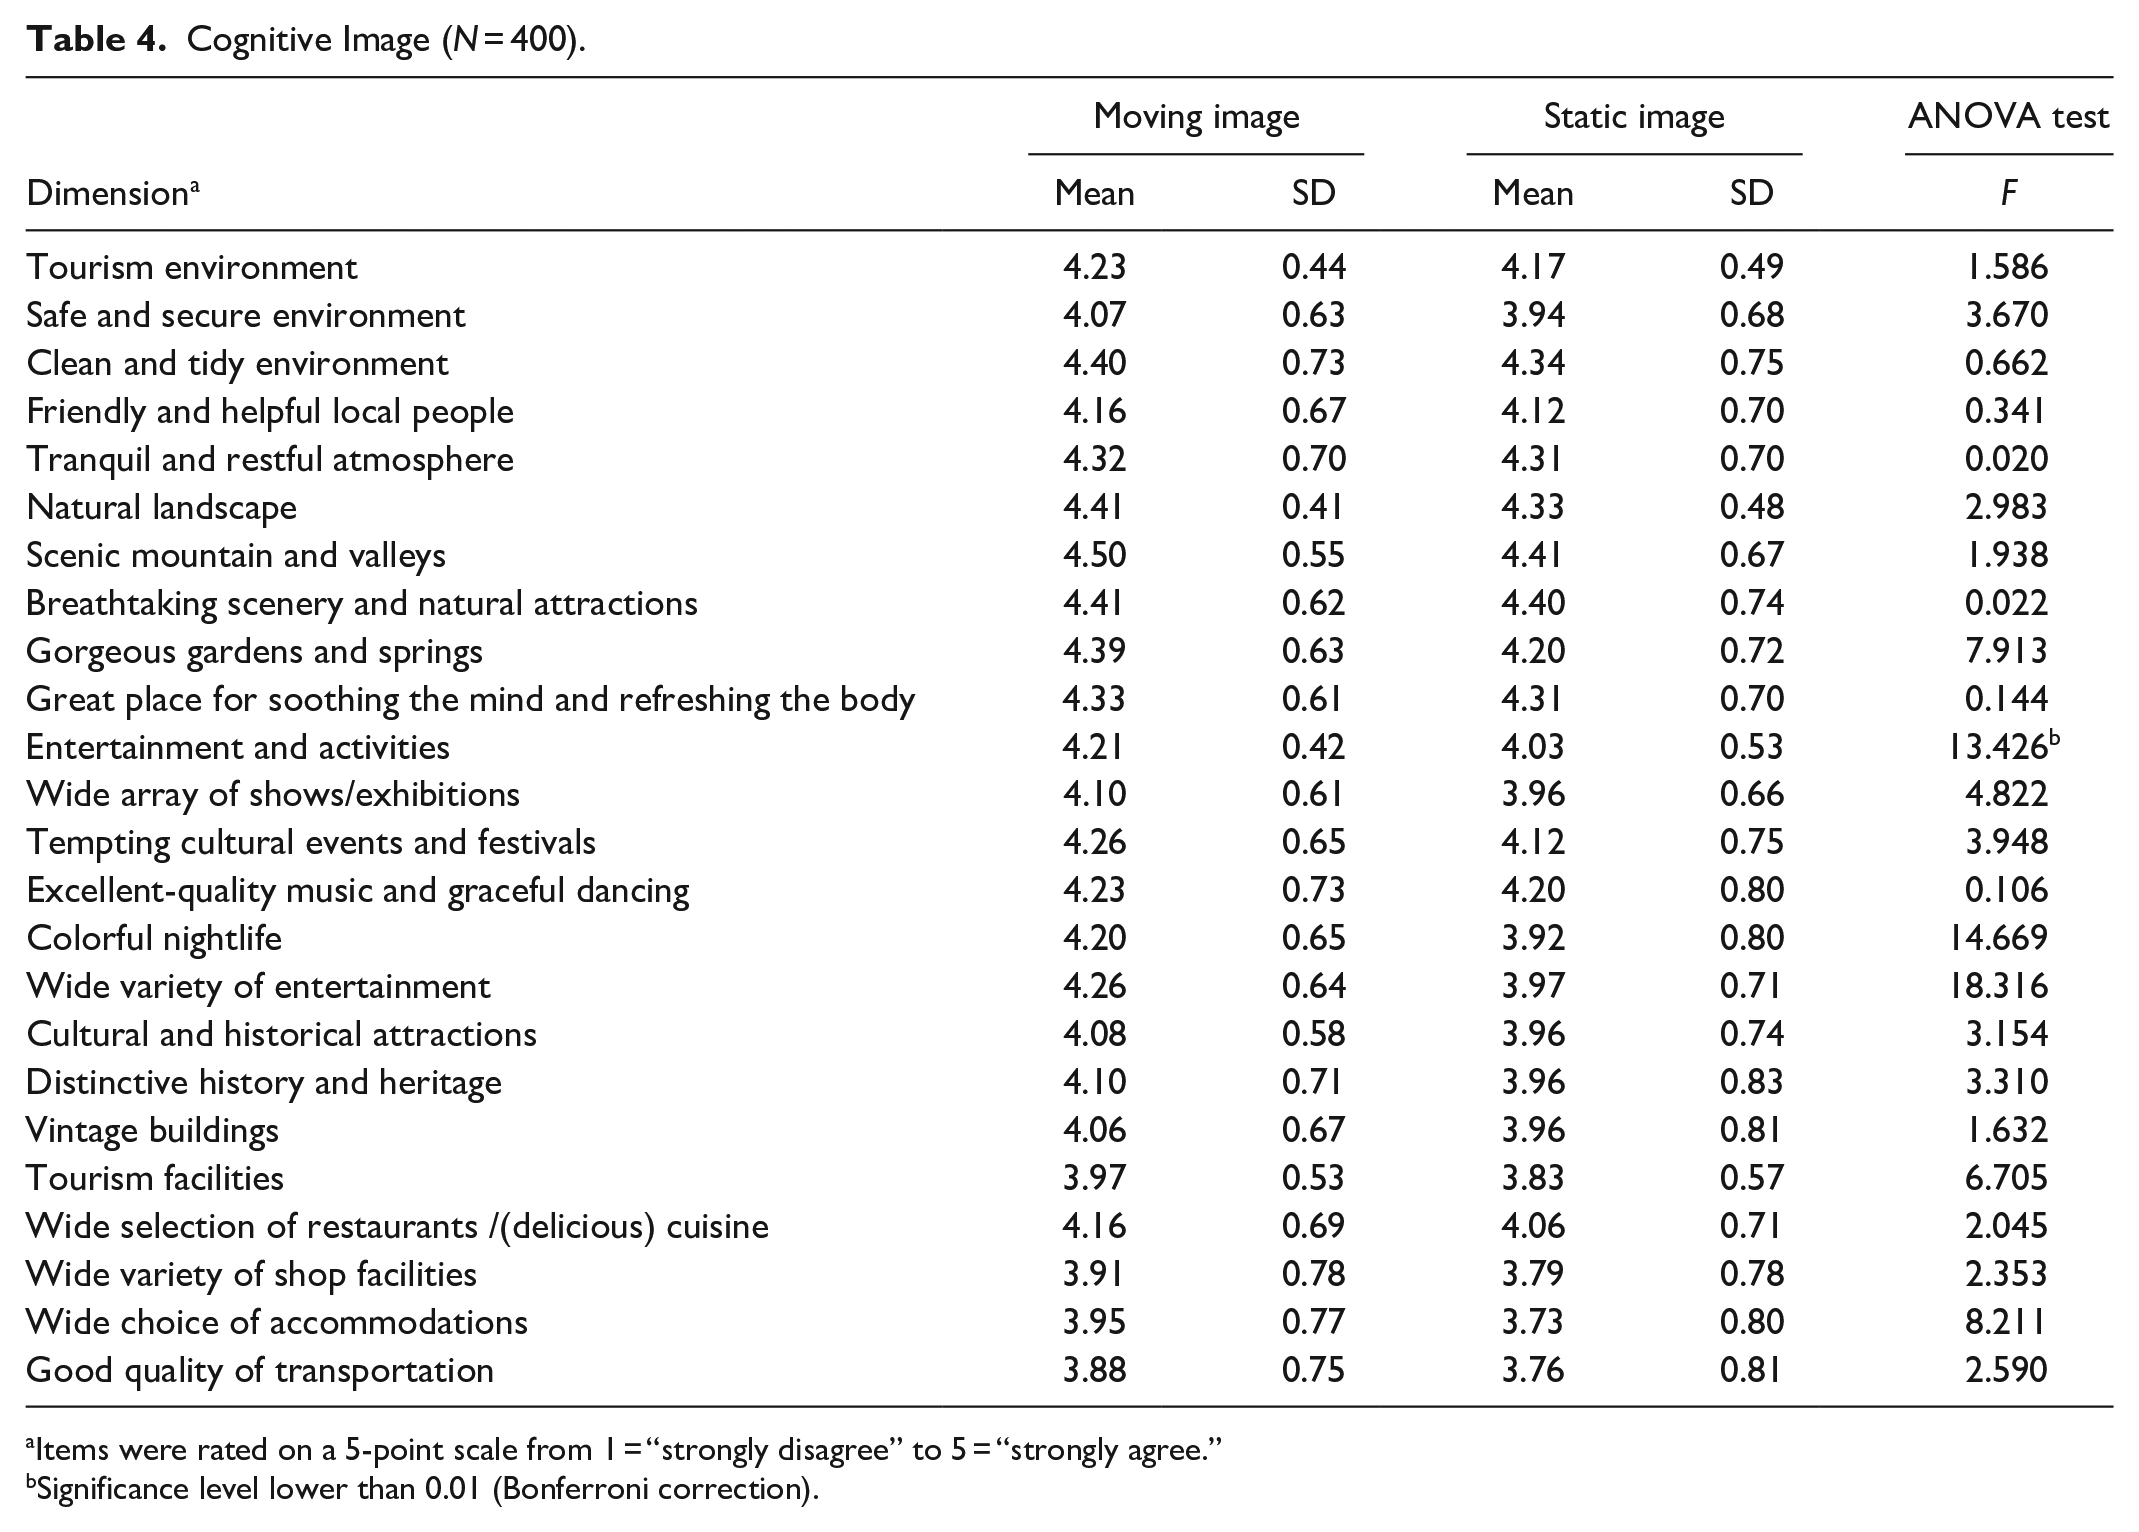
Items were rated on a 5-point scale from 1 = “strongly disagree” to 5 = “strongly agree.”
Significance level lower than 0.01 (Bonferroni correction).
A post hoc analysis (via pairwise comparison) was next conducted on within-variable effects, which demonstrate significant differences among the five categories (p < .001). The item score for natural landscape was significantly greater than the scores for other variables (Figure 2).
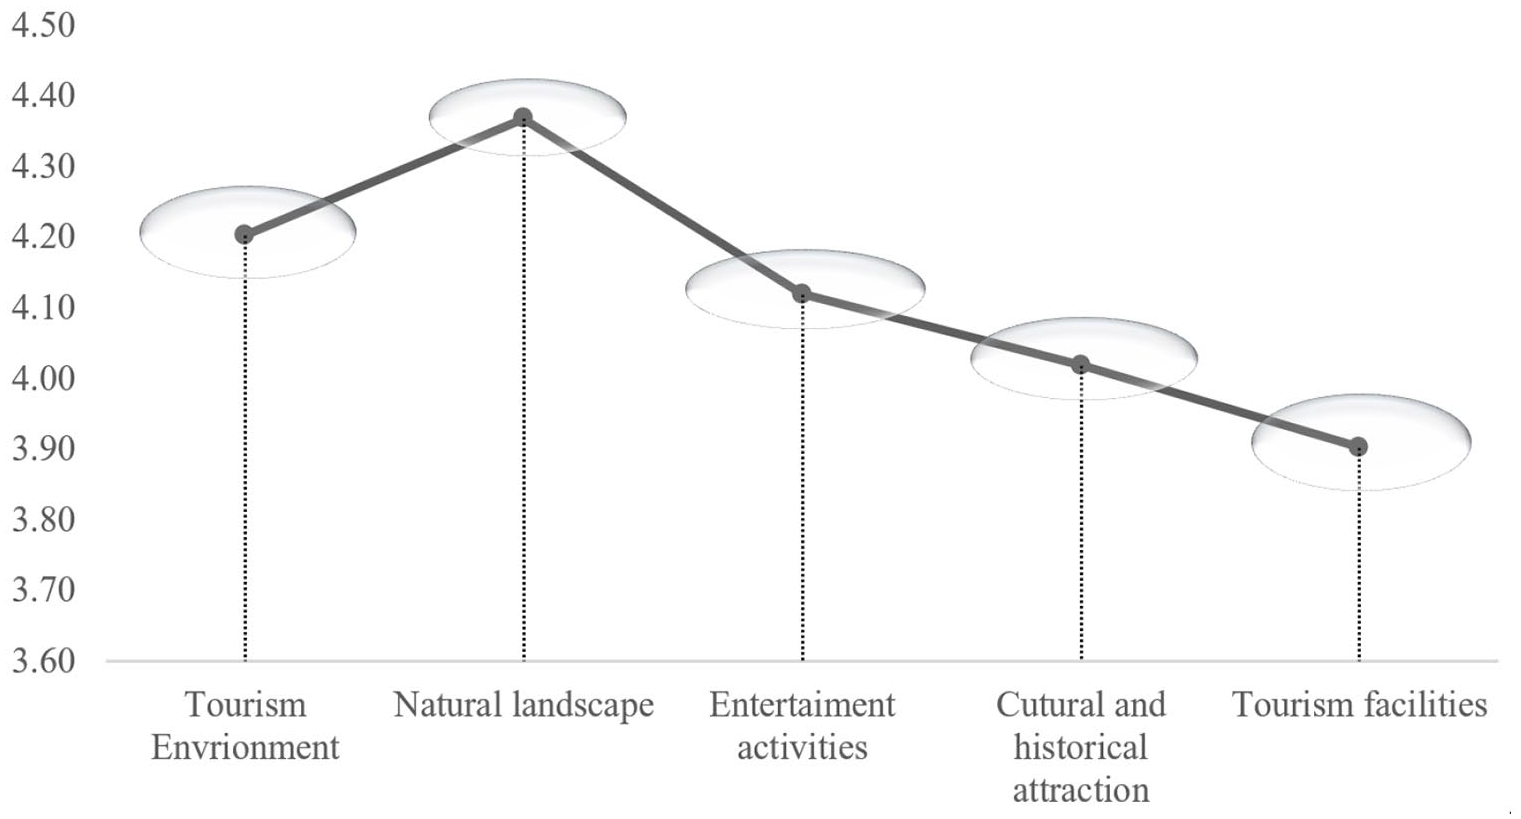
Within-variable effects of cognitive image.
Ultimately, one cognitive image attribute out of five factors showed significant differences between the two groups. Hypothesis 1 was therefore partially supported.
Affective Evaluation
H2: The perceived affective image of a destination will differ significantly between individuals who are exposed to animated GIFs and those who are not
Similarly, a 2 × 4 (visual stimuli × affective image dimension) mixed ANOVA was performed based on a series of tests. Mauchly’s Test of Sphericity showed that the assumption of sphericity was violated. Again, a statistical correction (Huynh-Feldt correction (epsilon (ε) > .75) is adopted. The main effect of visual stimuli [F(1,398) = 8.971, p < .01, η2 = .022], the main effect of affective image [F(3,1194) = 83.171, p < .001, η2 = .173], and the interaction effect between visual elements and affective image [F(3,1194) = 3.532, p < .05, η2 = .009] were each significant.
Table 5 displays the results of a simple effect evaluation for between-group differences in participants’ affective image of Georgia. Bonferroni correction was employed to reduce the probability of Type I error. The alpha level was adjusted to 0.0125 (0.05/4). Overall, the affective image of Georgia photos was somewhat positive. Among the four affective attributes, significant differences appeared on two dimensions: “arousing” [F(1,398) = 6.579, p < .0125, η2 = .036] and “exciting” [F(1,398) = 11.682, p < .0125, η2 = .033]. The remaining affective variables did not present statistically significant differences between the two groups.
Affective Image (N = 400).
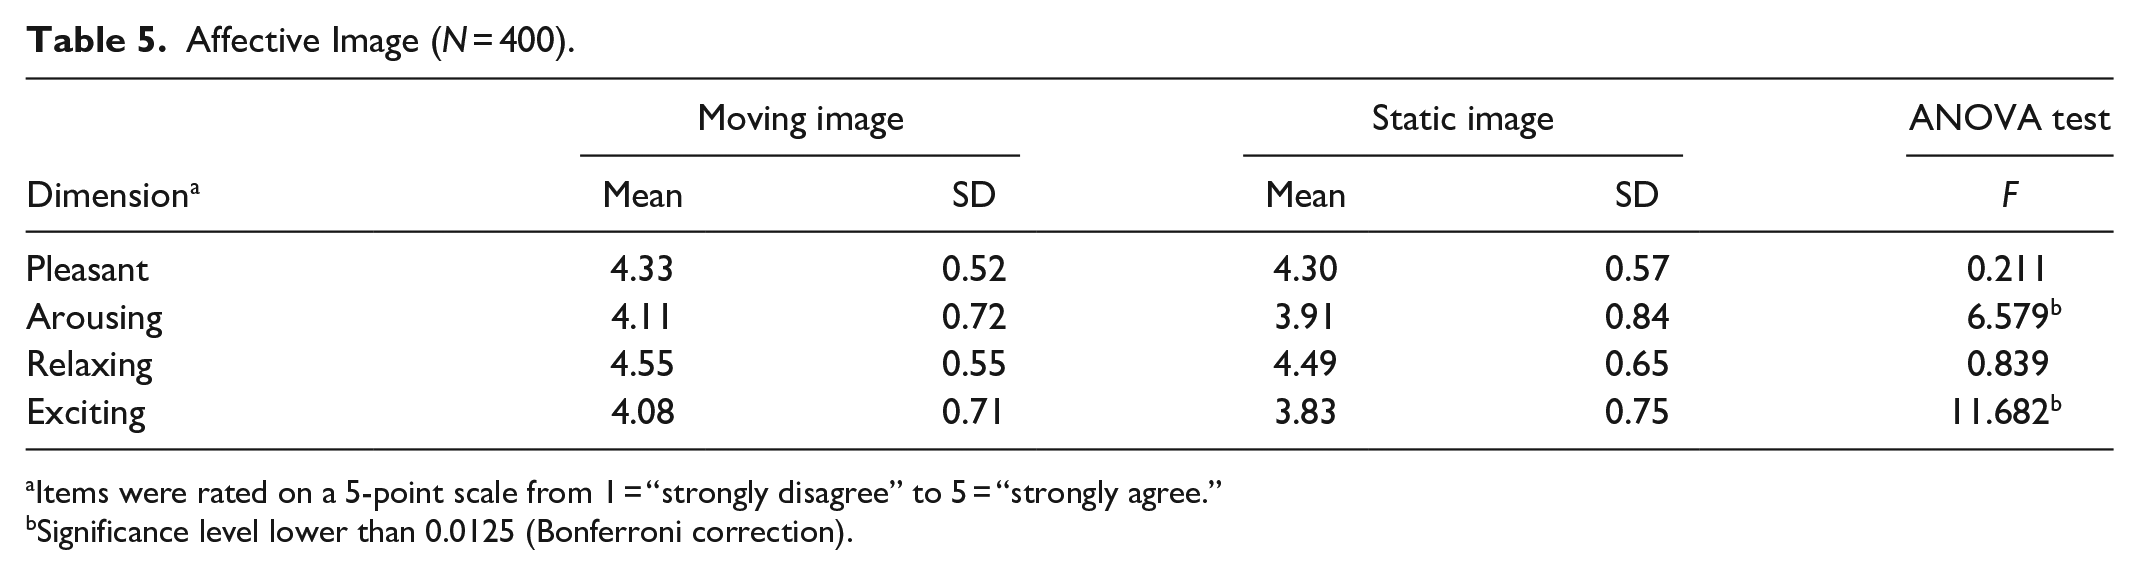
Items were rated on a 5-point scale from 1 = “strongly disagree” to 5 = “strongly agree.”
Significance level lower than 0.0125 (Bonferroni correction).
The results of post hoc analysis (for within-subject variables) are depicted in Figure 3 with factors lying at three different dashed circles suggest significantly different level of the items falling in each round. “Relaxing” was ranked highest; the overall low scores on “arousing” and “exciting” can be explained by the obvious grade distinction for these items between the moving group and static group.
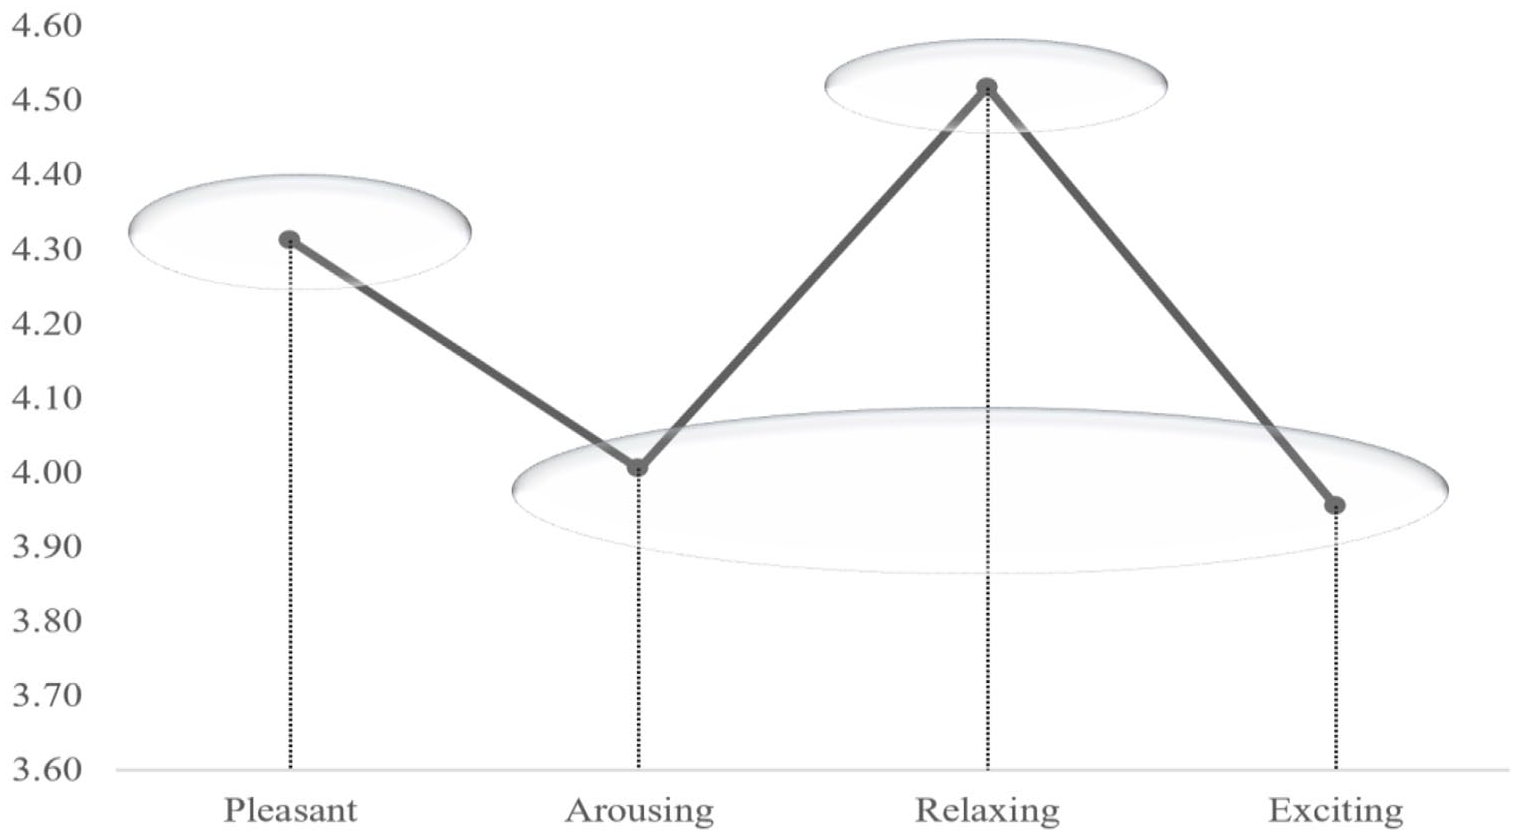
Within-variable effects of affective image.
In summary, because half of the affective variables exhibited significant differences, Hypothesis 2 was partially supported.
Sensory Image
H3: The perceived sensory image of a destination will differ significantly between individuals who are exposed to animated GIFs and those who are not
The same statistical procedure was repeated, confirming the significant main effect of visual stimuli [F(1,398) = 15.093, p < .001, η2 = .037], the significant main effect of sensory image [F(4,1592) = 196.189, p < .001, η2 = .330], and the significant interaction effect between visual elements and sensory perception [F(4,1592) = 4.981, p < .001, η2 = .012].
Sequentially, Table 6 lists the differences in sensory perceptions between the two groups based on a simple effect. After Bonferroni correction, the alpha level was adjusted to 0.01 (0.05/5). Significant differences were found for the senses of sight [F(1,398) = 12.420, p < .001, η2 = .222] and hearing [F(1,398) = 15.832, p < .001, η2 = .275]. Despite slight reductions in the number of sensory words, the gustatory, olfactory, and tactile dimensions did not demonstrate statistical differences. Hypothesis 3 was thus partially supported.
Sensory Image (N = 400).
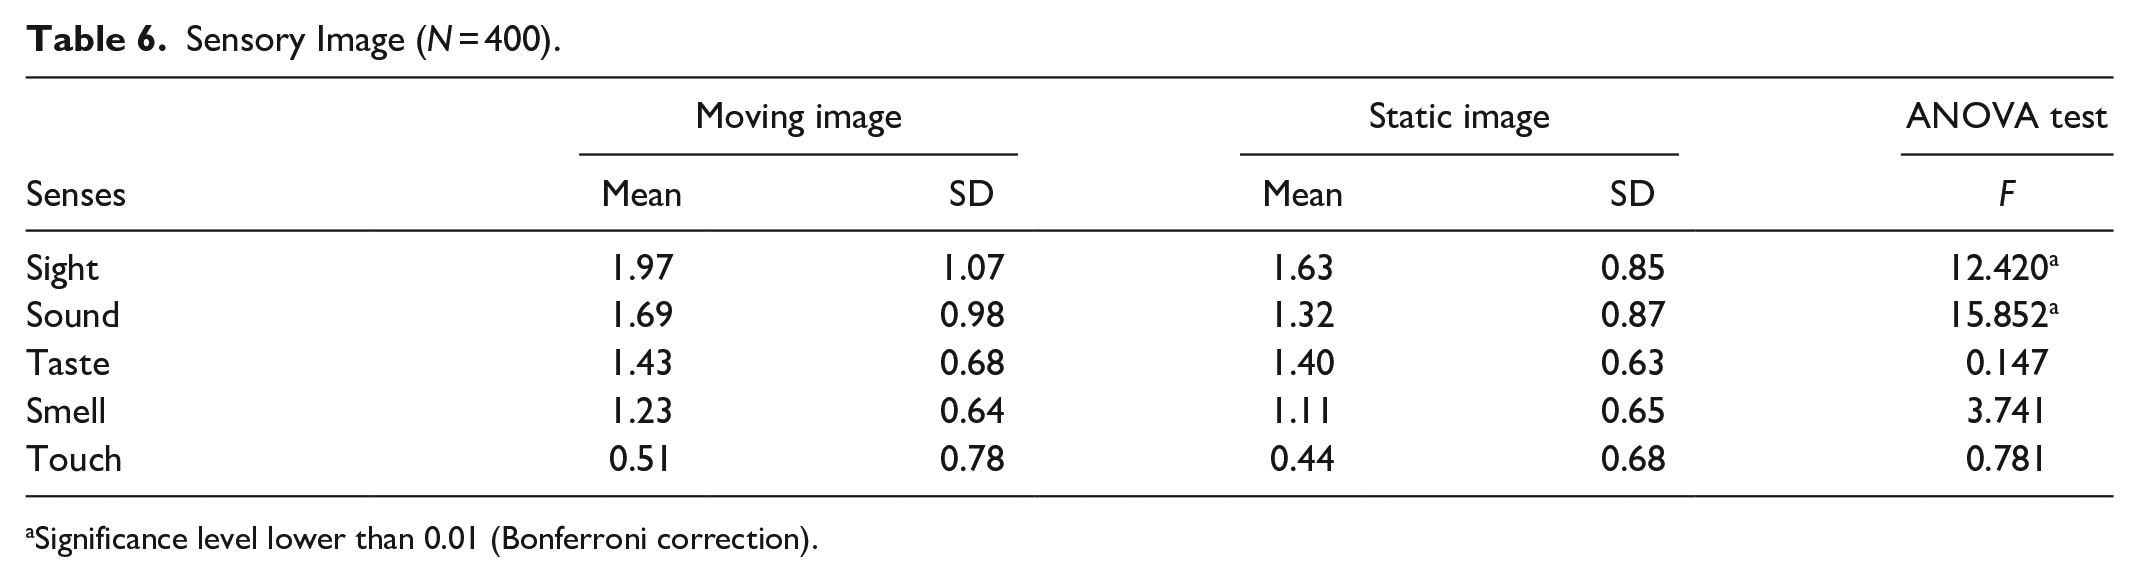
Significance level lower than 0.01 (Bonferroni correction).
Pairwise comparisons for within-subject variables (sensory image) indicated significant differences (ps < .001) for all types of sensory image aside from auditory and gustatory perceptions, which were not significantly different from each other. Unsurprisingly, visual perception was ranked highest (Figure 4).
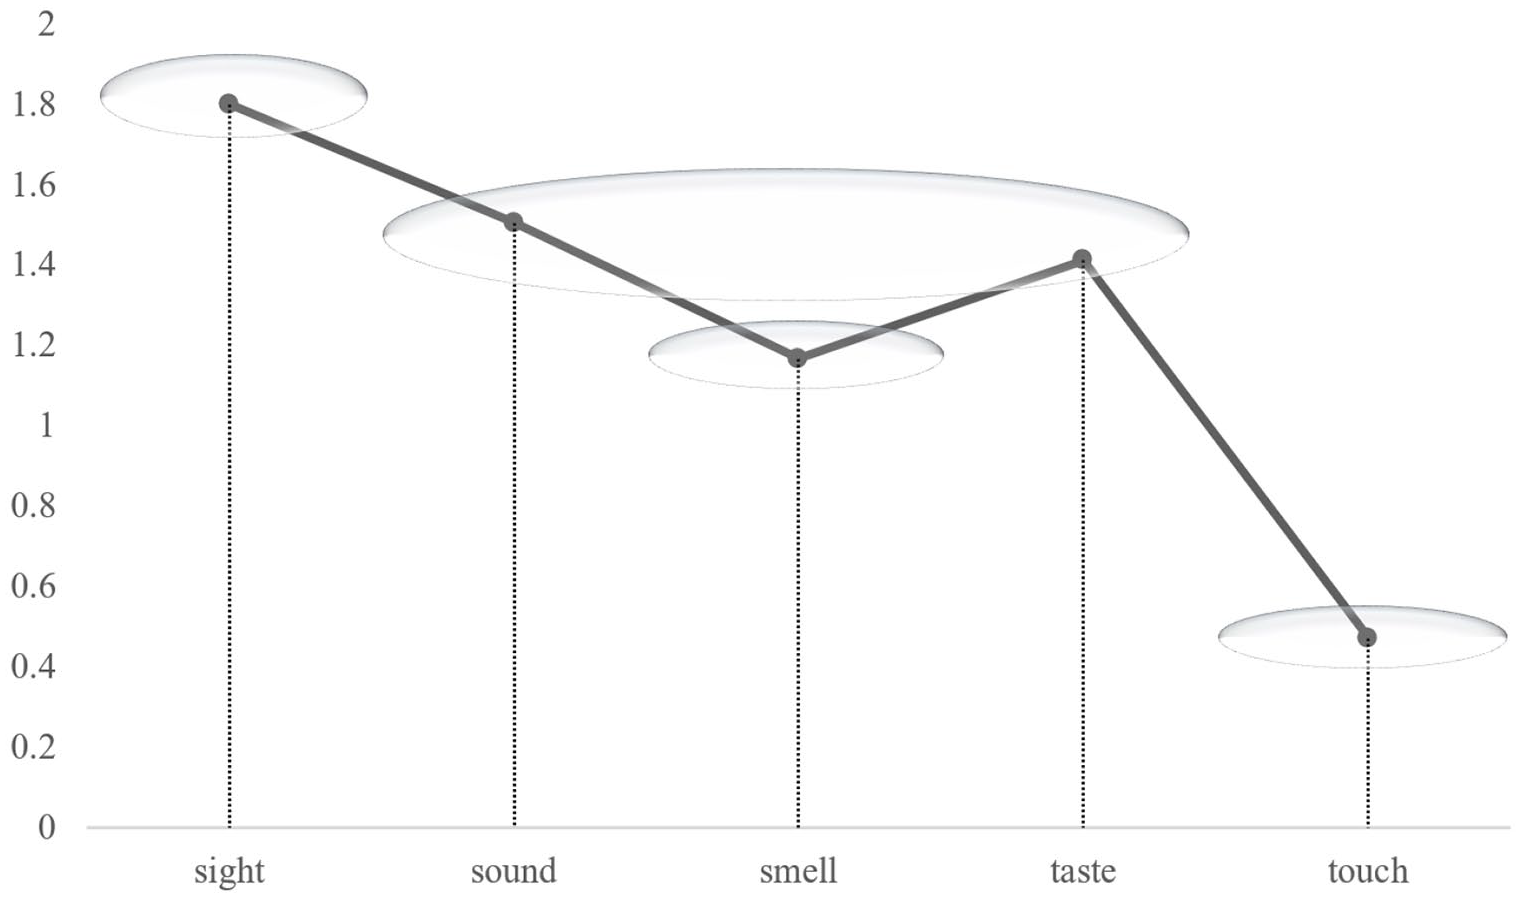
Within-variable effects of sensory image.
To better understand how visual elements elicit sensory perception, the content analysis of open-ended questions is summarized in Table 7 based on different sensory modalities. Numerous terms applied to each sense. To present data more scrupulously, Piqueras-Fiszman (2015) mentioned that a value of 5% or 10% is appropriate among word frequency sets. Table 7 lists the number of words per sense whose proportion exceeded 5% of the total number of participants.
Details of Sensory Image.
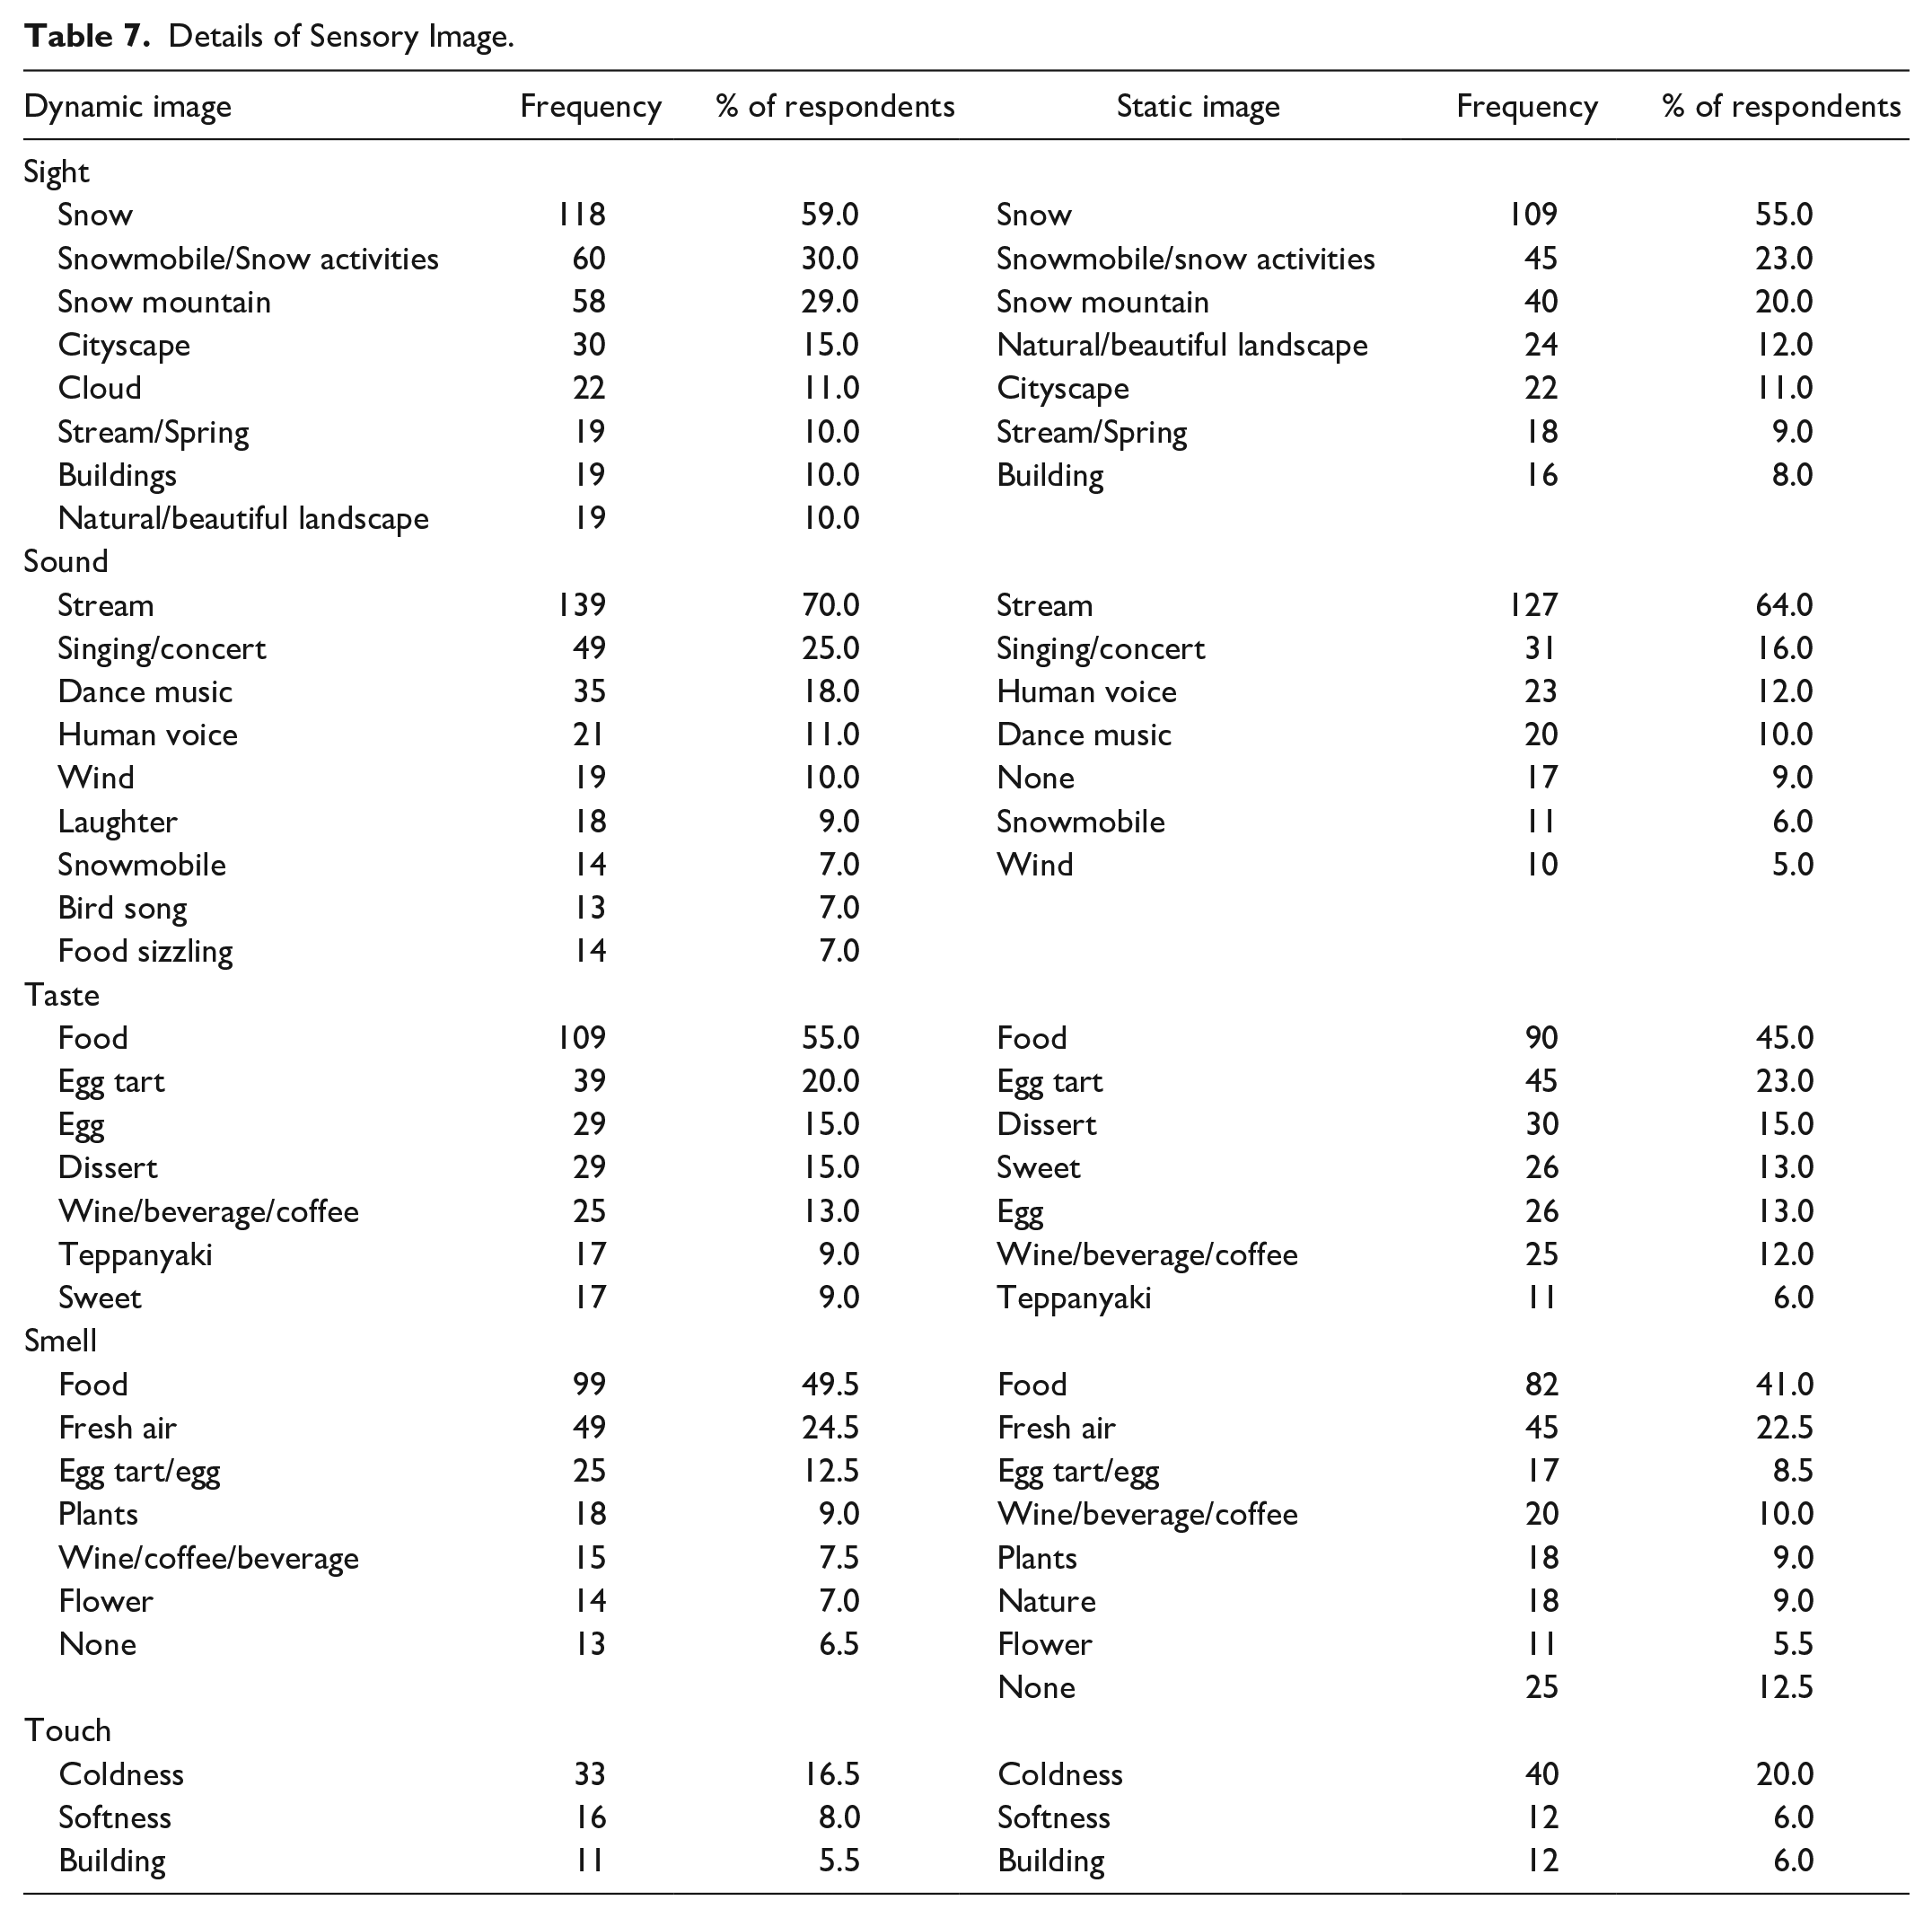
In general, similar to earlier studies (e.g., Agapito, Pinto, and Mendes 2017), visual elements dominated the current sample followed by auditory images, gustatory images, and olfactory images. Haptic sensations attracted the least attention in both groups. As shown in Table 7, visual words in the dynamic group were most diverse and their frequency was highest. The two groups were similar in that snow-related terms (e.g., “snow,” “snow mountain”) accounted for the largest proportion of words. In this case, landscape pictures in the photoset were mainly related to snow, generating the most relevant impression. The frequency of the terms “snow mountain,” “snowmobile,” and “cloud” (which did not appear in the static group’s responses) in the moving group was much higher than in the static sample. The animated effects of these elements were highlighted by some participants in the moving group. In addition, in the original open-ended questions, descriptions from the dynamic group focused on specific moving parts as indicated by the following excerpts:
“Wow! The snowmobile seems excellent and exciting! They drive it at such a fast speed! I am very impressed with it and really want to have a try!”
“The cloud scud across the buildings is very beautiful, and the color is so special. It offers me a sense of relaxation.”
In the static image group, participants tended to describe visual elements in a more general manner, concentrating on the overall atmosphere:
“I think this place is very natural. . .very natural and beautiful landscapes. I feel people have a very happy life here.”
With regard to auditory elements, the most frequent words were similar across both groups: “stream,” “singing/concert,” “dance music,” and “human voice.” An obvious difference was that the number of these words in the first group was substantially higher than that in the static group. One picture in the photoset showed a stream flowing down from a mountain, which presumably called to mind associated images for participants. Some pictures dynamically depicted a concert in which singers and the audience sang along with the beat and dancers performed ballet (Table 1). Moving photos were inherently more impressive when depicting entertainment-related activities. These animated elements seemed to enhance viewers’ impressions and hence elicit more detailed responses.
Additionally, the terms “laughter” and “food sizzling” that appeared in the dynamic group did not emerge in the static sample. Based on participants’ responses, “laughter” corresponded to a concert (Table 1) where people were laughing and screaming. Similarly, the term “food sizzling” was tied to a picture of food grilling on a barbecue (Table 1). Motion therefore seemed to evoke stronger sensory stimuli:
“The food looks very delicious with it sizzling on the pan. Yep, I can almost hear the food sizzling!”
“I think people at the concert are very happy as they are smiling and dancing with the music, so their laughter impressed me a lot. It reminds me of the music festival I took part in last year.”
The third most relevant sensory theme involved gustatory images. Surprisingly, no significant difference was found for this dimension aside from a reduction in the number of taste-related words. The sense of taste is generally food-oriented. In moving images of food, pictures may be difficult to present as clearly dynamic; in most cases, food is static. This circumstance may explain the high degree of similarity in the two groups’ responses. Conversely, when referring to concrete descriptions, participants expressed themselves differently. In this study, food was displayed as steaming and boiling in moving images. These depictions influenced some participants because the pictures offered a livelier feeling:
“The crispy bread is spread with amazing cream cheese. . .the egg yolk in the middle of it. It would be very wonderful to eat the steaming hot bread in the snowy weather.”
“Wow, the sizzling food on the plate must be very delicious! I can imagine the good smell and taste. To be honest, food is a very important factor when I travel, so I pay much attention to food.”
By contrast, respondents in the static group tended to convey their ideas more formally, using statements such as “The food is attractive, I think it will be delicious.” Moving elements appeared to elicit greater emotions from participants.
Regarding the sense of smell, as indicated in Table 7, “food,” “fresh air,” and “egg/egg tart” were the most common sensory images reported in both groups. Olfactory descriptions are highly correlated with gustatory images of food because the senses of taste and smell are closely intertwined with food and drinks (Speed and Majid 2020). Thus, most taste-oriented words are also smell-related (Croijmans et al. 2020). Yet due to the multisensory nature of flavor (e.g., seeing food, the mouthfeel of ingredients), taste tends to be a more vivid sense than smell (Croijmans et al. 2020)—hence the smaller number of words about olfactory images than gustatory impressions in this study.
Finally, the tactile sense attracted the least attention compared with other senses. Several respondents in both groups mentioned that tactile impressions were challenging to describe, as the sense of touch is largely based on actual experience. The most popular words in both groups were identical (i.e., “coldness,” “softness,” and “buildings”). According to participants’ responses, images of snow elicited a sense of “coldness” and “softness” while the term “buildings” arose because participants considered the pictured destination to be a time-honored city whose old buildings they wished to touch. No notable difference emerged between the groups regarding the sense of touch. However, visual elements appeared closely related to tactile features given that snow-related words garnered the most attention among visual images, aligning with the haptic feelings of “coldness” and “softness.”
Discussion and Conclusion
Discussion of Main Findings
By adopting an MIA-informed lens, this study examined how photo formats (moving vs. static) affected individuals’ multifaceted image evaluations as reflected by cognitive, affective, and sensory dimensions. The world is inherently dynamic, hence the need to consider the impacts of moving stimuli (Buratto, Matthews, and Lamberts 2009). Destination is also a holistic concept (Son and Pearce 2005). Visual images alone are not sufficiently appealing to evoke consumers’ interest; instead, destination managers should take sensory image into consideration to enhance visitors’ understanding and knowledge of a destination (Xiong, Hashim, and Murphy 2015).
This study employed a quantitative method to examine differences in two groups of participants’ cognitive image. Findings revealed significant differences in the cognitive factors associated with images of entertainment and activities. These dimensions were presented dynamically in moving images. Dynamic pictures were found to influence viewers’ cognitive evaluations, particularly with respect to entertainment-related activities. Kim and Stepchenkova (2015) identified two types of content in tourism photos: manifest and latent. Manifest content refers to the physical reality presented in images (e.g., buildings) whereas latent content concerns intangible features generated from manifest elements such as the atmosphere. Latent content includes intangible cognitive elements (e.g., modernity) and affective factors (e.g., pleasantness). In this study, cognitive differences revolved around manifest content such as entertainment activities; evaluations were similar for latent cognitive content such as safety, cleanliness, and friendliness. These patterns suggest that moving elements mainly influence participants’ impressions of manifest content in photos.
In addition, the post hoc analysis revealed significant differences among the five categories with “natural landscape” earning the highest score. It is thus possible to infer that, under the influence of visual marketing, natural landscapes serve as the core attraction in arousing potential visitors’ impressive perceptions. Practical guidance can be developed based on this point.
This study also investigated differences in respondents’ affective images. Participants in the dynamic image group experienced more arousing and exciting emotions than participants in the static group. This result aligns with cognitive evaluations in which entertainment activities are significantly different and highly ranked: the term “entertainment” has been shown to evoke thoughts of amusement, excitement, relaxation, and diversion (Oliver and Bartsch 2010). This finding also coincides with previous studies demonstrating that cognitive images can further influence affective evaluation (Wang and Hsu 2010). Moreover, this finding implies that enhanced visual stimuli are closely related to affective responses.
Last but not least, this study posed open-ended questions to explore sensory images between the two groups. Results indicated key differences regarding participants’ senses of sight and hearing. Several valuable findings of this study warrant discussion.
First, in a pre-visit context, moving visual factors can heavily stimulate other sensory images. For example, as shown in the auditory section, participants took particular note of “sizzling food” and “laughter” when dynamically displayed in images; participants in the static group did not. As the most basic and distinctive destination factors, visual elements serve critical functions in enlivening destinations (Urry and Larsen 2011). This pattern corroborates earlier research presenting empirical evidence of the impacts of enhanced visual presentation in evoking other sensory feelings (Haase, Wiedmann, and Bettels 2020; Krishna and Schwarz 2014). This finding also suggests that, in the process of sensory image construction, visuals are the most effective modalities (Lee and Kim 2020).
Second, moving visuals generated perceptions involving more detailed sensory images, whereas static photos produced abstract and general impressions. This discrepancy was reflected in the word-type frequency and description of each sense. Apparently, moving images leave concrete sensory impressions and contain richer information, thus evoking stronger viewer engagement. Static photos tend to shape a location’s overall atmosphere. This finding accords with research underscoring the merits of dynamic stimuli in terms of impression recognition memory and emotion elicitation (e.g., Rakrachakarn and Moschis 2015).
Third, this study revealed the interrelationships between sensory dimensions and other image characteristics. For potential visitors, sensory image seemed to be elicited by cognitive attributes; in other words, several sensory impressions resulted from participants’ cognition (e.g., concerts and singing), which then spurred affective responses. For example, the item of entertainment and activities indicated differences between the two groups. Such variance was also elaborated upon in the sensory section of the questionnaire. This result mirrors that of Huang and Gross (2010), who found that sensory perceptions are likely generated by cognitive images. The outcome also resonates with Nghiêm-Phú and Bagul (2020) in that sensory images influence affective feelings. However, among post-visit and on-site visitors, findings may vary on the basis of actual sensory experiences.
Moreover, in the hearing, tasting, smelling, and touching section of the questionnaire, some participants in both groups (especially in the static sample) mentioned experiencing no related sensations; thus, the information conveyed to viewers may differ from person to person (Kim and Perdue 2011). Speed and Majid (2020) also argued that the language used to describe tactile, gustatory, and olfactory senses has a limited lexicon compared with visual and auditory details. This disadvantage applied in this study as well, such that participants tended to use fewer words to describe their feelings related to touch, smell, and taste. Therefore, in the future, more creative methods may need to be employed to overcome this drawback.
Finally, results shed light on the relationships between types of photos and perceived images. Natural landscape–related photos notably affect viewers’ visual and haptic perceptions, and some aspects of the other three senses (i.e., taste, hearing, and smell) were also generated from this photo type. Georgia’s natural resources therefore represented the most distinct and appealing attraction. Regarding recreation activities photos (i.e., concert), these pictures mainly evoked auditory images and were closely associated with positive emotions. Leisure/tourism activities in this destination thus seem essential to Georgia’s emotional marketing. One’s sense of smell is influenced not only by food but by the natural dimensions which elicit individuals’ olfactory perceptions of fresh air and plants.
By contrast, photos featuring landmark buildings did not demonstrate a marked relationship with viewers’ sensory perceptions. This finding conflicts with that of Buzova, Sanz-Blas, and Cervera-Taulet (2021), who pointed out that architectural sightseeing attracts most visitors’ attention in urban settings. This variance could be explained by the use of different respondents (on-site visitors vs. potential visitors) and research contexts (urban destination vs. overall destination). Place types and market segments thus need to be considered in sensory advertising.
Theoretical Implications
The insights from this study provide several theoretical contributions. First, this work broadens the destination image formation literature by investigating the effects of different photo subjects in multifaceted destination image construction within a pre-visit context. Visual stimulation is the most effective tool to inspire customers’ image perceptions (Stepchenkova and Zhan 2013). However, associated topics tend to lack academic inquiry; most related studies have focused on how tourism photos reflect individuals’ perceptions (e.g., Deng and Li 2018) rather than how various photo formats do so. Even within relevant work, scholars have tended to limit visual stimuli based on photo categories (e.g., nature, food) and the corresponding impact of each on image perception (e.g., Nixon, Popova, and Önder 2017). Few studies have extended visual stimulation to different types of visual presence. Therefore, this study sheds light on the influencing mechanism behind image perception. Findings also enrich the body of knowledge on effective visual marketing, especially for potential visitors in the tourism domain.
Second, this study supplements the growing stream of multisensory tourism research by employing MIA to examine destination image in the pre-visit stage. Research regarding sensory dimensions has predominantly centered on the on-site physical environment (e.g., Agapito, Valle, and Mendes 2014) while findings from the pre-travel stage are few. In addition, the sense of sight dominates the tourism literature to the neglect of non-visual sensory perceptions. This study revealed that, under the psychological mechanism of mental imagery, respondents’ sensory perceptions can be evoked by visual cues. Further, the degree of influence varies across stimuli. Compared with cognitive and affective images, sensory perceptions have been largely ignored in tourism scholarship. The model in this study contained three components. As such, results expand the currently thin sensory image literature and stress the need to consider sensory features in destination branding.
Third, this study provides empirical evidence related to marketing intangible products. Moving visual stimuli have aroused considerable interest in the marketing domain, although much of the focus has been on tangible products. As Zarantonello, Jedidi, and Schmitt (2013) mentioned, the effects of visual stimuli may differ by product type. Intangible tourism products warrant greater attention to draw more nuanced conclusions. This study’s findings can inform the advertising of experiential products, such as those in tourism.
Managerial Implications
This study also offers a number of practical implications regarding the managerial use of moving images. Marketing managers can particularly benefit from these findings when seeking to design compelling destination advertisements online to evoke multifaceted image among potential visitors. First, based on the results regarding photos’ effects on different sensory dimensions, marketing managers can craft effective online advertisements with sensory-enhanced elements (e.g., animated visuals) to compensate for non-visual sensory perceptions. For example, because moving stimuli influence viewers’ auditory image, destination products that feature auditory characteristics (e.g., rippling water) can be presented via animated visual modalities to appeal to consumers’ sense of hearing and evoke interest.
Moreover, these findings highlight that static photos tend to induce individuals’ holistic perceptions of a place while animated visuals evoke concrete images due to moving elements. Practitioners can draw on this result to select different visual modalities tailored to destination and attraction features. Customization should be especially helpful in today’s competitive business environment, where practitioners must engage in creative visual marketing to capture customers’ attention.
Second, considering this study’s findings on cognitive and affective images, destination marketing organizations should capitalize on their destination’s tourism resources to differentiate it from competitors. Marketers could use animated pictures to highlight certain destination attributes on a destination’s website or social media platforms, given that manifest elements were most influenced by moving effects. For instance, in this study, snow stood out as a unique feature of Georgia; therefore, movement-based scenes of snow and snow-related activities should be particularly effective in marketing. Moving images were also found to induce greater excitement among viewers. Thus, to promote attractions that host exciting activities (e.g., amusement parks), marketers should showcase such offerings via dynamic photos. Animated photos should also be accompanied by sensory descriptions to maximize the impacts of these moving pictures.
Third, destination marketing organizations can use dynamic images on their official websites or social media to improve the online ambience and create a sense of immersion, leading to an enjoyable browsing experience for users. Other studies have suggested that including diversified sensory information online can contribute to pleasant website browsing (Lee, Gretzel, and Law 2010). Multimedia images are more vivid than static pictures, and such vividness is an important factor in information processing, especially in web-based environments (Schlosser 2003). Presenting moving images online can capture viewers’ attention and elicit positive emotions, ultimately helping potential visitors form destination impressions even while skimming related information.
In addition, the COVID-19 pandemic has fundamentally altered individuals’ needs and behavior (Gössling, Scott, and Hall 2021). Industry stakeholders must therefore innovate their marketing in order to survive (Wang et al. 2020). Studies have demonstrated that marketing innovations can help mitigate risk during crisis (Naidoo 2010). The pandemic has led people to be isolated at home. Online commerce and marketing have thus become crucial for companies (Wang et al. 2020). Accordingly, this study provides fresh insight into managerial use of a rarely adopted visual modality in tourism—animated GIFs—in destinations’ sensory marketing given the popularity of mobile devices amid the pandemic.
Last but not least, many people have experienced depression, anxiety, and loneliness during national COVID-19 lockdowns (Bu, Steptoe, and Fancourt 2020). Online entertainment such as virtual travel has become vital in enriching one’s otherwise dull everyday life (Kwok and Koh 2021). COVID-19 has also changed businesses’ operations and people’s evaluations of places (Sigala 2020). Corresponding strategies, such as adding or eliminating sensory elements in pictorial modalities, can enhance individuals’ hedonic engagement and comply with customers’ expectations. Adopting animated GIFs as a form of visual presentation can reconstruct destinations’ online servicescape and subsequently affect individuals’ interests, emotions, and attitudes.
Limitations and Future Research
Several limitations of this research could inspire future work. First, although this study intended to maximize the effects of tourism photos, the researchers did not consider actual situations. Image formation is an ongoing process colored by numerous personal factors and information sources (Kim and Kerstetter 2016). For example, when people deliberately search for a specific destination they plan to visit, their perceptions of this place may differ from those of individuals who view such photos at random. Therefore, future studies should incorporate diverse scenarios to obtain more comprehensive findings.
Second, because this study focused exclusively on Chinese participants, cultural differences were not taken into account. Similarly, this research only included Georgia as a destination; different destination characteristics may result in varied responses. These findings therefore cannot be generalized to all destination settings. As Son and Pearce (2005) noted, viewers’ cultural backgrounds strongly influence destination image. Subsequent research should assume a cross-cultural perspective by covering a larger number of regions and destination types.
Third, this study adopted open-ended questions to capture participants’ sensory image, as was done in several other studies (e.g., Agapito, Valle, and Mendes 2014). However, participants’ abilities to express themselves and to write can affect their responses to open-ended questions—particularly when discussing nuanced gustatory, olfactory, and tactile sensations or when responding in one’s non-native language. In the future, scholars should apply more creative methods to gather detailed sensory information from respondents. In addition, because self-report data (as used in this study) suffer from specific disadvantages, future research can employ other approaches (e.g., neuroscience equipment) to gain more insight.
Footnotes
Declaration of Conflicting Interests
The author(s) declared no potential conflicts of interest with respect to the research, authorship, and/or publication of this article.
Funding
The author(s) disclosed receipt of the following financial support for the research, authorship, and/or publication of this article: This paper is funded by the National Natural Science Foundation of China (Project No. 41871139).