
Abstract
This study develops and tests a novel destination brand equity model and compares its validity with Aaker’s brand equity model, which is popular in tourism. The data were collected in Indonesia (n = 250) and the United Kingdom (n = 246). The results confirm validity and hierarchical structure of the destination brand equity model. The destination brand equity model has seven dimensions: brand awareness, physical quality, service interaction quality, brand self-congruence, brand identification, destination brand trust, and destination brand loyalty. The first five brand equity dimensions exert positive influences on destination brand trust and destination brand loyalty. The findings show that the psychometric properties of the destination brand equity model outperform Aaker’s model. The study discusses theoretical and practical implications of the destination brand equity model for destination marketing and management.
Keywords
Introduction
Destination brand equity is a set of value-driven assets (or liabilities) added to visitors’ perception of destination brand image. Similar to destination image, destination brand equity has cognitive (i.e., brand awareness, brand quality), affective, and conative components (i.e., behavioral intentions). Recent reviews of the literature suggest that destination brand equity development and assessment are popular trends in tourism (Rojas-Lamorena, Del Barrio-García, and Alcántara-Pilar 2022; Ruiz-Real, Uribe-Toril, and Gázquez-Abad 2020). Destination marketing and management organizations (DMOs) are becoming increasingly aware of the value of destination brand equity because it contributes to destination brand image, destination positioning and destination competitiveness (Baker 2019).
Although various brand equity models have made their way into tourism scholarship, conceptualizations and measurements of destination brand equity are highly fragmented (Hyun and Kim 2020; Kotsi, Pike, and Gottlieb 2018). Aaker’s (1991) consumer-based brand equity (CBBE) model with four dimensions (or intangible assets)—brand awareness, perceived quality, brand associations, and brand loyalty—has been frequently applied to destination brands (Konecnik and Gartner 2007; Kotsi, Pike, and Gottlieb 2018). However, the validity of Aaker’s model has been questioned. Hyun and Kim (2020) argue that the external validity of the model is limited because it was developed using one sample in the USA. Multiple samples are required to establish its validity across different cultures. Interestingly, Washburn and Plank (2002) showed that when the CBBE model was applied to other cultures, brand associations, brand awareness, and brand loyalty merged into one. They recommended that the construct validity of the CBBE model should be assessed using different samples. Another concern was that Aaker’s (1991) definition of brand equity is product oriented (i.e., consumer packaged goods or corporate brands) reflecting the manager’s (i.e., company) rather than the consumer’s perspective.
In tourism destination settings, the validity of Aaker’s (1991) CBBE model was also questioned as applications of Aaker model required substantial adjustments to accommodate the tourist’s point of view (Boo, Busser, and Baloglu 2009; Tasci 2018). Destination is a “container or stage for activity-based products as well as being a product itself” (Ashworth and Voogd 1994, p. 43). Rather than being a mere commodity, the destination brand includes utilitarian (cognitive) and hedonic (affective) oriented visit experiences (Chan and Marafa 2018). The nature of the interaction between the tourist and destination facilities (i.e., the quality of the physical environment, attractions, and ambiance), destination providers (i.e., the quality of the service delivery) is essential for destination brand equity. Therefore, it is questioned whether Aaker’s (1991) CBBE model developed for product brands is transferable to destination brands, which have highly complex entities (i.e., an amalgamation of goods, services) and values contributed from different stakeholders (Saraniemi and Kylänen 2011).
The aim of the study is two-fold. Firstly, it is to introduce and test a novel destination brand equity model, and secondly to compare the validity of the destination brand equity model with that of Aaker’s (1991) CBBE model from a tourist’s point of view. Aaker’s model was chosen because it is the most frequently applied brand equity model in tourism (Chekalina, Fuchs, and Lexhagen 2018; Hyun and Kim 2020). Our research makes four contributions to the destination branding literature. First, drawing on the CBBE, perceived value, service quality, self-congruence, and destination image research, we introduce an alternative destination brand equity model. The destination brand equity model differs from Aaker’s (1991) model, as it includes destination-specific brand equity dimensions from a tourist’s point of view. The destination brand equity model has three utilitarian dimensions—brand awareness, physical quality, and service interaction quality; two hedonic (symbolic) dimensions—brand self-congruence and brand identification; a mediator—destination brand trust; and a behavioral outcome—destination brand loyalty.
Second, the study advances understanding of the ongoing debate about the nature of the hierarchical relationships among brand equity dimensions and the effect of brand awareness on destination brand loyalty. This is important because brand awareness, a key component of destination brand equity, is often mixed with brand associations, replaced with brand familiarity, excluded from destination brand equity and even found to have no influence on destination brand loyalty (Nam, Ekinci, and Whyatt 2011; Tasci 2018; Yoo and Donthu 2001). Third, the study examines the role of destination brand trust in destination brand equity. Previous scholars argue that brand trust is essential for developing long-term business relationships between tourists and destination providers (Han 2013; Kumar and Kaushik 2017; Su, Hsu, and Marshall 2014). Brand trust fosters destination competitiveness and destination brand loyalty. Su, Lian, and Huang (2020) argue that destination brand trust influences tourists’ intention to visit a destination. However, destination brand trust has not been fully incorporated into the existing destination brand equity models (Dedeoğlu et al. 2019). Our research, therefore, examines direct and indirect effects (mediating role) of the destination brand trust on destination brand loyalty.
Fourth, the study examines the external validity of the destination brand equity model and compare its validity with that of Aaker’s (1991) CBBE model in two different cultural settings: Indonesia and the UK. This is important because research on measuring destination brand equity in Asian and European destinations is limited. As stated by Kladou, Giannopoulos, and Mavragani (2015, 189) “destination brand equity appears as a rapidly conceived concept, borrowed from traditional (corporate/product) branding theory, while discussions on its definition and measurement are still in progress and have yet to mature in a multidisciplinary context.” Therefore, it is important to assess which brand equity model performs better in predicting destination brand loyalty and destination overall brand equity in highly competitive tourism markets.
This article is organized as follows. First, a review of brand equity research in tourism is provided. Second, the conceptual foundation of the study and the research hypotheses are discussed. This is followed by testing the validity of the destination brand equity model and comparing its validity with Aaker’s (1991) CBBE model in two cultures. Finally, the study concludes with implications for destination marketing, management practice, and future research.
Literature Review and Conceptual Foundation
“A brand represents a unique combination of product characteristics and added values, both functional and non-functional, which have taken on a relevant meaning that is inextricably linked to the brand awareness of which might be conscious or intuitive” (Morgan, Pritchard, and Piggott 2002, 335). According to Cai (2002, 723), destination brands are “perceptions about the place as reflected by the associations held in a tourist’s memory” through which the destination is both identified and differentiated from other places. Brand equity measurements in tourism settings have emerged in the past two decades because of the brand equity’s practical implications for destination branding and destination brand development. As brand equity is multidimensional and investigated from the consumer’s point of view, destination brand equity is frequently assessed through Aaker’s (1991) CBBE model. However, there is no consensus on the measurement of destination brand equity and the hierarchical relationship among brand equity dimensions in tourism (Dedeoğlu et al. 2019; Tasci 2021). Furthermore, adaptations of Aaker’s (1991) brand equity model to destination settings are highly fragmented, inconclusive and often confusing as shown on Table 1.
Research on Customer-Based Brand Equity (CBBE) in the Tourism Destination Marketing Literature.
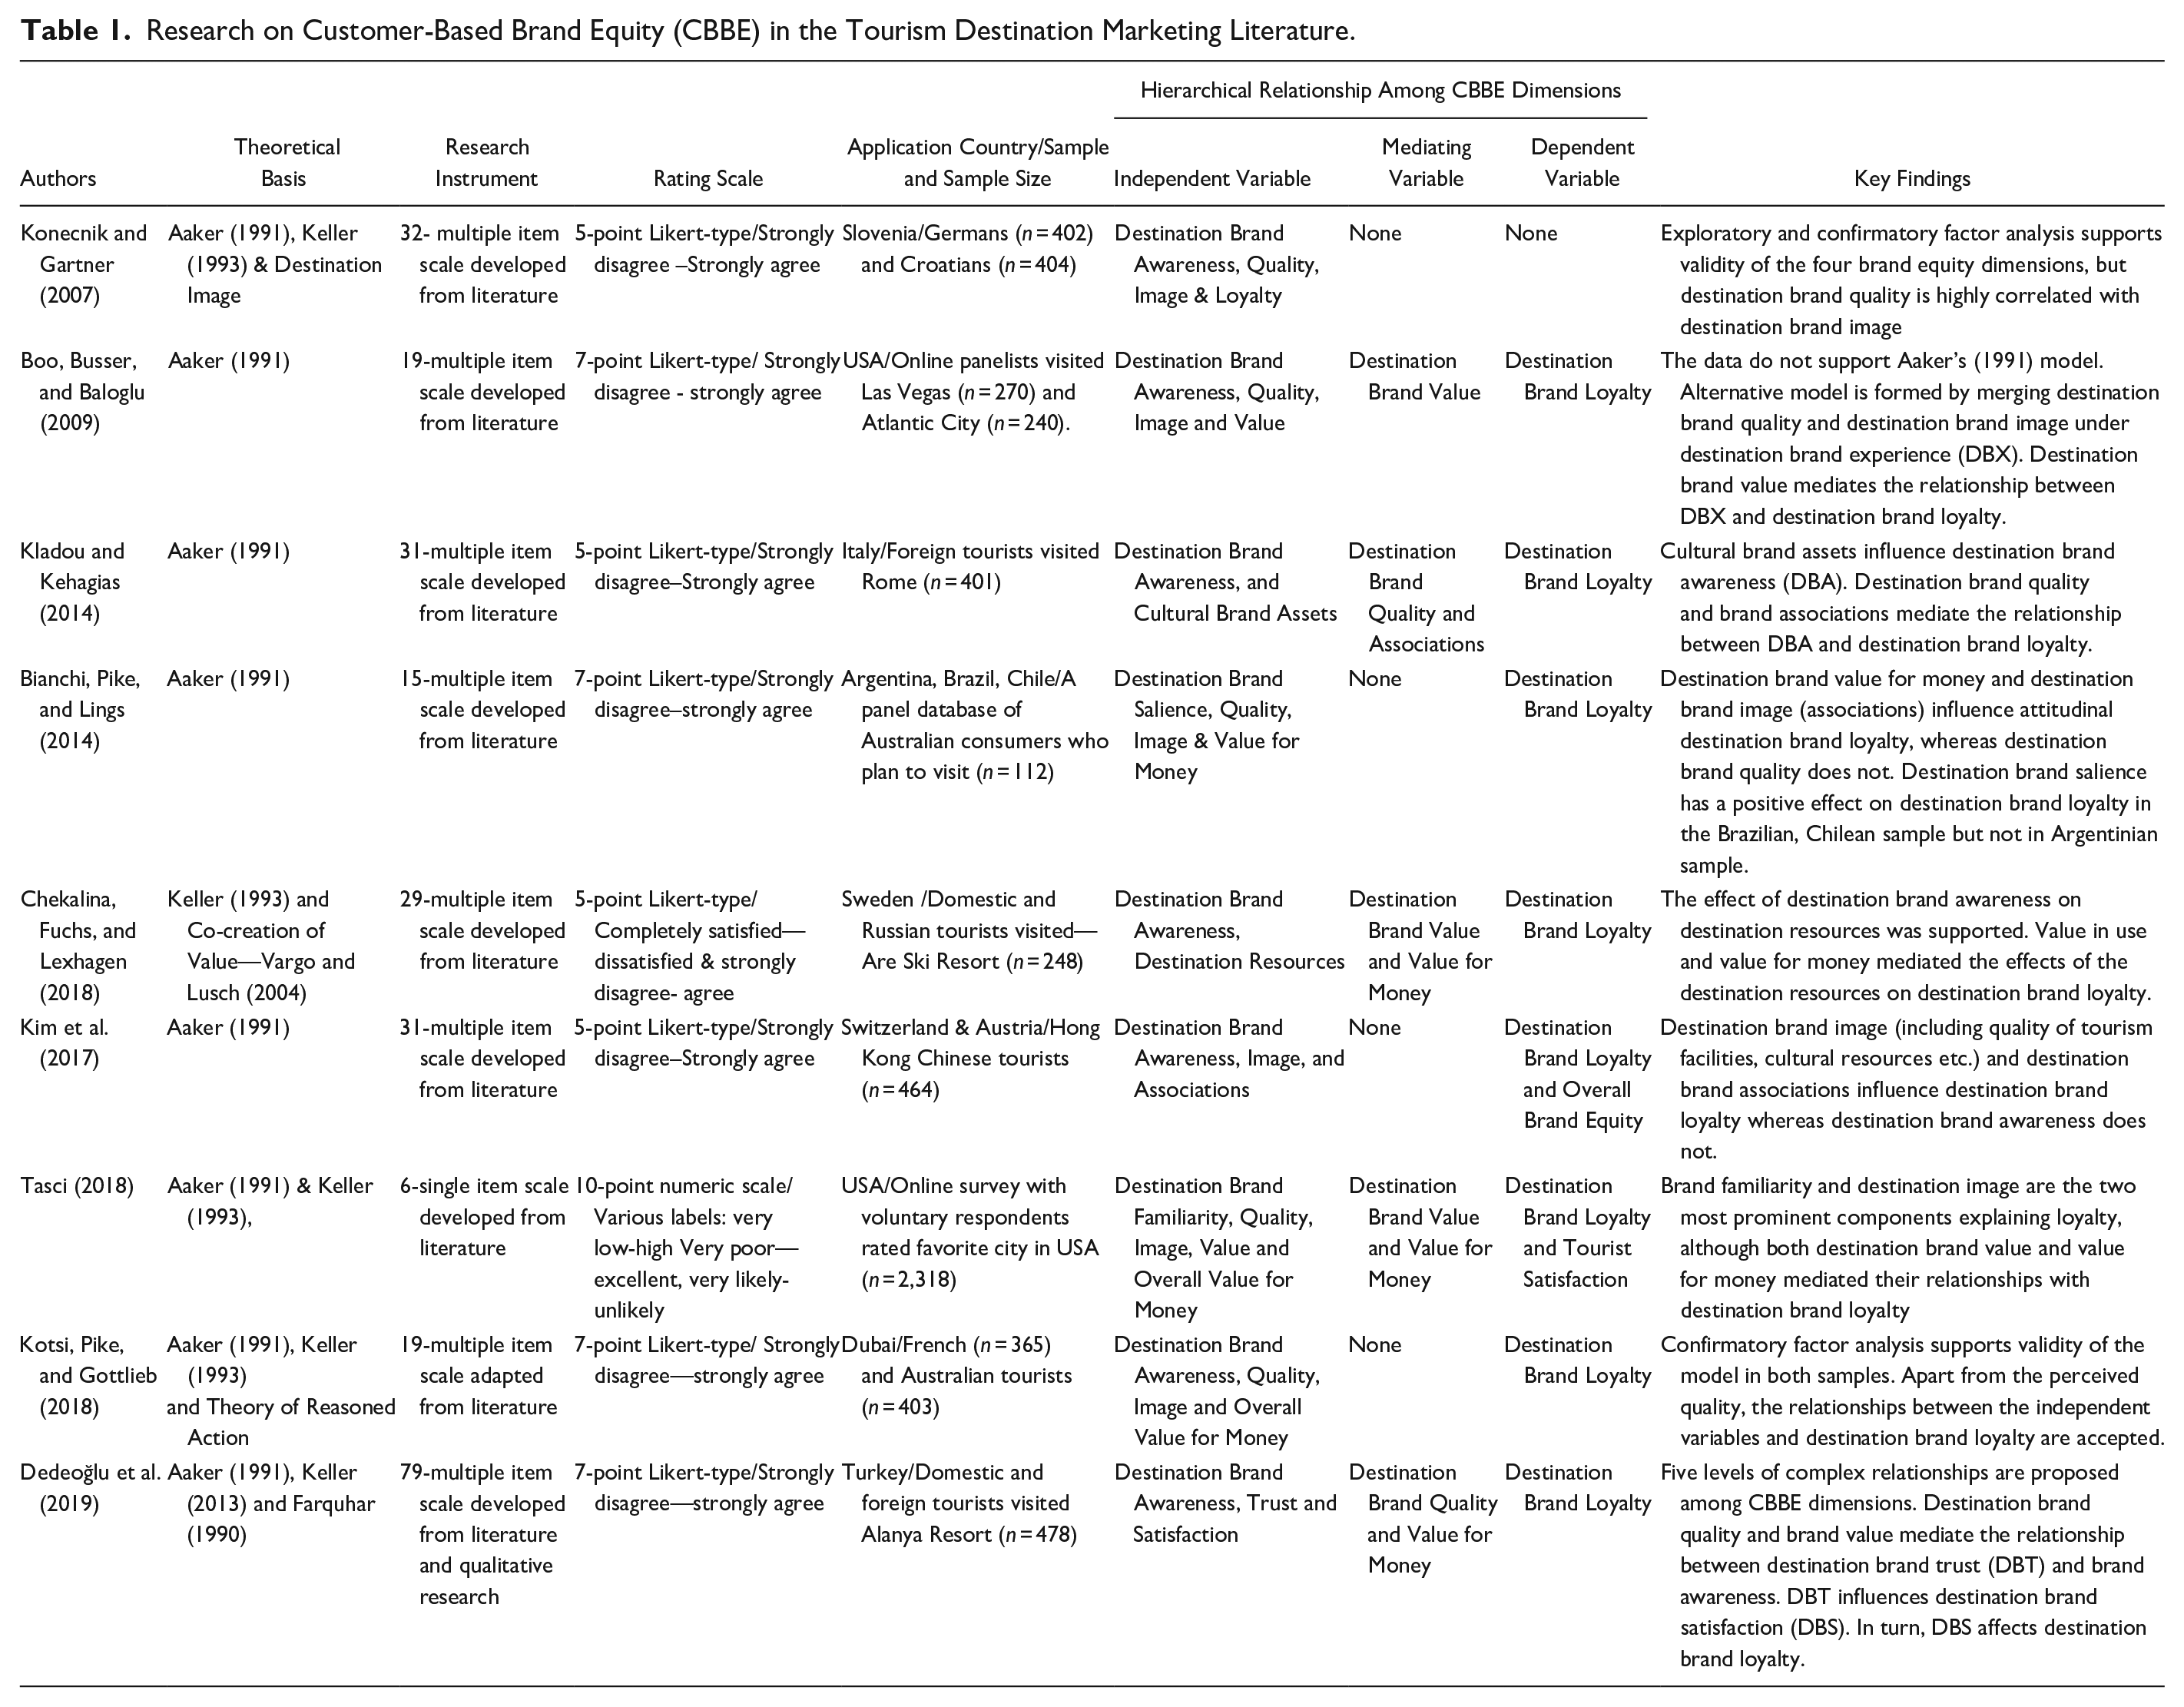
Nevertheless, several conclusions can be drawn from destination brand equity research in tourism. First, most of these studies use Aaker’s (1991) CBBE model as a framework for the measurement of destination brands. They often incorporate destination image and perceived value into Aaker’s model. However, measurement of destination image is mixed with destination brand value, perceived quality, and destination personality (Kotsi, Pike, and Gottlieb 2018). Second, measurements of destination self-congruence and destination personality have mixed and created confusion rather than achieving conceptual clarity. It is important to acknowledge that self-congruence, destination personality, destination brand image, and destination brand value are distinct. Hence, they should be defined and assessed separately with appropriate measurements to draw valid conclusions for destination marketing theory and management practice.
Third, definitions of the core brand equity dimensions (e.g., brand awareness, perceived quality) and their hierarchical relationships with potential outcomes such as destination brand loyalty, value for money, and destination brand satisfaction have varied, caused confusions and often produced inconclusive results (e.g., Bianchi, Pike, and Lings 2014; Boo, Busser, and Baloglu 2009; Chekalina, Fuchs, and Lexhagen 2018; Kim et al. 2017; Tasci 2018). Fourth, destination brand equity studies do not distinguish between “value in use” and “value in exchange,” although they are theoretically different concepts. According to Aaker (1991), brand equity dimensions refer to value in use as in product benefits (e.g., perceived quality and brand awareness), whereas value for money can be an outcome of brand equity. Finally, to the best of our knowledge, few studies have incorporated destination brand trust into brand equity research (Dedeoğlu et al. 2019). Chaudhuri and Holbrook (2001) define brand trust as “the willingness of the average consumer to rely on the ability of the brand to perform its stated function” (p. 82). Lassar, Mittal, and Sharma (1995) include brand trust as a key dimension of CBBE due to its ability to create relational value. Lee and Back (2008) find that brand trust mediates the effect of brand knowledge on attitudinal brand loyalty. Therefore, destination brand trust is important for destination brand equity, although its role has not been fully investigated in tourism (Williams and Baláž 2021).
Proposed Destination Brand Equity Model
Drawing on Holbrook and Hirschman’s (1982) ontology of the consumption experience, we propose an alternative destination brand equity model. Given that destination brand experiences are formed with a mix of value-driven goods (tangibles) and services (intangibles), the destination brand equity model includes seven brand equity dimensions: brand awareness, physical quality, service interaction quality, brand self-congruence, and brand identification, brand trust and brand loyalty. As shown in Figure 1 (Model 1), destination brand trust is a mediator, and destination brand loyalty is an outcome variable.
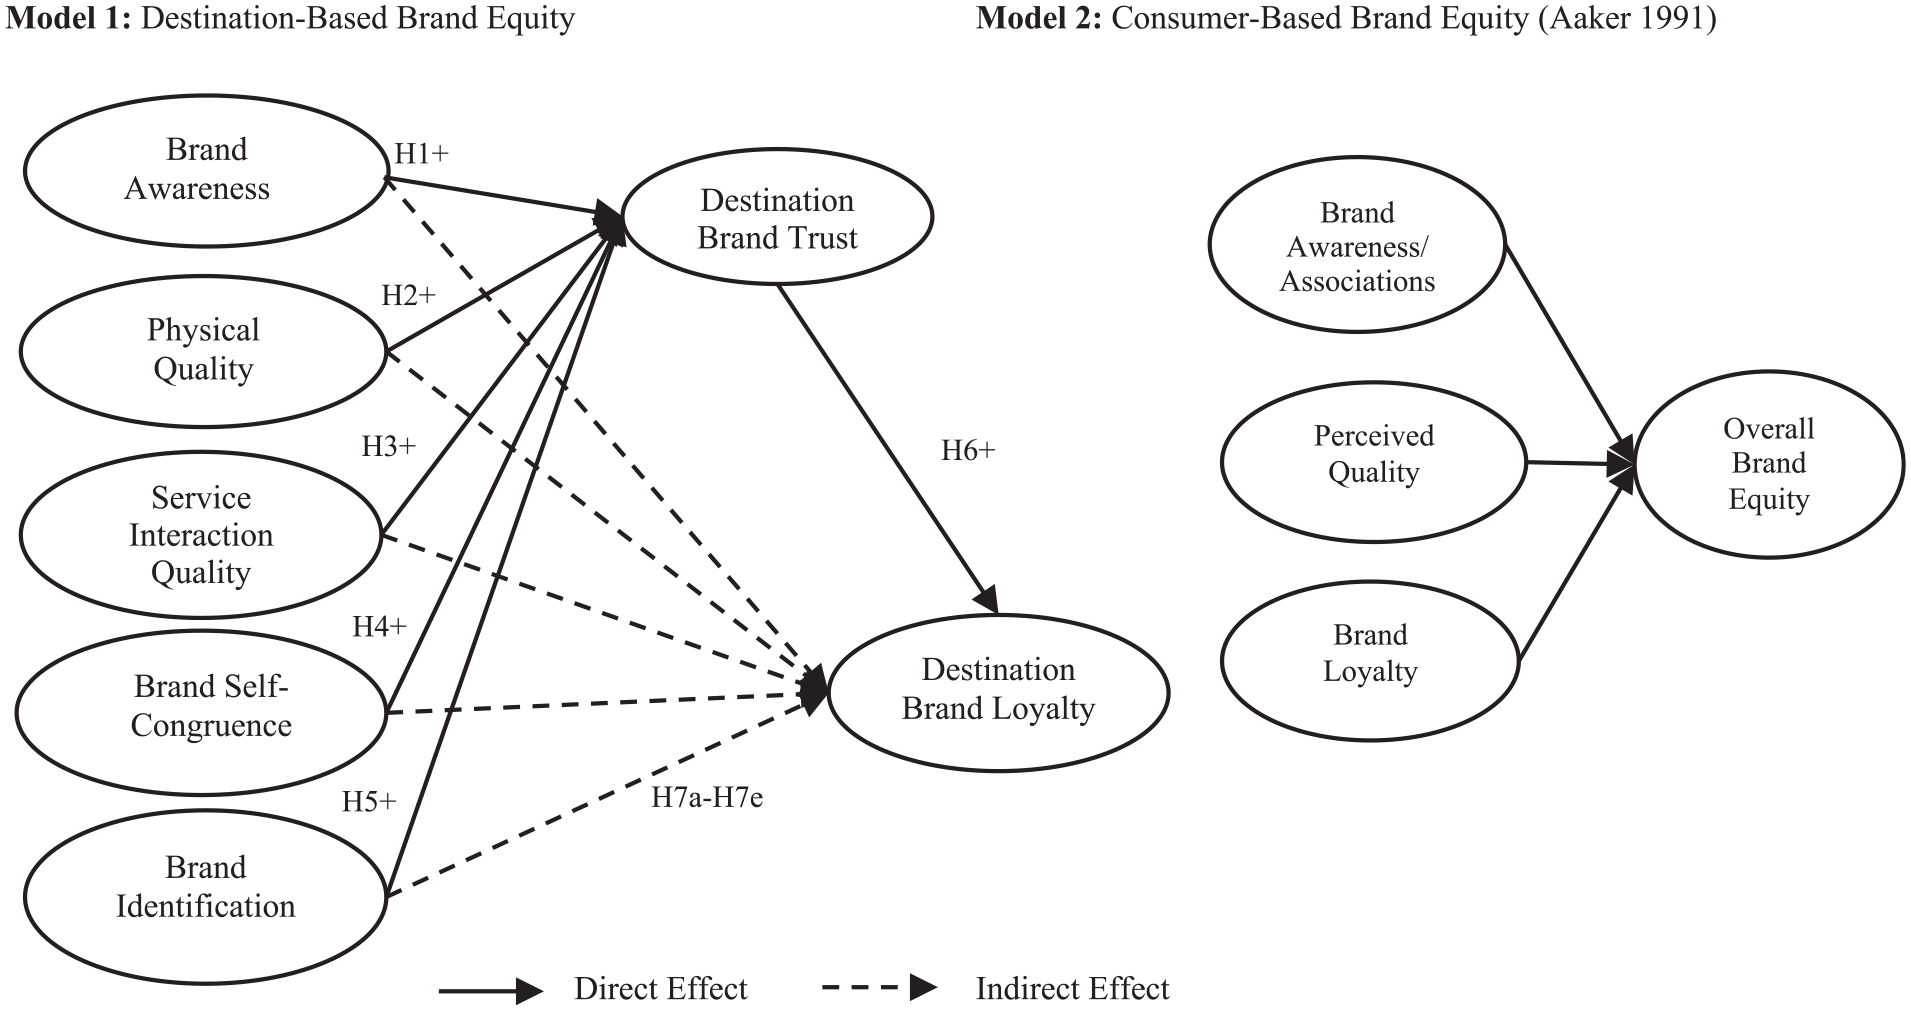
Two Competing Models of Consumer-Based Brand Equity in Tourism Research.
Holbrook and Hirschman (1982) advocate two types of product consumption experiences: utilitarian and hedonic. Successful destination brands can satisfy the tourist’s basic (i.e., accommodation and dining) and higher needs (i.e., relaxation, comfort, and entertainment). In line with their theory, brand awareness and perceived quality are utility-oriented brand equity dimensions because they satisfy the tourist’s basic needs. Moreover, drawing on service quality research (Grönroos 1984), perceived quality is two-dimensional: physical quality (i.e., perceived quality of tangibles) and service interaction quality (i.e., perceived quality of intangibles). Following the destination image and self-congruence theory (Huber, Eisele, and Meyer 2018; Sirgy 1982), destination brand equity includes two hedonic-oriented dimensions; self-congruence and brand identification, which satisfy the tourist’s higher needs (i.e., psychological, social, and emotional needs as in comfort, luxury, enjoyment, pleasure, and fun). According to Chaudhuri and Holbrook (2001), utilitarian and hedonic brand experiences determine brand trust. Therefore, destination brand trust is an asset that results from the tourist’s perception of cognitive (i.e., brand knowledge) and affective destination brand experiences.
Chaudhuri and Holbrook (2001) state that “brand trust reduces the uncertainty in an environment in which consumers feel especially vulnerable because they know they can rely on the trusted brand” (p. 82). Although destination marketing campaigns have been trying to restore trust in destinations to stimulate tourism demand (e.g., “Thailand Trusted Destination.” “Malaysia, a safe and trusted healthcare travel destination”) after the Covid-19 pandemic, one could argue whether tourists can trust destination brands (Arif 2022; Sangpolsit and Rujopakarn 2022). Destination brands trust is explained by the anthropomorphism and relationship marketing theory (Fournier 1998). Destination anthropomorphism refers to the act of endowing a destination with humanlike characteristics, emotions, beliefs, intentions, and a mind of its own (Kwak et al. (2020). Huang and Liu (2021) show that humanizing (anthropomorphizing) digital experience in contactless service journeys can help with the development of love for destination brands. According to Artigas et al. (2017) destination trust is related to the personality and the image (i.e., reputation) of the destination. Letheren, Martin, and Jin (2017) note that personification strategies, such as referring to Italy as “passionate” and France as “artistic” are examples of anthropomorphism for destinations.
Destination brand trust represents the confidence that tourists will experience what is promised by destination providers rather than what is feared. Hence, we define destination brand trust as a tourist’s confidence in a destination’s ability to deliver its functions that can be formed from tourists’ cognitive and affective evaluations evolving from past experiences or interactions over time (Delgado-Ballester and Luis Munuera-Alemán 2005; Han, Nguyen, and Lee 2015). Tourist confidence is particularly relevant to destinations, because uncertainty, vulnerability, and risk avoidance are manifested strongly and distinctively in tourism (Williams and Baláž 2021). Uncertainty arises in at least two different contexts—displacement and host–guest relationships, which are unique to destination visit experiences. For example, tourists feel safer when they travel to familiar places. By the same token, they feel vulnerable when they visit new or dramatically changed environments. Hence, we propose that positive destination brand experiences driven by brand awareness (H1), physical quality (H2), service interaction quality (H3), brand self-congruence (H4), and brand identification (H5) influence destination brand trust as shown in Model 1 (Figure 1). In turn, destination brand trust influences destination brand loyalty (H6) and mediates the relationship between the five core brand equity dimensions and destination brand loyalty (H7a–H7b).
The destination brand equity model (Figure 1, Model 1) has some common variables with Aaker’s (1991) CBBE model (Figure 1, Model 2) such as brand loyalty, brand awareness and perceived quality. As opposed to Aaker’s (1991) model, however, destination brand awareness is a separate entity from other variables. Moreover, the destination brand equity model acknowledges the complexity of destination brands and therefore assesses perceived quality through two separate service quality dimensions: physical quality and destination service interaction quality. Furthermore, the hedonic nature of destination brand experience is captured by two brand equity dimensions: self-congruence and brand identification. Destination brand trust is a distinct component of destination brand equity. From a hierarchical point of view, the destination brand equity model features brand loyalty as the dependent variable while Aaker’s model includes overall brand equity as the dependent variable. Following Kladou, Giannopoulos, and Mavragani (2015), we compare the predictive validity of the two brand equity models as to what extent they successfully predict brand loyalty and overall brand equity in two cultures. The next section introduces dimensions of the destination brand equity and the research hypotheses.
Research Hypotheses
Effects of Brand Awareness on Destination Brand Trust
According to Keller (1993) brand awareness “is related to the strength of the brand node or trace in memory, as reflected by consumers’ ability to identify the brand under different conditions.” Aaker (1996) defines brand awareness as the tacit knowledge of the brand rather than brand recognition or top-of-the-mind brand recall. In this study, destination brand awareness is defined as the tourist’s tacit knowledge of the destination. Destination brand knowledge can be factual (i.e., destination location, performance, and history) or fictional (i.e., a fantasy about the destination) and may be developed through visiting the destination, reading about the destination or exposing to destination marketing campaign (i.e., social media, destination advertising).
Destination brand knowledge can be favorable or unfavorable. Consumption experiences or storytelling enhance destination brand knowledge and brand recall (Berry 2000; Judge et al. 2002). The deeper the destination brand knowledge, the higher the familiarity with the destination brand. Brand awareness serves to enhance destination brand trust because positive information about a destination is likely to influence favorable responses to destination performance (Matzler, Grabner-Kräuter, and Bidmon 2008; Xu et al. 2021). Hence, we propose the following hypothesis:
H1: Brand awareness is positively related to destination brand trust.
Effects of Physical Quality and Service Interaction Quality on Destination Brand Trust
Following the Nordic School of Thought (e.g., Grönroos 1984), a two-dimensional model of service quality with physical quality and service interaction quality, is deemed to be suitable for assessing destination brand quality (Nam, Ekinci, and Whyatt 2011). Physical quality is the holistic evaluation of the superiority of the destination’s physical facilities (i.e., hotels and restaurants) and attractions (i.e., museums and natural attractions) (Baloglu and McCleary 1999). Destination physical quality provides evidence for the destination brand’s credibility and performance reliability (Morrow, Hansen, and Pearson 2004; Xu et al. 2021). Hence, we propose the following:
H2: Physical quality is positively related to destination brand trust.
Service interaction quality is the perceived superiority of the frontline employee performance that can be assessed through the employee’s serving abilities (i.e., service capability and reliability), personality characteristics (e.g., friendly, courteous, helpful, and empathetic), and attitude toward customers (Ekinci and Dawes 2009; Fellesson and Salomonson 2016). Also the service employee’s product knowledge is essential for successful service delivery (Rod, Ashill, and Gibbs 2016). Displaying empathetic service behavior positively influences interaction quality, interpersonal trust, and service loyalty (Aggarwal et al. 2005; Bahadur et al. 2020; Parasuraman, Zeithaml, and Berry 1988). When frontline service employees deliver reliable services and demonstrate courteous, considerate, and companionate service behavior, they are likely to influence tourist satisfaction with destination visit experience and destination brand trust (Esmaeilpour, Sayadi, and Mirzaei 2017; Fellesson and Salomonson 2016). Hence, we posit the following hypothesis:
H3: Service interaction quality is positively related to destination brand trust.
Effects of Brand Self-Congruence on Destination Brand Trust
Self-congruence is the similarity between a person’s self-image and product image (Sirgy 1982). Likewise, brand-self-congruence is the degree of match between a tourist’s self-image (i.e., actual or ideal self) and destination brand image. Self-congruence influences product choice, purchase intentions, product adaptation, and emotional brand attachment (Huber, Eisele, and Meyer 2018). The underlying motive for self-congruence is the individual’s need to act in ways consistent with their life goals and self-esteem (Sirgy 1985). Achievement of self-esteem results in positive emotions, (e.g., satisfaction, enjoyment, cheerfulness), and consequently the development of brand attachment and brand trust (Huang, Zhang, and Hu 2017; Huber, Eisele, and Meyer 2018). Previous research has found that a higher match between self-image and destination image has a positive effect on tourist satisfaction with the destination visit experience (Chon 1992; Sirgy et al. 2018). Coulter and Coulter (2002) show that perceived similarity between customers and service providers reduce interpersonal barriers, alleviates uncertainty, and raises comfort levels, thereby contributing to the establishment of trust in service relationships. We therefore propose the following:
H4: Brand self-congruence is positively related to destination brand trust.
Effects of Brand Identification on Destination Brand Trust
The impact of brand identification on destination brand trust stems from social categorization, perceived similarities, past experiences, perceived prestige, and shared goals. Social categorization (i.e., stereotyping) is a cognitive shortcut that allows people to rely on previously held beliefs to classify themselves into certain groups or organizations (Tajfel 1978; Turner et al. 1987; Williams 2001). When consumers feel that their social self-image and the brand image have similarities, they incorporate the brand into their social identity. Brand identification satisfies people’s self-verification, self-distinctiveness, and self-enhancement needs (Underwood, Bond, and Baer 2001).
People’s identification with social objects (whether a group, organization, or brand) results in positive outcomes. For example, consumer identification with a brand influences brand satisfaction, brand loyalty, and positive word of mouth (e.g., Popp and Woratschek 2017). Kong (2018) demonstrates that individuals rely on social stereotypes (i.e., warmth and competence) to guide their trust decisions when they lack adequate information about a target object. Direct or indirect brand experiences (e.g. destination visits, interacting with people in that destination, or destination brand advertising) contribute destination brand identification (Ekinci, Sirakaya-Turk, and Preciado 2013; Han and Hyun 2013; Williams 2001). Tourists are likely to trust a destination brand if they believe that the destination’s goods and services will satisfy their self-verification, self-distinctiveness, and self-enhancement needs (He, Li, and Harris 2012). Tourist–brand identification is likely to increase social stereotyping of a place (i.e., perceiving it to be friendly, sincere, or efficient), reduce perceived risk, and, in turn, increase trustworthiness toward destinations when those destinations have similar or desirable socio-demographic characteristics. We propose the following:
H5: Brand identification is positively related to destination brand trust.
Effects of Destination Brand Trust on Destination Brand Loyalty
Trust is essential for developing long-term business relationships between buyers and brands. Brand trust is the willingness to believe in brand performance in the face of risks or uncertainties associated with the brand (Chaudhuri and Holbrook 2001). Customers lacking trust are unlikely to be brand-loyal and are thus likely to switch brands (Chaudhuri and Holbrook 2001; Delgado-Ballester and Luis Munuera-Alemán 2001).
Destination brand loyalty can be attitudinal or behavioral (e.g., Kotsi, Pike, and Gottlieb 2018; Tasci 2018). Behavioral loyalty refers to tourists’ repeat visits to a destination. Attitudinal loyalty is a tourist’s attachment to a destination, which is often expressed as behavioral intentions. Destination brand trust is positively related to destination brand loyalty because it reduces the perceived risk of visiting a destination (Matzler, Grabner-Kräuter, and Bidmon 2008; Yu and Chen 2018). Destination brand trust creates a commitment to exchange relationships that are valued by tourists and destination service providers (Williams and Baláž 2021). Furthermore, destination brand trust influences tourist confidence in service recovery, because tourists believe that service failures will be resolved amicably. Thus, we propose the following:
H6: Destination brand trust is positively related to destination brand loyalty.
Mediating Role of Destination Brand Trust
Brand trust is composed of cognitive beliefs and affective evaluations of the brand (Elliott and Yannopoulou 2007; Williams 2001). Cognitive beliefs include expectations of brand performance (i.e., reliability, consistency, and competence) (Delgado-Ballester and Luis Munuera-Alemán 2005). People form opinions about the trustworthiness of people or products by assessing their performance (Williams 2001, p. 379). The five-core destination brand equity dimensions are potential antecedents of destination brand trust as people develop trust in destination brands through direct and indirect consumption experiences (i.e., visiting or gathering information about destinations). Hence destination brand trust evolves from previous interactions and past experiences over time (Delgado-Ballester and Luis Munuera-Alemán 2005). For example, brand awareness (i.e., destination brand knowledge) and perceived quality can help in developing cognitive trust in destinations, because visitors believe that the destination has reliable facilities and that the destination service providers will act in visitors’ best interests to accommodate their needs. However, destination brand trust is more than assessing destination brand performance. Emotional trust or identity-based trust is developed through self-congruence, destination brand identification, and other psychological processes.
Therefore, we propose that the five brand equity dimensions (i.e. brand awareness, service quality) are important drivers for destination brand trust. Previous research suggests that trust toward destination service providers plays a key mediating role between service fairness, service quality, and destination loyalty (Su, Hsu, and Swanson 2017). In the hotel industry, research has found that brand trust mediates the relationship between corporate social responsibility and brand loyalty (Palacios-Florencio et al. 2018), as well as between brand competence and brand loyalty (Lee and Back 2010). In other service settings, the mediating role of brand trust is confirmed in the relationships between brand loyalty and the following variables: brand experience (Huang 2017), brand image (Song, Wang, and Han 2019), brand identity (He, Li, and Harris 2012), brand associations (Filo, Funk, and Alexandris 2008), and brand awareness (Alkhawaldeh et al. 2017). Therefore, it is reasonable to assume that destination brand trust has some capacity to mediate the effect of a tourist’s tacit knowledge of the destination brand (i.e., brand awareness), emotional destination brand experience (i.e., brand identification), and destination brand loyalty. Thus, we propose the following:
H7: Destination brand trust mediates the effect of brand awareness (H7a), physical quality (H7b), service interaction quality (H7c), brand self-congruence (H7d), and brand identification (H7e) on destination brand loyalty.
Methods
Adopting an emic approach, this research performed two empirical studies to assess the validity of the destination brand equity model in two different cultures: Indonesia and the UK. These countries were selected for their cultural diversity and reputations in international tourism markets. Study 1 assessed and compared the validity of the destination brand equity model and Aaker’s (1991) CBBE model. Study 2 examined the external validity of the destination brand equity model and the mediating effect of destination brand trust on the relationships between the cognitive (e.g., brand awareness), affective destination brand equity dimensions (e.g. self-congruence) and destination brand loyalty.
Study 1: Instrument, Data Collection, and Sample
An English version of the questionnaire was developed and tested by 30 individuals. It was then translated into Indonesian and back translated to English by two bilingual researchers. The destination brand equity measurements were adapted from Nam, Ekinci, and Whyatt (2011). The CBBE measurements were taken from Yoo and Donthu (2001), who developed the measurement scales based on Aaker’s (1991) model. Destination brand trust was measured using the scale introduced by Lassar, Mittal, and Sharma (1995) (see the Appendix for measurements). The constructs were specified as reflective measurements on a seven-point rating scale ranging from (1) “strongly disagree” to (7) “strongly agree (7).
The Indonesian survey was randomly distributed in several public locations in Jakarta, Indonesia (e.g., shopping malls and cafés) on different days and at various times by trained students. The respondents were informed about the study aim and invited for participation. Although the questionnaire was self-administered, the participants were allowed to ask questions if they found anything confusing about the survey. A total of 275 people participated in the study. After checking the responses, 25 questionnaires were omitted due to missing values and incomplete answers, leaving 250 surveys for analysis.
At the beginning of the survey, respondents were asked to think about a top-of-the-mind holiday destination. The next question asked to state other holiday destinations that came to mind. A further question recorded a holiday destination they had heard of from a list of popular holiday destinations provided on the questionnaire. From all the holiday destinations mentioned, the respondents were asked to select a holiday destination that they were most familiar with. They stated whether they had visited the same holiday destination in the past 12 months. If the respondents had not visited the holiday destination in the past 12 months, then they were excluded from the survey. Following that, they related their responses to their most familiar holiday destination through the destination brand equity, brand trust, and brand loyalty measurements. Finally, socio-demographic characteristics of the respondents were recorded.
Of the 250 respondents included in the analysis, 52.8% were female and 63.6% had an undergraduate degree. In terms of age, 48% were less than 25 years old and 41.6% were aged 25–34 years. In terms of occupation, 9.6% of the respondents were students. The rest were retired and mostly full-time employees in different industries. Regarding median income, 74% received USD 750 per month. As of 2020, the minimum average wage in Jakarta was IDR 4,267,349 per month, which is equal to around USD 305 per month.
Study 1: Findings
The destination brand equity model was tested using AMOS 26 software (Hair et al. 2018). The distribution of the data was normal since the skewness and kurtosis values were between −1 and +1. The measurement model fit was assessed through the following structural equation model fit indices: Chi-square (χ2), df, the goodness-of-fit index (GFI), the normed-fit index (NFI), the comparative fit index (CFI), and the root mean square error of approximation (RMSEA). Confirmatory factor analysis and Cronbach’s alpha test were performed to delineate the reliability and validity of the measurements. The model fit indices for the measurement model were satisfactory (χ2 = 325.13, df = 202, χ2/df = 1.61, GFI = 0.90, NFI = 0.92, CFI = 0.97, RMSEA = 0.05). Table 2 presents the descriptive statistics, the Cronbach’s alpha scores, the average variance extracted (AVE), and the intercorrelations (IC) for the destination brand equity measurement.
Descriptive Statistics, Reliabilities, Validities, and Correlations for the Destination Brand Equity Model (n = 250).
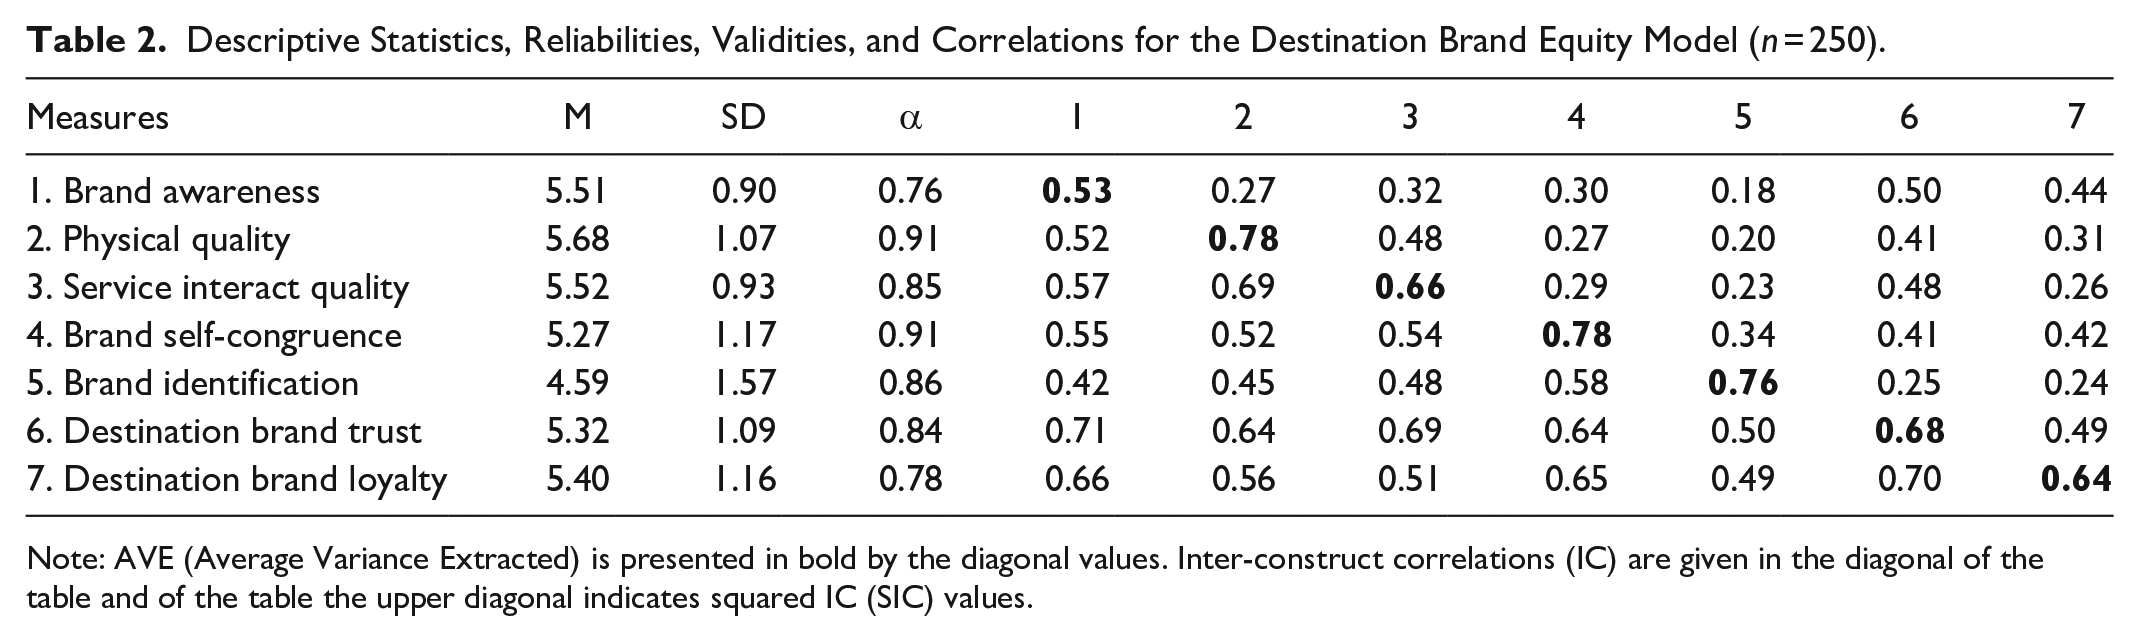
Note: AVE (Average Variance Extracted) is presented in bold by the diagonal values. Inter-construct correlations (IC) are given in the diagonal of the table and of the table the upper diagonal indicates squared IC (SIC) values.
The Cronbach’s alpha values were above the recommended 0.70 threshold, and thus all the measurements were reliable. Fornell and Larcker (1981) suggest that the factor loadings should be high for achieving convergent validity, and that the AVE values should exceed 0.50, the squared intercorrelations must be lower than the AVE values for discriminant validity. The destination brand equity measurements satisfied the recommended standards for convergent and discriminant validity.
Before testing the research hypotheses, potential common method biases (CMB) were checked using Harman’s one-factor test (Podsakoff et al. 2003). The factor analysis results showed that the five brand equity factors explained 68.82% of the total variance with multiple factors. The first factor accounted for 45.35% of the variance, which was below the threshold of 50%. Therefore, there was no issue with CMB. Then, the structural model and the research hypotheses were tested using structural equation modeling, as shown in Table 3.
Study 1 Results of Destination Brand Equity Model—Indonesia.
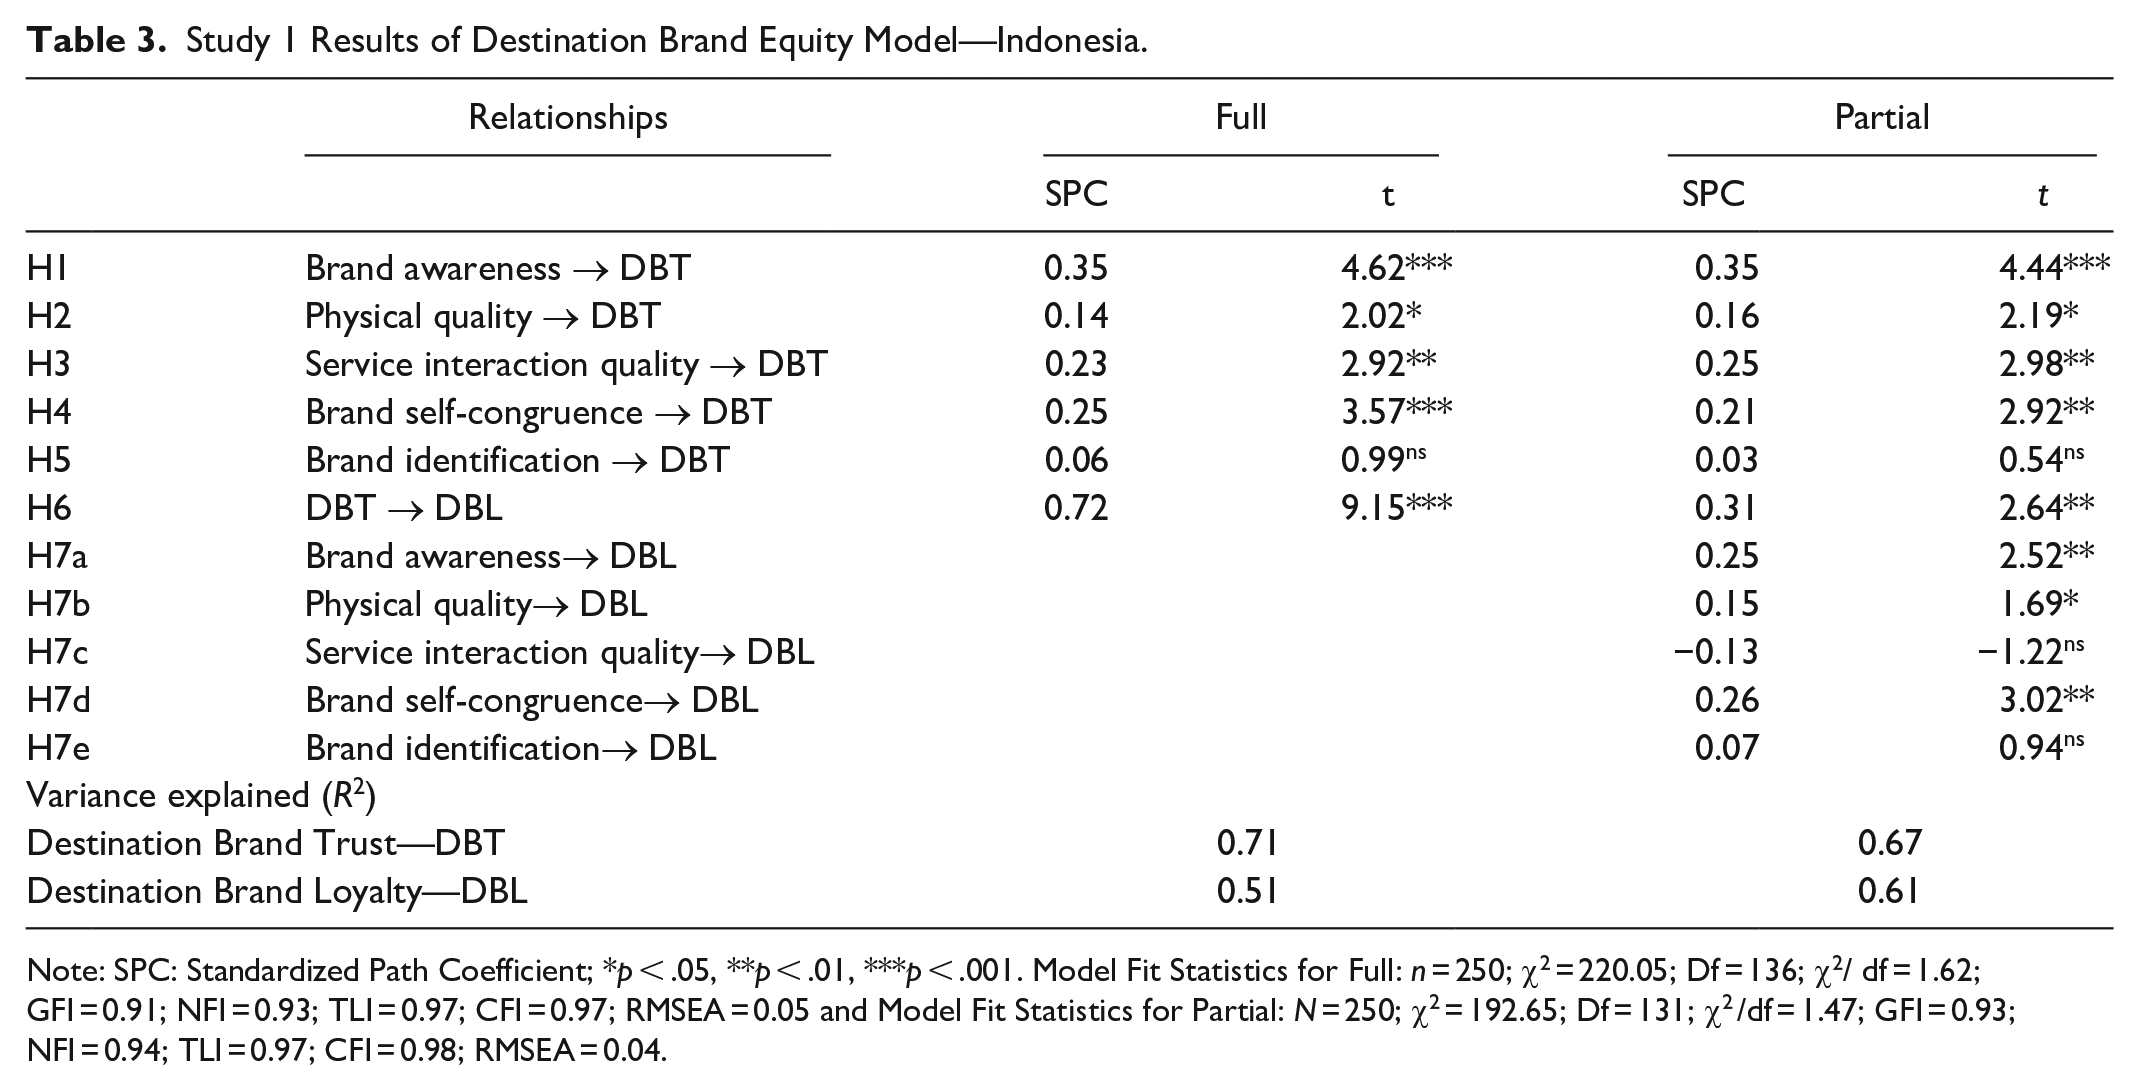
Note: SPC: Standardized Path Coefficient; *p < .05, **p < .01, ***p < .001. Model Fit Statistics for Full: n = 250; χ2 = 220.05; Df = 136; χ2/ df = 1.62; GFI = 0.91; NFI = 0.93; TLI = 0.97; CFI = 0.97; RMSEA = 0.05 and Model Fit Statistics for Partial: N = 250; χ2 = 192.65; Df = 131; χ2 /df = 1.47; GFI = 0.93; NFI = 0.94; TLI = 0.97; CFI = 0.98; RMSEA = 0.04.
The results of the model fit statistics confirmed that the full and partial models produced a good fit. The difference in χ2 between the full and the partial mediation model was 27.4 (df = 5). The difference was significant (p < .05); thus, we accepted the partial mediation model for destination brand equity. As shown in Table 3, H1 was supported (standardized path coefficient [SPC] =0.35, p < .001), meaning that brand awareness is positively related to destination brand trust. The results also supported H2 (SPC = 0.14, p < .05) and H3 (SPC = 0.23, p < .01). Accordingly, physical quality and service interaction quality positively related to destination brand trust. The hypothesis (H4) that brand self-congruence affects destination brand trust was also supported (SPC = 0.25, p < .001). However, the results rejected H5 (SPC = 0.06, p > .05). Thus, brand identification did not influence destination brand trust in the Indonesian sample. Finally, H6 was supported (SPC = 0.72, p < .001), which means that destination brand trust is positively related to destination brand loyalty.
The direct relationships between the first five destination brand equity dimensions and destination loyalty were also estimated. The path between service interaction quality and destination brand loyalty was not statistically significant (SPC = 0.03, p > .05). Hence, destination brand trust seemed to fully mediate the relationship between destination service interaction quality and destination brand loyalty. Meanwhile, destination brand trust partially mediated the relationships between brand awareness, physical quality, brand self-congruence, and destination brand loyalty, as they have direct influences on brand loyalty. To examine the stability of the model parameters and the mediation effect of destination brand trust, we performed a bootstrapping analysis (5,000 bootstrap samples), as shown in Table 4.
Study 1 Bootstrapping Result— Indonesia (n = 250).
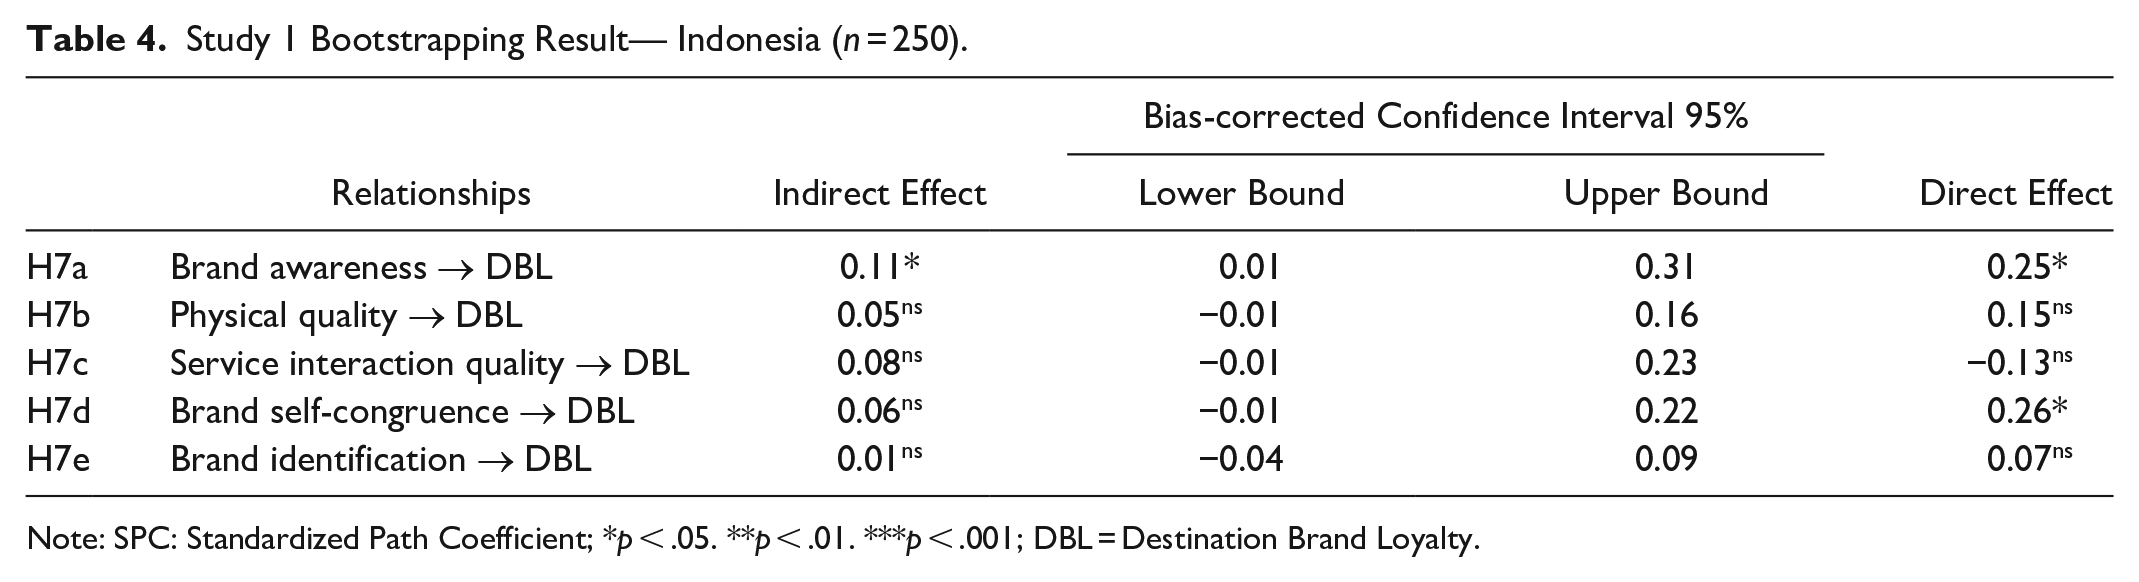
Note: SPC: Standardized Path Coefficient; *p < .05. **p < .01. ***p < .001; DBL = Destination Brand Loyalty.
The bootstrapping results suggested that destination brand trust only mediated the relationship between brand awareness and destination brand loyalty, since the indirect effect was statistically significant (SPC = 0.11, p < .05) and the percentile confidence interval excluded 0 (95% confidence interval: 0.01–0.31) (Zhao, Lynch, and Chen 2010). The bootstrapping results confirmed that destination brand trust did not mediate the effects of destination brand awareness, perceived quality, self-congruence, and destination brand identification on destination brand loyalty.
Comparison of the Destination Brand Equity Model with Aaker’s (1991) CBBE Model
To compare the destination brand equity model (Model 1) with Aaker’s (1991) CBBE model (Model 2), first we checked the reliability and validity of the measurements used in Aaker’s model. Table 5 displays the descriptive statistics, the composite reliability values, and the correlations of Aaker’s (1991) CBBE model.
Descriptive Statistics, Reliabilities, Correlations, and Validities of Aaker’s (1991) CBBE model.
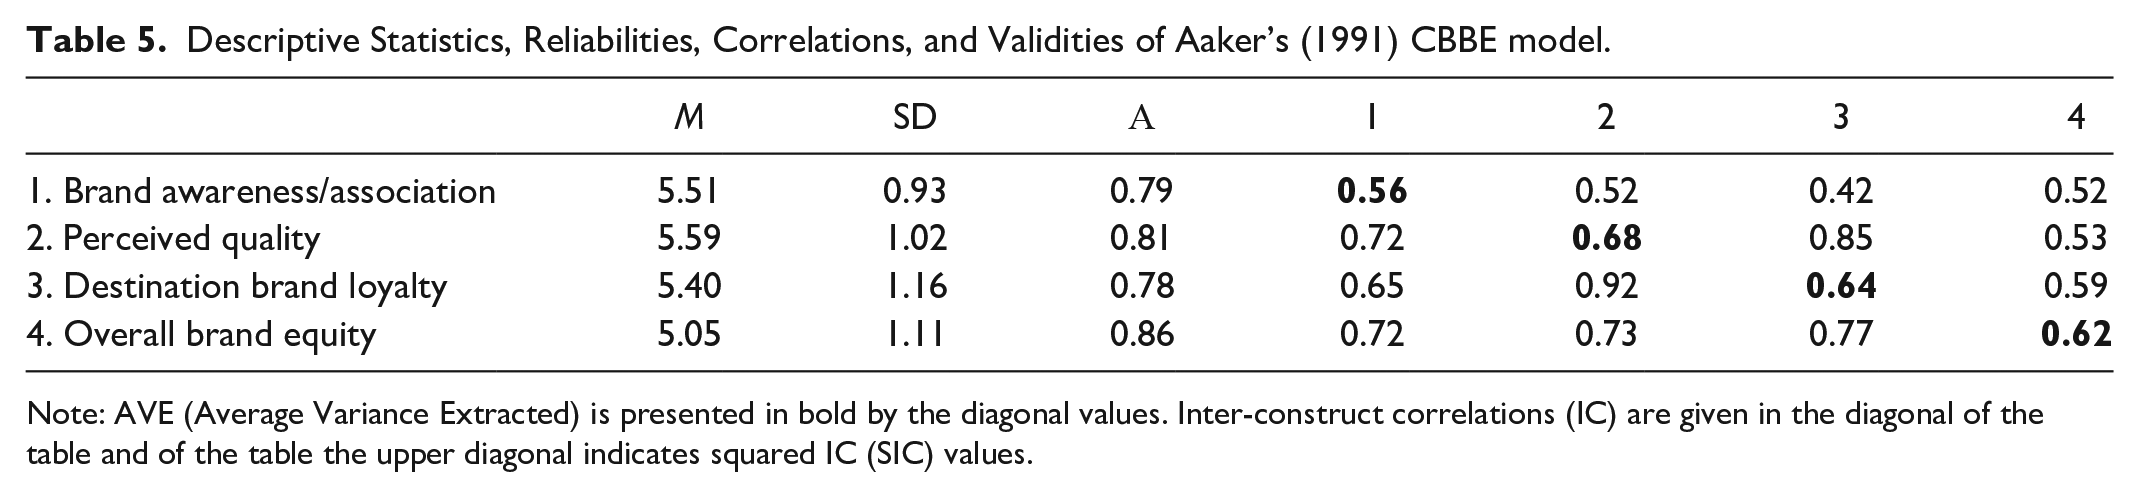
Note: AVE (Average Variance Extracted) is presented in bold by the diagonal values. Inter-construct correlations (IC) are given in the diagonal of the table and of the table the upper diagonal indicates squared IC (SIC) values.
As can be seen from Table 5, all the measurements were reliable since the Cronbach’s alpha values were above the 0.70 threshold (Hair et al. 2018). Although convergent validity was achieved, discriminant validity was poor. Aaker’s model testing results showed that destination brand loyalty was highly correlated with perceived quality (r = 0.92) and overall brand equity (r = 0.77). Therefore, we formed an alternative model (Model 2A) after removing the highly correlated variable which was destination brand loyalty. The model fit statistics were satisfactory, as shown in Table 6.
Model Fit Statistics for the Measurement Models of Aaker’s CBBE.
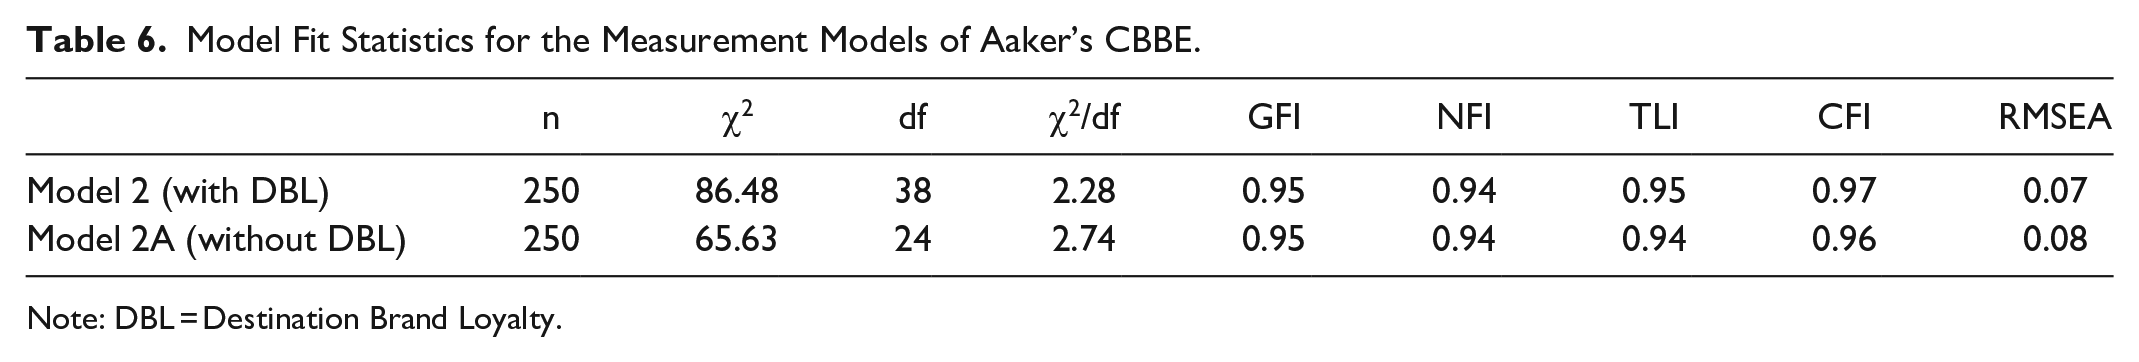
Note: DBL = Destination Brand Loyalty.
Subsequently, we used overall brand equity as the same dependent variable to compare the destination brand equity’s predictive validity (Figure 1, Model 1 without brand loyalty) with that of Aaker’s alternative CBBE model (Model 2A without brand loyalty) (Hair et al. 2018). Table 7 displays the results of the model comparison.
Overall Destination Brand Equity: Comparing Destination Brand Equity with Aaker’s revised CBBE model.
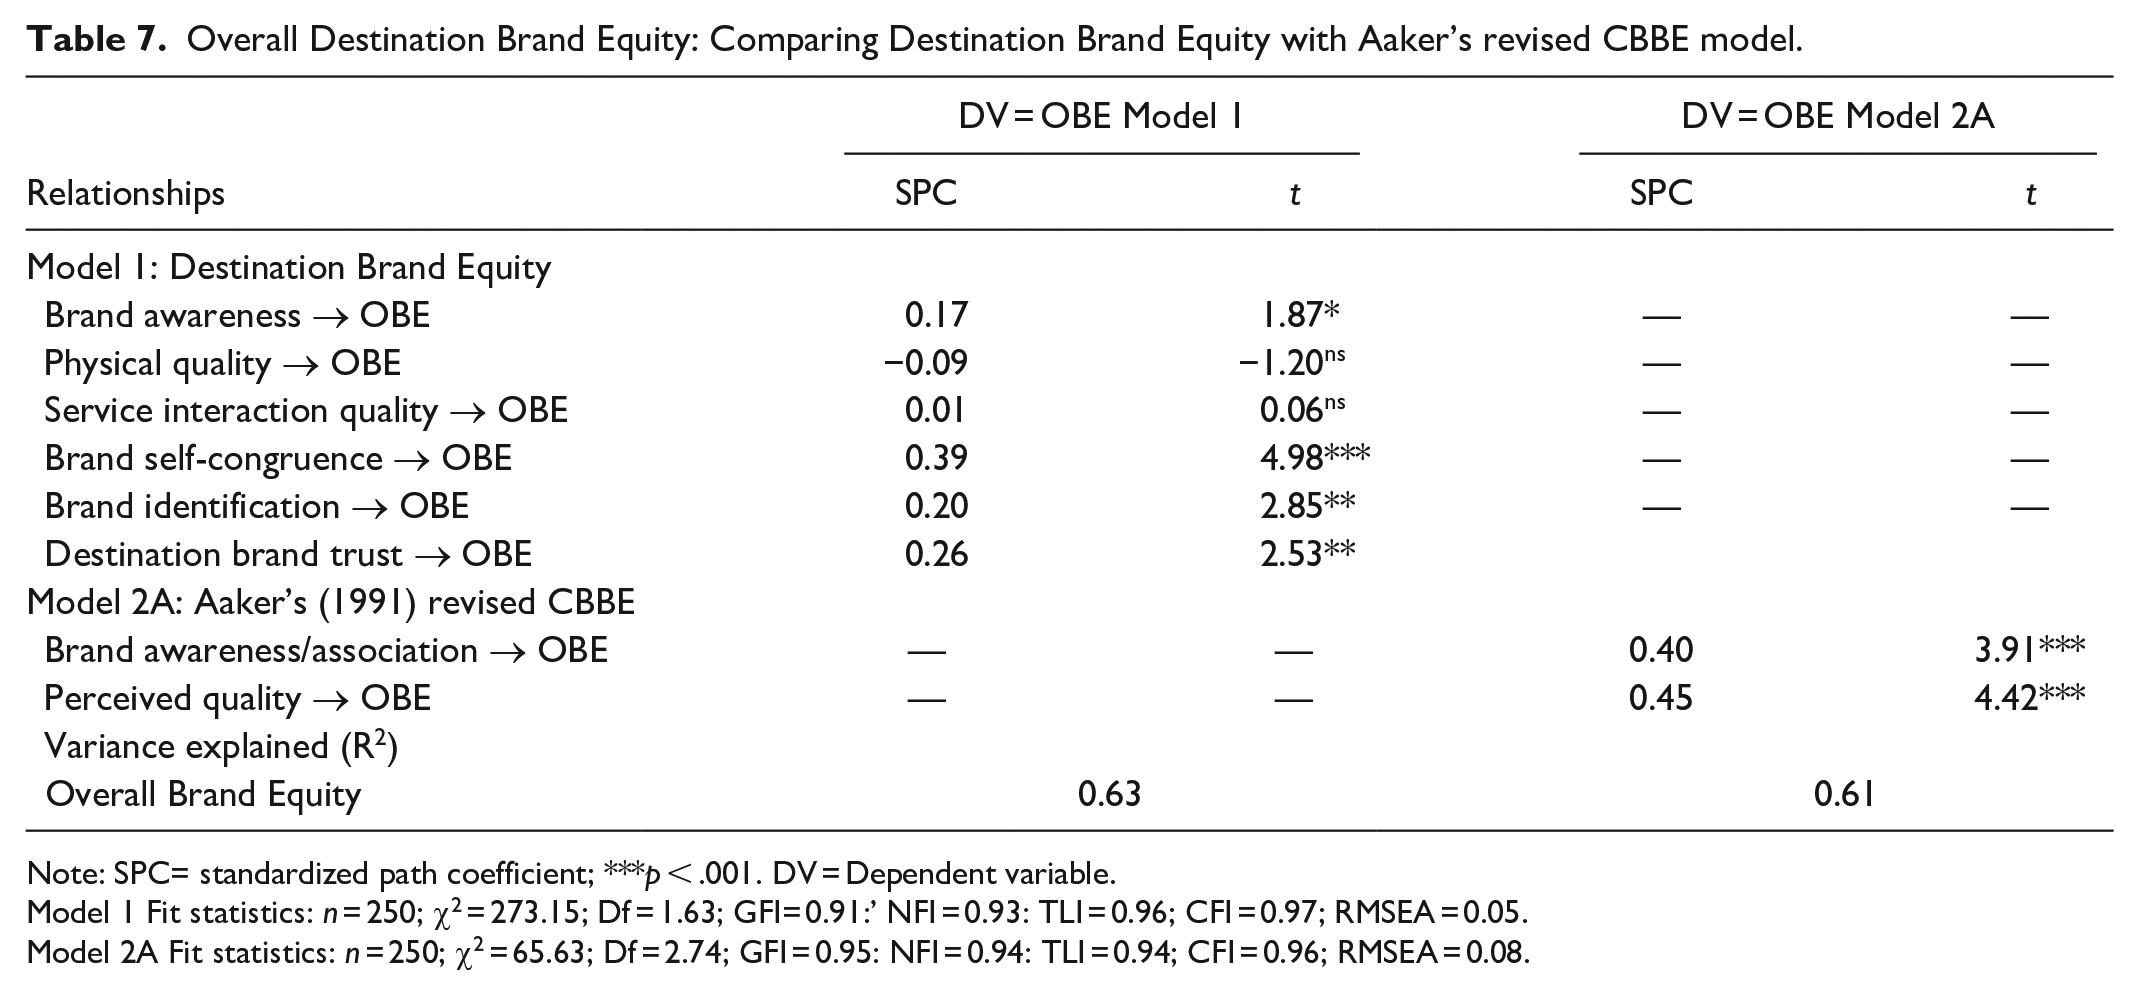
Note: SPC= standardized path coefficient; ***p < .001. DV = Dependent variable.
Model 1 Fit statistics: n = 250; χ2 = 273.15; Df = 1.63; GFI= 0.91:’ NFI = 0.93: TLI = 0.96; CFI = 0.97; RMSEA = 0.05.
Model 2A Fit statistics: n = 250; χ2 = 65.63; Df = 2.74; GFI = 0.95: NFI = 0.94: TLI = 0.94; CFI = 0.96; RMSEA = 0.08.
The destination brand equity model explains 63% of the variance in predicting overall brand equity, whereas Aaker’s alternative model explains 61% of the variance in overall brand equity. The results confirm that the destination brand equity model (Model 1) is superior to Aaker’s original and alternative CBBE model (Model 2 and Model 2A) for two reasons. First, the destination brand equity model has better fit indices (i.e., RMSEAModel 1 = 0.05) than Aaker’s (1991) model (RMSEAModel 2A = 0.08). Second, the results confirm that the construct validity of the destination brand equity model (i.e., the discriminant validity) is better than Aaker’s original model (Model 2) where the dimensions of perceived quality and brand loyalty merge into one.
The model testing results show that destination brand trust has a positive effect on overall brand equity in Model 1. Although the path between brand identification and destination brand loyalty was not statistically significant (p > .05), the relationship between brand identification and overall brand equity was statistically significant (Model 1: SPC = 0.20, p < .01). This finding suggests that brand identification is an important component of destination brand equity. The paths from physical quality and service interaction quality to overall brand equity were not statistically significant in Model 1 (p > .05). However, perceived quality had a positive influence on overall brand equity in Model 2A (p < .05). It seems that the effects of physical quality and service interaction quality were attenuated by brand awareness and brand self-congruence in Model 1 since they had a statistically significant relationship with overall brand equity (p < .05).
Study 2: Sample
Study 2 was conducted to confirm the external validity of the destination brand equity model in a different sample; and to re-examine the mediating effect of destination brand trust between the first five brand equity dimensions and destination brand loyalty. The data were collected in the UK using the same survey instrument and data collection method as in Study 1. Students were trained and paid for data collection through an intercept survey in and around London. London is the largest city in the UK that has a diverse population of 9,540,576 million residents whereas the second largest city of UK, Birmingham, has a population of 1.1 million people (World Population Review 2022). The respondents were randomly approached at different days and times. In total, 323 people participated in the survey. After removing the incomplete and missing responses, 246 questionnaires were left for analysis. Of these participants, 53.5% were female and 38.2% had an undergraduate degree. The ages were evenly spread (20.7% aged 18–24 years, 21.1% aged 25–34 years, 29.7% aged 35–54 years, and 15.9% aged 55–64 years). In terms of occupation, 9.7% were students and 7.7% were retired. The rest were mostly full-time employees in various sectors, such as public service, retail, and IT.
Study 2 Findings
The measurement model provided a satisfactory fit for the destination brand equity model (χ2 = 318.53, df = 202, χ2/df = 1.58, GFI = 0.90, NFI = 0.91, TLI = 0.95, CFI = 0.96, RMSEA = 0.05). Like Study 1, potential CMB issues were checked. Seven factors were obtained from the factor analysis, which explained 70.74% of the total variance. The first factor accounted for 33.62% of the total variance, indicating that CMB was not a threat. The reliability and validity of the measurements were also acceptable. Structural models were then formed to test the research hypotheses, as shown in Table 8.
Study 2 Results of Destination Brand Equity Model—UK (n = 246).
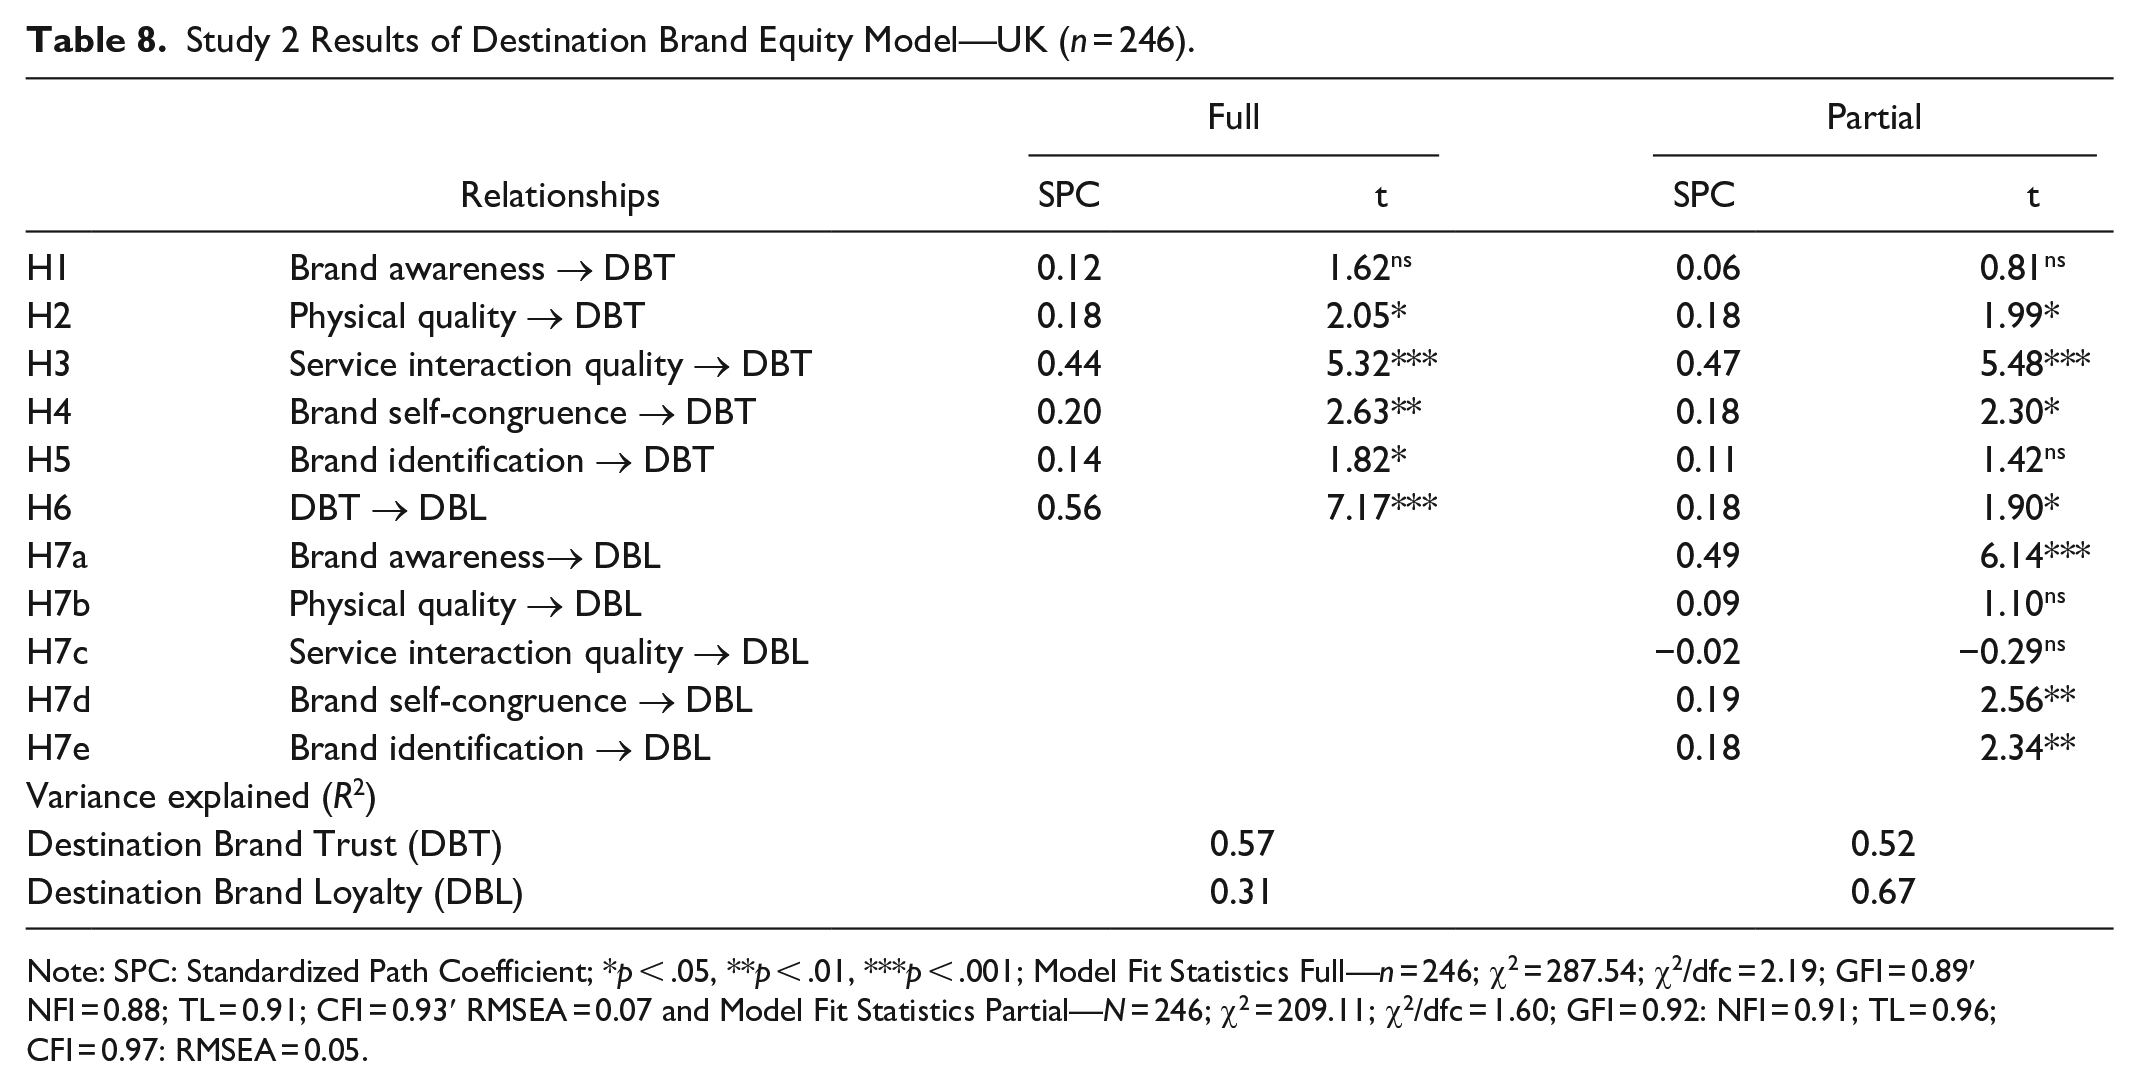
Note: SPC: Standardized Path Coefficient; *p < .05, **p < .01, ***p < .001; Model Fit Statistics Full—n = 246; χ2 = 287.54; χ2/dfc = 2.19; GFI = 0.89′ NFI = 0.88; TL = 0.91; CFI = 0.93′ RMSEA = 0.07 and Model Fit Statistics Partial—N = 246; χ2 = 209.11; χ2/dfc = 1.60; GFI = 0.92: NFI = 0.91; TL = 0.96; CFI = 0.97: RMSEA = 0.05.
Study 2 results were similar to Study 1. Study 2 findings confirmed the construct validity of the destination brand equity model. The findings supported H2 (SPC = 0.18, p < .05), H3 (SPC = 0.44, p < .01), H4 (SPC = 0.20, p < .01), H5 (SPC = 0.14, p < .05; one-tailed test), and H6 (SPC = 0.56, p < .001). Hence physical quality, service interaction quality, brand self-congruence, and brand identification had a positive relationship with destination brand trust. Although Study 1 results rejected H5, Study 2 results supported that brand identification was positively related to destination brand trust (SPC = 0.14, p > .05—one tail test). In contrast to Study 1, Study 2 rejected H1 (SPC = 0.12, p > .05). Hence brand awareness was not related to destination brand trust. Study 2 results confirmed that brand awareness had a positive relationship with destination brand loyalty (SPC = 0.49, p < .001), as in Study 1.
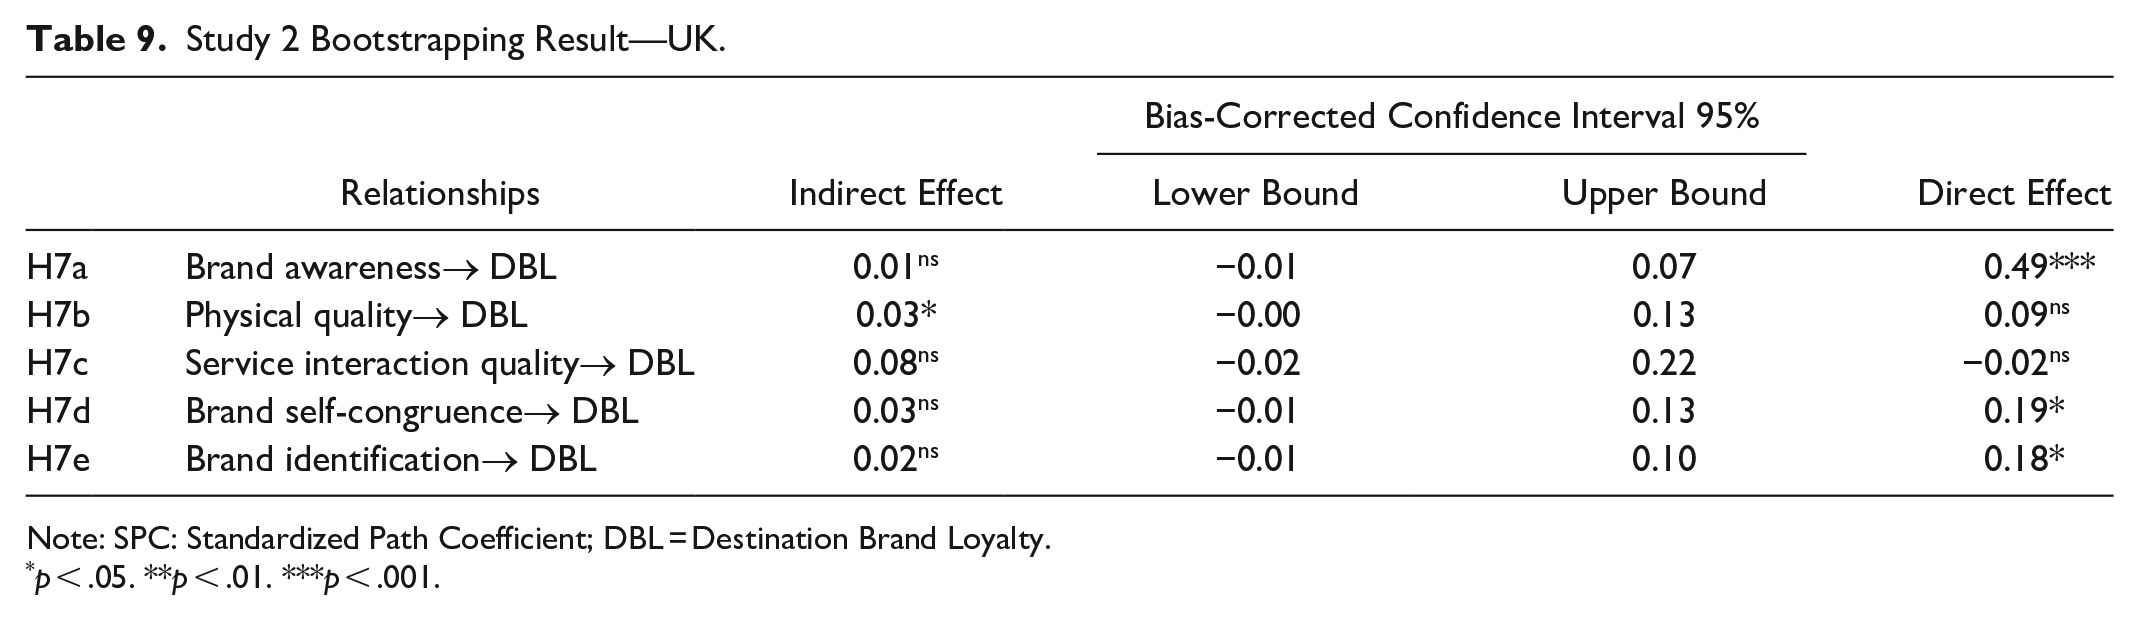
The mediation analysis (see Table 8) shows that destination brand trust fully mediates the effect of physical quality and service interaction quality on destination brand loyalty (p > .05). Furthermore, destination brand trust partially mediates the effect of brand self-congruence (SPC = 0.19, p < .01) brand identification (SPC = 0.18, p < .01) on destination brand loyalty. As in Study 1, we performed a bootstrapping analysis to further check the mediating effects (Table 9).
Study 2 Bootstrapping Result—UK.
Note: SPC: Standardized Path Coefficient; DBL = Destination Brand Loyalty.
p < .05. **p < .01. ***p < .001.
The bootstrap analysis revealed that destination brand trust does not mediate any relationship because the indirect paths are not statistically significant, except for physical quality (SPC = 0.03, p < .05). However, the confidence intervals excluded “0,” and all the bias percentile confidence intervals were not statistically significant (Zhao, Lynch, and Chen 2010).
Conclusion
Contributions to Theory
Our study makes a number of contributions to brand equity research in tourism. First, the study introduces a novel destination brand equity model. To date, the destination marketing literature has mainly focused on applications or adaptations of Aaker’s (1991) CBBE model to destinations. The validity of Aaker’s model that originated from product brands has been severely criticized both in the mainstream marketing and tourism literature. Nevertheless, it had been widely used and it is still being used in tourism. The destination brand equity model is formed with three utility value-oriented, two hedonic value-oriented dimensions, destination brand trust and destination brand loyalty. Destination brand awareness, physical quality, and service interaction quality represent the cognitive component of destination brand equity. Destination brand self-congruence and destination brand identification represent the affective component of destination brand equity.
Brand equity research in tourism has mainly investigated the cognitive aspects of destination brands by focusing on brand awareness and perceived quality. Investigation of the affective components of destination brands through brand self-congruence and brand identification is novel. The findings of Study 1 and 2 confirmed that the destination brand equity model was valid and reliable in the Indonesian and British sample, whereas the testing of Aaker’s (1991) brand equity model in the Indonesian sample showed poor discriminant validity because perceived quality and destination brand loyalty merged into one. Only brand awareness and perceived quality were distinct. When the predictive validity of both models was compared against the measurement of overall brand equity, the destination brand equity model outperformed Aaker’s (1991) brand equity model. Furthermore, the destination brand equity model successfully explained a large amount of the total variance of overall brand equity (63%) and destination brand loyalty (67%).
Second, after examining the hierarchical structure of the destination brand equity dimensions, the study extended our understanding of brand equity dimensions and their usefulness for destination branding. The findings support the positive relationship between the first five destination brand equity dimensions and destination brand trust, which is essential for developing relationship equity between tourists and destination providers. The findings of the model testing confirm the positive influences of physical quality (H2), destination service interaction quality (H3), and brand self-congruence (H4) on destination brand trust. Although brand awareness had a positive influence on destination brand trust (H1) in the Indonesian sample, this finding was rejected in the British sample. Meanwhile, brand awareness had a statistically significant relationship with destination brand loyalty in both the Indonesian and the British sample. These findings contribute to the debate as to whether brand awareness has a direct impact on destination brand loyalty as previous research failed to confirm this relationship. Some authors (e.g., Nam, Ekinci, and Whyatt 2011) excluded brand awareness from brand equity. Hence, the study findings support that brand awareness is an important component of destination brand equity, as it had a positive influence on destination brand loyalty.
Third, the study investigated whether brand identification affects the development of destination brand trust and destination brand loyalty. Brand identification produced some conflicting but useful results for understanding the affective (or symbolic) component of destination brands. The test of the hypothesis that brand identification has a positive effect on destination brand trust (H5) was rejected in the Indonesian sample but supported in the British sample. Meanwhile brand identification had a strong relationship with overall brand equity in the Indonesian sample and a modest relationship with destination brand loyalty in the British sample. This finding supports Nam, Ekinci, and Whyatt (2011) and Ekinci, Sirakaya-Turk, and Preciado (2013), who argue that consumers define their social identity through brand consumption experiences. To the best of our knowledge, the joint effect of self-congruence and brand identification on destination brand trust and destination brand loyalty has not yet been investigated in tourism. The results of brand self-congruence and brand identification confirm the findings of those studies that have attempted to overcome Aaker’s (1991) brand equity model’s limitations by incorporating hedonic value-oriented brand dimensions (e.g., self-congruence, brand personality) into destination brand equity (e.g., Konecnik and Gartner 2007).
Fourth, the findings supported H6 across the two samples. Hence destination brand trust had a positive influence on destination brand loyalty (Indonesia: t = 9.15, p < .05; UK: t = 7.17, p < .05). This result supports Delgado-Ballester and Luis Munuera-Alemán (2001) and Chaudhuri and Holbrook (2001), who advocate that brand trust is an antecedent of brand loyalty. Also, the study explored the mediating role of destination brand trust between the first five destination brand equity dimensions and destination brand loyalty (H7). The bootstrapping analysis with the Indonesian sample suggested that destination brand trust partially mediated the effect of brand awareness on destination brand loyalty. However, Study 2 in the British sample, rejected this hypothesis (H7). Hence, one of the highlights of this study is examining the mediating role of destination brand trust in brand equity research. Study 1 findings indicate that the mediating effect of destination brand trust is spurious. Study 2 confirmed that destination brand trust is one of the destination brand equity dimensions rather than a mediator. This finding supports recent studies that suggest destination trust is critical for destination loyalty and destination brand equity, whether it is a mediating, attitudinal or behavioral variable (Li 2021; Wassler, Wang, and Hung 2021; Xu et al. 2021; Yu, Seo, and Hyun 2021).
The study findings suggest that destination brand trust can be developed not only through the first five destination brand equity dimensions (e.g., brand awareness, physical quality, and self-congruence) but also through other means. This finding supports Williams (2001), who suggested that brand trust can be established at two levels: superficial and deep trust. Superficial trust is instantly developed by cognitive inputs (e.g., brand awareness), whereas deep trust is developed by both cognitive and affective inputs. Destination brand equity dimensions may be useful for developing superficial trust, but high brand involvement is necessary for deep trust. Trust building is a continuous process and time dependent. Perhaps tourists need more time and interactions with local people for developing deep trust. Multiple visit experiences can be instrumental for developing deep trust to destinations. This finding supports Williams and Baláž (2021), who argue that cognition-based trust is developed based on the tourist’s experiences with destination environment and service providers, but establishing affect-based trust (i.e., deep trust) is based on interpersonal relationships and it takes longer time than cognition-based trust.
Contributions to Practice
This study’s findings will assist tourism marketers and DMOs to distinguish between factors that contribute to destination brand equity. The destination brand equity model has implications for destination competitiveness, resource investment, marketing communications, product development, product positioning, and customer service protocols. The results suggest that DMOs’ brand strategies should focus on brand awareness, perceived quality, and brand self-congruence for improving destination brand trust and brand loyalty. Destination marketers can build destination brand trust through advertising, content marketing, storytelling, and other relationship marketing tactics (e.g., improving service interaction quality). In this regard, social media will be particularly useful given that a significant number of tourists using it as a primary medium for gathering and sharing information about destinations. Therefore, DMOs need to provide clear, accurate and transparent information about destination brands on social media.
Destination marketers should appreciate that brand awareness can be formed not only through destination brand knowledge (i.e., physical attractions or facilities) but also destination sustainability and peer-to-peer recommendations. Thus, DMOs should improve the quality of the destination physical assets and offer activities that would help to create sustainable destination brand image. At this time of increased competition among destinations, DMOs seek to secure competitive advantage by focusing on service operations (Ramanathan et al. 2017). DMOs should maintain high quality standards for its pyhsical assets (e.g., clean environment) and services (e.g., comfortable, reliable transportation). Service interaction quality influences tourist satisfaction and tourist behavior at every stage of the destination visit experience and has a final effect on destination brand loyalty. Frontline service employees shape the service experience through being the interface between the service and the service provider. In practice, this means that recruiting, training, and motivating service employees will help create memorable tourism service encounters that, in turn, will influence destination brand trust, brand loyalty and differentiate the destination brand from competitors.
The results show that self-congruence plays a key role in building destination brand trust. DMOs should conduct studies to identify how target tourists perceive themselves (actual and ideal self) and how they perceive the destination brand image. They can use this information to design a marketing campaign that create synergy between the target tourist’s self-concept and destination brand image. For example, one strategy could be storytelling and organizing events that are highly congruent with the target market’s self-concept or social identity (e.g., festivals and sports competitions) (Frias et al. 2020).
The destination brand equity model can help DMOs, and destination marketers to develop a unique destination brand identity. In doing so, they could determine which destination brand equity dimension is important for the target market. For instance, brand awareness and brand self-congruence were most important for destination brand trust (SPCbrand awareness = 0.35, p < .05; SPCself-congruence = 0.25, p < .05) in Indonesia, whereas service interaction quality and brand self-congruence were most important for destination brand trust (SPCservice interaction quality = 0.44, p < .05; SPCself-congruence = 0.20, p < .05) in the UK. Finally, the destination brand equity model can help assessing destination brand performance from a tourist’s perspective. The destination brand equity measurement can be used for benchmarking destination brand performance and destination competitiveness. Utilizing the destination brand equity measurement, DMOs can monitor and track destination brand performance over time. These results will enable destination marketing managers to identify the destination brand strengths and weaknesses. In doing so, destination managers can assess the success of the destination marketing strategies and develop destination brand management programs to combat with competitive pressures.
There is no question that Covid-19 had a negative impact on destinations. Hence, destination brand management is more important than ever and the nature of the relationship between destinations and tourists is paramount to succeed destination brands. Destination marketers should implement Covid-19 safety measures and deliver better tourism experiences to restore destination reputations and keep tourists engaged with destination brands. Understanding the key components of destination brand equity (i.e., brand awareness, physical quality, service quality, self-congruence, and brand identification) and their relationship with brand trust and loyalty are paramount to reduce the negative impact of Covid-19 on tourism demand. The new normal, shaped by Covid-19, places the tourists at the center of the destination branding at post-pandemic recovery. DMOs should introduce tourism activities and programs to create destination brand awareness and an opportunity to develop personalized connections with tourists. By doing so, destination brands can differentiate themselves and sustain their competitiveness in the ever-changing travel market after the Covid-19 pandemic.
Limitations
This study has some limitations. Since this is a correlational study, it is difficult to draw causal relationships between the six destination brand equity dimensions and destination brand loyalty. Future research should examine the causal relationships among brand equity dimensions using experimental methods or longitudinal studies. Although this study provides evidence about the validity of the destination brand equity model in two different cultural settings, the results cannot be generalized to other tourism destinations. Thus, future studies should test the destination brand equity model at different destinations and cultures. In addition, future studies could investigate the effect of destination brand equity on destination competitiveness using financial or non-financial performance indicators. Another limitation is the holistic approach for service quality measurement. Destination physical quality and service interaction quality may not represent all the destination service quality attributes. Although a holistic measurement of service quality is frequently used in tourism research, future work could investigate sub-dimensions of destination physical quality and service interaction quality (e.g., environment quality, transportation quality, accommodation quality, catering quality).
Footnotes
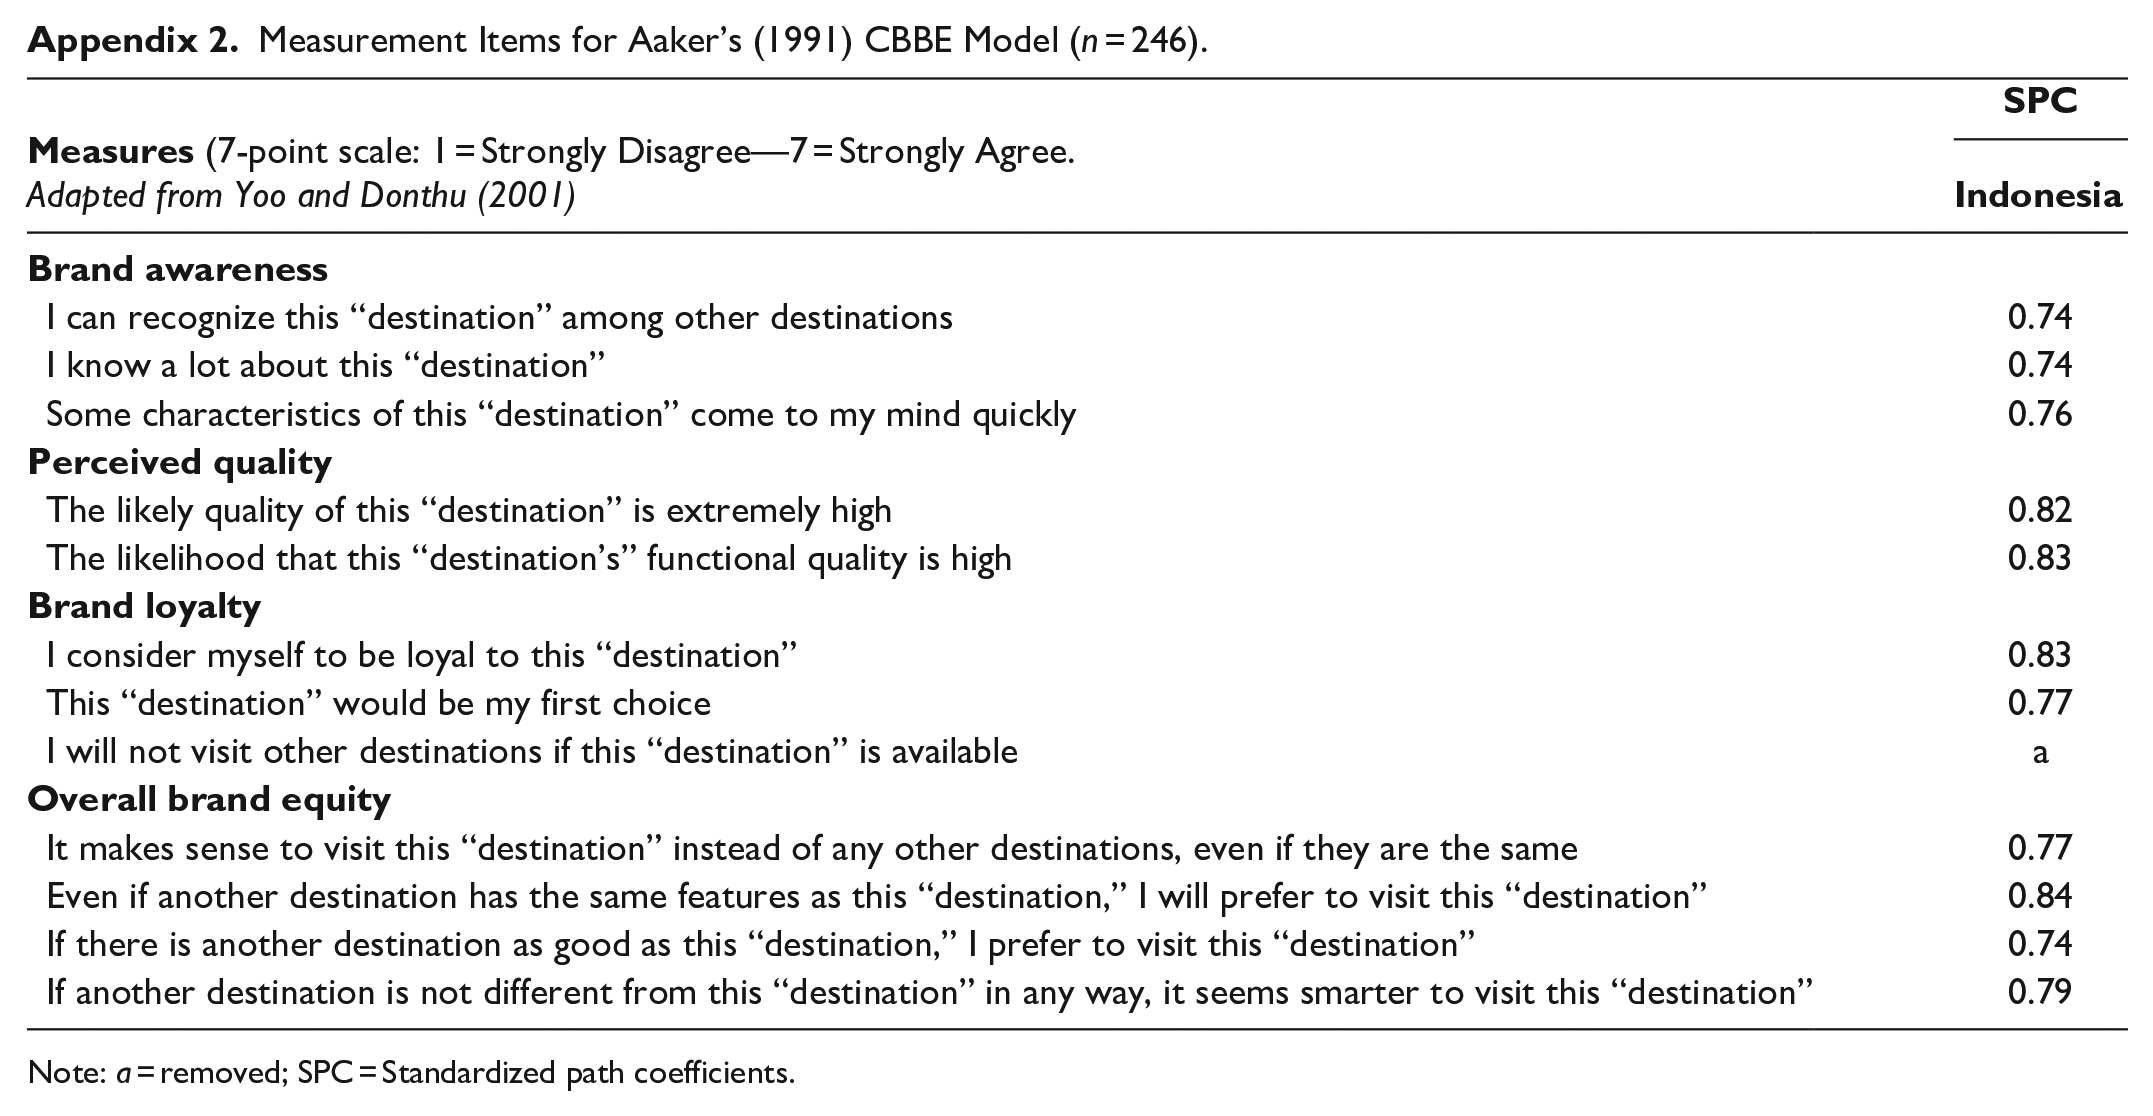
Appendix
Measurement Items for Aaker’s (1991) CBBE Model (n = 246).
|
|
|
|---|---|
|
|
|
| Brand awareness | |
| I can recognize this “destination” among other destinations | 0.74 |
| I know a lot about this “destination” | 0.74 |
| Some characteristics of this “destination” come to my mind quickly | 0.76 |
| Perceived quality | |
| The likely quality of this “destination” is extremely high | 0.82 |
| The likelihood that this “destination’s” functional quality is high | 0.83 |
| Brand loyalty | |
| I consider myself to be loyal to this “destination” | 0.83 |
| This “destination” would be my first choice | 0.77 |
| I will not visit other destinations if this “destination” is available | a |
| Overall brand equity | |
| It makes sense to visit this “destination” instead of any other destinations, even if they are the same | 0.77 |
| Even if another destination has the same features as this “destination,” I will prefer to visit this “destination” | 0.84 |
| If there is another destination as good as this “destination,” I prefer to visit this “destination” | 0.74 |
| If another destination is not different from this “destination” in any way, it seems smarter to visit this “destination” | 0.79 |
Note: a = removed; SPC = Standardized path coefficients.
Acknowledgements
The authors would like to thank the students for assisting in the data collection in the UK.
Declaration of Conflicting Interests
The author(s) declared no potential conflicts of interest with respect to the research, authorship, and/or publication of this article.
Funding
The author(s) disclosed receipt of the following financial support for the research, authorship, and/or publication of this article: This study was supported by the European Regional Development Fund Operational Programme of Andalucia 2014-2020, in the frame of the Andalusian Plan for Research, Development and Innovation (PAIDI 2020) (Grant: P20_00457), and by the University of Malaga’s Research and Transfer Plan, Andalusia Tech (Spain).