
Abstract
The sudden and recurrent nature of COVID-19 challenges the convexity assumption in data envelopment analysis (DEA) and may bias efficiency estimates and crisis response strategies. To address this bias, this study first introduces the non-convex regular variable returns to scale (RVRS) frontier to analyze Chinese listed tourism enterprises efficiency (2017–2023). We evaluate the efficiency evolution and explore how scale adjustment decisions can mitigate the losses caused by the pandemic. Results indicate that while COVID-19 significantly diminished tourism enterprise efficiency, optimal scale adjustments could reduce losses by up to 69.17%. Heterogeneity analysis reveals that large enterprises and travel agency benefited most from scale adjustment. Notably, approximately one-third of enterprises in 2021 were still operating under increasing returns to scale, suggesting that optimal responses to the pandemic were not uniformly contractionary. This study contributes by demonstrating how the RVRS framework improves measurement accuracy and supports more effective, non-linear crisis management decisions.
Keywords
Introduction
The COVID-19 pandemic has exposed the sensitivity and volatility of the tourism industry in responding to shocks (Fotiadis et al., 2021; Muzi et al., 2022). In particular, many tourism enterprises could not adjust their operating capacity smoothly in line with the collapse and subsequent partial recovery of demand. Unlike many manufactured products, tourism services are largely produced and consumed simultaneously and cannot be inventoried for later sale. Their provision also depends heavily on tourists’ physical presence at destinations, which makes tourism especially vulnerable to disruptions in mobility and spatial openness. At the same time, many offline facilities and labor inputs could not be reduced proportionally with falling demand. As a result, tourism enterprises often experienced discontinuous operating states, such as partial reopening, severe underutilization, or temporary shutdown, rather than smooth scale adjustment.
Against this background, the non-convex nature of tourism production becomes an important issue for understanding how tourism enterprises adjust under crisis conditions. Specifically, non-convexity refers to a production technology where the marginal productivity of inputs is not strictly diminishing but may exhibit increasing returns to scale over certain ranges. In the tourism context, this arises because key inputs—such as accommodation capacity, hotel buildings, theme park facilities, or transport fleets are often indivisible and require “lumpy” investments. Consequently, the relationship between inputs and outputs (e.g., revenue and visitor arrivals) is not linear but exhibits S-shaped patterns: output may show increasing returns initially as fixed costs are spread over more units, followed by constant and then decreasing returns due to congestion (Li, 2019).
Beyond structural indivisibility, non-convexity in tourism may also be reinforced by service-specific characteristics and external demand or policy shocks. For instance, tourism services are often highly differentiated and tied to specific locations and service settings, making capacity expansion less standardized and less continuously scalable than in many manufacturing activities. Additionally, the tourism industry is susceptible to external policy interventions, such as visa-free agreements between countries, which can trigger abrupt increases in tourist arrivals and shift enterprises across different returns-to-scale regions, thereby reinforcing the non-convex nature of the production process. Unlike water supply, power grids, railways, or digital platforms, where non-convexity is often associated with network structures, strong fixed costs, or natural monopoly, non-convexity in tourism mainly reflects capacity indivisibilities, minimum operating thresholds, and the disruption of mobility-dependent offline services. This S-shaped production pattern, in which enterprises may experience increasing, constant, and decreasing returns to scale across different operating ranges, is consistent with regular variable returns to scale (RVRS; S. K. Li et al., 2025). The sudden, multi-stage, recurrent, and persistent disruptions caused by COVID-19 made the operational implications of these features particularly salient for tourism enterprises (Kaushal & Srivastava, 2021; Škare et al., 2021).
Consequently, the commonly used variable returns to scale (VRS) condition in data envelopment analysis (DEA), which assumes a convex technology set, may be inadequate under crisis-induced non-convexities (S. K. Li et al. (2024); Olesen & Ruggiero, 2014). Under pandemic-induced stop-and-restart dynamics, a convex DEA frontier may generate infeasible linear combinations of observations and thereby distort both efficiency estimates and the scale-related implications derived from them. Therefore, this study employs the RVRS framework to reassess tourism enterprise efficiency under non-convex production technologies. Specifically, it investigates the dynamic evolution of efficiency and scale adjustment decisions in China’s tourism industry throughout the COVID-19 pandemic, explicitly accounting for the heterogeneity across sub-industries.
Under conditions of post-pandemic recovery and persistent uncertainty, tourism enterprises still face a practical decision problem: how to distinguish temporary performance deterioration from deeper scale mismatch, and how to choose between contraction, maintenance, or expansion of operating scale in response to volatile demand. These challenges are especially acute in tourism, where capacity is partly quasi-fixed, adjustment is costly, and recovery paths vary substantially across sub-industries. For managers, investors, and policymakers, the key issue is not only whether efficiency declined during the pandemic, but also whether different scale adjustment choices could have reduced avoidable losses and improved resilience under crisis and recovery conditions. In the existing literature, enterprise-level tourism efficiency estimates are highly sensitive to methodological choices and sample characteristics, yielding markedly heterogeneous conclusions (H. Liu et al., 2024; Ruan et al., 2019). Although crisis-induced non-convexities and discontinuous scale changes are recognized, they are seldom modeled explicitly in efficiency analyses, and evidence linking efficiency dynamics to scale adjustment decisions remains scarce (Ge et al., 2022; Jiang et al., 2022; Kim et al., 2021; S. K. Li et al. (2024); H. Liu & Tsai, 2021). Prior studies document COVID-19’s adverse effects on tourism enterprises, but decision-relevant evidence remains limited on how efficiency evolved before and after the outbreak and whether scale adjustment choices can mitigate losses across sub-industries and enterprise types (Donthu & Gustafsson, 2020; Fotiadis et al., 2021). Therefore, this study proposes the following research questions: (1) How did tourism enterprise efficiency change before and after the COVID-19 outbreak, and how were these changes related to scale adjustment needs? (2) What scale adjustment decisions should tourism enterprises adopt during COVID-19? (3) How can scale adjustment decisions help tourism enterprises mitigate COVID-19 shocks?
This study contributes significantly to the existing body of literature on tourism crisis management by addressing these key questions. First, we integrate economies of scale theory with tourism crisis management theory by conceptualizing scale adjustment as the operational mechanism through which enterprises restore input-output alignment after abrupt demand shocks (Laitsou et al., 2017). By operationalizing this idea within a non-convex production framework, the study identifies each enterprise’s scale position and the implied direction of scale adjustment, thereby providing a clearer basis for interpreting enterprise responses under crisis and recovery conditions.
Second, methodologically, this study advances tourism efficiency measurement by introducing a non-convex production framework that relaxes the restrictive convexity assumption dominating prior literature. Traditional convex models may overestimate efficiency by ignoring the S-shaped returns to scale inherent in tourism production, especially when capacity is indivisible and demand is volatile. By accurately capturing non-convex technologies, this approach provides a more reliable basis for evaluating tourism enterprise performance under crisis conditions. It also allows us to distinguish between technical inefficiency and scale-induced losses that conventional methods fail to separate, thereby offering a more robust tool for managerial and investment decision-making (He et al., 2024; Ruan et al., 2019).
Third, empirically, prior research has mainly documented the negative performance consequences of COVID-19 for tourism enterprises, but has provided limited evidence on whether scale adjustment decisions can reduce avoidable losses. This study addresses that issue by quantifying the loss-mitigation effects of such decisions. By employing a quasi-natural experiment and counterfactual estimation, we distinguish between realized efficiency losses and avoidable losses. Furthermore, we reveal significant heterogeneity across tourism sub-industries and enterprise types, providing nuanced evidence on when and for whom specific scale adjustment decisions serve as effective damage-control strategies under non-convex production conditions. These findings provide decision-relevant evidence for identifying more effective scale responses under future shocks, offering practical insights not only for managers and investors, but also for policymakers seeking to design more targeted recovery and resilience strategies for the tourism sector.
The remainder of this paper is structured as follows: Section “Literature Review” provides a literature review. Section “Methodology” summarizes the research methods and data description. Section “Empirical Results” presents empirical findings. Section “Further Analysis” provides the results of further analysis. Section “Discussion” discusses the results and Section “Conclusion” draws overall conclusions.
Literature Review
Evaluation of Tourism Efficiency
Tourism efficiency evaluation has become increasingly important in the context of post-pandemic recovery and sustainable development (Y. Wang et al., 2022). Existing studies assess tourism efficiency across multiple units of analysis, ranging from countries and regions to cities, destinations, and enterprises. At the macro level, research compares the efficiency of inbound and outbound tourism development across countries and regions and examines regional or city tourism efficiency (Etzo et al., 2014; R. Tang, 2020;Valadkhani et al., 2017). At the micro level, studies evaluate the efficiency of tourism industry development, destination management, and tourism enterprises (Assaf & Tsionas, 2015; Tran et al., 2023).
Collectively, these studies point to two robust patterns. First, a substantial share of destinations and tourism systems operate below the efficiency frontier, indicating considerable room for improvement. Second, measured tourism efficiency is highly heterogeneous across places and organizational units. For example, He et al. (2024) develop a composite index based on tourism scale and supply quality and show that provincial tourism development still has significant scope for improvement, with low efficiency identified as an important constraint (Ben Aissa & Goaied, 2017; Xia et al., 2018). Similar evidence of low tourism efficiency is reported in city-level analyses (Zhou et al., 2019). Notably, reported efficiency levels and rankings are sensitive to evaluation scale and methodological specification, which helps explain divergent findings across studies (Chaabouni, 2019; Z. Liu et al., 2021).
Building on the first pattern, it is useful to consider tourism-specific operating characteristics that systematically weaken the input-output transformation process, even in the absence of major shocks (Zha et al., 2022). First, tourism operations rely on specific resources and often entail high fixed or quasi-fixed requirements, reducing short-run flexibility and increasing unit costs when demand contracts (Guo et al., 2020; Nguyen & Yu, 2020). Second, capacity constraints and the indivisibility of many tourism services can generate persistent underutilization and discontinuous adjustments (Boto-García et al., 2025). Third, strong seasonal volatility may weaken input-output matching over time and disrupt performance (D. Zhang & Xie, 2023). Fourth, the fragmented and interdependent nature of tourism supply chains increases coordination costs and creates significant constraints in key areas such as transportation, attractions, and accommodation, thereby reducing allocative efficiency (Karsokiene et al., 2026; S. Zhang et al., 2024). Fifth, heterogeneity in managerial and digital capabilities, including differences in revenue management, process standardization, and platform adoption, contributes to persistent performance disparities across tourism enterprises (R. Tang, 2024; Ye & Miao, 2025). Taken together, these tourism-specific characteristics not only help explain the widespread presence of sub-frontier performance and persistent inefficiency in tourism, but also suggest that factors such as product or service indivisibility and fixed or quasi-fixed operating requirements may cause the underlying production technology to depart from standard convexity assumptions.
Building on the second pattern of strong heterogeneity in measured tourism efficiency, subsequent research has shown that part of this variation reflects the sensitivity of efficiency estimates to modeling choices and changing operating conditions (Parmeter, 2024). This sensitivity becomes particularly salient under major disruptions such as COVID-19, because such shocks can substantially reshape both demand conditions and enterprise operations. A growing body of tourism research documents that the pandemic generated severe, uneven, and persistent impacts across the sector, and that tourism enterprises were often less resilient than enterprises in many other industries (Collins et al., 2021; Duro et al., 2021; Falk et al., 2023; Gunter et al., 2024; Rastegar et al., 2025). However, these crisis effects should not be interpreted as implying that external shocks directly create non-convex production relationships. Rather, COVID-19 renders the operational implications of these underlying structural constraints more visible, particularly by accentuating scale mismatch, capacity underutilization, and interrupted operating patterns. Accordingly, when standard modeling assumptions do not adequately represent actual operating conditions, efficiency estimates become more sensitive to frontier specification and more prone to measurement bias (Xiong et al., 2024;Zha et al., 2020).
Overall, the above discussion points to an important methodological implication for tourism efficiency evaluation. The structural characteristics of tourism production—particularly fixed or quasi-fixed operating requirements and the indivisibility of many tourism products or services—suggest that the feasible production set may not be adequately represented by a single convex frontier (Thi Nguyen & Yu, 2025). Under such conditions, efficiency assessment frameworks that impose a single convex frontier may only imperfectly represent the feasible production set and provide a partial picture of relative performance (Chen et al., 2025). These tourism-specific technological characteristics therefore need to be borne in mind when choosing and interpreting efficiency measures, and they motivate the use of frameworks that can explicitly accommodate non-convex technologies and mixed returns to scale.
Tourism Efficiency Measurement Methods
Most tourism efficiency studies rely on frontier-based approaches, particularly data envelopment analysis (DEA). More recent work has increasingly questioned whether conventional formulations are fully appropriate for tourism settings and has explored refinements (D. Wu et al., 2023). In particular, scholars have revisited the suitability of traditional DEA models for tourism and have proposed alternative specifications or extensions to mitigate potential measurement issues related to slacks, ranking, and discrimination power, such as using non-radial slack-based measure models, super-efficiency DEA, and cross-efficiency DEA (Nurmatov et al., 2021). Importantly, these refinements generally remain grounded in the convexity assumption of the production possibility set.
Parametric frontier approaches such as stochastic frontier analysis (SFA) have also been applied, as they allow for statistical noise and random shocks in the estimation of efficiency (Ma et al., 2024). However, when tourism technologies exhibit regime shifts, nonlinearity, or mixed returns to scale—features that may be accentuated in disruptive periods—standard parametric specifications can be restrictive. Beyond supply-side efficiency measurement, some studies employ preference-function approaches to evaluate tourism performance from the demand side (Bravi & Gasca, 2014). In addition, a strand of research uses financial ratios or stock market indicators as proxies for efficiency or performance, instead of directly estimating a production frontier (Buallay et al., 2022;García-Gómez et al., 2022). While informative, these proxies are not direct measures of the production process and may be difficult to compare across heterogeneous tourism business models and asset structures.
Accordingly, the efficiency literature has tried to develop non-convex and local-frontier approaches in response to these limitations, including directional distance and local-frontier estimators (Daraio & Simar, 2007), modified DEA formulations under relaxed and non-convex settings (Kerstens & Van de Woestyne, 2014), slack-based network DEA extensions (Tone & Tsutsui, 2015), and regularized non-convex frameworks (Kerstens et al., 2022). These models enhance reliability in small-sample contexts through non-parametric estimation and asymptotically consistent confidence intervals. They further disentangle scale efficiency from pure technical efficiency under non-convex constraints by constructing non-convex frontiers integrated with directional distance functions and scale elasticity metrics. Nevertheless, when technologies feature multi-stage production, mixed returns to scale, and discrete scale adjustments—as is often the case in tourism enterprises—the decision-support content of these models for scale-related management choices can still be limited.
Against this background, the RVRS framework could be employed. RVRS can be viewed as the minimal extrapolation set that satisfies strong disposability while allowing S-shaped returns to scale, thereby reducing measurement bias under non-convex technologies and providing a more robust decomposition of pure technical versus scale efficiency (S. K. Li et al., 2025). This structure is particularly suitable for tourism enterprises, where lumpy quasi-fixed inputs, capacity and regulatory constraints, and abrupt demand shifts make non-convex production sets and mixed returns to scale empirically plausible (Gössling et al., 2024; Lin et al., 2022).
COVID-19, Tourism Enterprises and Management Decision
COVID-19 has affected the strategic decisions and performance of tourism enterprises. As micro-level units of the tourism system, tourism enterprises play a central role in the recovery and long-term sustainability of the tourism sector, yet the overall recovery potential of global tourism remains constrained (Gössling et al., 2024). In response to the pandemic, many tourism enterprises have adjusted their strategies by tightening internal cost controls, increasing investment in innovation, modifying product offerings, transforming business structures, and actively seeking government guidance (Demydyuk & Carlbäck, 2024; Knight et al., 2020;Yang et al., 2024). However, relatively little empirical attention has been paid to scale-adjustment decisions.
Research on the impact of COVID-19 on tourism enterprise performance has mainly focused on internal financial conditions and behaviors, such as operational efficiency, financial leverage, revenue volatility, foreign-exchange risk, and corporate social responsibility (Chen & Hang, 2021; Mao et al., 2021). For example, Hu et al. (2024) conducted a relational study based on the daily coronavirus influenza index and a tourism industry stock index to quantify the negative impact of COVID-19 on the tourism industry. While these indicators reflect the ultimate economic consequences of the crisis, they often fail to disentangle the underlying operational mechanisms driving performance decline. Specifically, financial metrics may mask internal inefficiencies such as resource misallocation, capacity underutilization, and managerial rigidities exposed during severe supply-side disruptions (Alatawi et al., 2023). Consequently, relying solely on financial indicators risks overlooking the critical input-output processes that determine enterprise resilience and recovery potential (Lee et al., 2024; Sigala, 2020). Despite the importance of operational efficiency, few studies have adopted a production-frontier perspective to systematically evaluate the impact of COVID-19 on individual tourism enterprises, particularly regarding how efficiency changes relate to concrete scale-adjustment decisions.
The existing literature suggests that selecting appropriate objects and methods for evaluating tourism enterprise efficiency is particularly critical, especially during COVID-19. Most related studies rely on efficiency measures that impose convexity on the production possibility set and often overlook the potential non-convex characteristics of tourism production under crisis conditions. This limitation can introduce bias into the decomposition of technical and scale efficiency, thereby misleading scale-adjustment decisions. Therefore, this study measures the RVRS efficiency of tourism enterprises under non-convex technical conditions and compared it with traditional methods. It also examines RVRS efficiency trends and sub-industries heterogeneity and to identify associated scale-adjustment decisions. Building on this measurement, we construct a quasi-natural experiment to estimate the net impact of COVID-19 on tourism enterprise efficiency and, using counterfactual estimation, assess whether scale-adjustment decisions mitigate efficiency losses and how such effects differ across tourism sub-industries. Our analysis links efficiency dynamics under COVID-19 to the decision space of tourism enterprises and provides decision-relevant evidence to inform scale and resilience-oriented adjustments in times of crisis.
Methodology
Models
Measurement of Tourism Enterprise Efficiency
The tourism industry is a typical service sector in which COVID-19 prompted rapid reallocation of production inputs. During the pandemic, substitution effects across production factors may become nonlinear, and the increasing-returns region of the production function may exhibit non-convexity. As a result, conventional DEA models relying on a convex technology set may produce biased efficiency estimates. To address this issue, we adopt the RVRS approach proposed by S. K. Li et al. (2024), which constructs an empirical production frontier capable of capturing S-shaped scale returns and thus improves efficiency measurement under pandemic-induced structural disruptions. The empirical production frontier is specified as follows:
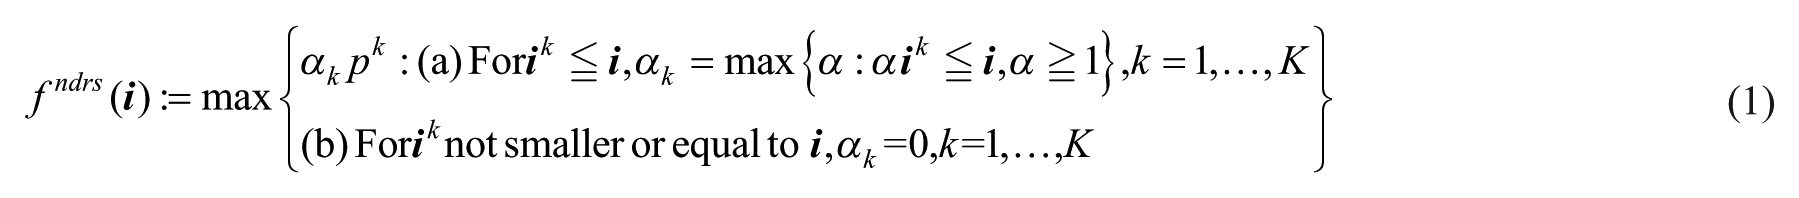

In Equations 1 and 2,

Furthermore, after determining the empirical production frontier, we calculate technical efficiency and scale efficiency separately. The input set required for an output

The expanded production function incorporating the technology input coefficient at optimal scale is denoted as

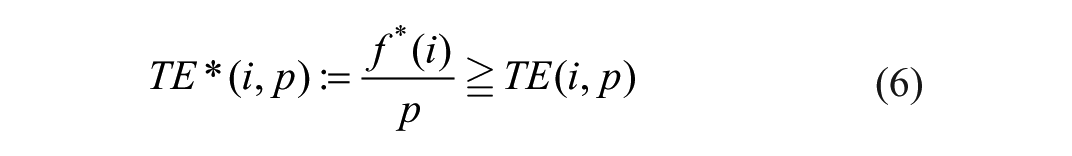
By solving Equations 4 to 6 simultaneously, the scale efficiency calculation formula (7) can be derived.

An enterprise’s overall efficiency (OE) is the product of its technical efficiency (TE) and scale efficiency (SE). Conceptually, OE represents the comprehensive performance evaluated at the optimal operational scale under constant returns to scale, which corresponds to TE* in this model. Specifically, OE, TE, and SE are utilized to trace the efficiency evolution and scale adjustment decisions of tourism enterprises. Concurrently, OE serves directly as the dependent variables in the ensuing PSM-DID model to causally identify the impact of the COVID-19.
Model for Measuring the Impact of COVID-19
This study treats COVID-19 as an exogenous shock and employs a quasi-natural experimental design. Given the heterogeneous pandemic impacts across industries, it is difficult to assume identical time effects without a comparable benchmark group. Therefore, we use propensity score matching (PSM) to construct a control group with characteristics similar to the tourism sample (J. Wang, 2021), as shown in Equation 8:

h(·) is a linear function and F(·) is a logistic function. The dependent variable is tourismit, representing whether the sample is a tourism enterprise. The independent variables

OEit represents the overall efficiency of listed tourism enterprises in China. The dummy variable treati indicates whether enterprise i is in the treatment group, with a value of 1 if it is, and 0 otherwise. The dummy variable dt represents the time of the shock, defined as 1 after the shock event, and 0 otherwise. The interaction term between these two variables represents the treatment effect of COVID-19 on the efficiency of tourism enterprises. Controlit represents the control variables. μi represents the individual fixed effects, δt represents the time fixed effects, and σit is the error term.
As illustrated in Figure 1, the empirical framework aims to generate scale adjustment decisions based on accurately measured efficiency changes under the COVID-19 shock and to evaluate the extent to which such decisions can mitigate pandemic-induced losses. The efficiency measurement model provides reliable estimates of technical and scale efficiency and identifies the scale adjustment decisions. The DID approach is then used to identify the exogenous efficiency shock induced by COVID-19, which serves as a benchmark for counterfactual analysis. The efficiency measurement and the DID analysis serve distinct but complementary purposes in our empirical framework.
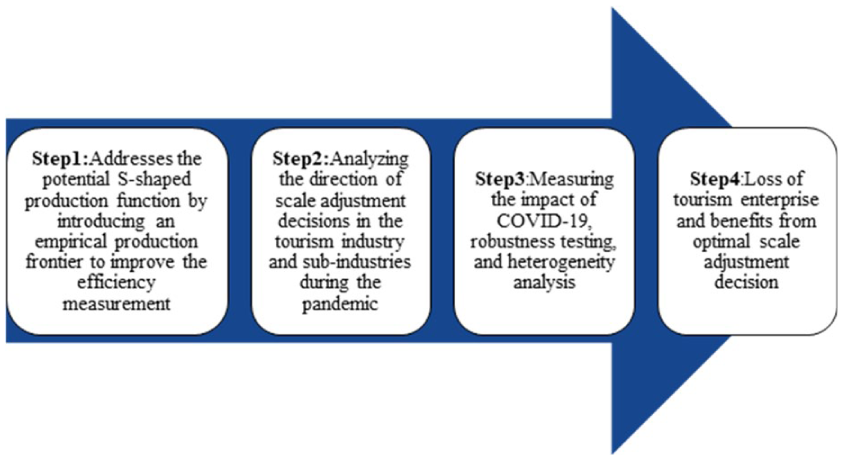
Empirical research process diagram.
Variable Selection
This section defines variables used for efficiency measurement and DID model. The core variables are overall efficiency (OE), technical efficiency (TE), and scale efficiency (SE) in tourism enterprise. Following prior studies (Q. Wang et al., 2016; Y.-C. Wu & Lin, 2022), total operating revenue (R) is used as the output variable. Input variables include capital input (K), proxied by fixed asset investment, and labor input (L), represented by the number of employees, following the Cobb-Douglas production function. These variables are used constructing the matched control group for the DID analysis.
In addition, we control for key variables that affect enterprise efficiency (Y. Li & Singal, 2019; Masset et al., 2019; Ozdemir & Erkmen, 2022; Pan et al., 2022; H. Tang et al., 2020). The control variables include capital intensity (ci), physical asset holdings (pa), debt-to-asset ratio (debt), liquidity ratio (ldb), and the average age of management (age). Table 1 describes the main variables used in the empirical part of this study. The range and variation of variables are within reasonable limits. Missing values for individual data points were supplemented using linear interpolation before conducting the econometric analysis.
Descriptive Statistics.
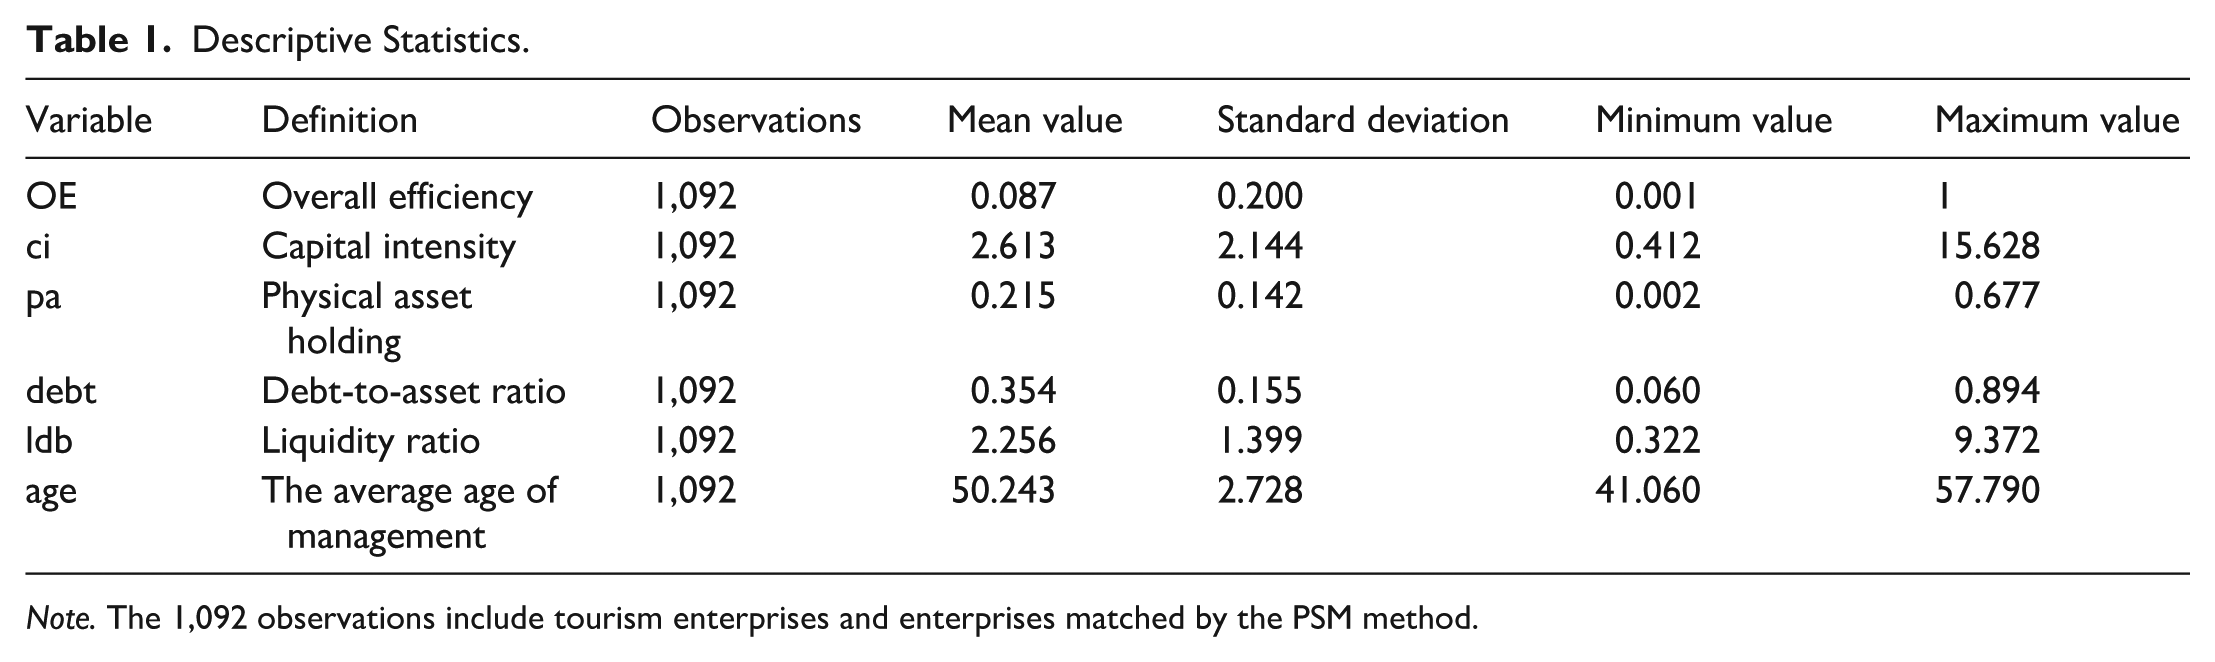
Note. The 1,092 observations include tourism enterprises and enterprises matched by the PSM method.
Data Sources
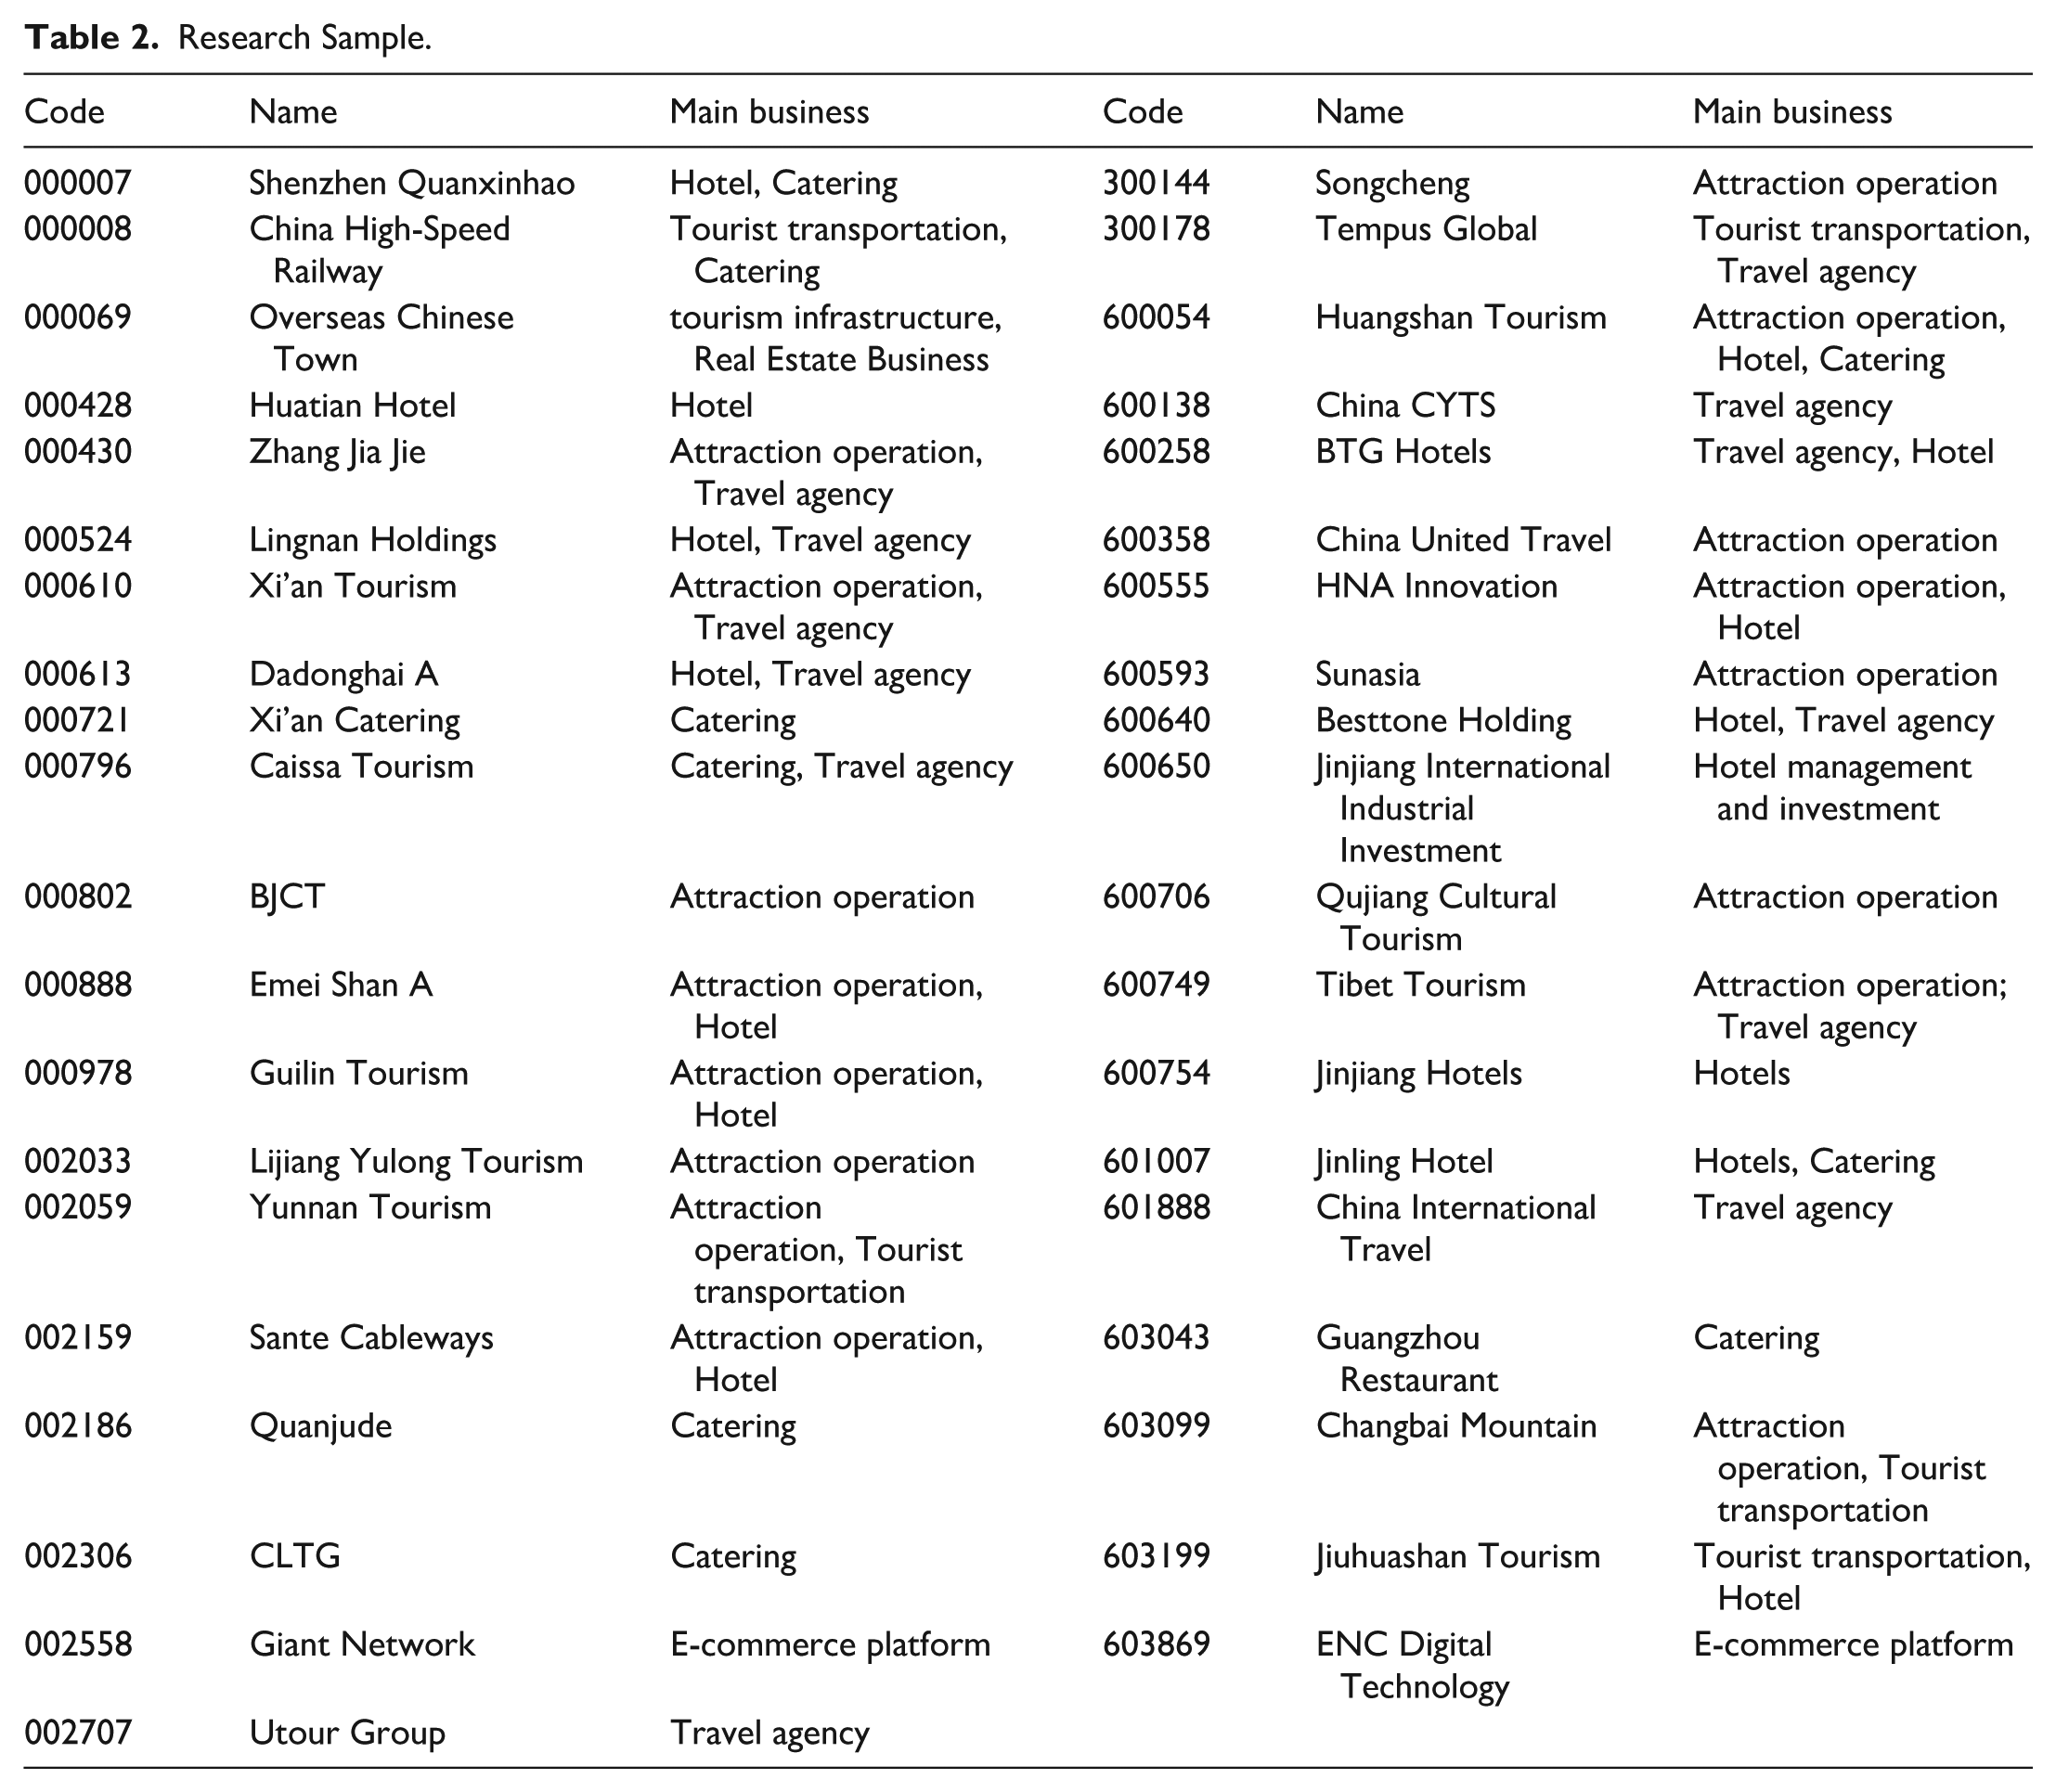
Based on the “National Tourism and Related Industries Statistical Classification (2018)” published by the National Bureau of Statistics of China and considering the main business activities, we selected 39 A-share listed tourism enterprises as the research sample (Qiu et al., 2021), covering the period from 2017 to 2023. The sample was drawn from all A-share listed enterprises in China and includes enterprises whose core business activities are highly related to tourism, with tourism-related revenue accounting for a significant proportion of total income. To ensure the representativeness of the sample, it covers key tourism sub-industries, such as travel agencies, hotels, transportation, and catering. Enterprises marked as ST or ST* during the study period, as well as those with missing data for three consecutive years, were excluded. The primary data indicators for this study are sourced from the annual reports of the sample enterprises, the CSMAR database and the Wind database. The research sample is shown in Table 2.
Research Sample.
Empirical Results
Measurement and Trends of Tourism Enterprise Efficiency
Figure 2 illustrates the temporal evolution of overall efficiency (OE) in tourism enterprises, displaying an “N-shaped” pattern with initial growth, a sharp decline, and a gradual recovery. Before the COVID-19 shock, OE increased steadily to approximately 0.25, reflecting positive growth.
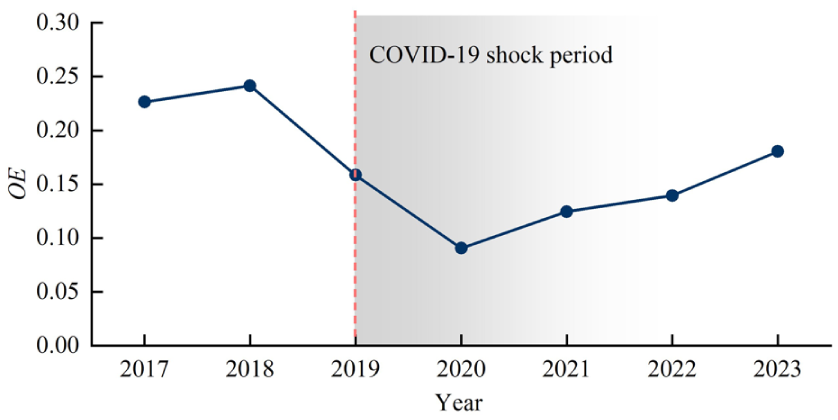
Evolutionary trend of tourism enterprise efficiency.
At the end of 2019, the tourism sector faced the initial impact of COVID-19, with rising travel restrictions and public concerns leading to a decline in efficiency. During the peak of the pandemic, stringent control measures and heightened travel risks caused severe operational disruptions, resulting in efficiency plummeting to below 0.1 by the end of 2020.
By 2021, as the pandemic came under partial control and regulatory restrictions eased, the industry began a phased recovery, starting with intra-provincial travel and followed by inter-provincial travel, allowing enterprises to resume operations. Simultaneously, some enterprises optimized their operations, and the exit of inefficient enterprises further contributed to efficiency gains. In that year, domestic tourism revenue grew by 31.0% compared to 2020. Following the pandemic, the release of pent-up demand, along with government incentives, drove a recovery in efficiency, with OE rising to 0.18 by 2023, gradually returning to its pre-pandemic growth trajectory.
Comparative Analysis of Efficiency Under Different Production Frontiers
When the assumption of a convex production frontier does not hold, the efficiency values and decision-making results estimated using traditional DEA methods may be biased, potentially leading to misguided conclusions for enterprises. To address this critical shortcoming, a new empirical frontier is adopted to model the non-convexity in the production concentration of tourism enterprises and to re-measure the efficiency, comparing the results with those obtained from traditional methods.
Evolution of Efficiency Under Different Methods
The measurement includes the technical efficiency (TEFD) and scale efficiency (SEFD) with returns to scale under a non-convex production set. As shown in Figure 3, TEFD fluctuated between 0.1735 and 0.396, with a sharp decline during the COVID-19 period. In contrast, SEFD exhibited high-level fluctuations and a nearly “V-shaped” trend during the research period, showing a decline in scale efficiency even before COVID-19. This pattern may partly reflect an improvement in the technical efficiency of the tourism industry, particularly through the integration of digital VR, the metaverse, and other technologies with tourism (F. Zhang & Cheng, 2024), which have shifted the creation of tourism experiences away from large-scale landscape development and modifications, leading to a reduction in marginal returns to scale. Additionally, it is noteworthy that during the early stages of COVID-19, the scale efficiency of tourism enterprises dropped significantly to a low of 0.5114. Strict government control measures, combined with heightened risk awareness among residents, suppressed emotional demand for travel. Global supply chain disruptions prevented tourism enterprises from maintaining optimal production scales, forcing operations at suboptimal levels distant from the long-run average cost minimum, triggering acute efficiency deterioration. This aligns with China’s 2020 tourism sector data, where the number of tourism enterprises remained relatively stable while industry revenue plunged nearly 61%. However, in the later stages of COVID-19, scale efficiency rebounded, likely due to the gradual relaxation of control measures, leading to an increase in tourist numbers. Larger, branded tourist destinations were better positioned to accommodate more visitors, resulting in clear scale benefits. After the end of COVID-19, the growth rate of scale effects slowed, but continued to grow steadily.
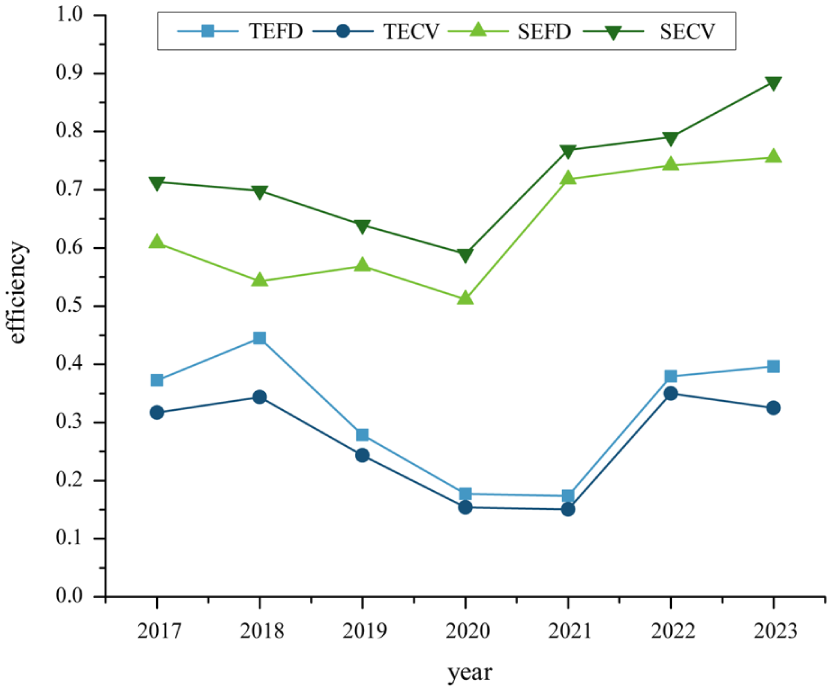
Efficiency of different methods.
Compared to the traditional convex production set’s technical efficiency (TECV) and scale efficiency (SECV), TEFD is 10% higher than TECV, but the overall trends are largely the same, with differences only emerging in 2023. In contrast, SEFD is 10% lower than SECV, with trend differences observed both before and after COVID-19. These differences are primarily due to the sources of inefficiency. SECV ranges between 0.51 and 0.756. These values are consistently higher than the corresponding average technical efficiency scores (TECV). This indicates that tourism enterprises are highly inefficient in terms of technology, but the losses due to scale inefficiency were greater, especially under the impact of COVID-19. The potential gains from reducing scale inefficiency in tourism enterprises outweigh those from reducing technical inefficiency. However, under the traditional convex production set, scale efficiency estimates tend to be overestimated, while technical efficiency is underestimated. Policymakers should continue to focus on internal management within the tourism industry, while also considering the external environment related to industry scale, especially in the context of sudden events where flexible adjustments to supply scale are necessary.
Rankings of Scale Efficiency and Technical Efficiency
Comparing efficiency rankings (Appendix A, Table 11) reveals significant discrepancies between our non-convex RVRS model and traditional convex methods, with some enterprises shifting over 20 positions. Crucially, traditional models tend to overestimate complex tourism enterprises while underestimating specialized providers (e.g., catering), failing to recognize their efficiency at smaller scales. This confirms that relying on conventional convex assumptions can lead to misguided scale adjustments, validating the necessity of our improved methodology.
Comparative Analysis of Sub-Industries Within Tourism Enterprises
Based on the main business activities, the Chinese A-share listed tourism enterprises are divided into six sub-industries: Hotel, Transportation, Attraction operation, Travel agency, Catering, and E-commerce platform (Hu et al., 2024). This analysis aims to reveal how the efficiency of China’s tourism industry has been impacted by COVID-19 and how enterprises have adjusted their scale decisions.
Efficiency Trend in Sub-Industries
Using the year of the COVID-19 as a critical point, a comparative analysis was conducted on the average technical efficiency (TEFD) and scale efficiency (SEFD) of six tourism sub-industries before and after this period, as shown in Table 3. In terms of technical efficiency, e-commerce platforms and travel agencies ranked first and second, while attraction operations dropped from third place to the last, with a decrease of 0.128, mainly due to the forced suspension of most attraction services. In terms of scale efficiency, e-commerce platforms remained in the top position, while travel agencies fell from third to last, with an average scale efficiency decline of nearly 0.15. Overall, attraction operations experienced a decline in technical efficiency, and travel agencies saw a significant drop in scale efficiency. Digital channels helped travel agencies maintain service capability and technical efficiency, but their hub-like role—requiring coordination with multiple tourism service providers—led to heavy reliance on fixed costs and offline operations. Under the demand contraction caused by the pandemic, this structural rigidity limited timely scale adjustments, resulting in a significant decrease in scale efficiency. E-commerce platforms were the least affected, as they do not depend on offline operations and physical facilities. This suggests that integrating digital transformation into the tourism industry is a feasible strategy to cope with pandemics.
Efficiency Results of Sub-Industries.
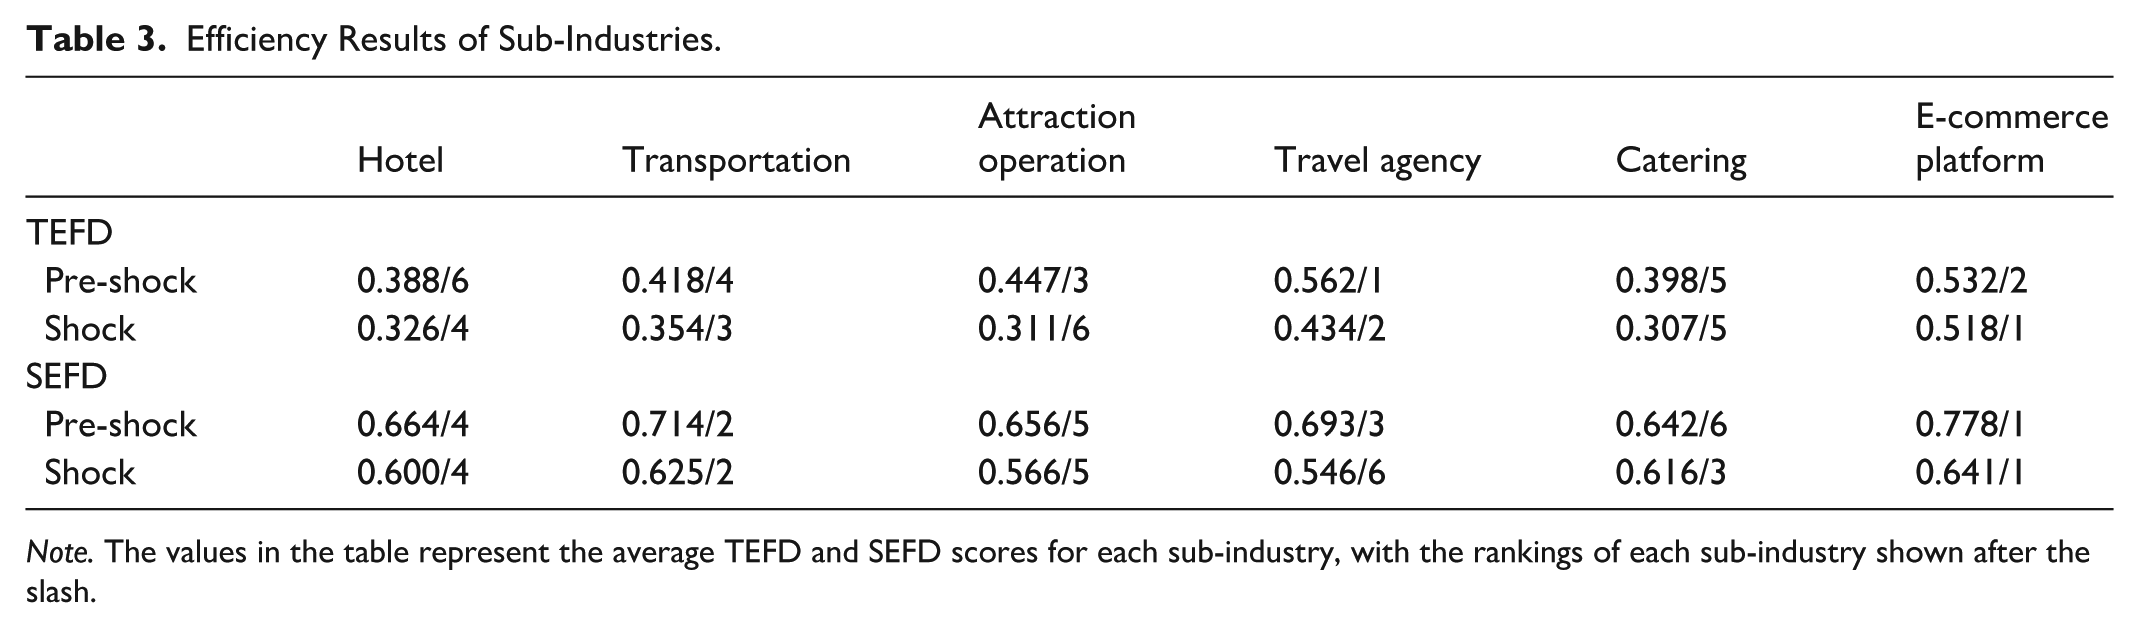
Note. The values in the table represent the average TEFD and SEFD scores for each sub-industry, with the rankings of each sub-industry shown after the slash.
Scale Adjustment Decisions in Tourism Sub-Industries
The scale returns of tourism enterprises were significantly impacted by COVID-19, with enterprises experiencing different levels of impact, leading to divergent directions in their scale adjustment decisions. Enterprises are classified based on constant returns to scale (CRS) as a reference. Enterprises in the increasing returns to scale (IRS) region need to further expand their scale to achieve Pareto optimality, while those in the decreasing returns to scale (DRS) region are considered oversized and need to reduce their scale. Table 4 reports the number of enterprises within each range.
Scale Adjustment Decisions in Sub-Industries.
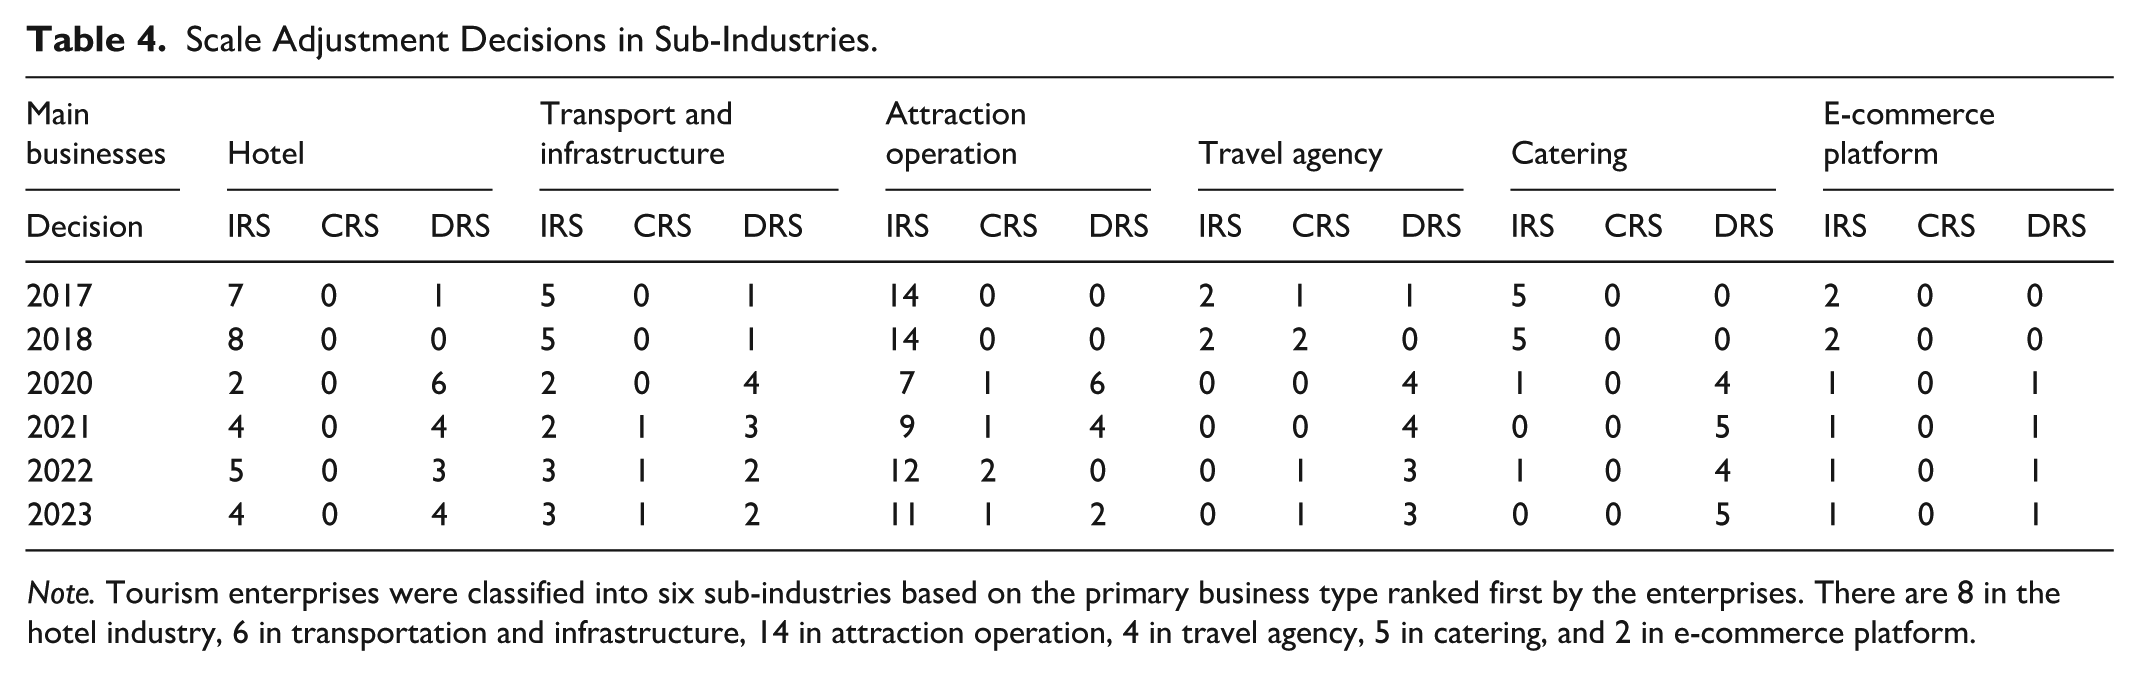
Note. Tourism enterprises were classified into six sub-industries based on the primary business type ranked first by the enterprises. There are 8 in the hotel industry, 6 in transportation and infrastructure, 14 in attraction operation, 4 in travel agency, 5 in catering, and 2 in e-commerce platform.
Before the COVID-19 pandemic, most enterprises were in the IRS regions, indicating a need for expansion, and only one enterprise was in the DRS region in 2018. However, during the pandemic, the proportion of enterprises in the DRS regions surged, reaching 65% by 2020, reflecting the severe contraction in tourism demand and the resulting scale mismatch. As the pandemic shock gradually weakened, the number of enterprises requiring scale reduction declined, but remained at 17 by 2023. Throughout this period, many tourism enterprises were compelled to adopt scale reduction strategies, primarily by lowering operational costs to maintain efficiency. These results suggest that while scale expansion may be appropriate under stable market conditions, flexible and adaptive scale adjustments are crucial for enhancing enterprise resilience in the face of sudden external shocks.
Specifically, from the perspective of sub-industries heterogeneity within the tourism industry, more than half of the enterprises in the hotel, transportation, travel agency, and catering sub-industries entered the DRS region in 2020, reflecting a sharp contraction in demand and forcing these enterprises to rapidly scale back operations. In contrast, the scale adjustment decisions of attraction operation and e-commerce platform enterprises exhibited relatively limited fluctuations. As China’s epidemic control strategy shifted from nationwide lockdowns to localized containment, large tourist attractions were gradually allowed to partially reopen. Visitor flows were dominated by local residents and short-distance trips, resulting in reduced tourist volumes. Meanwhile, enterprises scaled back investments in scenic area operations and development. This resulted in simultaneous declines in both technical efficiency and scale efficiency for such enterprises, while their scale adjustment decisions remained relatively stable. E-commerce platforms, characterized by lower reliance on offline operations and lower fixed costs, were less affected by the pandemic, and thus exhibited lower sensitivity in scale adjustment decisions. Moreover, over one-third of enterprises needed to expand scale in 2021, which contradicted the prevailing notion that downsizing during crises could enhance efficiency.
Analysis of Size Heterogeneity in Tourism Enterprises
Kernel Density Estimation of Efficiency by Enterprise Size Grouping
First, we analyzed the kernel density distribution of technical efficiency by enterprise size (Appendix B, Figure 7). The results indicate that small-size enterprises experienced a widening efficiency gap during the shock but exhibited a rapid post-pandemic rebound (convergence to higher efficiency levels), reflecting their operational flexibility. In contrast, large-size enterprises displayed a multi-modal distribution with a notable downward shift in the frontier, suggesting that while resilient, they faced structural rigidities in technical adjustments.
Second, we examined the evolution of scale efficiency (Appendix B, Figure 8). The distribution for small-size enterprises shifted from a narrow peak to a bimodal pattern during the crisis (indicating severe volatility) before quickly returning to a high-efficiency single peak. Conversely, large-size enterprises showed an initial decline followed by a stable recovery with minor fluctuations, confirming their stronger capacity for crisis buffering but slower responsiveness compared to agile smaller enterprises.
Scale Adjustment Decisions by Enterprise Size Grouping
Based on the scale adjustment decisions and efficiency averages, the scatter distribution of the actual size and efficiency of tourism enterprises is divided into four quadrants, as shown in Figure 4. This is used to observe the changes in the tourism industry before and after the impact of COVID-19. Generally, increasing returns to scale are common in small enterprises. However, different situations may arise under the impact of unexpected events.
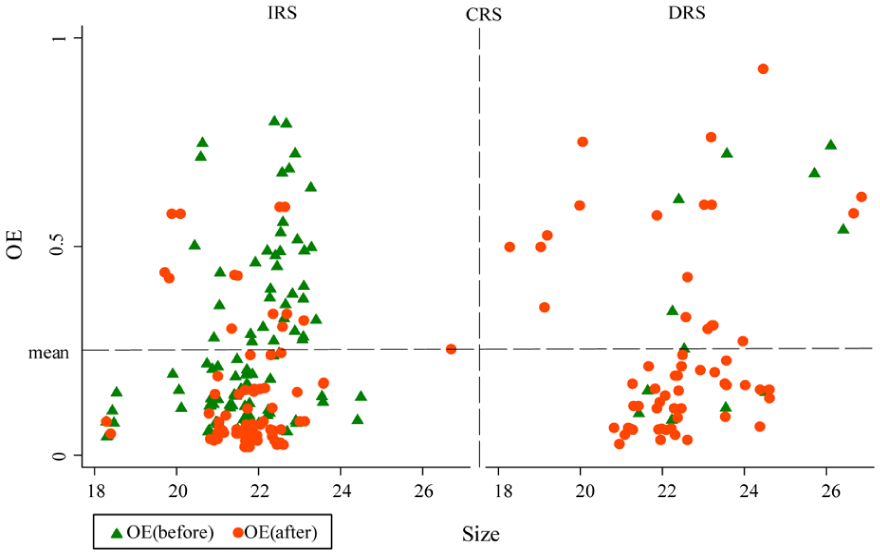
Overall efficiency and decision quadrant diagram for tourism enterprises.
The results show that before COVID-19, most samples were in the IRS decision region, with only a few enterprises needing to reduce their scale. The tourism industry was in a market expansion phase, characterized by strong competition, as many small-size enterprises were vying for market share. The market in the tourism industry showed a trend of healthy competition. Specifically, within the IRS decision region, the marginal effect of scale expansion on production efficiency is stronger for enterprises in the high-efficiency range compared to those in the low-efficiency range. In the DRS region, only large-size enterprise samples are present. During the pandemic, some small-size enterprises were delisted, highlighting that large-size enterprises demonstrated stronger risk resilience and occupied a significant market share. In the high-efficiency DRS region, apart from the addition of a few small-size enterprises, the presence of large-size enterprises remained similar to the pre-impact period. The number of enterprises in the low-efficiency DRS region increased significantly, with most small-size enterprises experiencing a decline in efficiency and needing to adopt contraction strategies. This reflects that COVID-19 had a greater impact on small-size enterprises, leading to the emergence of a “winner-takes-all” trend among large-size enterprises in the market.
Analysis of Ownership Differences
The samples were divided into state-owned enterprises and private enterprises based on ownership attributes for heterogeneity analysis. The results are presented in Table 5.
Efficiency and Scale Adjustment Decisions of Enterprises With Different Ownership.
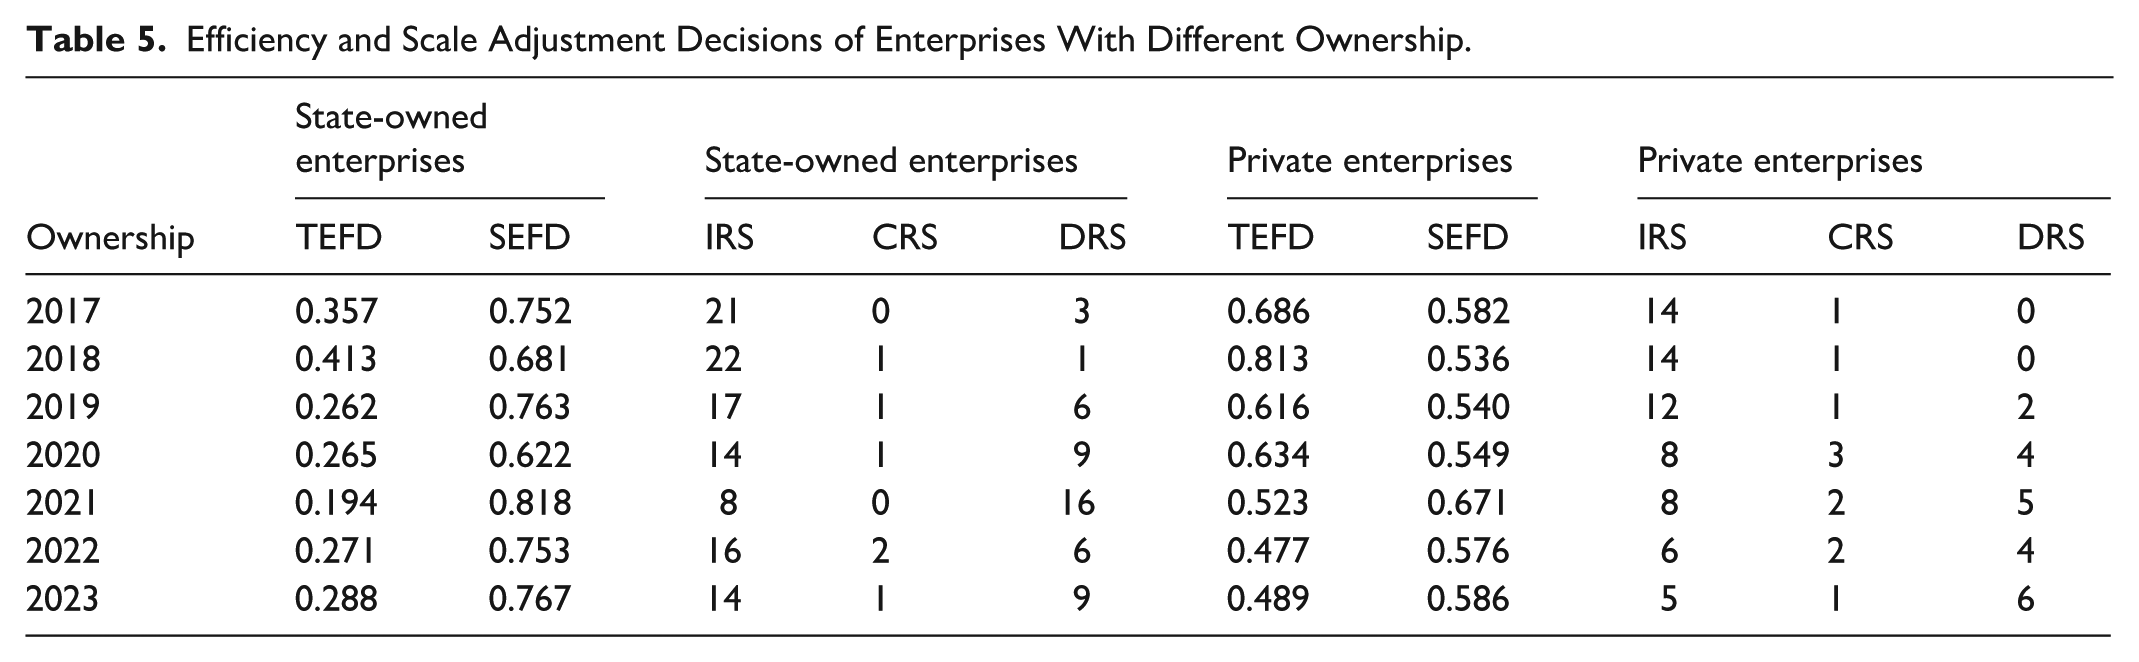
In terms of efficiency changes, state-owned enterprises are driven primarily by scale efficiency, with relatively lower technical efficiency, which is the opposite of private enterprises. Under the impact of COVID-19, state-owned enterprises experienced a short-term decline in scale efficiency, reaching its lowest point at 0.622 by the end of 2020, but scale efficiency quickly rebounded after the impact. Notably, the overall efficiency of state-owned enterprises consistently remained lower than that of private enterprises, with the efficiency gap between the two narrowing only during COVID-19. Private enterprises are constrained by the laws of the market economy, following the rules of market entry and exit, where survival of the fittest prevails, leading to intense competition. This not only forces private enterprises to improve their technical efficiency, but also squeezes out inefficient enterprises (all three tourism enterprises that delisted between 2022 and 2023 were privately owned), resulting in a relatively higher average efficiency among the private enterprise samples. State-owned enterprises exhibit stronger risk resilience but may also harbor inertia due to “government bailouts,” resulting in lower technical efficiency compared to private enterprises. Additionally, the technical efficiency of private enterprises significantly declined after COVID-19, while scale efficiency began to increase. This reflects a trend where private tourism enterprises are gradually shifting towards being driven by scale efficiency and had to focus on adjusting their operating scale in response to the crisis.
In terms of scale adjustment decisions, most private enterprises were in the IRS region, but during COVID-19, the number of enterprises in the IRS and DRS regions tended to balance. Most state-owned enterprises moved into the DRS region, increasing from 9 to 16 during COVID-19, which is likely related to idle resources and waste in state-owned enterprises’ resource management. These enterprises urgently need to downsize to achieve optimal production. COVID-19 pandemic revealed the issue of technical inefficiency in state-owned enterprises, which suggests that government departments could strengthen their guiding role and regulatory effectiveness, while enterprise managers implement innovative incentives or set target constraints, to drive technological breakthroughs in state-owned enterprises through a combination of “external pressure” and “internal motivation.”
In summary, we re-evaluated the efficiency of tourism enterprises with different characteristics before and after COVID-19 using a new method. Traditional methods have overestimated the scale efficiency of tourism enterprises. During the pandemic, e-commerce platform enterprises and large-size enterprises performed excelled. However, state-owned enterprises exhibited issues of technical inefficiency. During COVID-19, the number of enterprises in DRS increased dramatically. But the scale adjustment decisions of attraction operation and e-commerce platform sub-industry changed little.
Further Analysis
To further verify the mitigating effect of scale adjustment decisions against the COVID-19 shock, we adopt a rigorous causal framework. We first quantify the overall impact of the external shock on tourism enterprises by employing a PSM-DID model (Jin et al., 2023). Subsequently, we construct a counterfactual scenario to estimate the specific effectiveness of these scale adjustments in recovering efficiency.
Selection of the Control Group
In this quasi-natural experimental design, the treatment group consists of tourism enterprises, while the control group comprises 117 non-tourism enterprises selected from the full sample of China’s A-share listed enterprises using propensity score matching (PSM) at a 1:3 ratio. Enterprises internal characteristics such as enterprise size, leverage ratio, equity ratio, total asset growth rate, price-to-book ratio, age, number of employees, and managerial ownership, serve as matching covariates, with nearest-neighbor matching applied. Figure 5 displays the kernel density distributions of propensity scores before and after matching. The results show a substantial reduction in the differences in probability density between the treatment and control groups, indicating that pre-existing differences have been largely eliminated, thus minimizing sample selection bias.
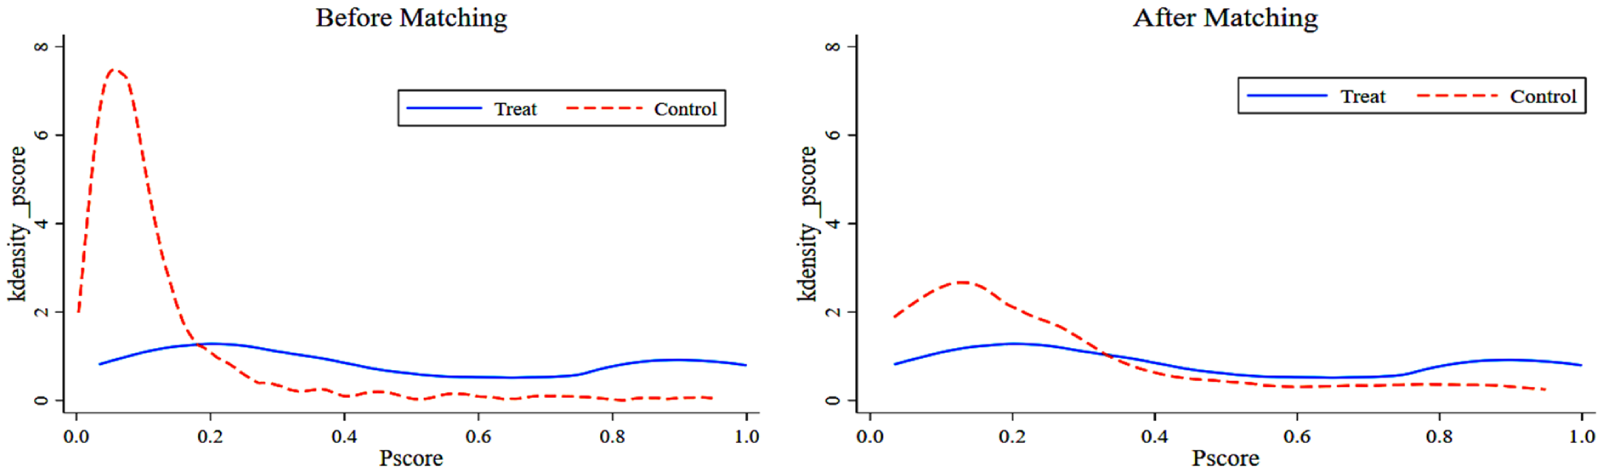
Kernel density distribution of propensity score matching values.
Baseline Results
Based on the results in Table 6, Column (1) shows the results of linear regression, and the coefficient for treat × d is −0.1321, which is significant at the 1% level. This indicates that the impact of COVID-19 is negatively correlated with the efficiency of tourism enterprises. When control variables are added, and sample and time fixed effects are introduced, the coefficient of the interaction term is −0.0993. Further, using the high-dimensional fixed effects estimation in Column (3), the R-squared improves to .760, and the coefficient of the interaction term remains significantly negative at the 1% level, with a value of −0.0745. Considering that OE is a bounded and truncated variable, the Tobit model is used for truncated regression estimation as shown in column (4), treat × d is still significantly negative. The above results indicate that the COVID-19 significantly reduced the efficiency of Chinese tourism enterprises.
Baseline Regression Results.
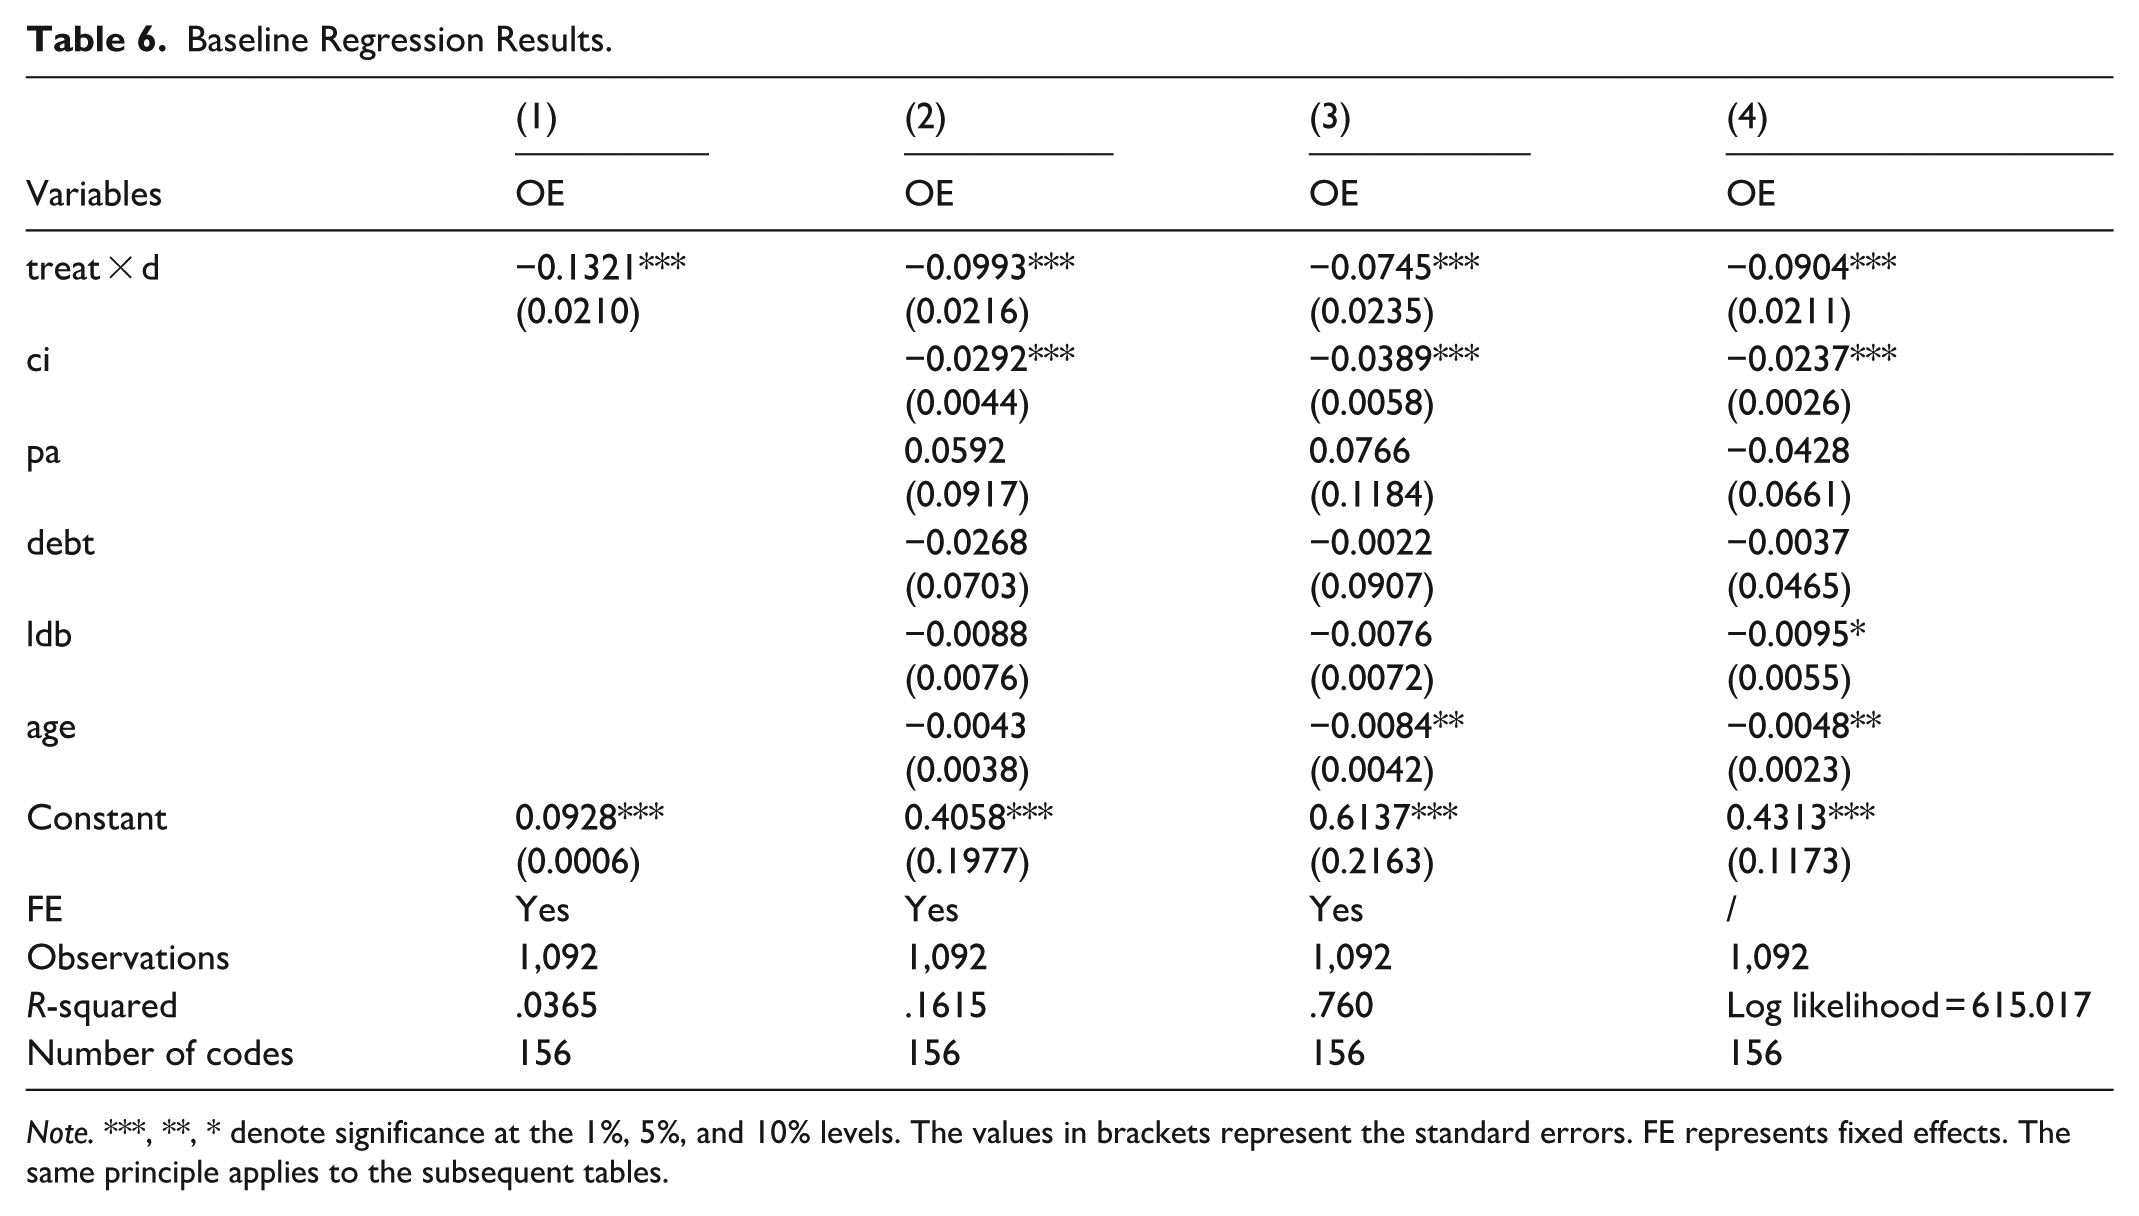
Note.***, **, * denote significance at the 1%, 5%, and 10% levels. The values in brackets represent the standard errors. FE represents fixed effects. The same principle applies to the subsequent tables.
Parallel Trend Test
The DID model requires that the experimental and control groups satisfy the parallel trend assumption. Otherwise, the estimated results may be confounded. Figure 6 illustrates the dynamic changes of the effect and the confidence intervals. Before COVID-19, the coefficient of the interaction term was not significantly different from zero, while under the impact, the effect coefficient was significantly different from zero, passing the parallel trend test and thereby confirming the validity of the model’s estimation results.
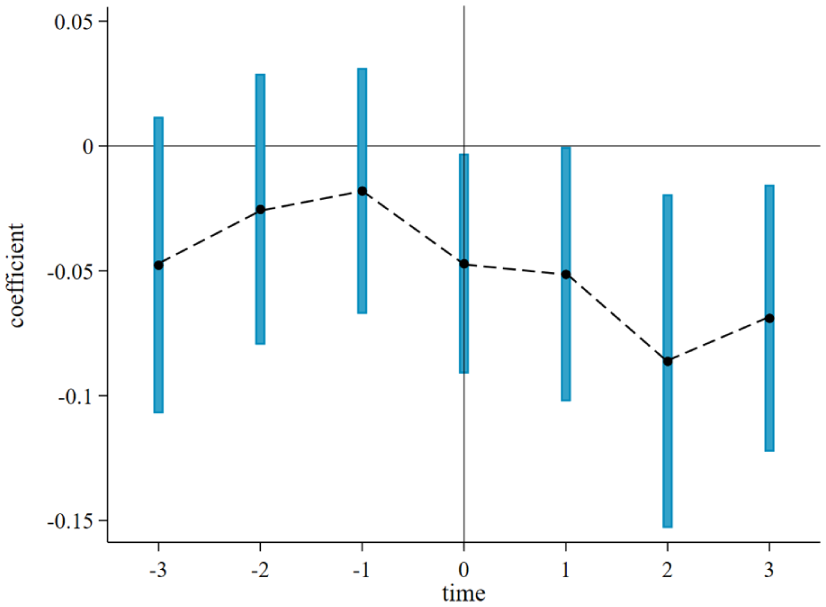
Parallel trend results.
Robustness Checks
To ensure the robustness of our findings, we conducted two additional tests (detailed in Appendix CTable 12 and Figure 9). First, we re-estimated the model using alternative control group matching techniques (including Mahalanobis, local linear regression, and kernel matching). Second, we performed a placebo test by randomizing the treatment status 500 times. Both analyses confirmed the robustness of our estimated effects.
Additional Validation: Heterogeneity of the COVID-19 Impact
We further explore the heterogeneity of the impact, focusing on the region of the enterprise, ownership type, enterprise size, and sub-industry. The results in Table 7 show that the impact on private enterprises is greater than on state-owned enterprises, and the effect on small-size enterprises is greater than on large-size enterprises, which is highly consistent with the conclusions from the statistical analysis.
Heterogeneity of COVID-19 Impact on Tourism Enterprise.
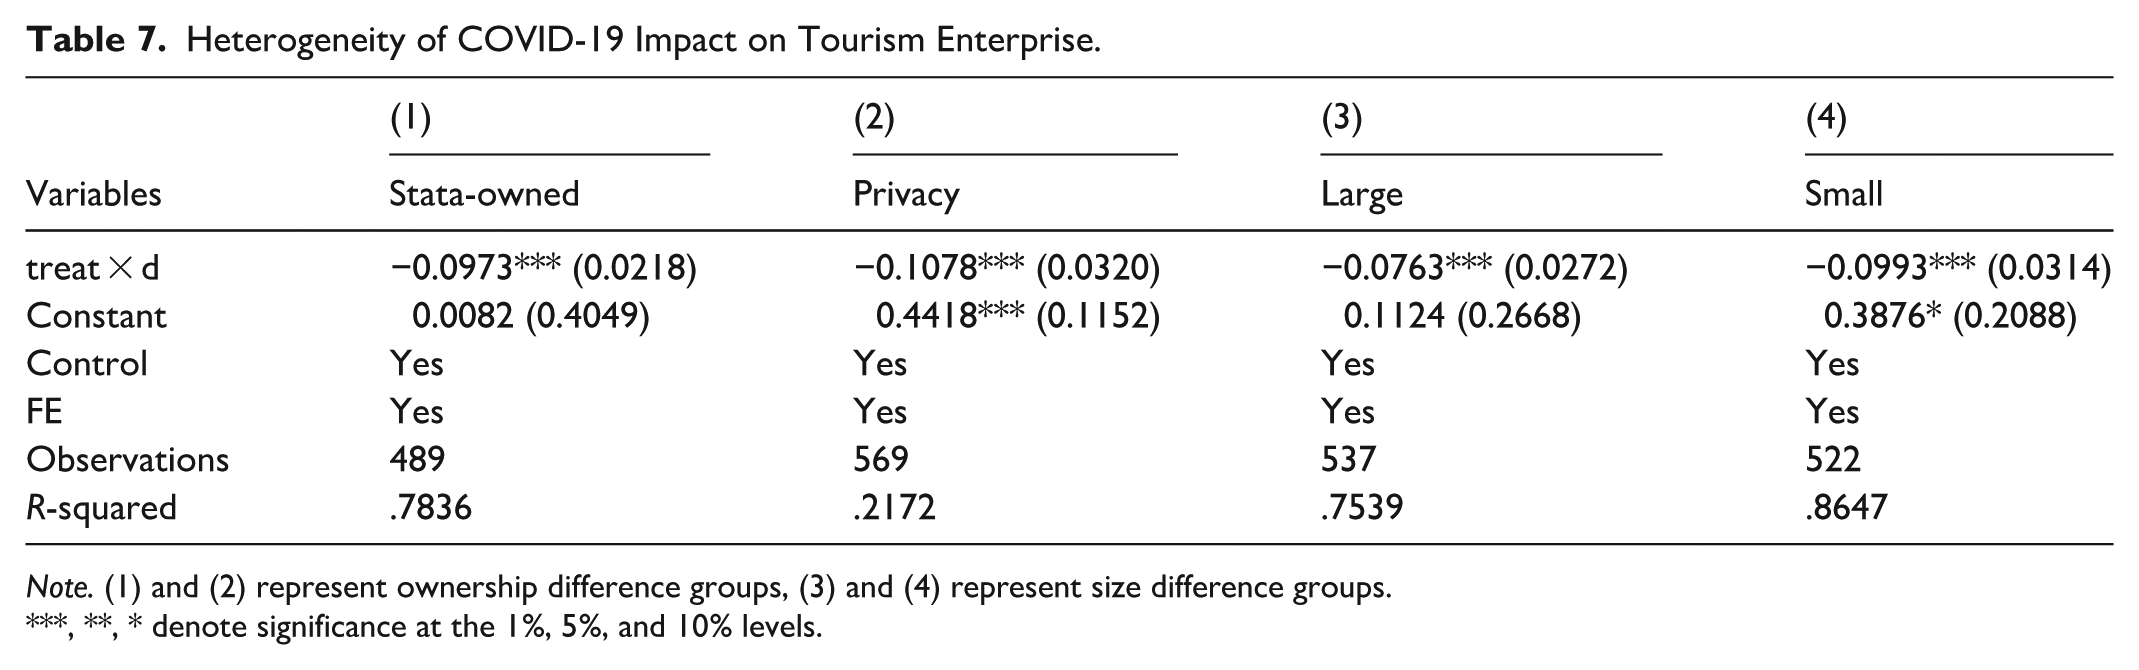
Note. (1) and (2) represent ownership difference groups, (3) and (4) represent size difference groups.
, **, * denote significance at the 1%, 5%, and 10% levels.
The results in Table 8 indicate that the impact coefficients of the COVID-19 pandemic are most significant for the transportation, travel agency, and catering sub-industries, with values of −0.1476, −0.1398, and −0.1316, all of which pass the 1% significance level test. The impact on the e-commerce platform is the smallest, with the coefficient being insignificant. These differences in impact coefficients not only highlight the role of digital transformation in the resilience of the tourism industry, but also provide a clear signal to the government to prioritize support for the three sub-industries most affected.
COVID-19 Impact on Tourism Sub-Industries.
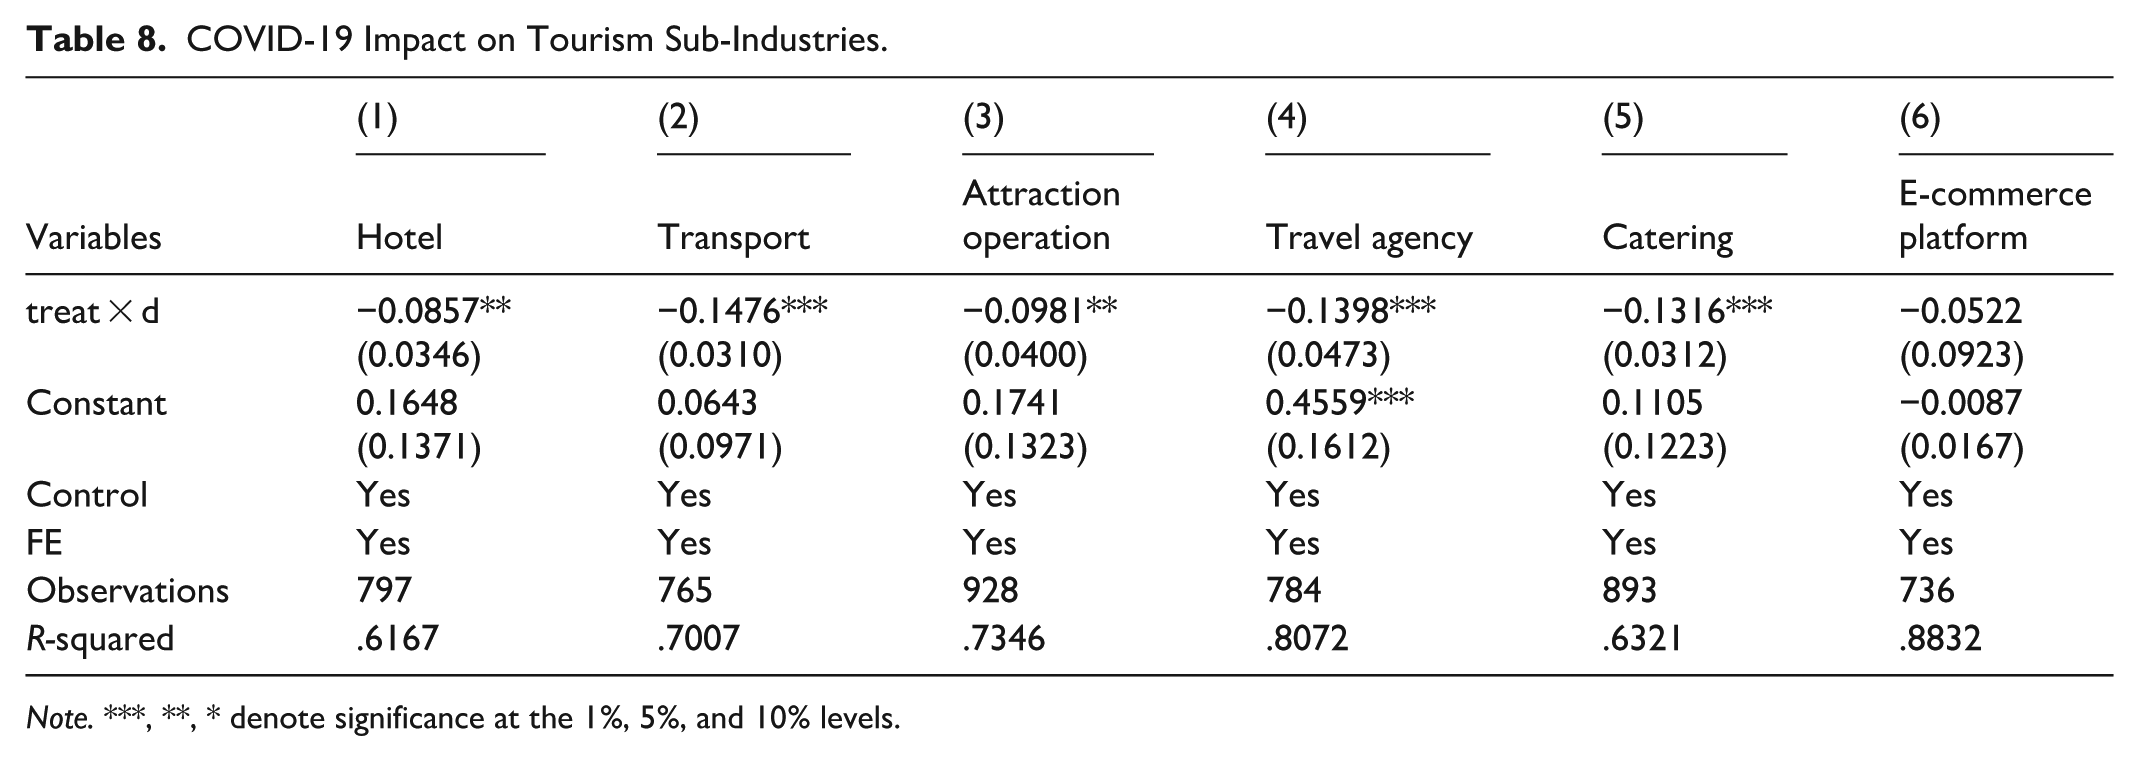
Note.***, **, * denote significance at the 1%, 5%, and 10% levels.
Counterfactual Estimation
We estimate revenue under the counterfactual situation of no COVID-19 pandemic impact and optimal scale adjustments by tourism enterprises, as shown in Table 9. Based on the results of counterfactual situation 1, before COVID-19, the average overall efficiency of tourism enterprises was 0.2939, with an average main business revenue of CNY 5.0135 billion. After the impact of COVID-19, the average revenue was CNY 4.7430 billion, while the estimated revenue under the counterfactual situation is CNY 5.4171 billion, resulting in an actual revenue loss due to COVID-19 of CNY 674.05 million. Under counterfactual situation 2, all enterprises adjusted to achieve optimal returns to scale, meaning that scale was effective, and the overall efficiency value increased to 0.3607, compensating for CNY 466.25 million in main business revenue. It is evident that tourism enterprises can optimize their scale adjustment decisions and mitigate 69.17% of the losses caused by COVID-19. The portion of losses recovered through scale adjustments is attributed to the direct effects of COVID-19 on tourism enterprises, while the unrecovered portion may be due to spillover effects from impacts on other industries.
Counterfactual Estimation Results.
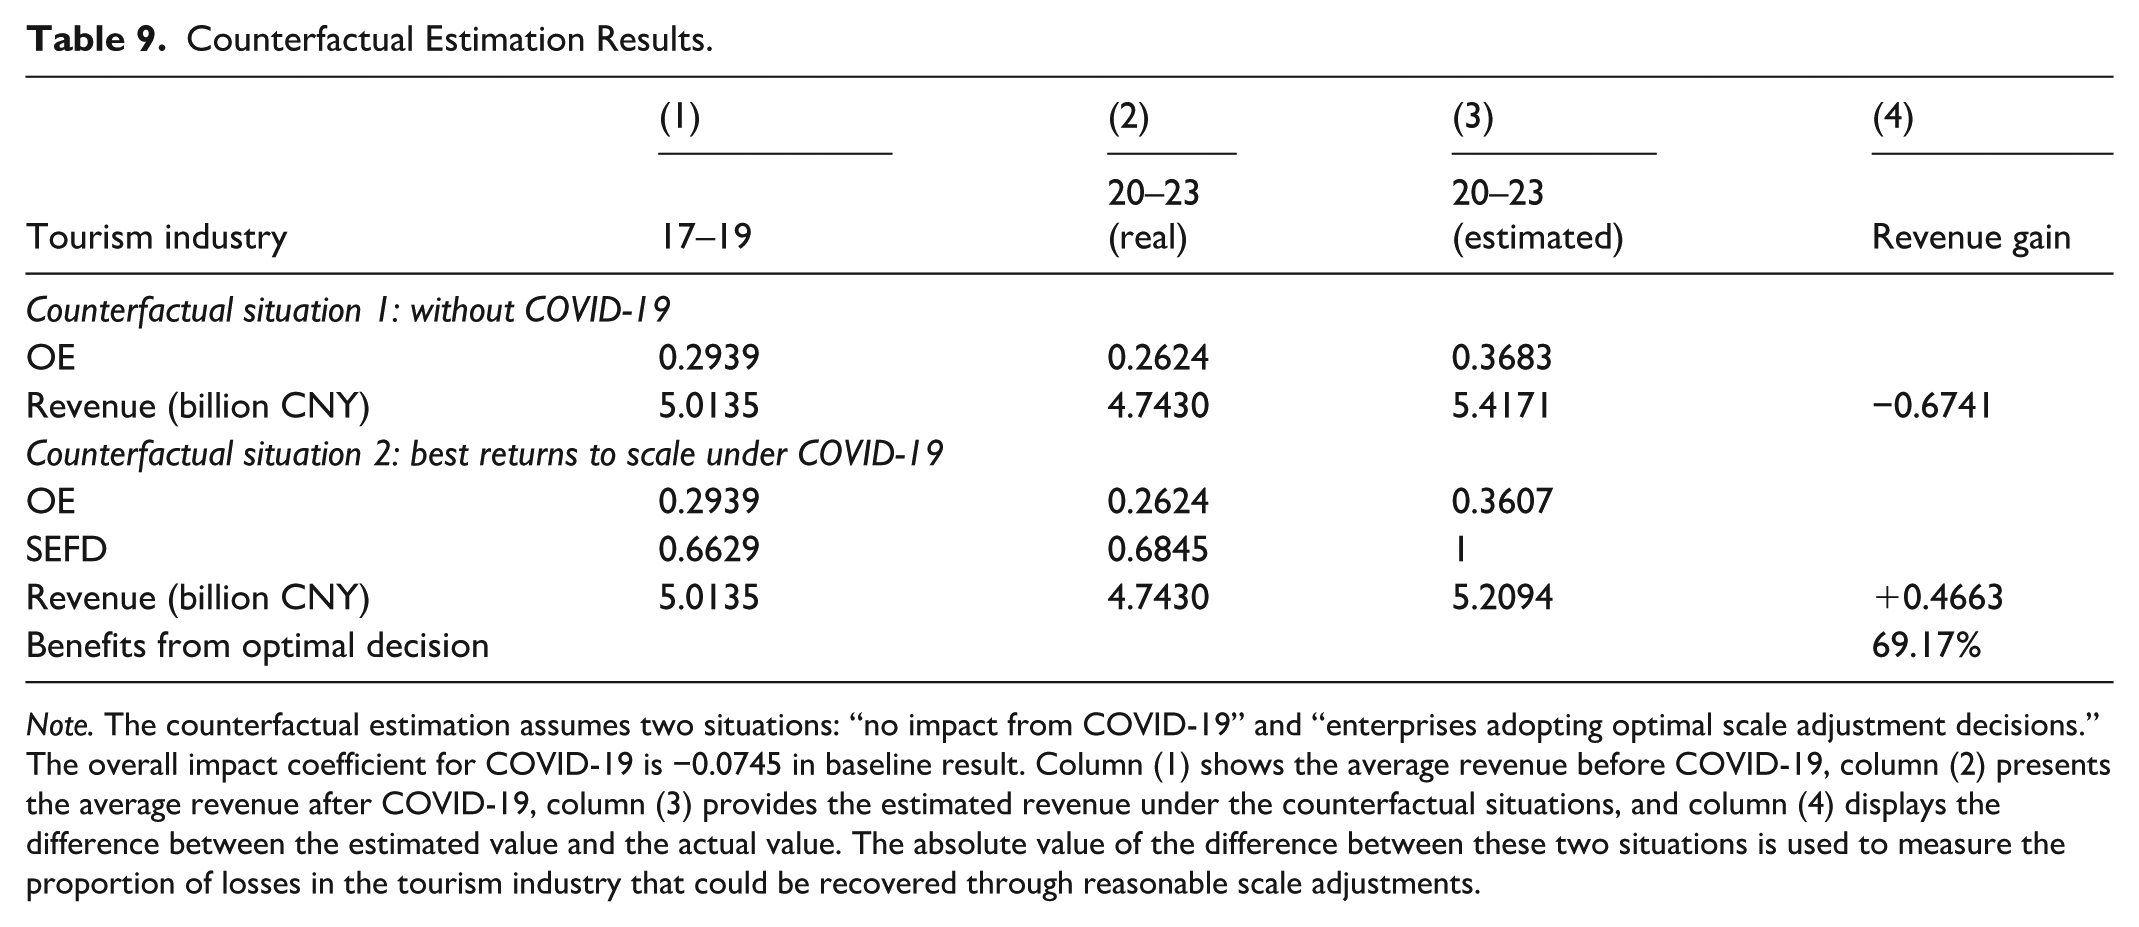
Note. The counterfactual estimation assumes two situations: “no impact from COVID-19” and “enterprises adopting optimal scale adjustment decisions.” The overall impact coefficient for COVID-19 is −0.0745 in baseline result. Column (1) shows the average revenue before COVID-19, column (2) presents the average revenue after COVID-19, column (3) provides the estimated revenue under the counterfactual situations, and column (4) displays the difference between the estimated value and the actual value. The absolute value of the difference between these two situations is used to measure the proportion of losses in the tourism industry that could be recovered through reasonable scale adjustments.
Additionally, we conducted counterfactual estimations considering the size differences of tourism enterprises and the variations across sub-industries. The results in Table 10 indicate that large-size enterprises can, recover up to 96.22% of the revenue losses caused by the COVID-19 pandemic as they achieve appropriate scale adjustments. In contrast, small-size enterprises can only recover 49.76% of their revenue losses through scale adjustments. The reason is that large-size enterprises have higher capital reserves, and the marginal cost of adjusting scale is lower, enabling them to recover more losses. This highlights the insufficient resilience of small-size enterprises and suggests that the recovery of the tourism industry should be led by large-size enterprises, prioritizing the integration of their resources to promote scale optimization. From the perspective of sub-industries, optimal scale adjustments allow the travel agency to recover 45.15% of its losses, while other sub-industries can only recover approximately 10% to 20% of their losses. Travel agencies possess a comprehensive service chain and serve as a hub connecting other sub-industries. Integrating travel agency operations can revitalize other tourism sub-industries and help recover more losses across the industry. Therefore, government efforts to promote post-pandemic recovery in the tourism industry should prioritize the travel agency.
Counterfactual Estimation for Heterogeneous Samples.
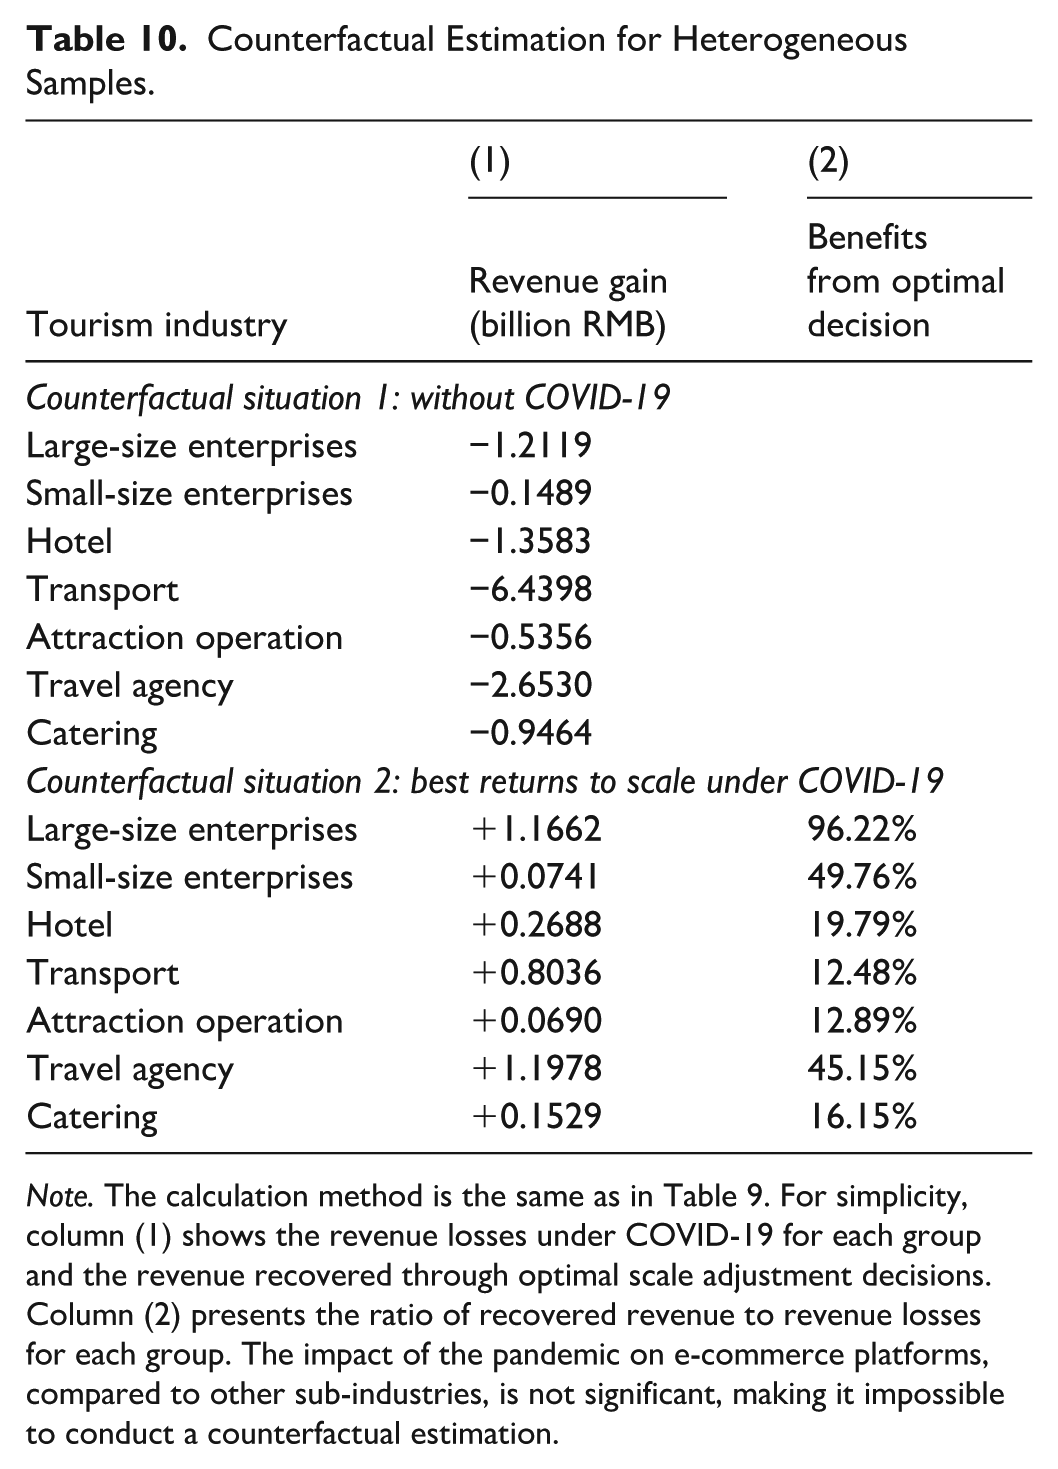
Note. The calculation method is the same as in Table 9. For simplicity, column (1) shows the revenue losses under COVID-19 for each group and the revenue recovered through optimal scale adjustment decisions. Column (2) presents the ratio of recovered revenue to revenue losses for each group. The impact of the pandemic on e-commerce platforms, compared to other sub-industries, is not significant, making it impossible to conduct a counterfactual estimation.
In conclusion, our empirical analysis reveals the uneven impact of COVID-19 on the efficiency of Chinese tourism enterprises. The pandemic had a notably stronger negative effect on private enterprises and small-size enterprises. Transportation, travel agency, and catering sub-industry were also significantly impacted. Under the counterfactual estimation, large-size enterprises and the travel agency were able to mitigate losses to a greater extent through scale adjustment decisions.
Discussion
To precisely quantify the true efficiency of tourism enterprises, this study employs non-convex production functions and based on an assessment of the impact of the COVID-19 pandemic on their efficiency, quantifies the actual losses that can be mitigated through scale adjustment decisions in the tourism industry.
In comparison with existing research, this study theoretically indicates that under COVID-19, traditional methods have overestimated the scale efficiency of tourism enterprises. It emphasizes the importance of constructing a non-convex production model for the tourism industry and reveals that most Chinese tourism enterprises, particularly state-owned ones, still need to optimize their internal management and decision-making processes. This stands in stark contrast to previous literature, which considered the Chinese tourism industry to be technically efficient (S. K. Li et al., 2021; D. Zhang et al., 2020). This difference is partly due to the different focuses of the research questions, as well as the varying degrees of external shocks during the study period.
On the other hand, the difference also arises from variations in research scale, subjects, and data. Based on the input-output data from individual enterprises’ annual reports, we more accurately account for changes in each enterprise’s production efficiency, uncovering specific phenomena that are often overlooked in macro-level average analysis, such as the significant disparities in technical efficiency among tourism enterprises. This also explains why the average efficiency in the tourism industry has been difficult to rapidly improve and has remained low over the long term (Chaabouni, 2019; J. Liu et al., 2018).
Furthermore, in terms of research methodology, the traditional assumption of a convex production frontier not only fails to capture certain characteristics of the tourism industry but also struggles to accommodate the context of the COVID-19 shock, leading to divergent policy recommendations (Alberca & Santos, 2021; Yu & Chen, 2020). Additionally, we use a quasi-natural experiment with optimizing the previous methods of dividing experimental and control groups within the tourism industry, providing evidence for the negative impact of COVID-19 on the tourism industry. Our study finds that COVID-19 severely affects private and small-scale tourism enterprises, with some even exiting the market. This further decomposes the heterogeneous effects observed in previous studies, which categorized core and non-core tourism enterprises based on the severity of the virus in their locations (Jin et al., 2023; Y. Li et al., 2024). This indicates that the impact of COVID-19 on tourism enterprises is not solely determined by local virus infection rates, but is also closely related to the characteristics of the enterprises themselves (Kaczmarek et al., 2021). Finally, we find that, similar to related studies, travel agency performs poorly under the impact (Z. Wang & Le, 2022). However, we further reveal that adjusting the scale of travel agency can recover significant losses, which is due to the strong interconnection between travel agency and other sub-industries of the tourism industry.
Conclusion
This paper provides several results that are of interest. First, the Chinese tourism industry, as measured by the new method, demonstrates characteristics of scale efficiency but technical inefficiency. During COVID-19, the temporal evolution of overall efficiency in tourism enterprises, displayed an “N-shaped” pattern with initial growth, a sharp decline, and a gradual recovery. Responses varied across sub-industries. The efficiency of e-commerce platform experienced the least volatility, while travel agency saw a significant decline in scale efficiency, and attraction operation decrease in technical efficiency. Additionally, we revealed technical inefficiency issues among state-owned enterprises.
Second, the number of enterprises in DRS increased dramatically in 2020. Attractions operations and e-commerce platform showed minimal changes in scale adjustment decisions. Moreover, over one-third of enterprises needed to expand scale in 2021, which contradicted the prevailing notion that downsizing during crises could enhance efficiency. The competitive landscape of China’s tourism market shifted from a “multi-headed competition” pattern to a “winner-takes-all” pattern dominated by state-owned and large enterprises, providing signals and direction for government regulation.
Third, using a quasi-natural experiment, we found that COVID-19 had a stronger negative impact on tourism enterprises, particularly affecting smaller, private enterprises. Through scale adjustment decisions, the tourism industry can reduce losses by up to 69.17%. The travel agency could mitigate 45.15% of the losses, while other sub-industries could only mitigate approximately 10% to 20% of the losses. Large-size enterprises have a higher degree of loss mitigation compared to small-size enterprises. These non-linear empirical insights provide the tourism enterprises with crisis response guidelines tailored to its characteristics.
Practically, this study proposes an efficiency monitoring tool tailored for the tourism industry, utilizing publicly disclosed panel data from enterprises. This tool is designed to effectively diagnose the weak points in crisis management within the tourism industry, identify the types of enterprises that are in urgent need of recovery through actual losses, and provide a reference for government to formulate intervention measures.
Theoretically, this study contributes to tourism efficiency research by introducing a non-convex production framework, challenging the traditional convexity assumption in efficiency measurement. By addressing the limitations of convex models, this framework provides a more accurate representation of efficiency, especially in crisis contexts. It also extends crisis management theory by applying economies of scale theory to crisis response strategies. This study shows that both scale contraction and expansion can be effective, depending on the crisis context. By leveraging scale economies, enterprises can adjust their operational scale dynamically, optimizing efficiency and improving crisis recovery.
The limitations of our study are related to the research methods and subjects used. Efficiency evaluation models under the convexity assumption have gradually expanded from single-output to multi-output frameworks. However, further research is warranted to explore multi-output models that consider the RVRS assumption and non-convexity. Additionally, this study provides scientific empirical evidence on the impact of COVID-19 on the tourism enterprise efficiency, but the enterprise data in our study is limited to A-share listed enterprises in China due to data availability, which prevents us from considering the responses of unlisted tourism enterprises, individual operators, homestays, and other tourism stakeholders under COVID-19 or other sudden shocks. This also represents an area for further exploration.
Footnotes
Appendix A
Table 11 presents the efficiency results under different production frontiers for the year of the COVID-19. RankA and RankB report the rankings of TEFD and TECV, respectively, and the differences between the two rankings are generally within four positions. RankC and RankD represent the rankings of SEFD and SECV. There were significant changes in scale efficiency rankings, with 11 enterprises experiencing ranking shifts of more than 10 positions, and the largest difference reaching 23 positions. Notably, the scale efficiency in the attraction operation sub-industries, such as Zhangjiajie, Yunnan Tourism, and Guilin Tourism was significantly overestimated, with ranking deviations exceeding 16 positions. These enterprises have relatively broad business scopes and complex networks of cross-industry collaborations, which increase their risk of downsizing in response to external shocks. Traditional efficiency analysis methods, which rely on the assumption of a convex frontier, fail to fully capture the operational processes of tourism industry, highlighting the reasonableness and effectiveness of the improved method using a non-convex setting. In contrast, the efficiency of catering sub-industries, such as Guangzhou Restaurant (code603043) and Jinling Hotel (code601007), were underestimated. We also found that under the improved method, the efficiency of China United Travel (code600358) was technically effective but scale-inefficient, whereas the traditional measurement method produced the opposite result, which could mislead decision-making. Thus, it is essential to re-evaluate the efficiency of tourism enterprises during COVID-19 using enhanced methodologies.
Appendix B
According to the median split principle, the sample enterprises were divided into large-size and small-size enterprises based on their actual total asset size. Kernel density plots were generated, as shown in Figures 7 and 8. In terms of technical efficiency, the peak of the kernel density curve for small-size enterprises is generally concentrated around 0.2. The height of the main peak decreases initially and then increases over the years, with the curve widening first and then narrowing. This indicates that the gap in technical efficiency among small-size tourism enterprises widened during COVID-19 period but gradually narrowed after the pandemic ended. The pronounced tail on the right side of the curve indicates that after the end of COVID-19, the technical efficiency of some small-size enterprises improved. The kernel density curve for large-size enterprises exhibits a multi-modal pattern. Before COVID-19, most enterprises were on the production frontier, but under the impact of COVID-19, the number of enterprises on the production frontier significantly decreased, while the number of enterprises in the lower value range increased notably.
In terms of scale efficiency, low scale efficiency was mostly associated with small-size enterprises before COVID-19. The kernel density curve for small-size enterprises had a narrow spread, indicating small internal differences. During the COVID-19, a bimodal trend emerged, with the scale efficiency of some small-size enterprises declining significantly, indicating they were more severely affected. However, after the pandemic, the kernel density curve for small-size enterprises quickly returned to a single-peak state, with a notably higher peak. For large-size enterprises, throughout the pandemic, scale efficiency exhibited an initial decrease followed by an increase, with relatively minor fluctuations. This indicates that large-size enterprises had stronger crisis management capabilities and higher resilience, while small-size enterprises experienced greater volatility.
Appendix C
Author Contributions
Funding
The authors disclosed receipt of the following financial support for the research, authorship, and/or publication of this article: This research has been partially supported by the National Natural Science Foundation of China (under Grant No. 72001061; 72272040). Views expressed in this article are solely those of the authors and should not be attributed to the funding body.
Declaration of Conflicting Interests
The authors declared no potential conflicts of interest with respect to the research, authorship, and/or publication of this article.