
Abstract
A significant feature of the third world urbanisations, including India, is that most of the population is concentrated in few big cities and metropolitan areas. The article attempts to categorise the four top Indian metro cities in terms of their stage of growth, assess the components of population growth and summarise the migration dynamics in terms of the migrants’ choice of destination. The cores of the metropolitan areas have more population concentration than the peripheral zones. In all the four metropolitan cities, population growth rate is decelerating and, in some cases, it is even found to be negative. City cores are experiencing huge flow of out-migration and are growing mainly because of the natural increase. A significant feature characterising all the four top metros is that majority of the migratory movement (both in-migration and out-migration) has taken place in short distances mostly to and from the adjoining districts of the urban agglomeration (UA). It has emerged that the four cities in recent years have witnessed a higher volume and rate of population growth towards the periphery. Delhi and Mumbai have been more preferred destination of migration than Kolkata and Chennai and their vibrancy is reflected in the higher degree of alluring and fusing capacity to the in-migrating population.
Keywords
Introduction
The twentieth century in the human civilisation has seen a huge growth in urban population and a rapid increase in the level of urbanisation all over the world. This high rate of urban growth was mainly fuelled by a strong stream of rural to urban migration. It is worth noting that in the second half of the twentieth century, the trend of urban growth reversed with most of the urban population coming from developing countries instead of developed countries. By the end of the 1990s, out of the total yearly increase in urban population, developing countries accounted for 45 million urban migrants while developed countries accounted for only 7 million (Potter & Lloyd-Evans, 1998).
At present, vast numbers of migrants from the countryside are settling in cities and there is a continual process of densification and concentration of population in the urban space. This is higher in the cities’ inner areas. Throughout the history of urbanisation it has been observed that, irrespective of developed and developing countries, the core of the city/town experiences a higher degree of concentration than other parts, and the core expands in size over time. Simultaneously, city became progressively larger in size. There has been a trend, particularly in developing countries, of greater concentration of population in the large cities and metropolitan areas than in smaller size classes of cities/towns. This trend is evident in India as well.
The scenario in the new millennium is somewhat different from the last century and centuries prior to that. The importance of cities in the regional, national and global sphere continues to change along with corresponding socio-economic, cultural and political change. Technological innovations play a big role in these changes. Core cities today, however, are facing acute problems of congestion, environmental pollution, insanitary and insufficient housing conditions, unemployment and financial crises. In absolute terms, the city cores are still important but there is a process of decline and city cores are losing attraction (Fainstein & Campbell, 2002). Many large cities and metropolitan areas of the developed world are experiencing a decline in population size in the central city areas by stronger flows of out-migration. There is a time lag between developed and developing countries in the occurrence of the event, but this trend is increasingly being witnessed in cities of developing countries, including India.
Asia has occupied a distinct position in the distribution of world urban population, mainly because of India and China. It has been remarked that one of every five persons of the urban population reside in China and the country’s urban population almost matches with the combined population of Africa and South America (Clarke, 2003). In the beginning of the new millennium, India recorded a population of 1,029 million of which 286 million were found to reside in urban areas. This urban living population increased further to 377 million in 2011, which is greater than the combined population of the United States of America and the United Kingdom. Also between 2001 and 2011, for the first time in the history of India’s population growth, urban areas contributed greater population (91 million), than its rural counterpart (90 million) (Premi & Das, 2011).
Since the colonial period, India’s four metropolitan cities, that is, Kolkata, Mumbai, Delhi and Chennai, have been prominent in the map of the world cities. In the independent India, their regional and national importance in terms of economy and population are constantly changing. After 1981, there has been an emergence of many million plus cities in India (Primary Census Abstract, 2011). The regional patterns of urbanisation are greatly influenced by these new metropolitan cities. The census of 2011 revealed that of the 377 million people living in India’s urban centres more than 42.6 per cent resides in the 53 million plus cities and urban agglomerations (UAs). Still those top four metropolitan cities play a pivotal role in the national economy and urban population dynamics of the country.
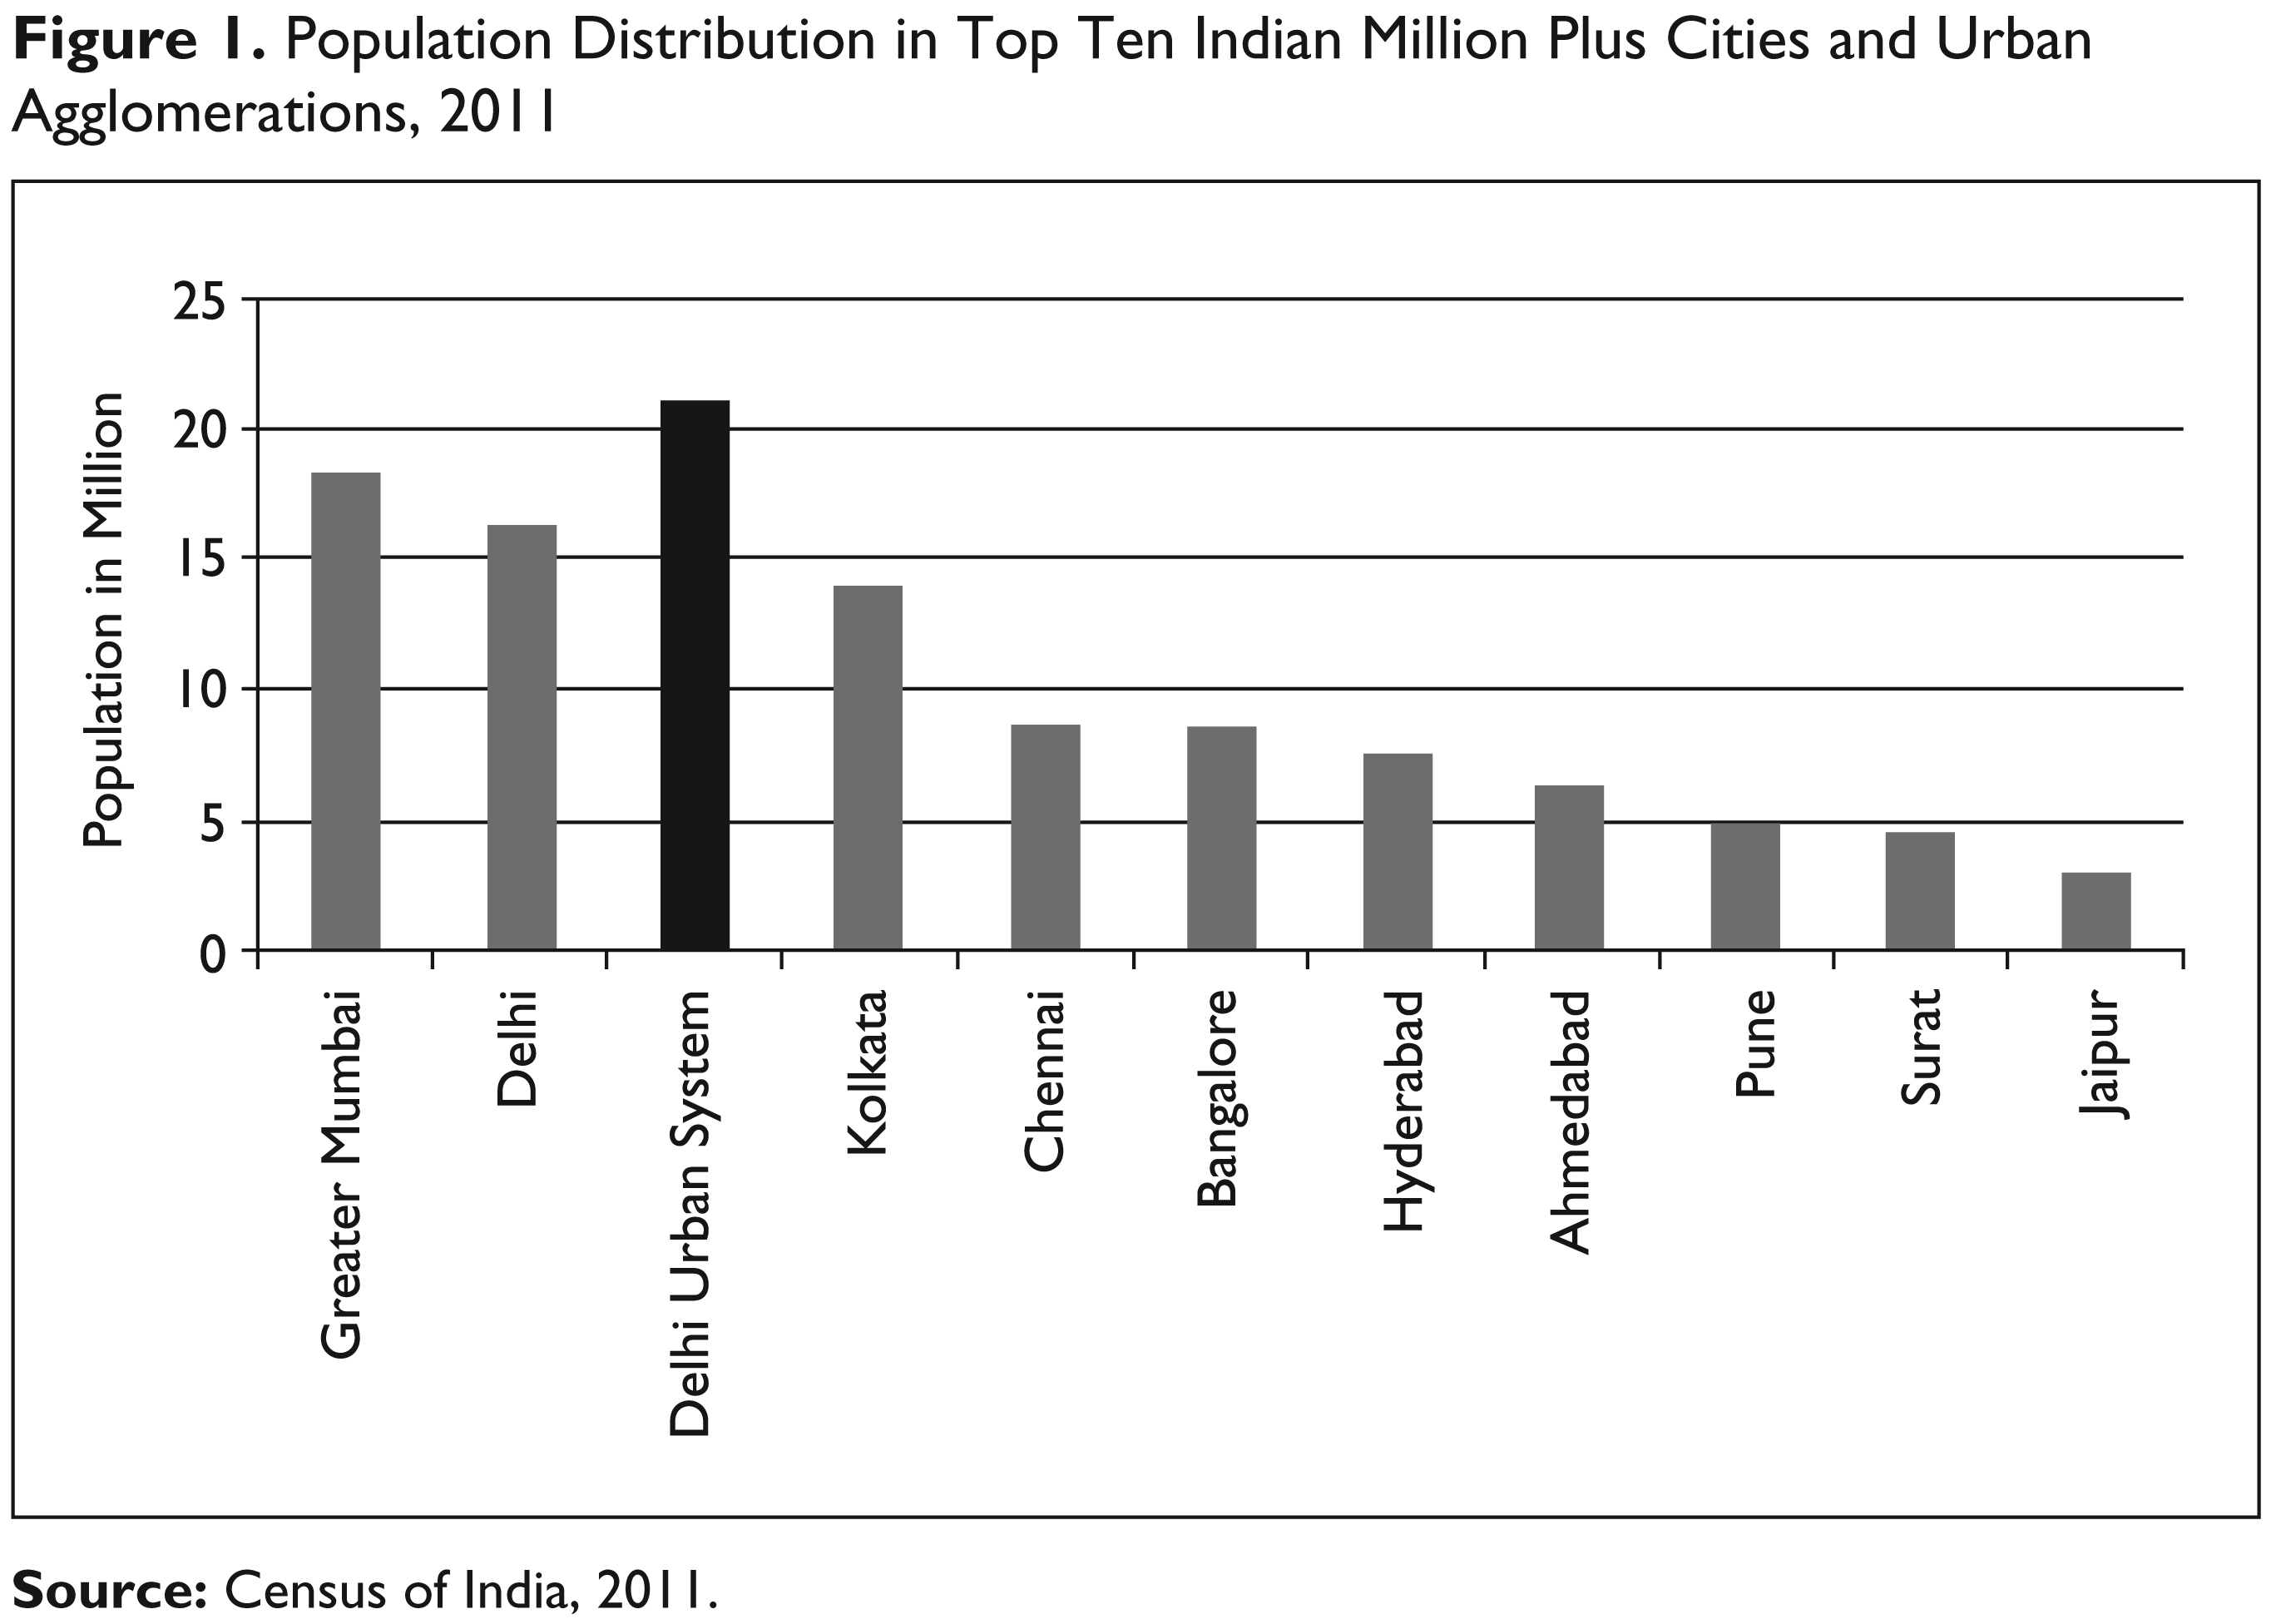
Presently, Mumbai Urban Agglomeration (MUA) ranks first with 18.41 million population followed by Delhi Urban Agglomeration (DUA) with 16.3 million, Kolkata Urban Agglomeration (KUA) with 14.1 million and Chennai Urban Agglomeration (CUA) with 8.7 million. Astonishingly, the combined population of these four metros is equal to the total population of the United Kingdom, which is the pioneer in the history of world urbanisation. There are some rapidly growing UA coming up in India since 1991. In terms of size of population, the gaps between the cities are becoming narrower (Figure 1). The fifth UA Bangalore has 8.5 million population (just 0.2 million lower than Chennai), followed by Hyderabad 7.7 and Ahmadabad 6.4. Important UAs with population less than 5 million are Pune (5.0), Surat (4.6) and Jaipur (3.1).
Theoretically, several models have tried to explain the stages of urban growth. The classic structural change model of Chenery and Syrquin (1979) identified characteristic features of the development process, such as, the shift from agricultural (primary) to industrial (secondary) production, Northam (1979) identified characteristic phases of urbanisation on the basis of logistic patterns in urban growth, whereas Birch (1971) proposed the concept that original sites of investment in urban areas become exhausted and newer sites develop. On the other hand, some models have even tried to phase out urban growth on the basis of GDP per capita, industrial structure (the proportion of the economy devoted to primary, secondary or tertiary industry), employment structure (the proportion of jobs associated with each industrial sector) and level of urbanisation (the proportion of non-farm population in cities) as indicators of the stage of city development (Wang et al., 2011). However, Berg et al. in 1982 conceptualised the urban growth in well-sequenced stages and generated a model of urban growth on the basis of population growth in the urban regions and the shifts in population between the core and the peripheral zones. Population mostly focuses on the core for their economic activities.
Theories of interdependency, mercantilism and that of global urban development have sought to propose a kind of causal between processes of wealth accumulation and the creation of hierarchy of the urban spaces. These have further talked of urban development as consequent upon the stages of economic development from mercantilism through industrial and monopoly capitalism to corporate capitalism. In the later stages of economic development, the urban spaces at the macro level are open to exchange of both human and social capital. However, if the same is thought at a much smaller scale, that is, at a meso level, then such hierarchies are also found to exist within urban regions of a particular nation. In India, for example, the urban population is found to be concentrated in few of the major states and further if such individual states are considered then a primacy is indicated in some of the major cities or UAs in them (for example, Kolkata UA accounts more than 48.4 per cent of the total urban population of West Bengal in 2011). Hence, it becomes quite essential to find out the real dynamism that exists in the major metros of India which ranks second in terms of the global urban population among all the countries.
When population growth is talked of, it is for sure that the major components affecting its change are the birth rates and death rates (natural increase). However, the rates at which the population changes their residence across territorial administrative boundaries (migration) also play a decisive role in the changing socio-economic and demographic composition of the urban population. Losing or gaining urban population has direct manifestation on available amenities, the working population, the urban infrastructure and most important of all the policy perspectives of the urban region in question.
The Study
The present article embarks on the alluring capacity of the four top metros in India. The major objectives that are sought to be taken up are the growth and the dynamics (components) of growth of these four capacious metros of India by considering not only the core of UAs but also peripheral urban areas located as contiguous parts of these cities. How the population growth exerts pressure by changing densities in the core and the periphery of these major metropolitan areas will be studied. Here, an examination will be undertaken on the stages of development of the four selected metros by trying to fit models of urban development. Finally, sincere attempt will be made towards the analysis of the migration dynamics of the core and the peripheral regions capturing the magnitudes of magnetism on migration of the aforesaid metros. This will include an in-depth study of the source and choice of destination of the migrant. The study is mainly based on the Census of India data of different decades. The recent most Census of India in 2011 has provided the final population count in tables of Primary Census Abstract (PCA) for all the districts and UAs. Data on migration are yet not published for 2011. In the present study, pattern of inter-censal inter-district in-migration and out-migration between 1991 and 2001 are examined using the D-13 migration tables (unpublished) of 2001 provided by the Office of the Registrar General of India (ORGI). Undertaking arduous tasks for capturing inter-censal in-migration and out-migration (thereby net migration) at the district level irrespective of intrastate/interstate for the country as a whole huge processing were done on these data. Once the contributions of migration in growth component by districts were confirmed, the calculation of contribution of natural increase was a matter of solving an easy arithmetic sum.
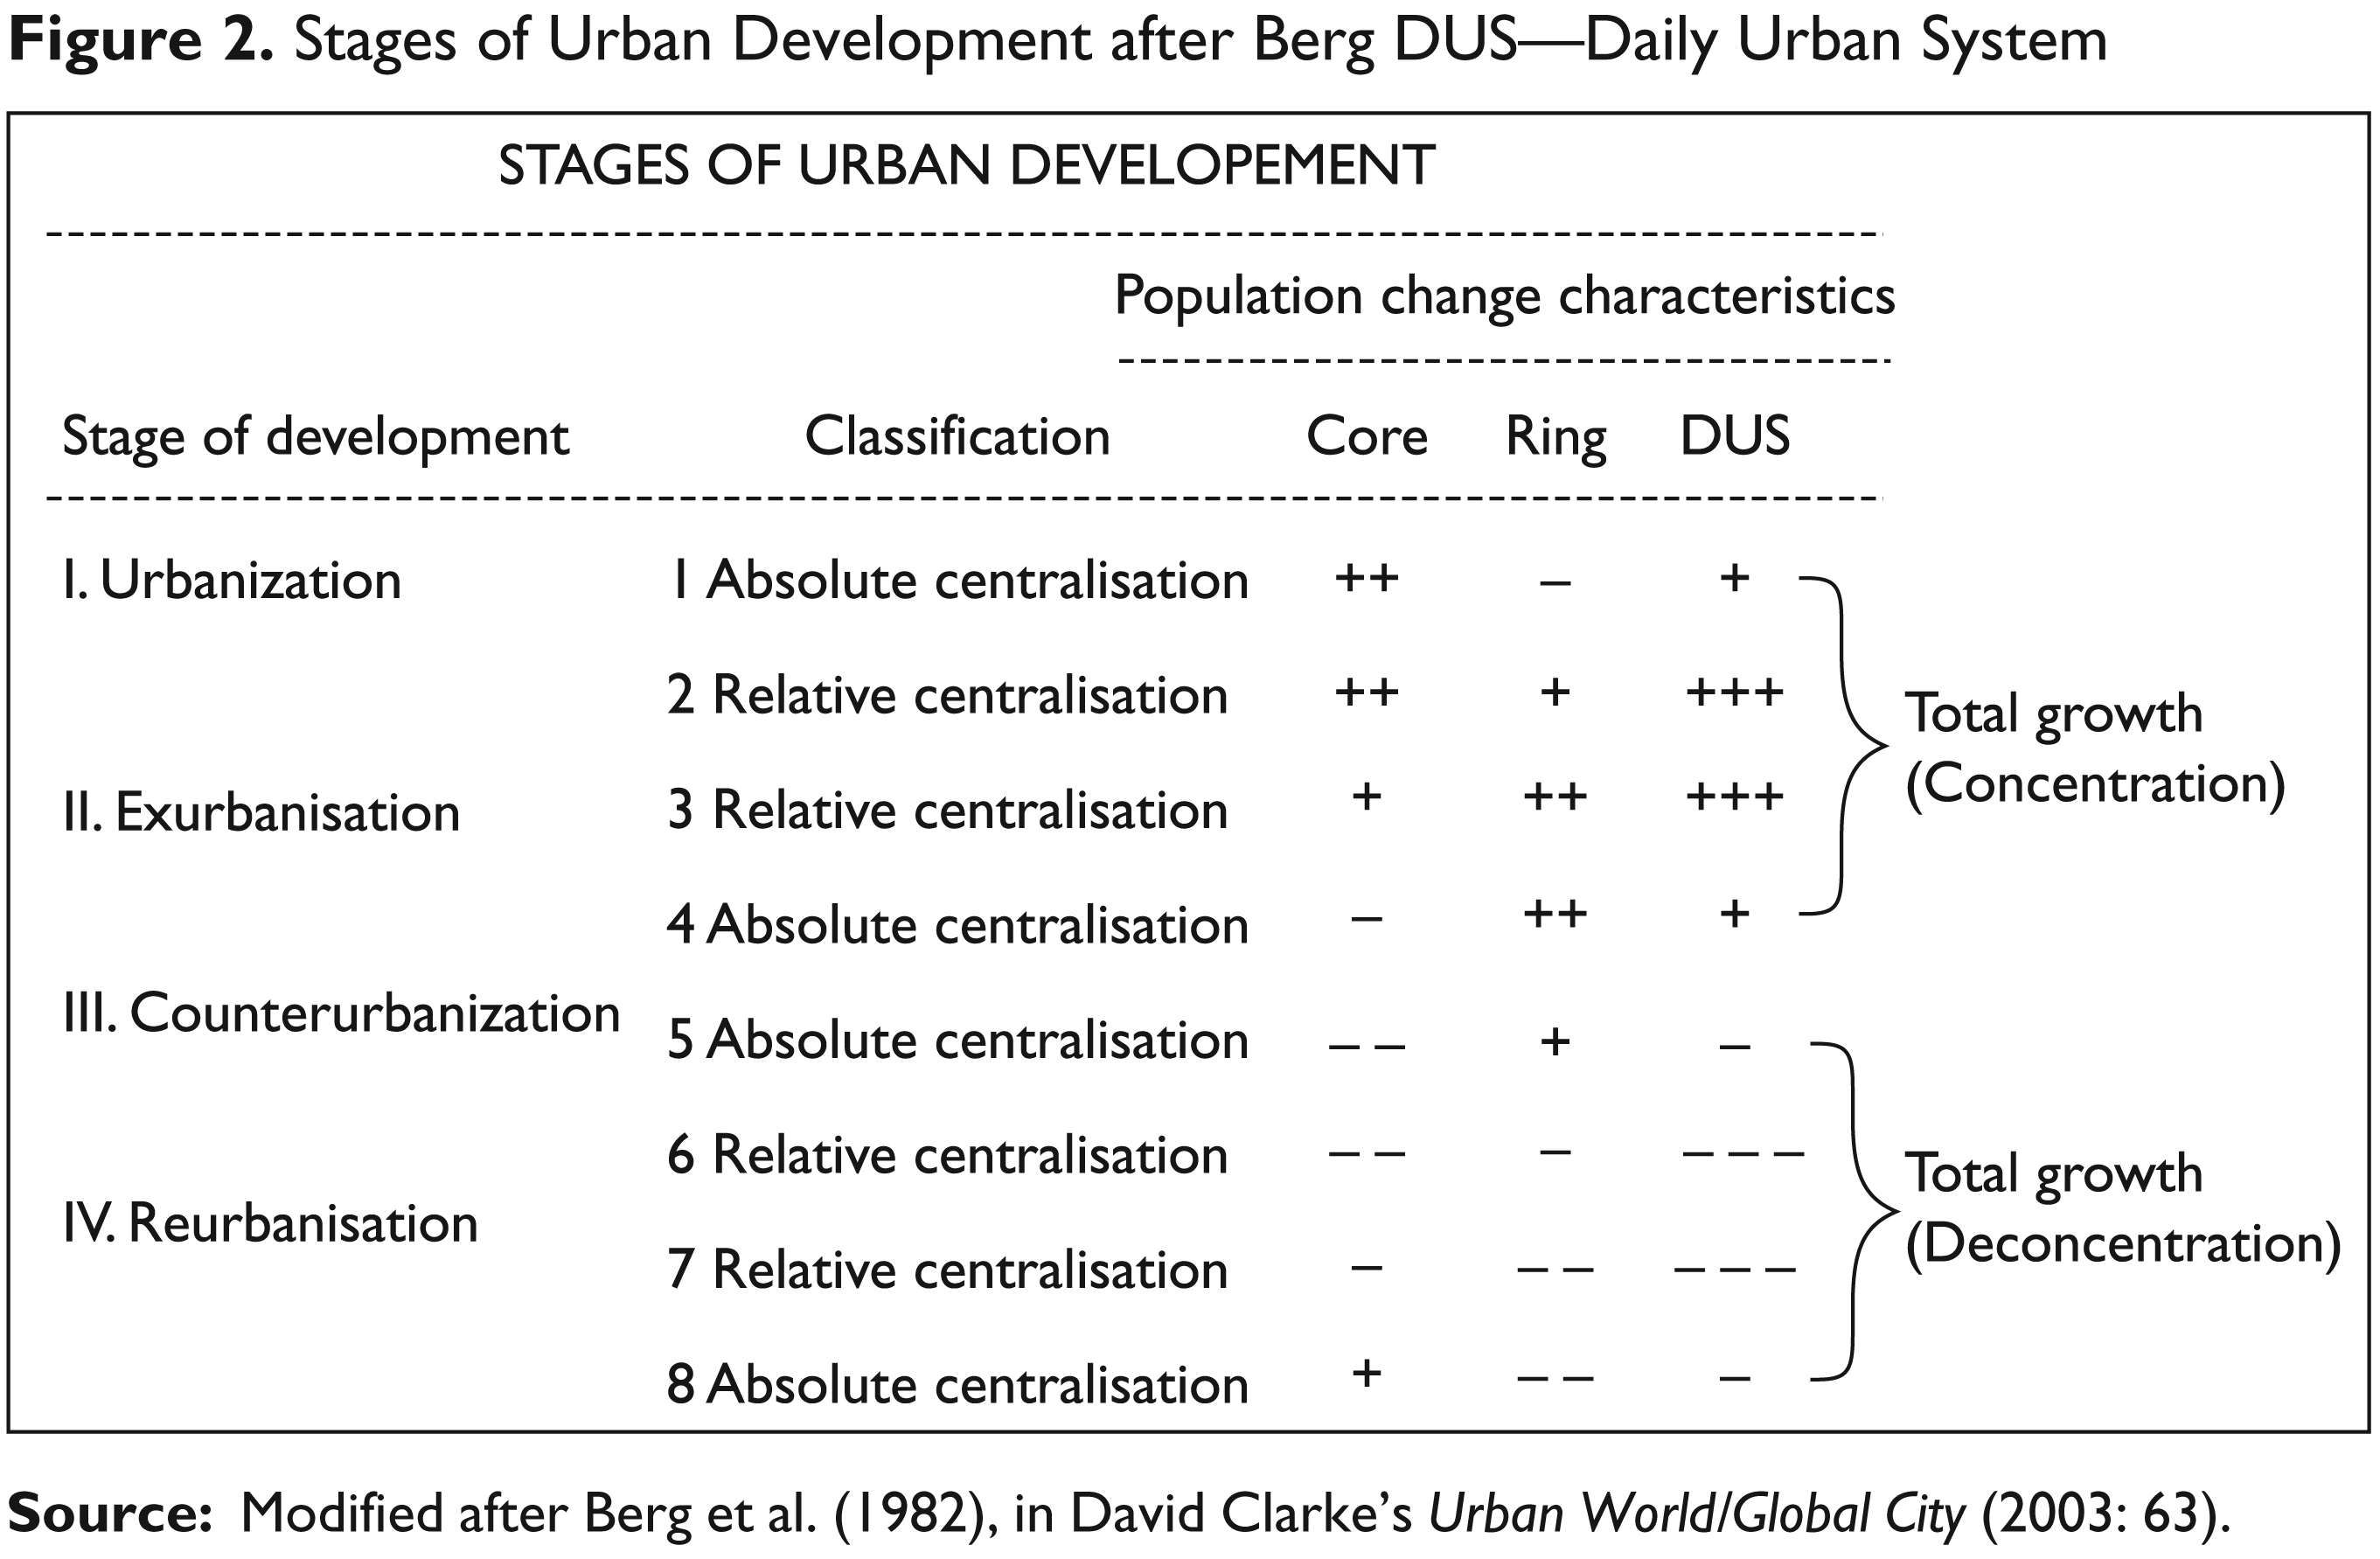
Berg et al. (1982) proposed their model (Figure 2) describing the rate and direction of shifts in population distribution within urban region between core and ring (periphery) and how these two areas function together as daily urban system (DUS). His model, formulated around 30 years ago, was developed keeping in mind the cities of developed nations. Berg’s model had four well-defined stages of urban growth christened as urbanisation, exurbanisation or suburbanization, counter-urbanisation and re-urbanisation. The urbanisation and the re-urbanisation stages were further categorised into stages of relative and absolute shifts/centralisation whereas the suburbanisation and the counter-urbanisation streams were sub-categorised into stages of relative and absolute shifts/decentralisation. The model tries to identify absolute shifts when the direction of population change is different and relative shift when the direction is same but the rate of population change is different between the core and the periphery of the city region. Basically these characteristics of absolute and relative shifts segregate the overall stage of development of the urban centres. A closer look at Berg’s urban growth model justifies that it is applicable to the four metros that have been taken up in the study. The model suggests that the population relations between the city core and the periphery operate in the reverse direction where the core grows at the expense of decline of population in the periphery in absolute centralisation of urbanisation stage. During relative centralisation stage of urbanisation both core and periphery experience increase in population but at different rates. In the second stage of exurbanisation/suburbanisation, core areas have a relatively lower population growth whereas the population in the peripheries increases. In the later stage of suburbanisation, an absolute shift takes place, where the population of core areas declines but the periphery shows a strong increase. The four metros under study fit in the second stage (suburbanisation) of urban development of the model.
The census of India has identified each urban system on a geographical space within a state in terms of their central/core city, and the functionally integrated (economic, administrative, planning, etc.) contiguous spread of urban areas/towns (periphery) around the core. Such urban systems are designated as UAs by the Census of India. In the case of very large metropolitan cities, the core is found to be fully urbanised district(s) and the peripheries are smaller towns spread across different districts comprising both urban and rural segments. The components of the four UAs that have been considered in the present study are done much in line with the Census of India except for Delhi.
The MUA is said to contain towns in the districts of Mumbai, Mumbai Suburban (which together form the core) and Thane; the KUA contains towns in the districts of Kolkata (comprising the core), North and South 24 Parganas, Haora, Hugli and Nadia and the Chennai Agglomeration comprises of towns in the districts of Chennai (comprising the core), Thiruvallur and Kancheepuram. The National Capital Territory (NCT) of Delhi abuts the districts of Ghaziabad, and Gautam Buddha Nagar (NOIDA) in Uttar Pradesh and Faridabad and Gurgaon in Haryana. The cities/towns of these abutting districts are not only within the fold of the continuous spread of NCT Delhi but are also an integral part of the urban landscape of the Delhi Urban System. The functions of business, economy and planning have an operational integration within this urban region. The development of advanced transport networks have helped to join the people together where Delhi is acting as a core and coalescing these peripheral towns in its urban system. Therefore, to understand the full dynamics of Delhi’s development this urban landscape is to be studied as a unit. The Delhi urban system comprising NCT Delhi and the peripheral cities/towns of Gurgaon, Faridabad, NOIDA and Ghaziabad are reported to have the largest population base (21 million) among all UAs in the country followed by Mumbai (18.4 million).
Discussion of Results
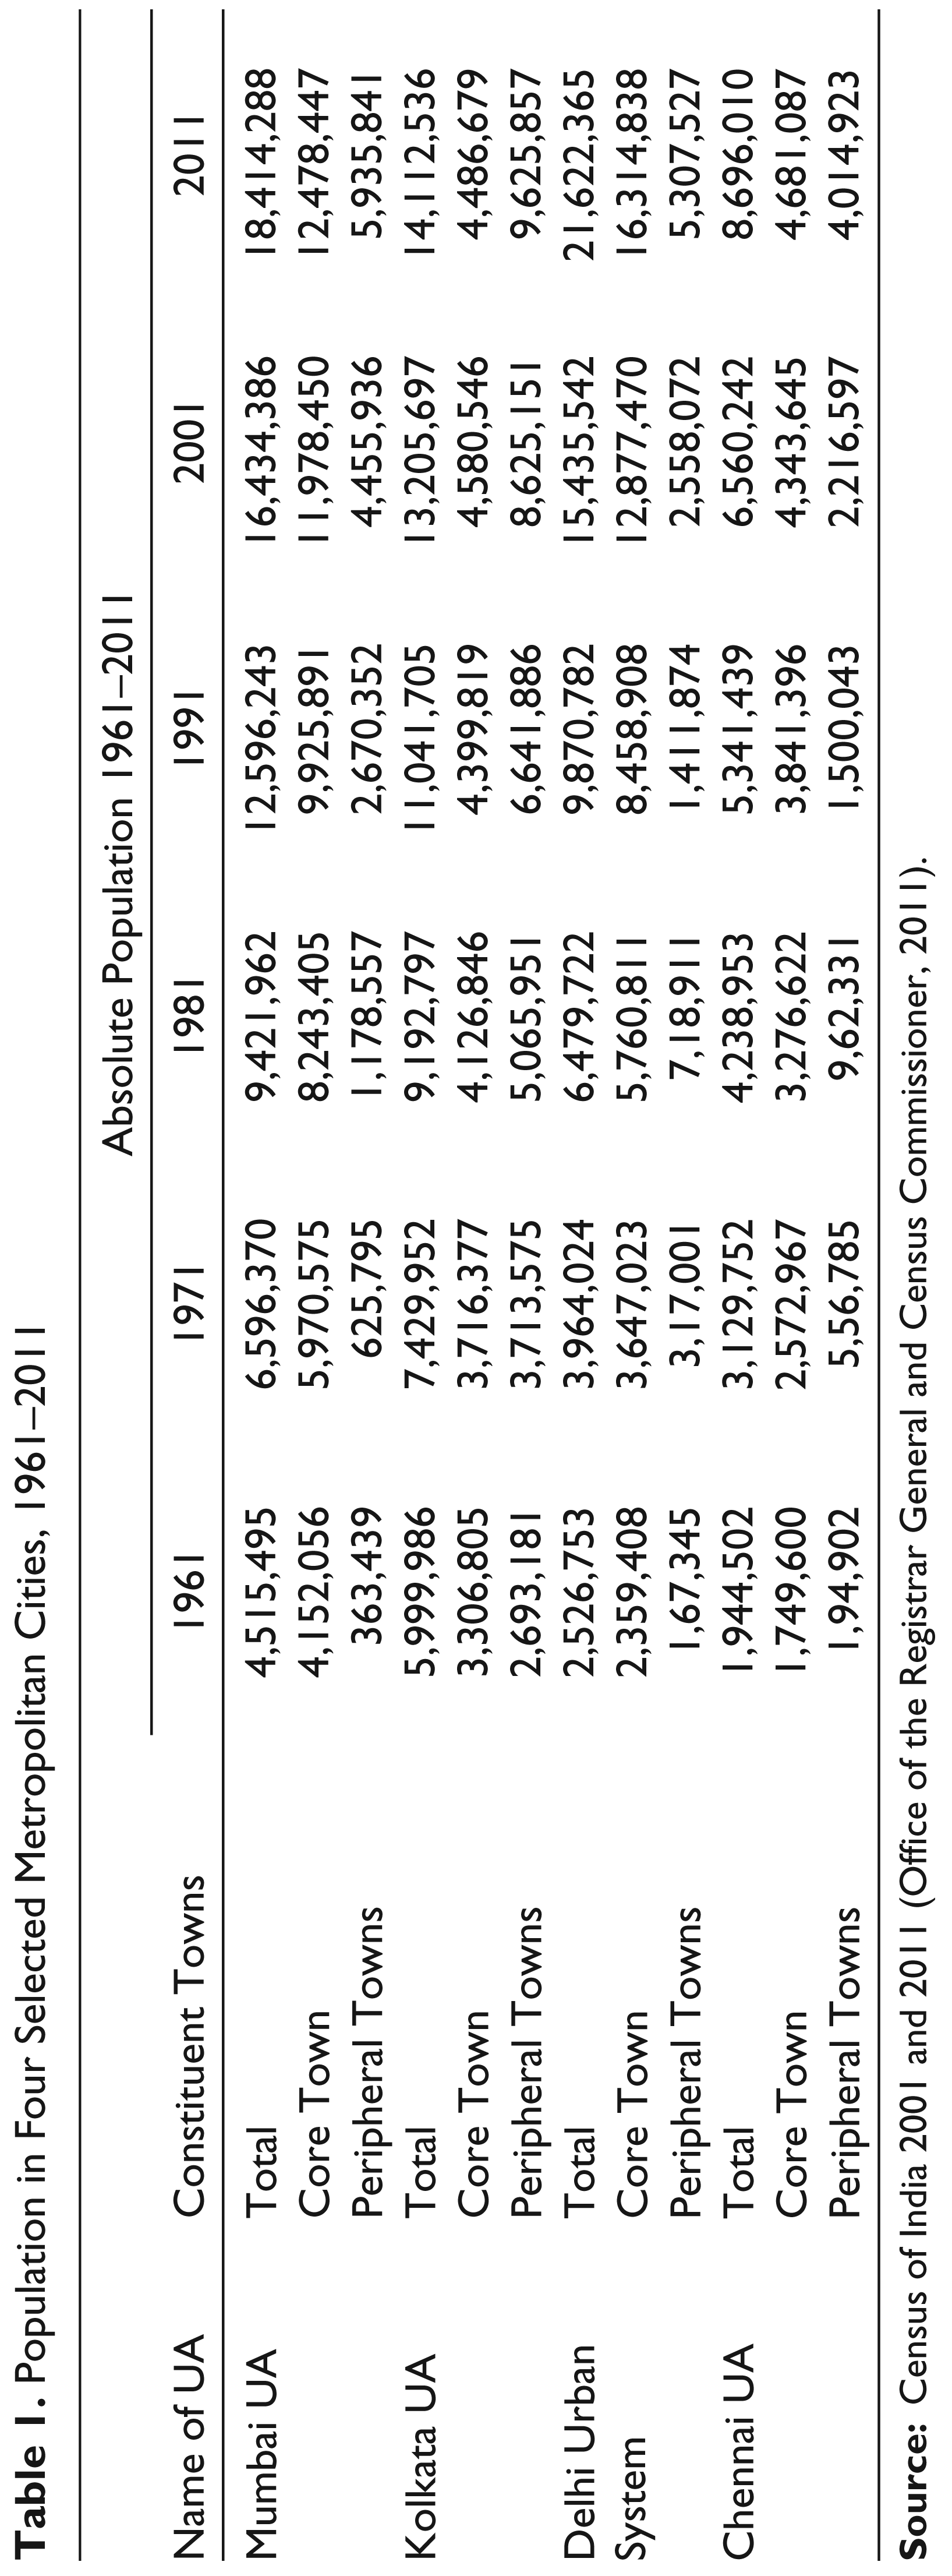
A closer look at the temporal growth of population of the four metros in absolute terms as well in their core–periphery decomposition reveals (Table 1) that there has been an increase in the population of the total UA in the census years of 1961 through 2011. Core towns in all four metros in 2011 have reported marginal increase with respect to the preceding census decade, with the exception of Kolkata.
In the case of Mumbai, the core has reported an increase from 4.2 million in 1961 to 12.5 million in 2011. Similarly, peripheral regions of Mumbai have experienced an increase to 5.9 million in 2011 from 4.5 million in 2001. In the case of Delhi the core reported a growth from 12.9 million in 2001 to 16.3 million in 2011; whereas the peripheral districts witnessed a population growth of 2.6 to 5.3 million between 2001 and 2011. In the case of Chennai, UA in the periphery has reported a quantum increase of urban population from 2.2 million in 2001 to 4.0 million in 2011 compared to only 0.3 million population increase in the core in the same inter-censal periods.
A detailed analysis of the growth dynamics needs certain consideration of the growth rates (Table 2) in the four metropolises under study. The overall growth rates in all the metros have decelerated over time and there are huge variations among them in the level of deceleration. A closer look at the growth scenario in the core town reveals, that in all the cases, growth rates are declining faster and presently they have positive growth rate with a very low values. The exception is Kolkata core where growth rate has turned negative (−2.1 per cent) in 2001–11. In Mumbai as a whole the growth rate has varied from 46.1 per cent in 1961–71, 33.7 in 1981–91 and 30.5 in 1991–01 and drastically reduced to 12.1 per cent in 2001–11.
Population in Four Selected Metropolitan Cities, 1961–2011
It is interesting to note that the overall core of Mumbai has experienced growth at the rate of 4.2 per cent between 2001 and 2011, but the inner core (Mumbai district), like Kolkata, has experienced a negative growth rate of −5.7 per cent in the 2001–11 while the other part of the core (Mumbai Suburban) continued to grow at a relatively faster rate of 8.1 per cent in the same years. However, the trend of high growth rate in the peripheral regions has kept the whole UA growing. The KUA has been growing positively but the rate of growth has decelerated between 1991 and 2011. Further, the core district of Kolkata has experienced negative growth rate between 2001 and 2011. However, the periphery has gained more than a million in population thereby contributing to the overall positive growth in the KUA. Likewise in Chennai and Delhi, it is revealed that there has been positive growth in totality though the growth rates in the core towns have decelerated to a great extent between 1991–01 and 2001–11. In Chennai for example, the core has found to have a falling growth rate of population from 13.1 per cent in 1991–01 to 7.8 per cent in 2001–11. However, the peripheral districts of Thiruvallur and Kancheepuram together contribute to a high rate of population growth of 47.8 per cent in 1991–01 and 81.1 per cent in 2001–11 of the CUA.
Population Growth Rates in the Four Metropolitan Cities, 1961–2011
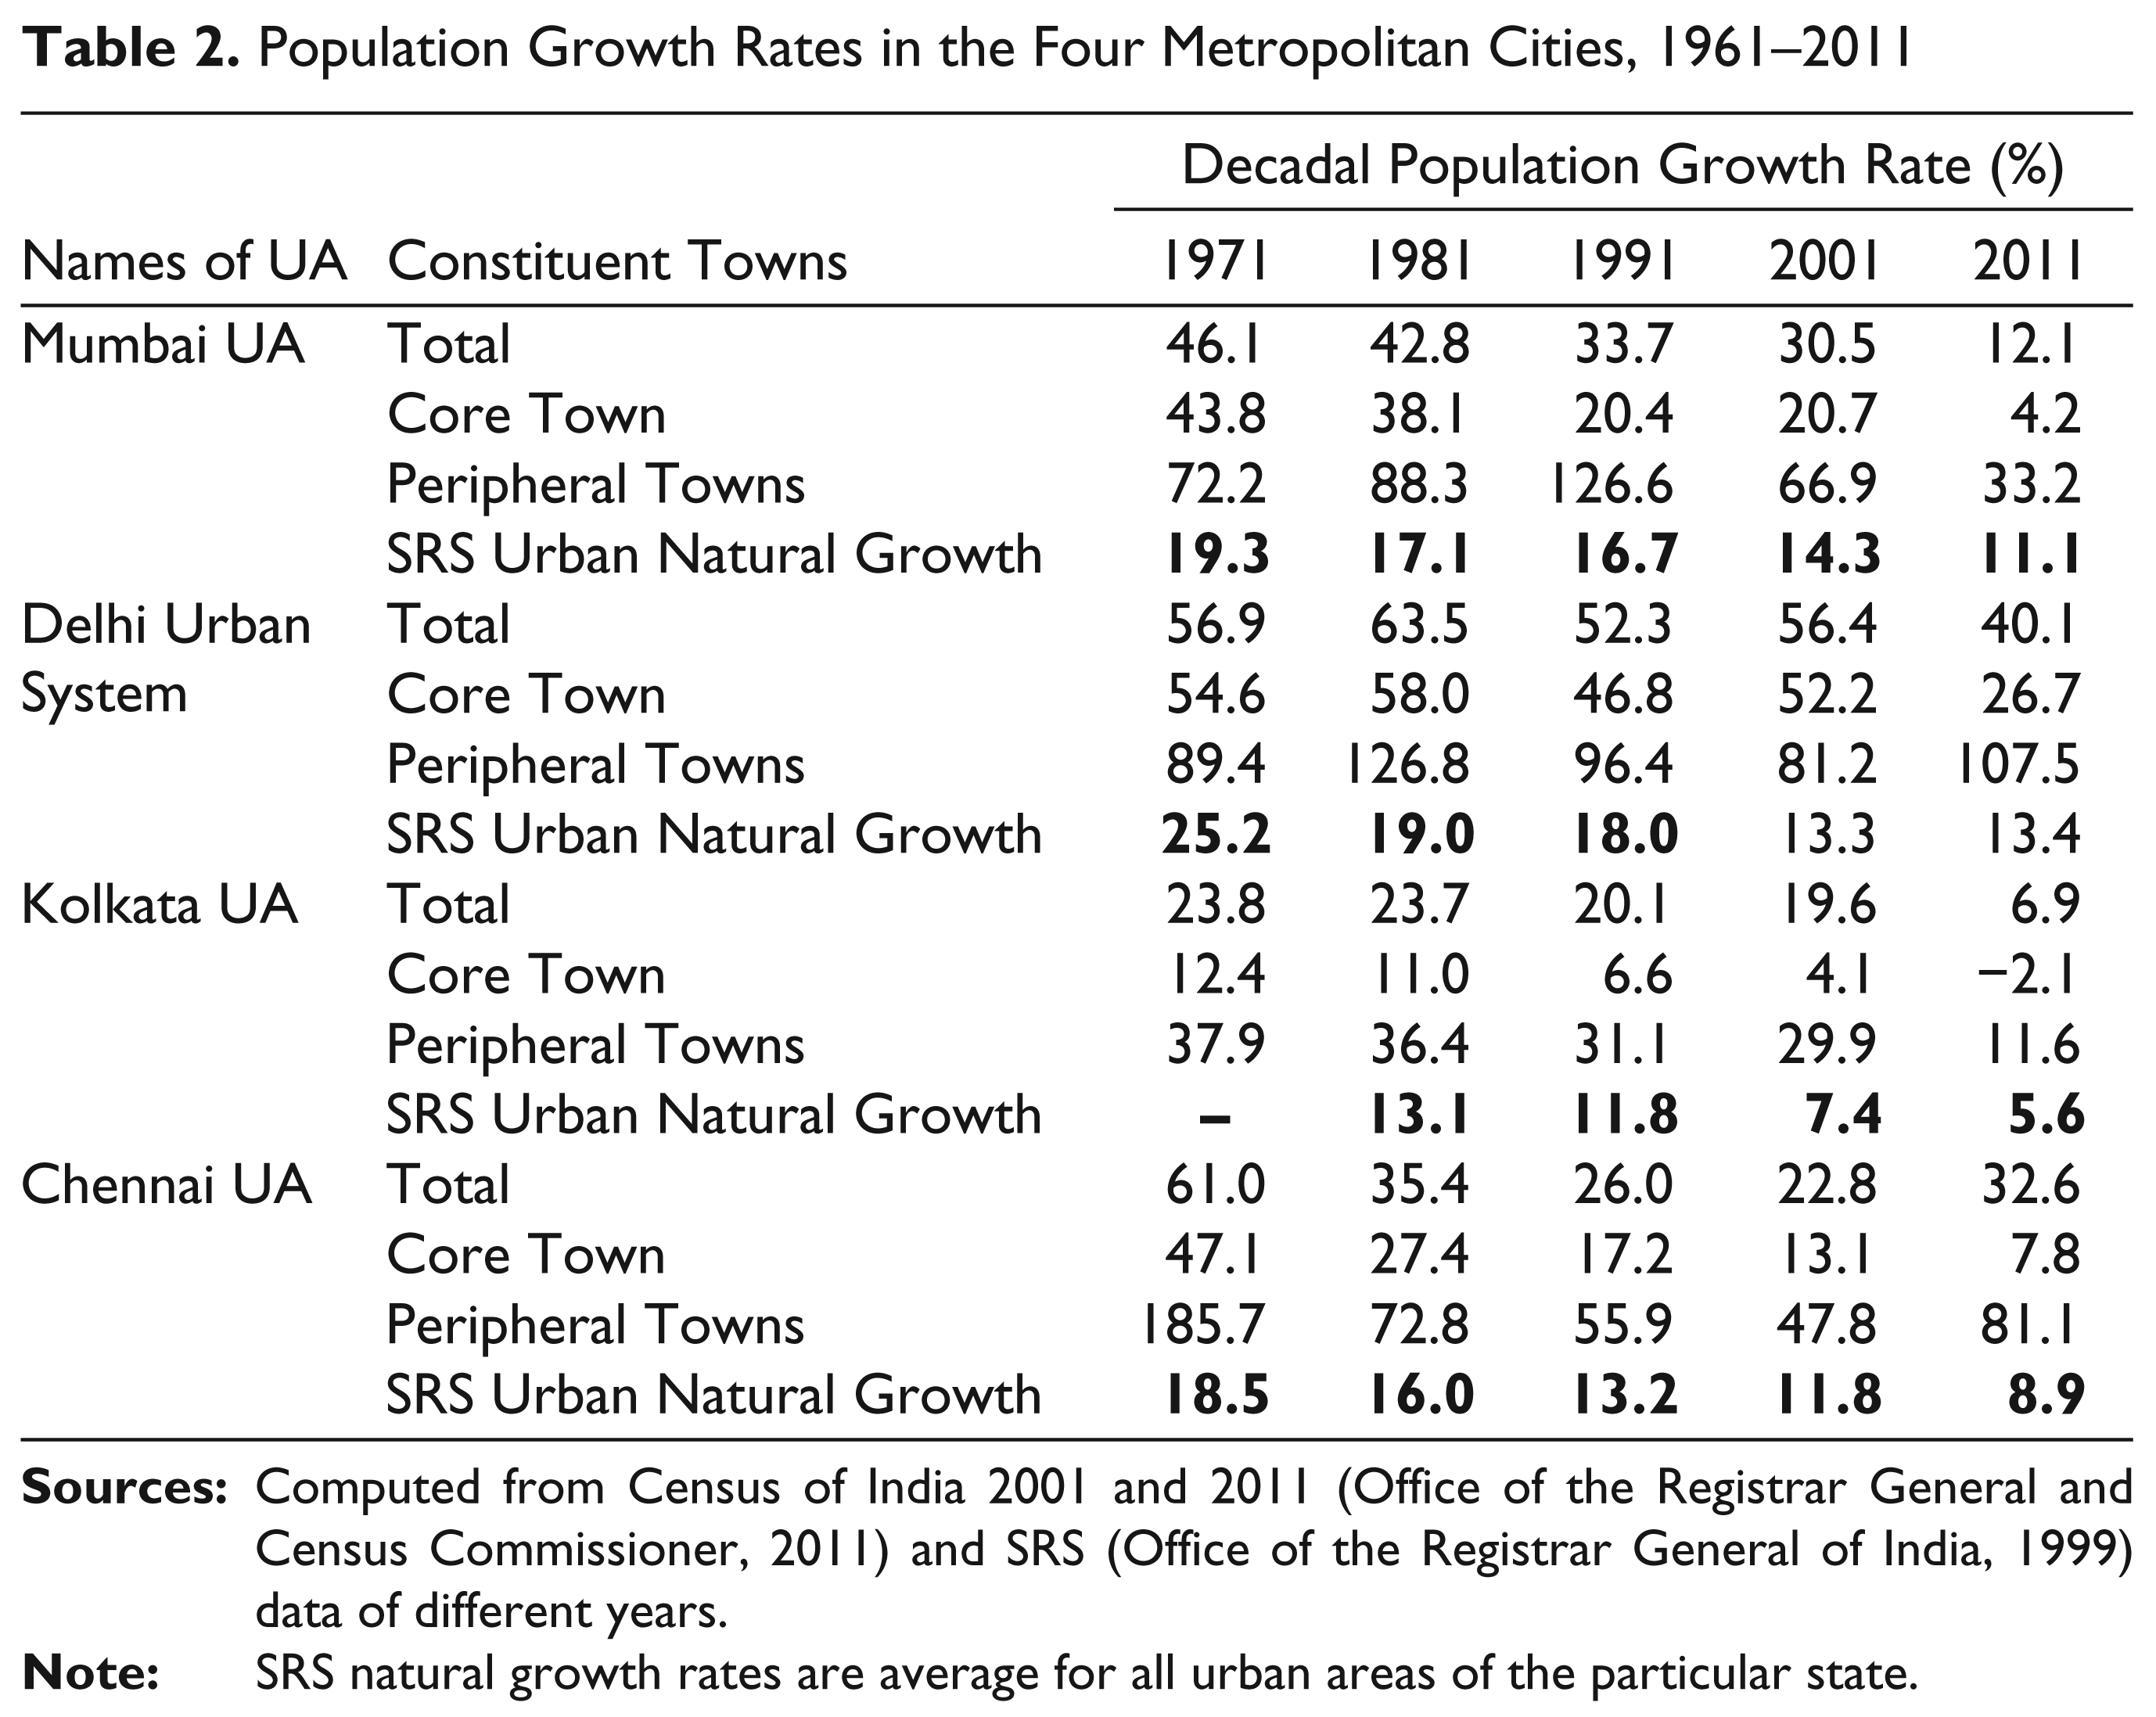
On the other hand, the vibrant urban system of Delhi has shown a marginal decline in the growth rate from 56.4 per cent in 1991–01 to 40.1 per cent in 2001–11. However, it may be stated that the NCT Delhi has reported almost a 25.5 per cent points decline in the growth rate between 2001 and 2011. The positive growth of population base of the Delhi urban system as a whole may be attributed to the transcendental growth in the peripheral towns of Gurgaon, Faridabad, NOIDA and Ghaziabad from 81.2 per cent in 1991–01 to 107.5 per cent in 2001–11. Therefore, the UAs containing India’s major metropolitan cities have been found to expand in response to the growing population in the peripheral towns.
As mentioned earlier in this study, when considering overall growth rate, one also needs to look at the contribution of different components of growth. Here, we look at Sample Registration System (SRS) which provides estimates of average natural increase rates in urban areas for the states of India. The difference between the overall population growth rates and SRS based natural increase rates provides a rough idea about the magnitude of migration’s component in population growth. In all the years between 1971 and 2011, metropolitan towns both in the core and the peripheral areas have shown a positive difference between overall population growth rates and natural increase rates except for Kolkata core in 2011. Therefore, it is implied that migration has contributed positively in population increase. But it is not possible to have accurate estimates of migration at district level with the help of SRS data since it only provides the average of all the different size classes of urban units of the state as a whole.
Scholars of urban geography reported that cities/towns of the developed world have seen rapid growth in the past mainly because of migration. But, unlike the developed world, cities/towns of developing countries are growing rapidly due to a combined reason of natural increase and migration (Potter & Evans, 1998; Tim Dyson, 2011). Table 3 provides a detailed illustration of the contribution of natural increase and migration in the UAs of Mumbai, Kolkata and Chennai. Here natural growth rate is computed as the difference between total growth rate and the net migration. It is observed that in the districts of MUA, migration rate is far superseded by the annual natural increase of population. The same has been found to decline in the core district of Mumbai, whereas the peripheral districts of Mumbai Suburban and Thane continue to be high at 12.3 and 26.3 per 1,000 respectively between 1991 and 2001, thereby contributing positively in the population growth of MUA as a whole. It is important to note that the migration and natural increase share almost equal proportional input to the overall population growth in the core of Mumbai, while natural increase far supersedes the migration in the peripheral districts of Mumbai Suburban and Thane.
Growth Components in Mumbai, Kolkata and Chennai Agglomerations, 1991–2001
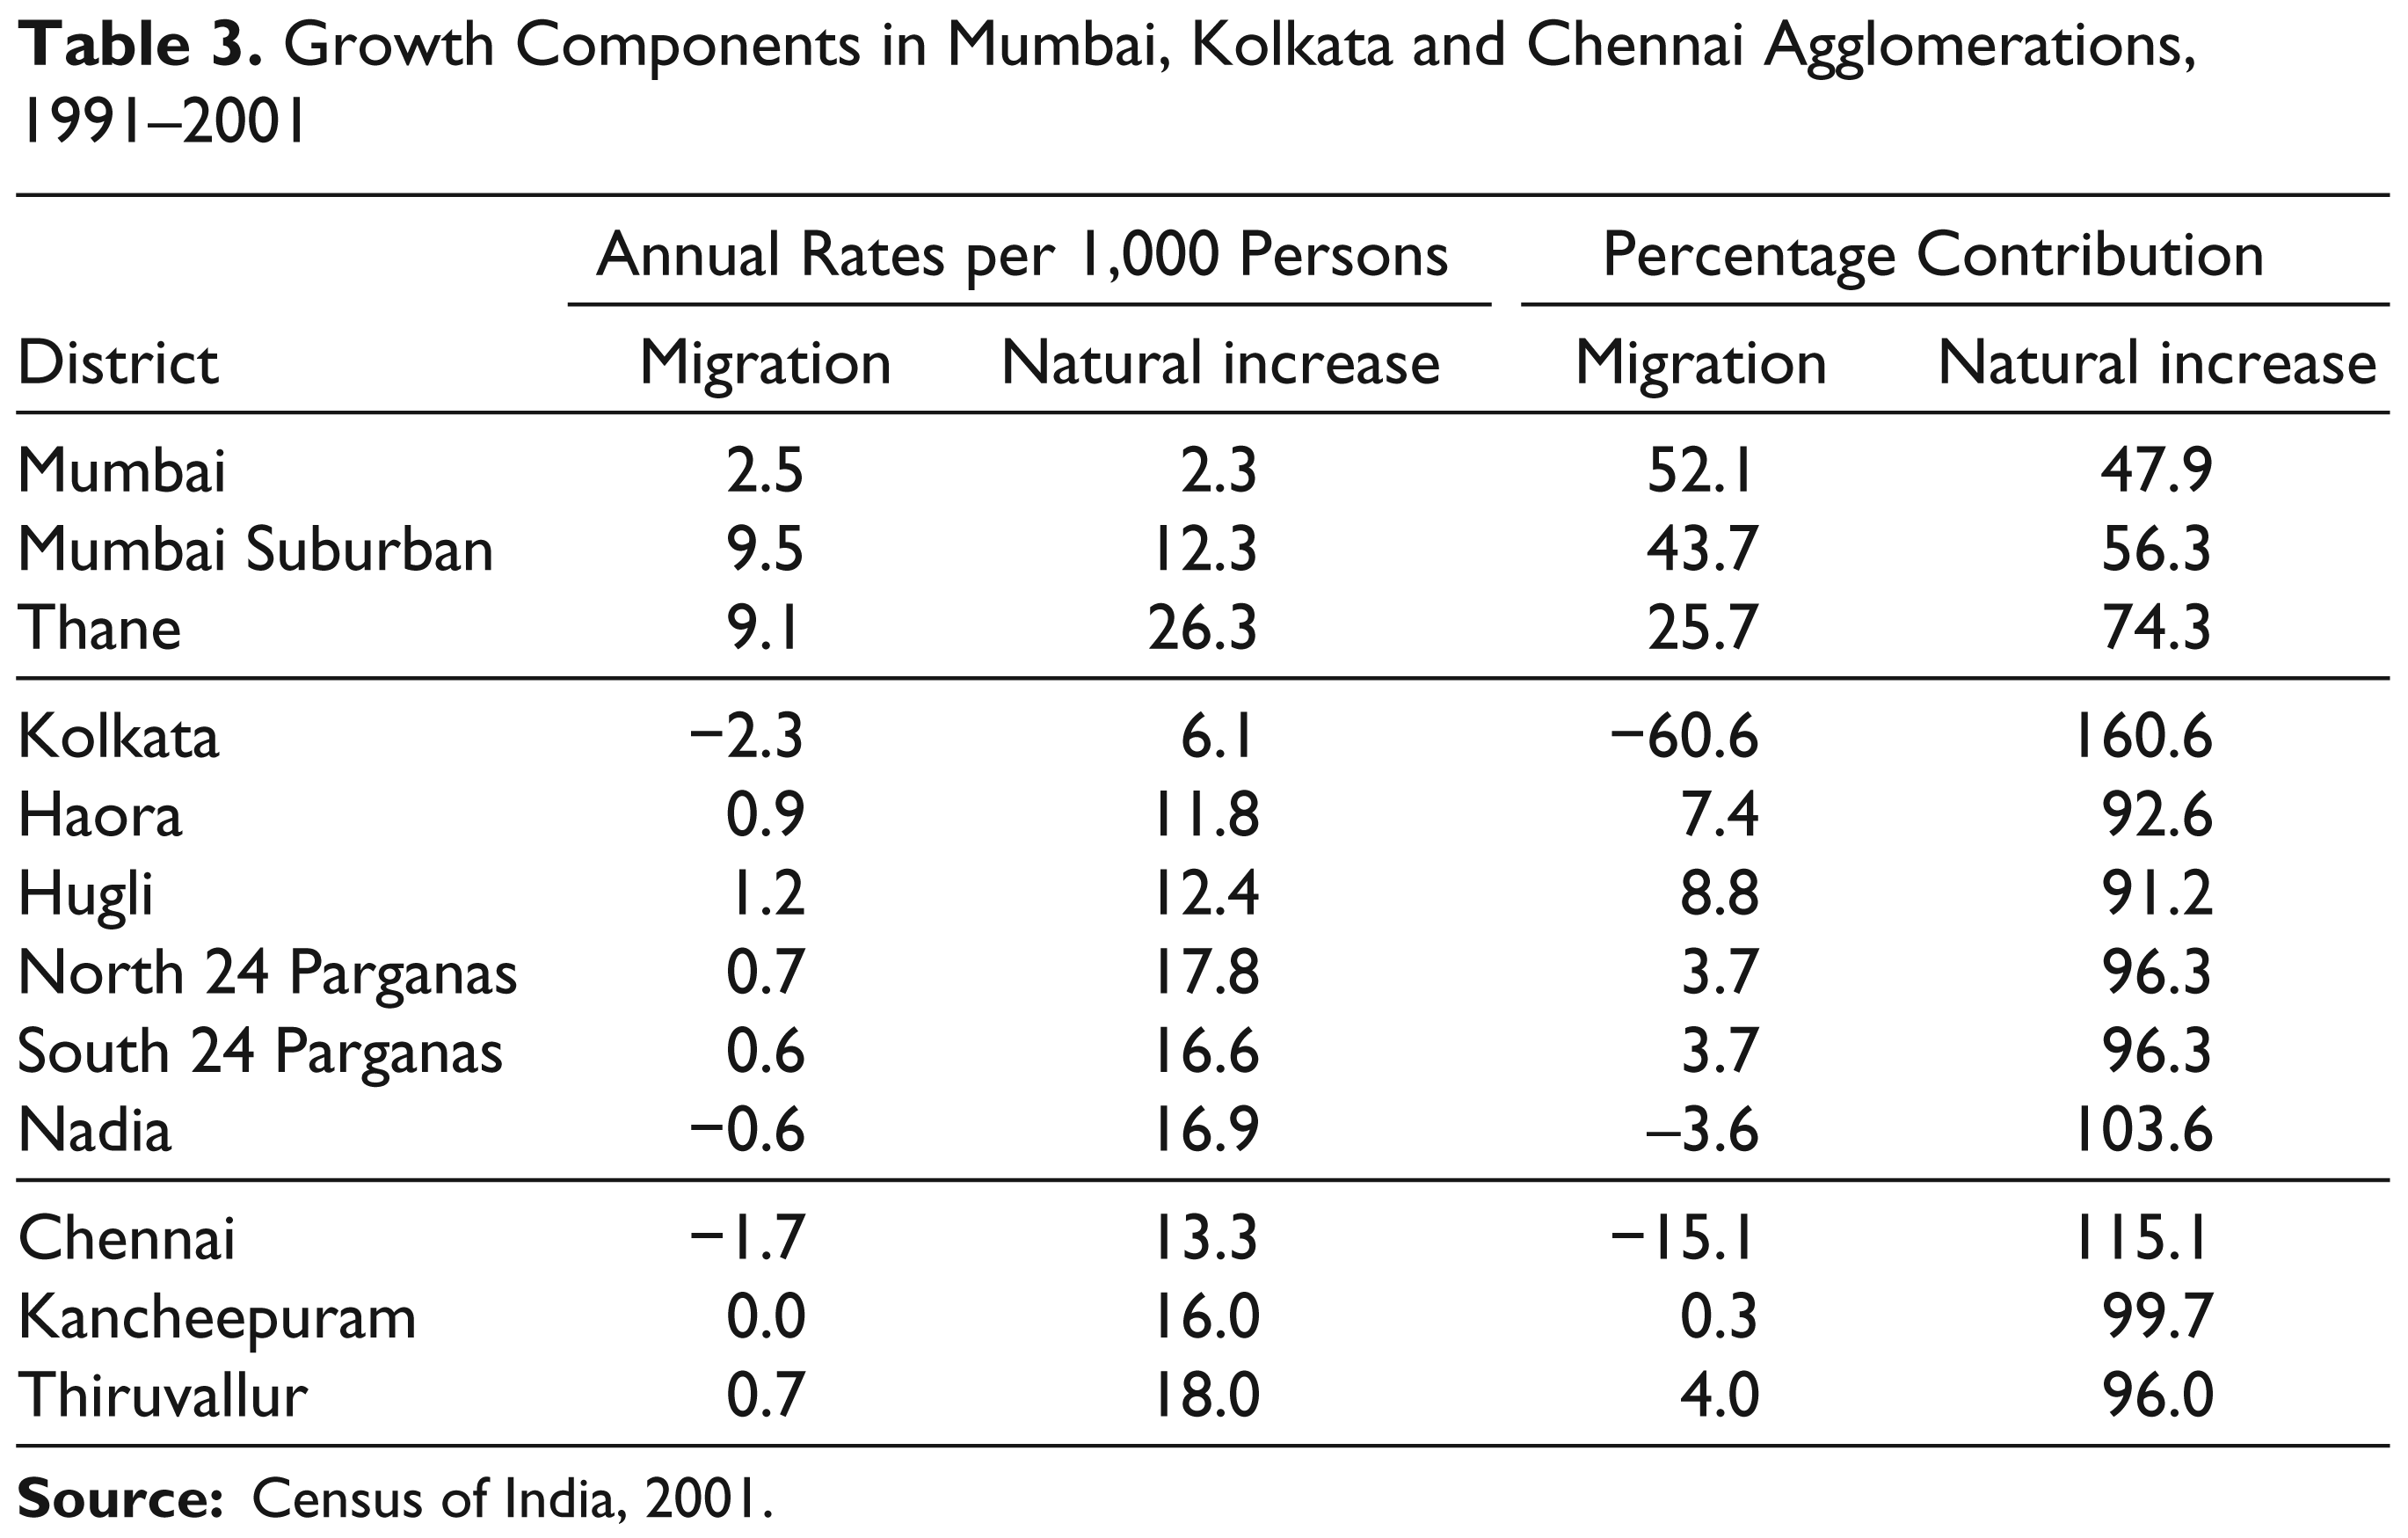
A similar picture emerges for UAs of Kolkata and Chennai. In the KUA for example, net migration rate between 1991 and 2001 has been found to be negative, implying that the population are out-migrating from the city core in larger number than the in-migration. The annual natural increase rate per 1,000 population in case of the district of Kolkata has also been found to be a meagre 6.1 persons in 1991–01. The bit of growth happening in the district of Kolkata is because of the contribution of natural increase. Further, peripheral districts show that all five metropolitans have an annual natural growth rate of more than 10 persons per 1,000 between 1991 and 2001.
In case of CUA, very much in line with the experiences in the other UAs, the core has experienced a negative migration rate. However, though the peripheral districts containing the towns of Kancheepuram and Thiruvallur have reported positive migration rate, in terms of absolute numbers they are quite less when compared with other metropolitan cities in discussion. The population in the Chennai urban system as a whole is growing mainly in response to the contribution of high natural increase.
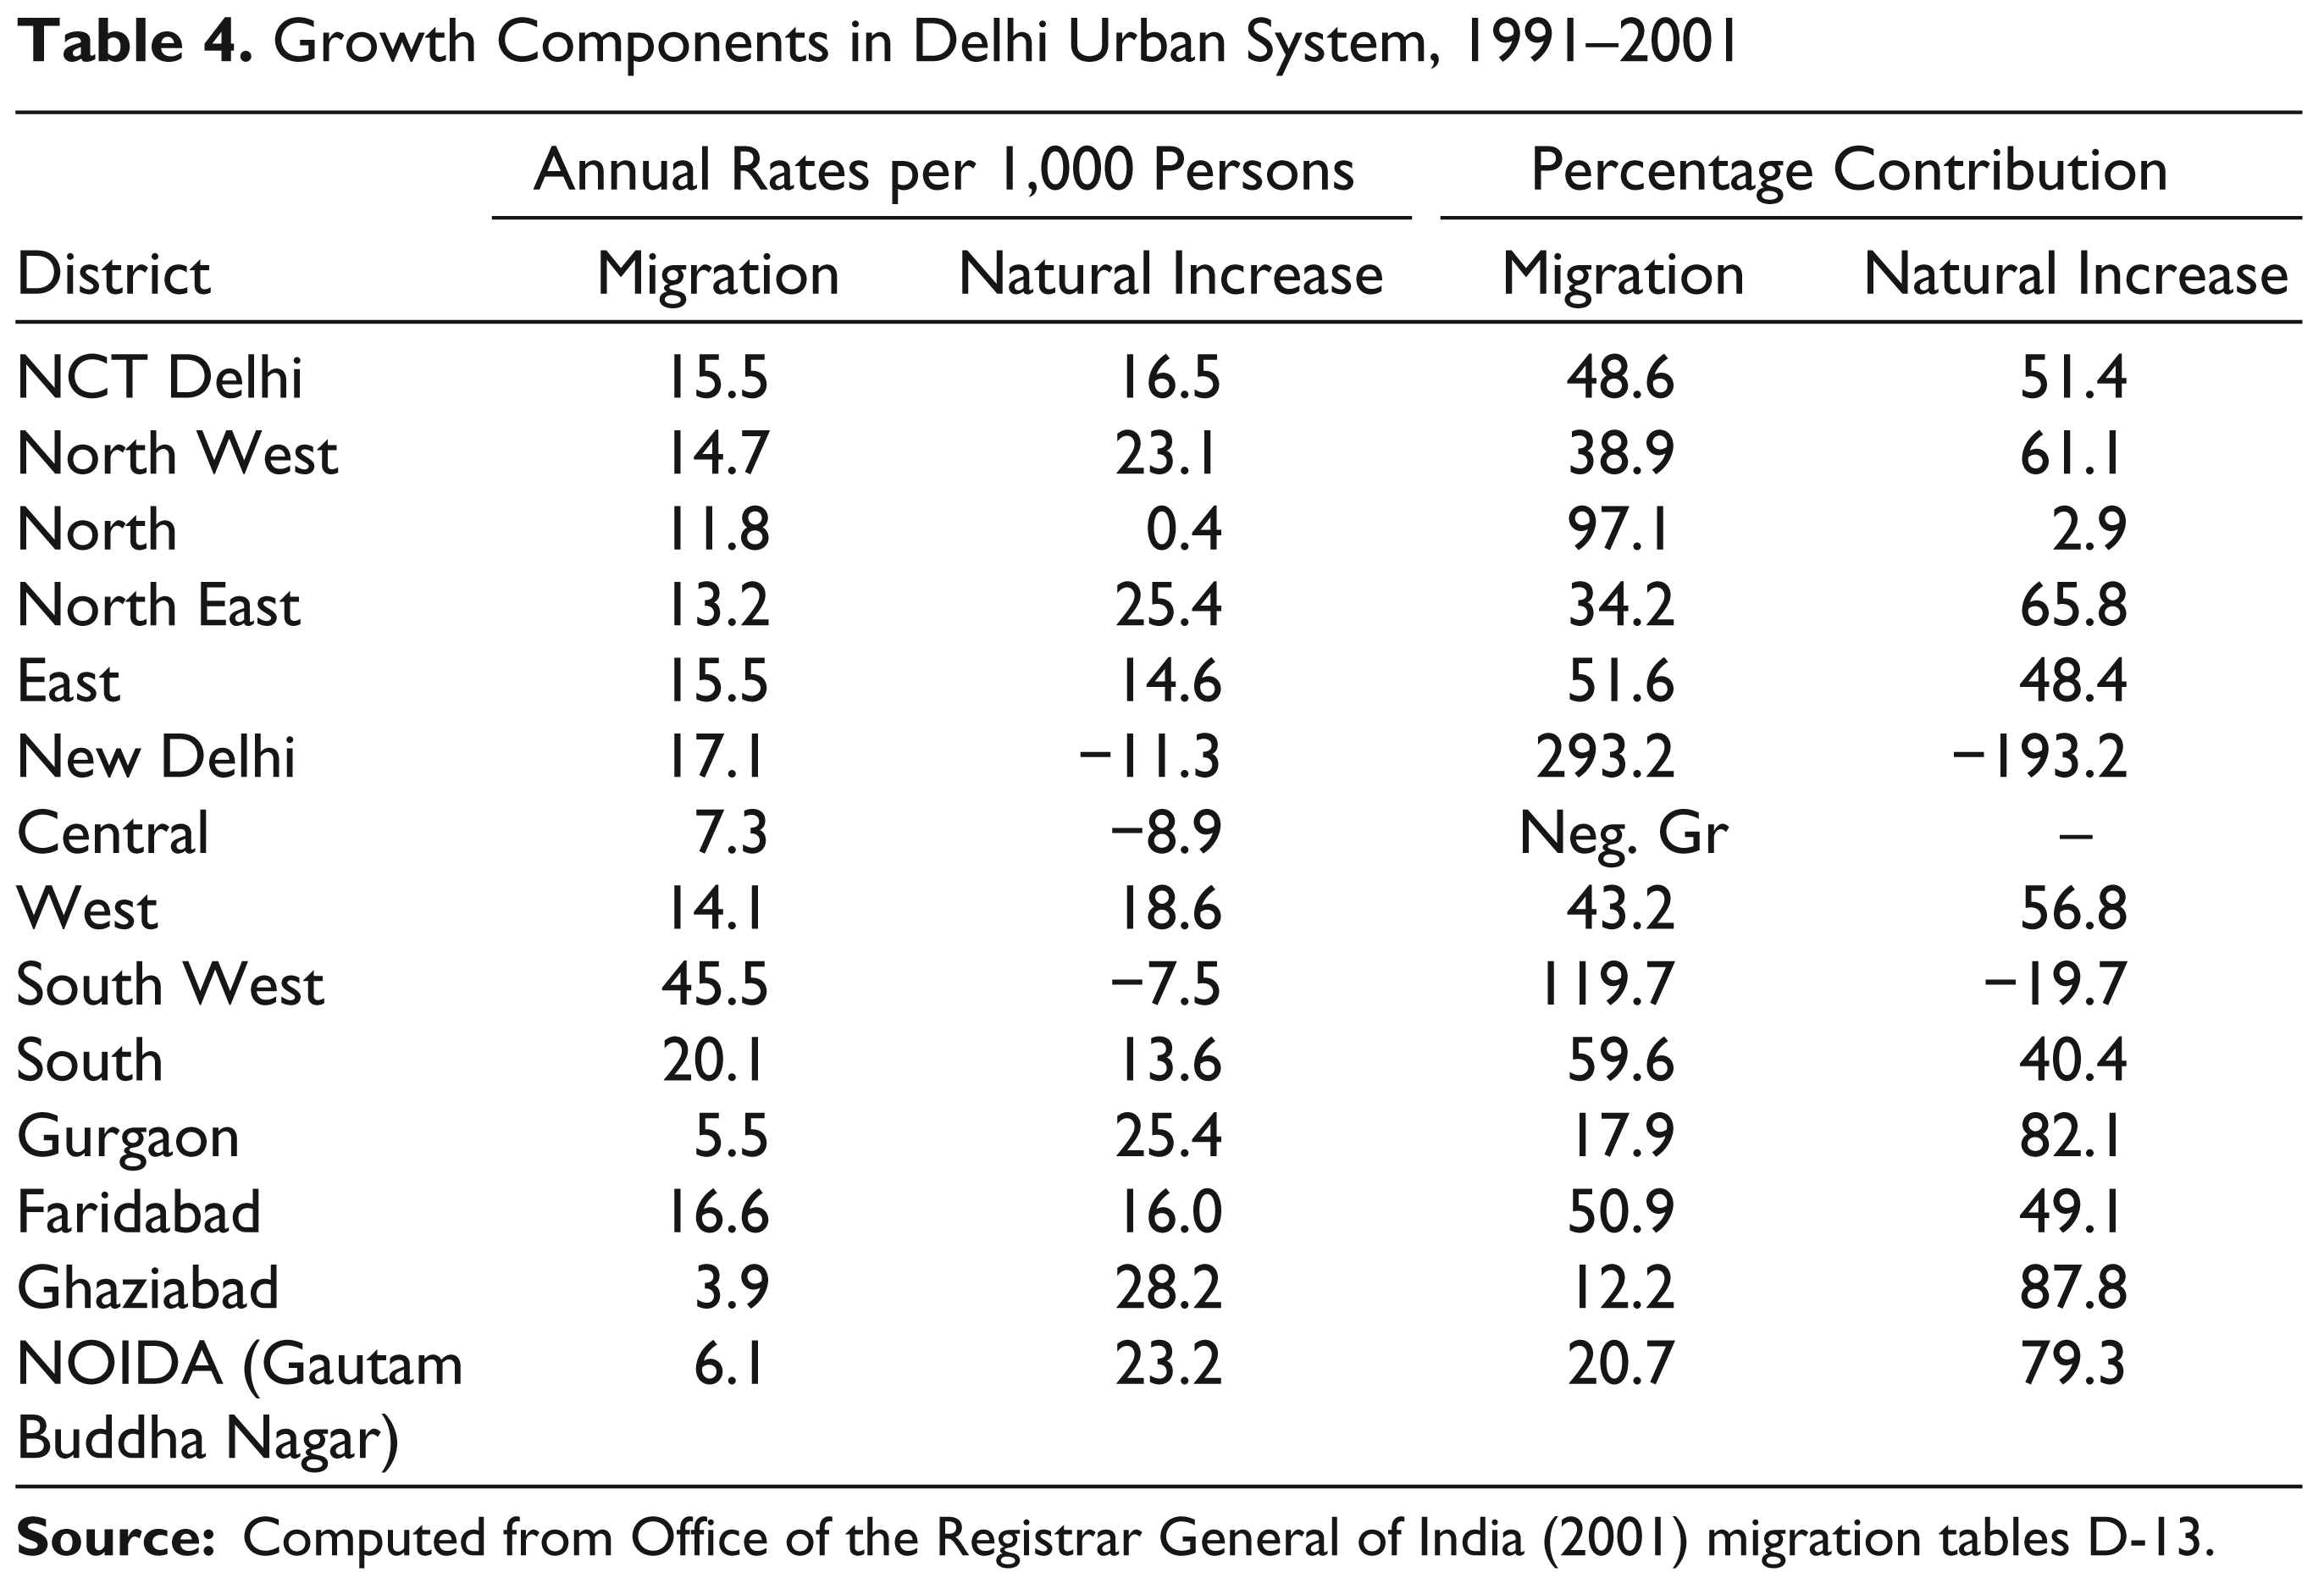
The Delhi urban system spread over 13 districts of three states illustrates a great variation in the contribution of the constituent districts to the growth rate (Table 4). In Delhi core, the annual natural increase rate per 1,000 population has been computed to be around 17 persons in 1991–01. The total urban system is found to increase a lot because of migration but both the migration rate and the natural increase in the periphery is found to be inimitable in comparison to the core. Three districts in the core of the Delhi urban system, namely, New Delhi, Central Delhi and South West Delhi have reported a negative natural growth rate in 1991–01. The same districts have revealed positive contribution of migration to the total population growth in the 1991–01. In the peripheral districts of the Delhi urban system, Faridabad has reported to have grown by half-half contribution of migration and natural increase. NOIDA and Gurgaon have enhanced their urban population by close to one-fifth by migration and the remaining four-fifths by natural increase of population.
If an attempt is made to address the growth-contributing factors in the metropolises, migration is found to have contributed to more than 50 per cent in the core districts of Mumbai and Delhi and in Faridabad. Natural increase continues to dominate the growth dynamics in the core districts of Kolkata and Chennai and in the peripheral districts of Mumbai Suburban and Thane of Mumbai UA, Haora, Hugli, North and South 24 Parganas and Nadia of Kolkata UA, Kancheepuram and Thiruvallur of Chennai UA and Gurgaon, Ghaziabad and Gautam Buddha Nagar of Delhi Urban system.
Growth Components in Delhi Urban System, 1991–2001
At this juncture if an attempt is made to fit in Berg’s model of urban development to the UA in the present study it will be found that Mumbai, Kolkata and Delhi is in the absolute centralisation stage of exurbanisation/suburbanisation. The Central district and New Delhi of Delhi had experienced negative growth between 2001 and 2011. Similar is the experience of the core of Kolkata and inner core district of Mumbai which have all experienced a negative growth rate in 2001–11. Therefore, all these three metros can be put in the absolute centralisation stage of suburbanisation.
Population density has a great bearing on the available infrastructure and the governance. However, what amount of concentration led to what kind of impact is yet to be subtly defined. David Clarke have pointed out that if the Asian average of 7,600 persons per sq. km is taken to be constant for the entire world, then the global urban population could have been accommodated within 1 per cent of the total landmass (2003). It would be interesting to note the population density of some of the world’s largest cities and compare the status of the major Indian metropolises. The average density of the city of New York has been estimated to be 1,100 persons per sq. km whereas the same for Canada is 1,800 persons per sq. km. Other less developed countries of Asia have been estimated to have 10,200 people per sq. km area, whereas Indian average density has been estimated to be 14,200 persons per sq. km (World Urban Areas, 2013).
Change in Population Density in Selected Metros, 1961–2011
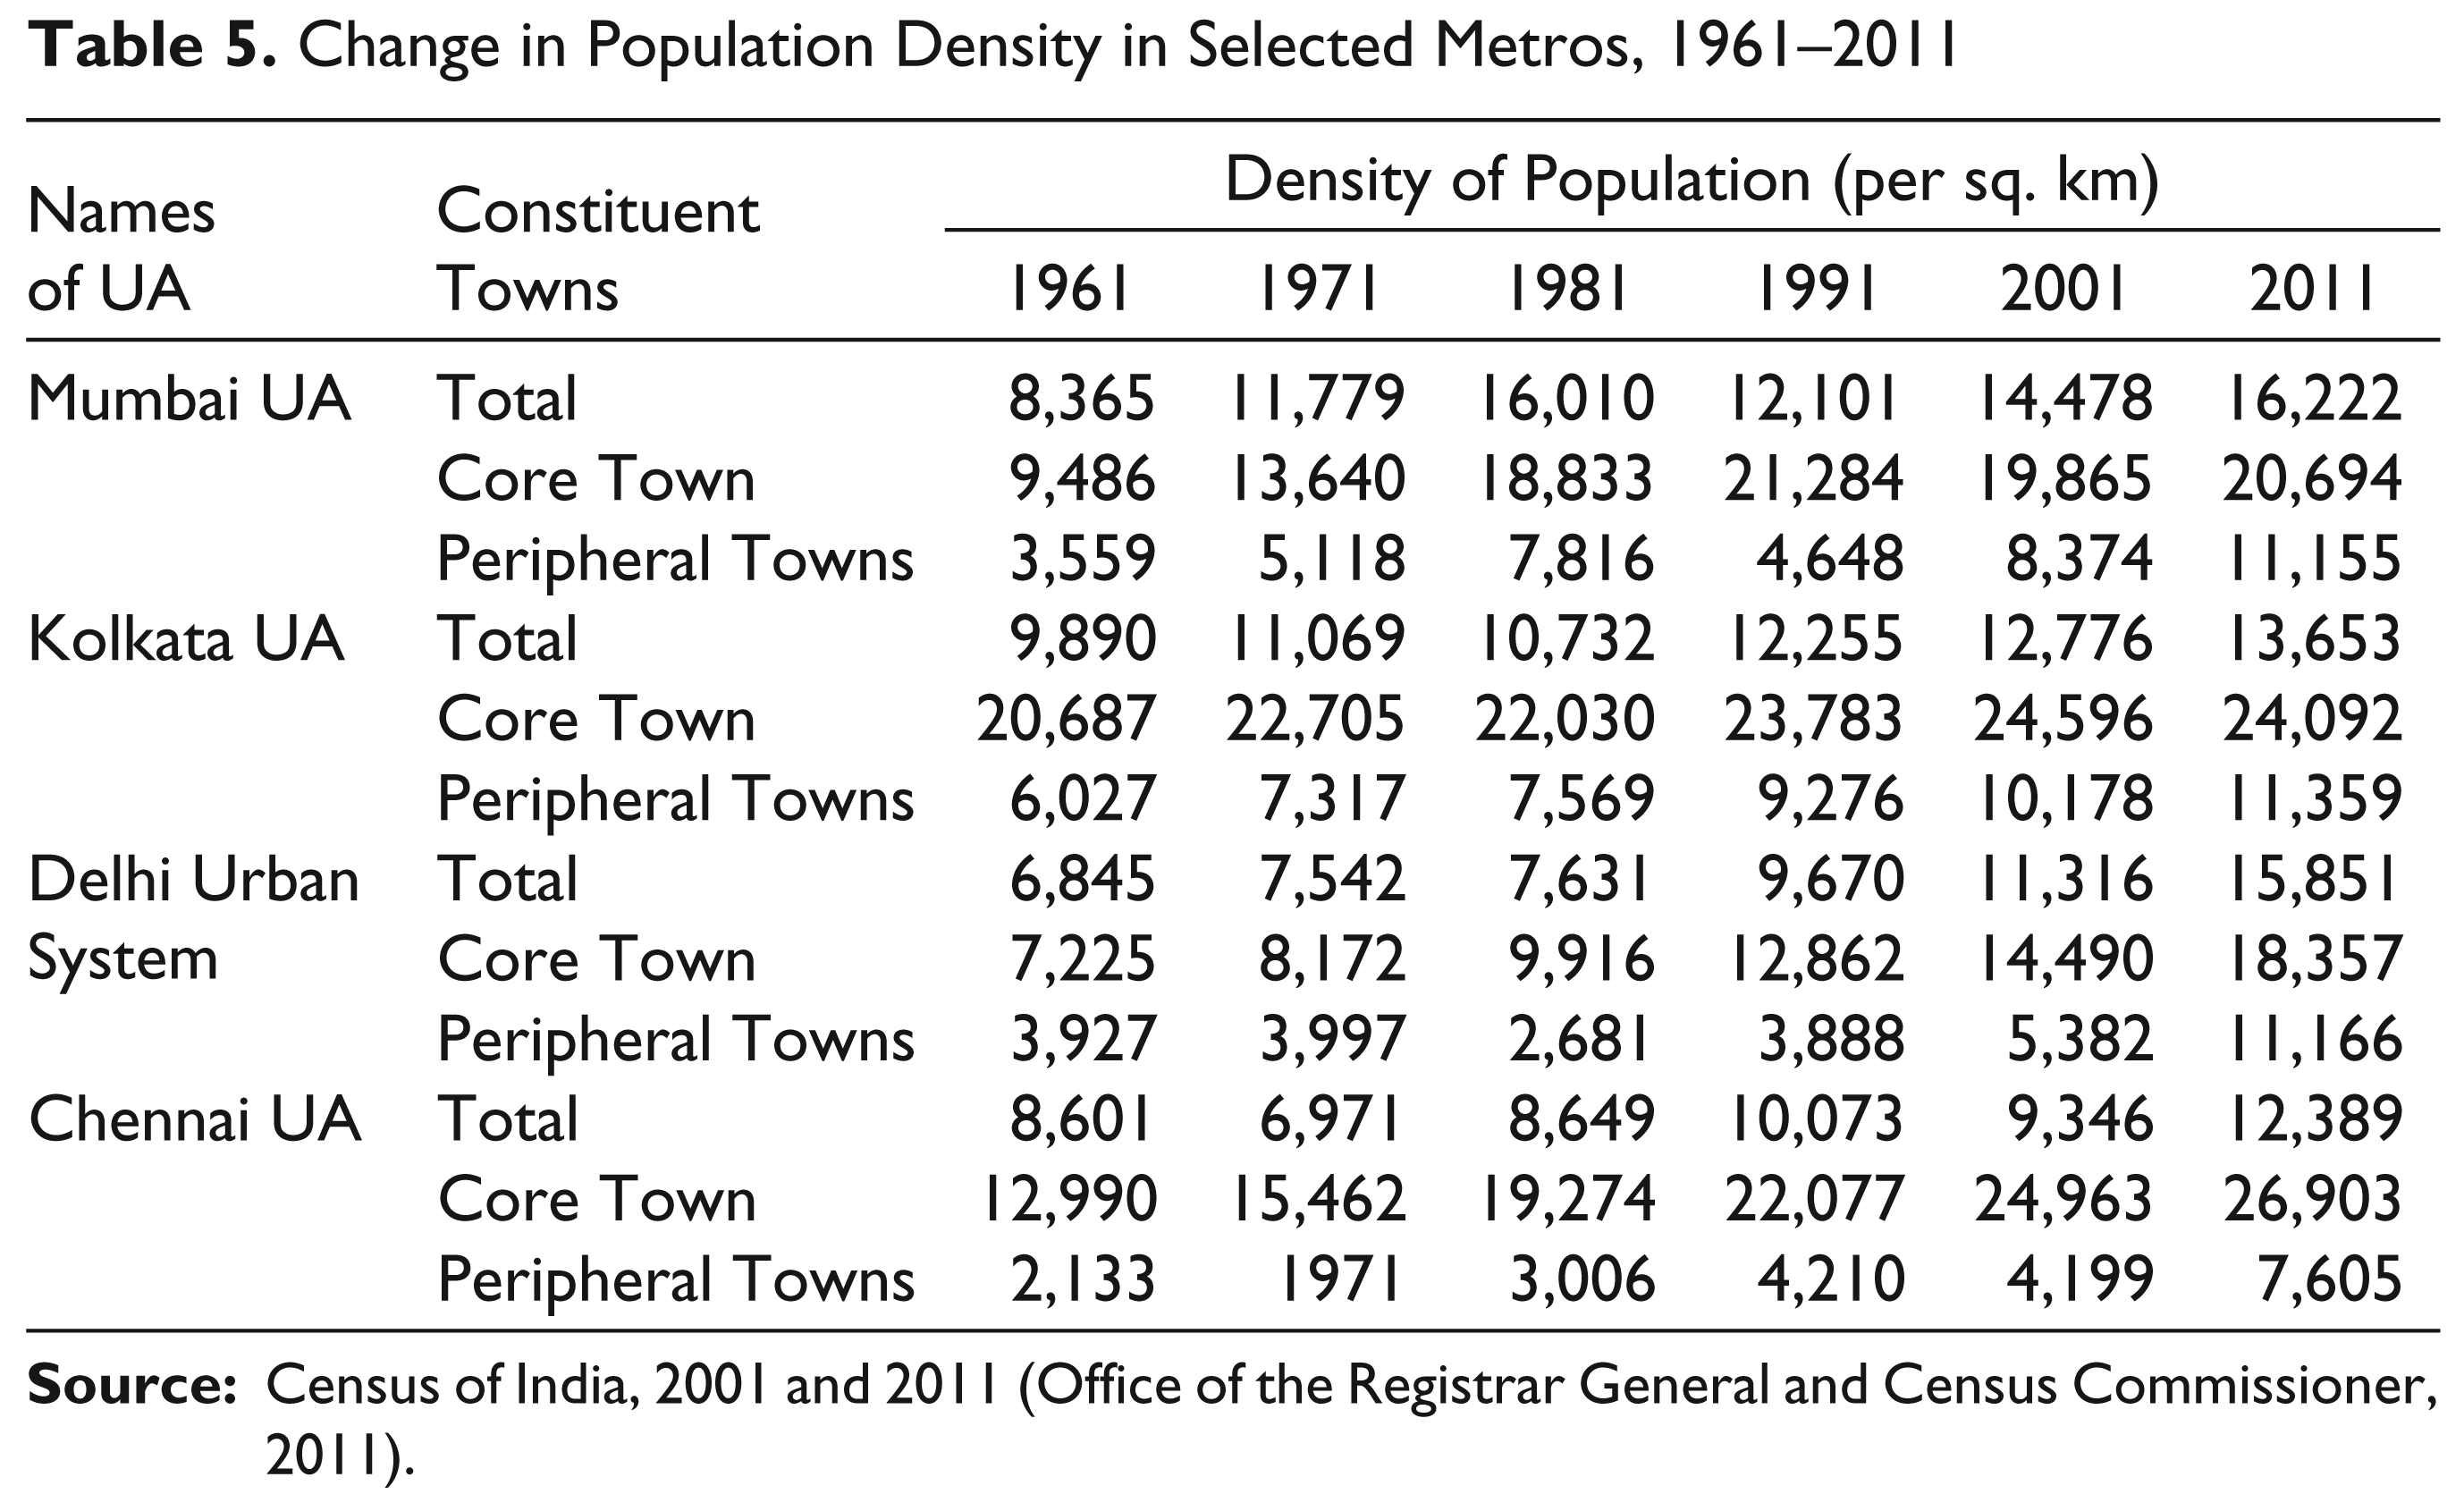
If the density of the towns taken up in a temporal perspective, it may be found that quite akin to the experiences of the major metropolises of the world, the density of core towns are reported to be more than 15,000 persons per sq. km. One of the interesting things to note in Table 5 is that except for Chennai, all the other metros have parity in the population density at the core and the periphery.
Having said this, what needs attention is the dynamism of migrants’ choice of destination as to whether the migrant follow any definite path of movement to the four selected metros. Popular beliefs and scholarly interpretations reveal that the migratory movement to and from the city has a tone of exclusion attached to it (Kundu & Saraswati, 2012). This is to say that rural poverty and unemployment (or underemployment) pushes rural migrants out of their native places. Once these distress rural workers come into the city they are faced with loads of difficulties, they get involved in low-paid informal jobs and are bound to reside in low-quality housing and squatter settlements. It is again the dismay in the urban spaces that the rural migrants are faced with a step-motherly treatment in the urban environment. Therefore, rural to urban migration in India is many a time connoted with terminologies such as exclusion, alienation and marginalisation. But the purpose of the present study is also to identify the source and destination of the migrants in the four cardinal metropolitan agglomerations in India.
Demographically, the largest of the UAs in India, the core of Delhi urban system has been found to receive 19 migrants per 1,000 population per year in the inter-censal years of 1991 and 2001 (Table 6). Delhi and Faridabad have reported to have 19 in-migrants per 1,000 population coming from outside the state. The district of Faridabad has further reported to have the highest annual in-migration rate of 21 persons per 1,000 population followed by Gautam Buddha Nagar with 14 persons per 1,000 population, Ghaziabad with 13 persons per 1,000 population and Gurgaon with 11 persons per 1,000 population in the inter-censal period of 1991 and 2001.
Volume and Rate of In-migration to the Four Metropolises, 1991–2001
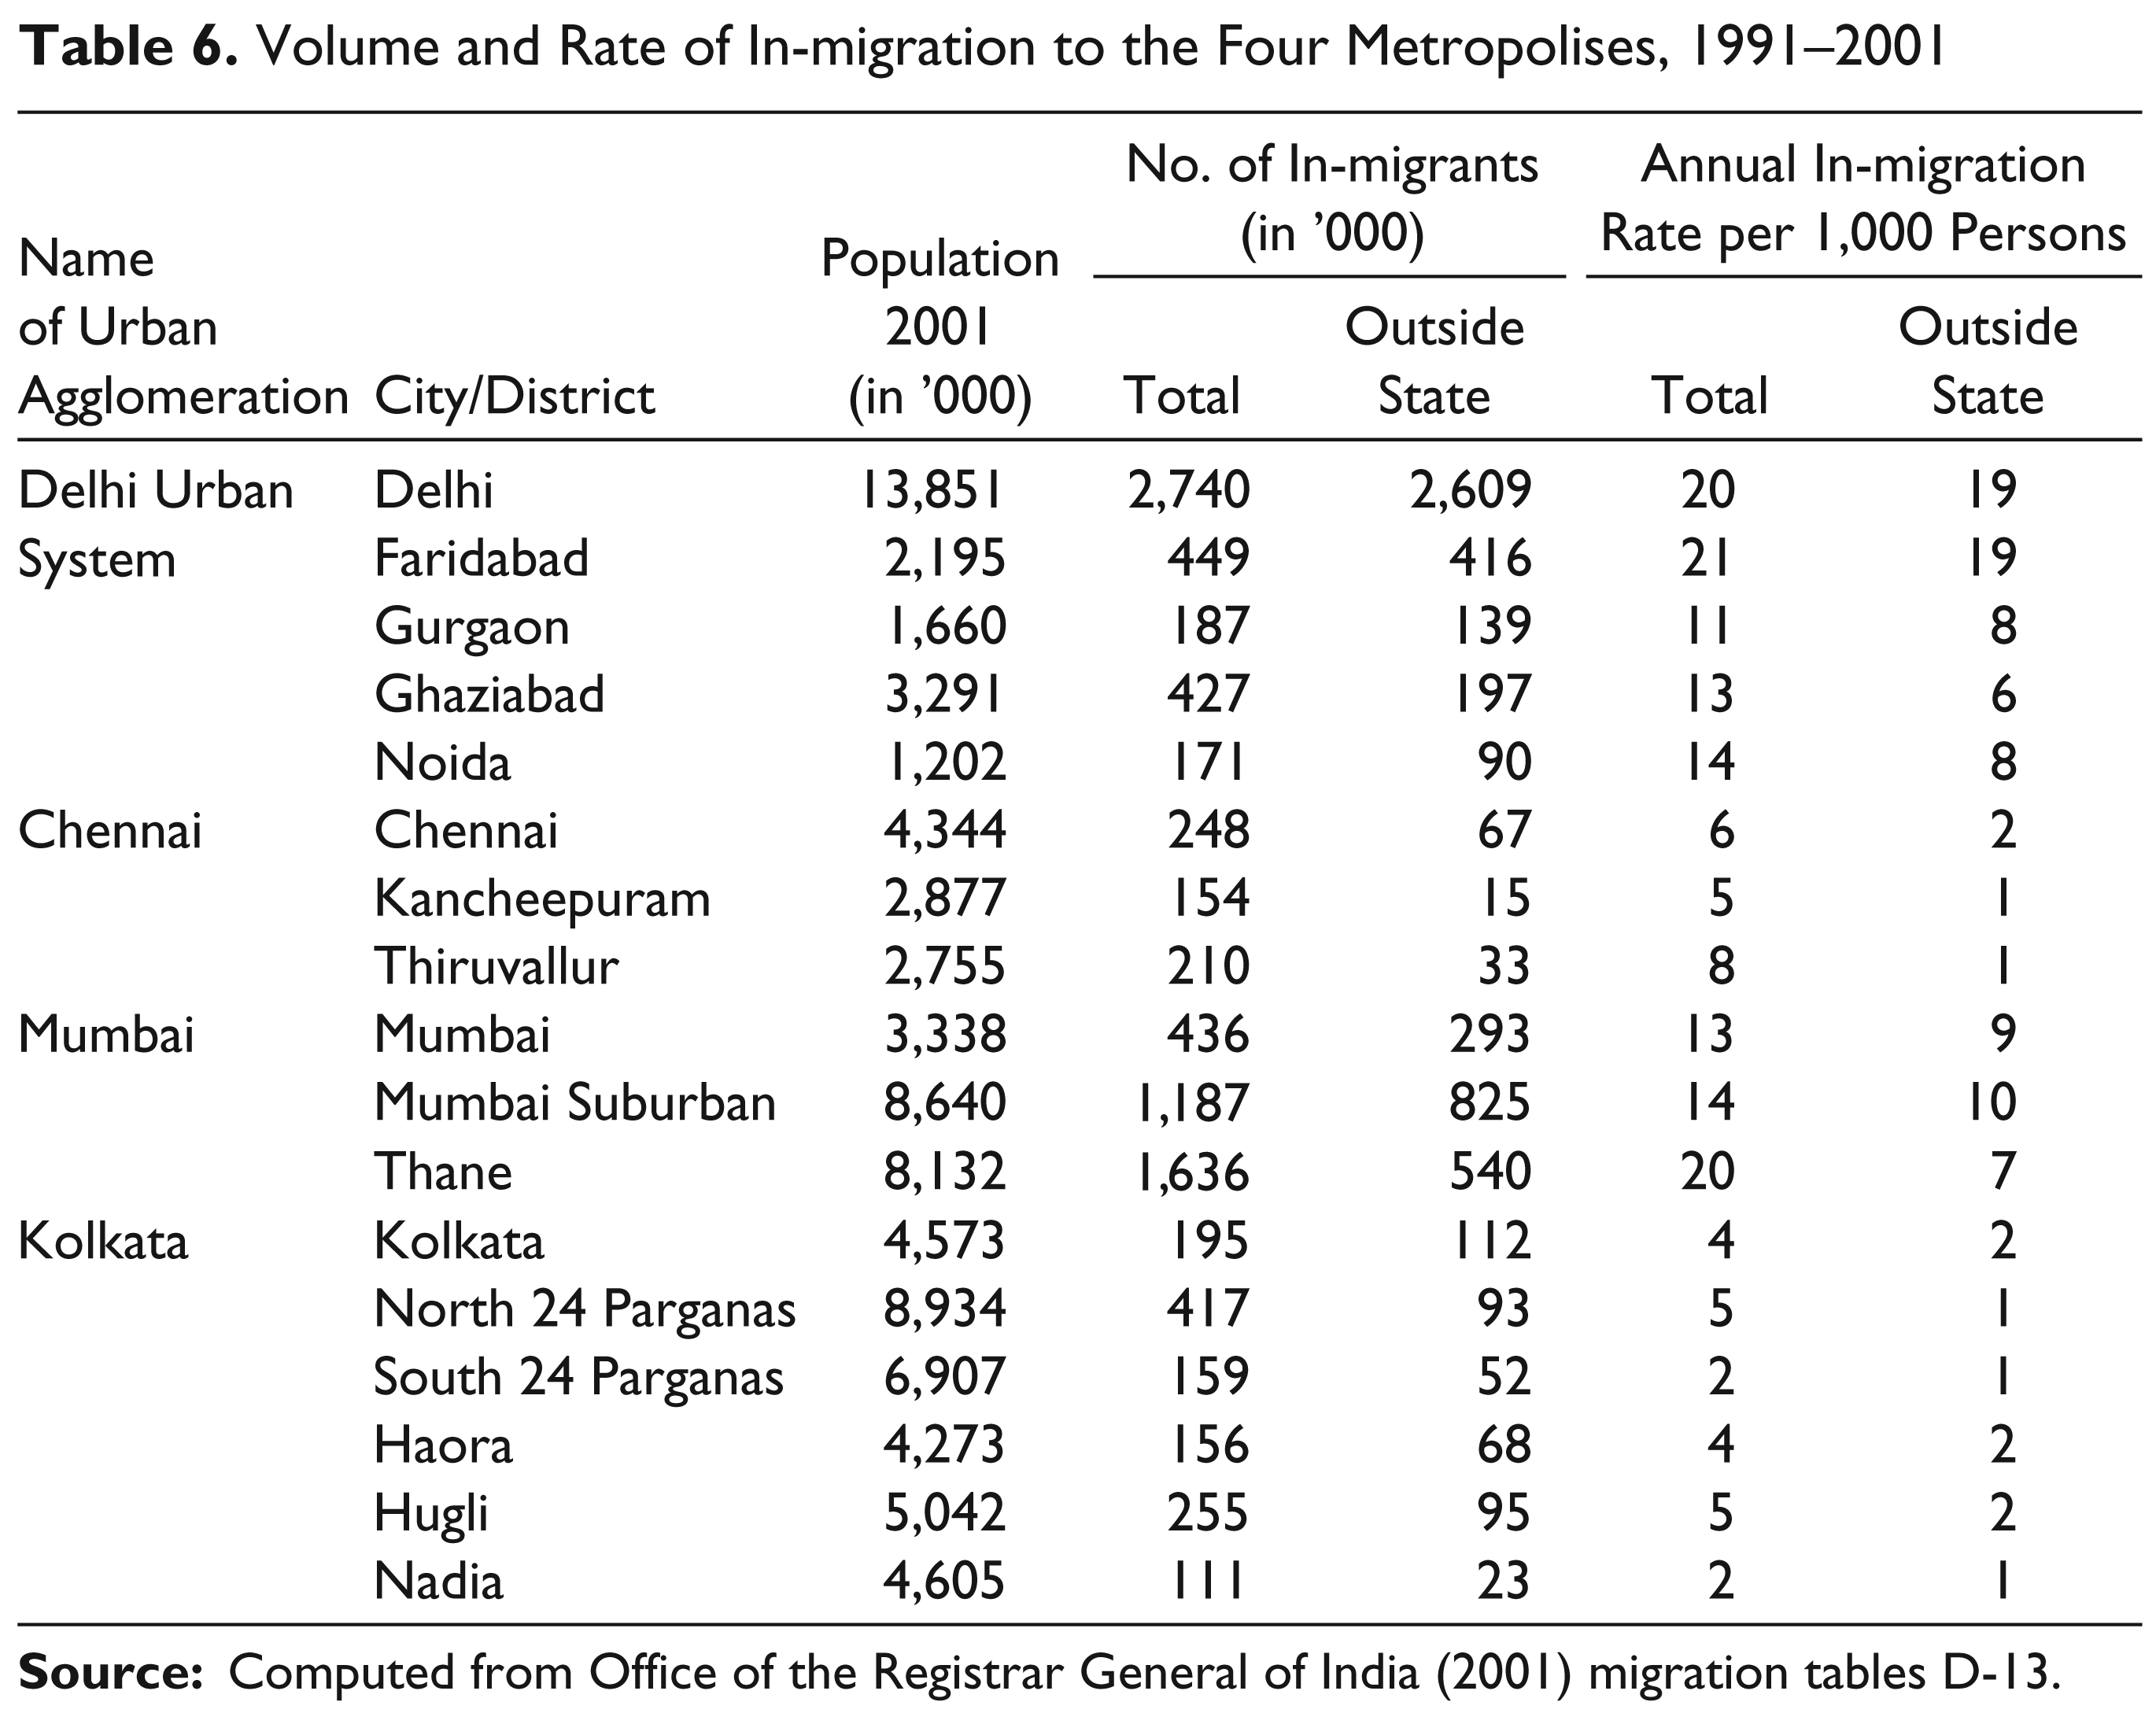
In case of MUA, the peripheral district of Thane has reported to have an annual in-migration rate of 20 persons per 1,000 population followed by 14 persons in the Mumbai Suburban district. In the core district of Mumbai, out of the total of 0.44 million in-migrants, more than 67 per cent are coming from outside the state of Maharashtra. On the other hand, if the city of Kolkata is taken into account, the annual in-migration rate in the core and the peripheral districts have been found to be very low in comparison to the other cities. Another typical feature of this particular UA is that it receives more migrants from other districts of West Bengal than from the other states of India (Table 6). Similar is the case of CUA where the more people have moved within the state. Further confirmation to the earlier fact is possible from a nippy glance at the annual in-migration rate from outside the state which is 2 per 1,000 for the core district of Chennai, 1 each for Kancheepuram and Thiruvallur.
The foregoing discussion quite likely brings forth the real nature of the cities in terms of the migrants’ choice of destination. While Delhi and Mumbai have vibrancy in terms of their urbanisation and the industrial pull, the cities of Kolkata and Chennai seem to have attained stagnancy and thereby fail to attract migrants from all over the nation. However, popular notions point out that the cities or the urban spaces have been very nimby towards the economically drippy ones. Therefore, to jettison such an idea at such a juncture may call for a closer look at the source of such migrants in the four baronial metropolises. The situation may be documented in Boxes 1 and 2.
Intercensal (1991–2001) In-migration Scenario in the Four Largest Metros of India
In
In
In
In
Intercensal (1991–2001) Out-migration Scenario in the Four Largest Metros of India
In
In
In
In
In general, as recorded in all the metros (Box 1), most of the in-migrations take place in shorter distance. Majority of the in-migrants are coming to the city from the districts of the same state. Even a closer look from the geographical perspective will reveal that within the state itself the migrants move out from mostly the neighbouring districts of the city. The intriguing nature of the city of Mumbai is further spelt out by the fact that close to half of the in-migrating population in the city come from distant states of Uttar Pradesh, West Bengal, Bihar, Gujarat, Rajasthan and Karnataka.
To talk of the second aspect of dynamism of the four major metropolises, a detailed analysis of the out-migrants choice of destination also needs to be looked at. Since the initial stage of development of the city, core experiences concentration of population and all sorts of activities. There is threshold and after that it would reach up to a position when no longer it can attract or even accommodate population. In such cases, the core declines and the peripheral zones experience increase in population at the expense of the declining core.
The out-migration scenario in the four metropolitan districts has also been found to be dominated by the short distance migration (Box 2). Population is found to move out mostly to districts lying in close proximity to the core district of the UA. For example, in case of Mumbai, 80 per cent of the out-migrating population has been found to have moved out from the core of Mumbai to other districts of Maharashtra mainly to Thane (73 per cent) and Pune (8 per cent). The adjacent state of Gujarat has been found to rank first in terms of attracting out-migrants from Mumbai. More than 60 per cent of Mumbai’s out-migrating population has been found in the five districts of Surat (23 per cent), Ahmedabad (16 per cent), Vadodra (15 per cent) and Valsad (8 per cent).
A similar feature is found when the out-migration from the Delhi urban system is considered. More than 46 per cent out-migrating population from Delhi have been found to go to some specific districts of Uttar Pradesh and Haryana. Uttar Pradesh has been estimated to attract 25 per cent of out-migrants from Delhi within which Ghaziabad and NOIDA are the pool of more than 74 per cent out-migrant. Haryana has reported to pull about 21 per cent of the out-migrating population from Delhi and the peripheral cities of Faridabad and Gurgaon are reportedly attracting more than 56 per cent of these out-migrating population.
Out of the total out-migrants (0.55 million) from Kolkata district (core of KUA) 55 per cent remained within West Bengal, 11 per cent went to Delhi and 10 per cent chose their destination to be Maharashtra. Interestingly enough, of these total out-migrants to Maharashtra 71 per cent have arrived in districts of MUA, namely, Mumbai Suburban, Thane and Mumbai (32 per cent, 26 per cent and 10 per cent, respectively) and 10 per cent has gone to Pune. Similarly, in Chennai, nearly 60 per cent of the out-migration has remained within the state of Tamil Nadu itself. Maharashtra, Karnataka and Andhra Pradesh are the other important states that have exerted a pull to those out-migrants of Chennai receiving around 8 per cent each of the total. Now let’s examine the districts chosen as destination by most of these out-migrants of Chennai. Majority of the out-migrants in Tamil Nadu have gone to Thiruvallur (41 per cent) and Kancheepuram (35 per cent) which are periphery of Chennai. In Maharashtra, they have mainly targeted districts of MUA (72 per cent) and Pune (13 per cent). In Karnataka, Bangalore houses 74 per cent of them and in Andhra Pradesh they gather in the district of Chittor (19 per cent), Nellore (18 per cent), Hyderabad (18 per cent) and Rangareddy (11 per cent). All the dominant movements are towards the large urban centres.
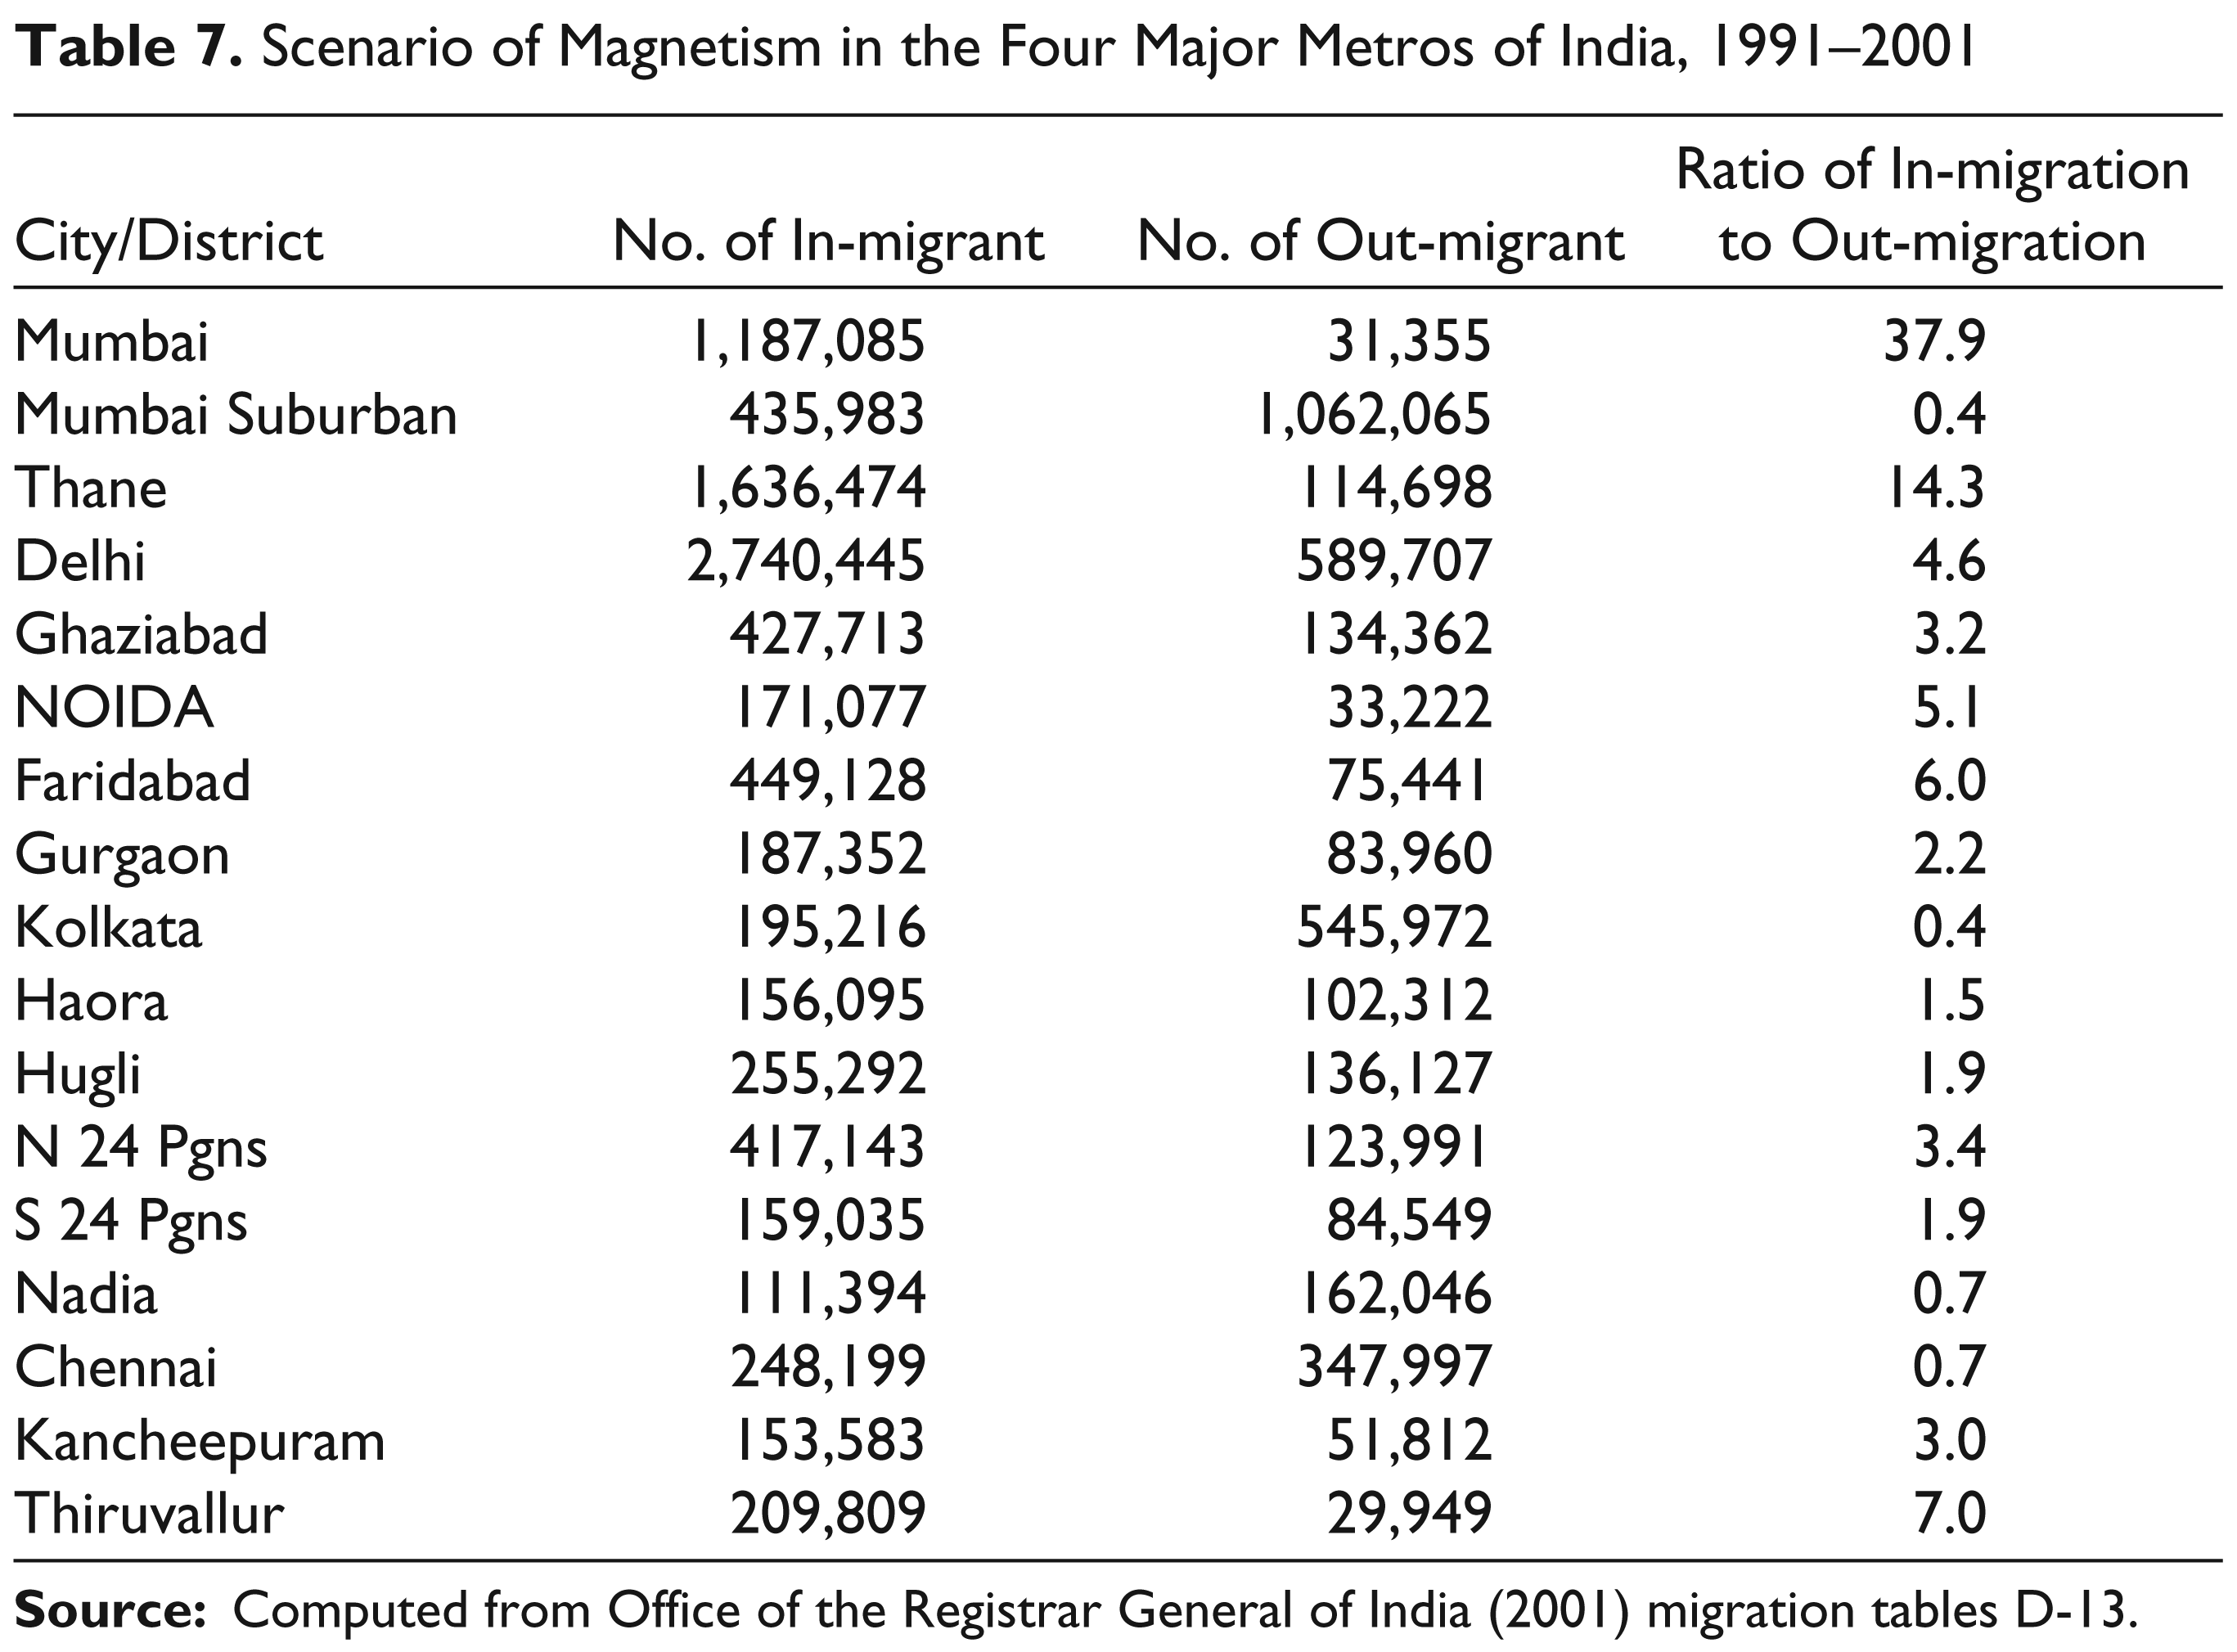
What needs attention at this juncture is to examine the alluring capacity of the districts containing India’s top metropolitan cities. A closer look at what has been coined as magnetism in the present study may reveal the fact that the districts of Mumbai and Delhi have remained on the crest of all the districts constituting the UA taken up for the study. The situation is elaborated in Table 7. Magnetism for the ease of understanding has been computed as the ratio of in-migration to out-migration render to be higher in cases where attracting force of in-migration exceeds the abominable force of out-migration. The vibrancy of the fully urbanised core of Mumbai district is reflected in the fact that its magnetism has been close to 38 meaning that the strength of in-migration stream is 38 times higher than of its counter steam of out-migrants and this figure in its periphery of Thane is 14. Unlike other parts of Mumbai UA, Mumbai Suburban district has shown a negative magnetism (0.4) where more out flows of migration are occurring than inflows. These figures for the other metros are far below from Mumbai. More than five times stronger in-migration stream than out-migration are recorded in Thiruvallur (7) of Chennai, Faridabad (6) and NOIDA (5.1) of Delhi. The core of Delhi has strength of magnetism of 4.6 while the core of the other two metros of Kolkata and Chennai show negative magnetism by figuring the values as 0.4 and 0.7, respectively. In opposition to the core, the peripheral areas of Kolkata and Chennai show positive magnetism.
Scenario of Magnetism in the Four Major Metros of India, 1991–2001
For regulating the uncontrolled movement of population and shaping the desired pattern of urban development, India does not have any comprehensive internal migration policy till date, apart from the Constitution guaranteeing the freedom of movement (Article 19). For a vast country like India, measures to divert population need to be well coordinated with socio-economic and demographic dynamism. For example, population migration is greatly linked with the phenomenon of urbanisation. Most of the urban centres developed with increasing activities towards the core. With the progress of time, there has been a growing concern of the environment and land use pattern in developing countries (particularly since 1980s onwards; United Nations, 2001). This has prompted planners to shift many of the industrial and manufacturing units far away from the city core. We find in the 2nd Five Year Plan deliberate efforts were taken on the part of the Government of India to integrate the geographical distribution of population with the economic activities performed so that the pressure on land could be equitably distributed (Bhusan, 2010). Further, the Integrated Development of Small and Medium Towns (IDSMT) were taken up as a part of the 6th FYP to ensure the holistic development of the suburban systems in terms of population distribution, reducing congestion in the city core and ensuring access to amenities by one and all. The new millennium saw the conversion of the IDSMT into the Jawaharlal Nehru National Urban Renewal Mission (JnNURM) in 2005 to ensure city development plans and leverage funds to generate and maintain urban infrastructure in selected mission cities. Several programmes had been taken up from time to time to develop the city core as well as the periphery like the Environmental Improvement of Urban Slums (EIUS), provision of Urban Basic Services (UBS), phases of Slum Improvement Programme (SIP), etc. but have been of least effect in freeing the city core from the maladies of population pressure (Kundu, 1993: 136–37). In response to all these policy measures taken up during the various plan periods, along with the effect of social network there has been a huge relocation of migrant population towards periphery.
Conclusion
It is evident that the volume and rate of population movement in recent years have witnessed a shift towards the periphery of the major cities and towns. Simultaneous to that, in all the four major metropolitan towns of India, the natural increase rates are found to be lower in the core than in the periphery. The peripheral districts still report to have a very high natural increase rate. Urbanisation, the sense in which we consider it in the present study is a direct outcome of the industrialisation and urban dispersal from core to periphery a result of increase in transport efficiency. The patterns of immigrants in the metros show that contributing districts and states are limited in number. These districts are either peripheral districts of the metros or the better developed and more urbanised districts of the particular states. Contribution of in-migrants in metros from poorly developed districts of the country is minimal. The districts receiving out-migrants from the metros are also located largely in the periphery of the metros and districts with large urban centres in some particular states of the country. Here also destination districts are limited in number and limited to the better developed districts of the country. The incidence of population movement among the limited number of districts is perhaps because of the presence of cumulative social networking in those districts.
The question still remains regarding the composition of the migrating population as to whether they are the economically deprived ones who could not manage a living in the urbanised core or are they some better economically affiliated groups. There is no denying that all the peripheries of these large metros are undergoing a huge change by the process of gentrification. There is a behemoth investment of capital in real estate during neoliberal period. Most of the destinations of these investments are the well-connected lucrative peripheral areas of large metros. Construction is a booming industry which is sharing a large proportion of GDP and urban labour employment. Definitely it modifies the pattern of distribution of population within the metropolitan areas. Indian urbanisation cannot be compared much with the western experience. Most of the colonial cities in India have dominated both in the pre Independence and the post Independence period. However, in the recent ages with the relative concentration of the city core, new proposals are coming up with public private partnership (PPP) to develop the peripheral areas. If the example of Kolkata is taken up, the peripheral zones starting from Dumdum in the north, Rajarhat, Barasat and Madhyamgram in the northeast, new Garia, Sonarpur, Baruipur in the south have been taken up for real estate development. Practical field experience illustrates that the housings developed at these sites have been opted to be occupied mostly by the economically affluent groups. In the case of periphery of Delhi, the spectacular development in Gurgaon, NOIDA not only reorient the economics of scope by locating the sites for producer services but also endow housing of classified categories of people in these zones. The Delhi Master Plan of 2021 approves five zones for new residential purposes and locating high-end economic activities towards the fringe areas of NCT Delhi (Ministry of Urban Development, Delhi Division, 2007). It is almost certain that majority of the persons, who can afford, from the core will be moving out to those sumptuous areas. It might be the fact that the better off people of the core of the large metros has set flows of movement towards periphery and the flows are expected to be stronger in this particular path of urban development. It is true that redevelopment of core is displacing some marginalised sections, but their volume perhaps is much lower compared with the voluntary movement of the better off.
The study has shown that out of the four metros, Delhi and Mumbai are showing greater dynamism than Kolkata and Chennai. The volume of in-migrants in Delhi and Mumbai are many times greater than the other two metros. All the metros have experienced decline in industry located in and around the core. In the era of globalisation and post-industrial capitalism, Delhi and Mumbai have created greater space for development of new industries and producer services required in the new global economic order. Kolkata and Chennai dawdle far behind. Mumbai and Delhi are in the leading positions in terms of attracting a major share of the foreign capital invested in different cities of India. Most of the transnational corporations present in India are managing their business and functions from offices in Mumbai and Delhi. Again Mumbai and Delhi are found to act as windows by connecting important global cities of different continents with India through air networks. Thereby, these two metros have emerged as the most vibrant ones creating huge opportunities of employment for the people of all levels of skills. Practically, coalescence of plethora of this economic magnetism in urban spaces of Delhi and Mumbai were emblazoned in the characteristic fashion of migrants’ choice of destination and dynamism of population growth.