
Abstract
This research project explores the level of education among various economic and social groups by examining the literacy rate, enrollment rate and the attainment of education in Sekha village located in Ludhiana district of Punjab. Wide levels of disparity were seen among groups and classes in accessing education, right from the primary level to the higher level. Differences were evident in the expenditure on education incurred by parents, in the average year of schooling, expected years of schooling and even in the Human Development Index of the area. It has been argued that structural inequalities inherent in a village further perpetuate inequalities in education. More than 70 years after Independence, the village surveyed showed that not only did inequalities remain in a village's class, caste and gender structures but they manifested themselves in education, too. Nation-wide the literacy rate has improved in India, but inequalities spanning generations have remained.
After the Second World War, the establishment of a comprehensive public education system was an important the socio-political agenda of most newly formed democratic governments that emerged from the erstwhile colonies of the imperial world. India too wanted to introduce a public education system for its people and had for the most part followed the education policy introduced by the British. During its colonial rule, the British had from the 1820s onwards fostered in India a western-style of education. It was then when, for example, the Elphinstone Institute, a great nursery for future nationalists, was founded in Bombay (Chamberlain, 1985).
After 1947, the Constitution of India resolved that as a Sovereign, Socialist, Secular, Democratic Republic, the nation’s goal was to reduce socio-economic inequality by providing equal opportunities to every citizen irrespective of class, caste, gender, ethnicity and religion. A widespread and influential view held that the education was a crucial part of this general mandate. It would foster greater equality, extending thereby an equality of opportunity (Hansen, 2001). The spread of education was conceived as a tool for the socio-economic, cultural and political development of the people helping them to understand society, promote rational thinking and a scientific temper. This was to be done by ensuring that subjects like the social sciences, languages, anthropology, music, the liberal arts, science and technology were an integral part of the syllabus of all schools and higher education institutes.
Through various policy measures, the state played a very crucial role in setting up physical infrastructure to promote education, even providing meals in the most remote rural schools in the country. With the spread of quality education, there was a feeling that the gap between high and low income groups would be narrowed by opening the door to opportunities. Also, the wide gap in accessing education by various religious, caste and social groups would also be narrowed. Often the state and the political parties publicised their concern about education; giving the issue space in their election manifestos and public rallies, talking of growing literacy rates, the increase in the average years of schooling because of the spread of educational institutions that had occurred irrespective of rural–urban, rich–poor, caste and gender inequalities. Indeed a plethora of research on the growth of education and secondary data produced by different government departments, government and non-government agencies emphasised how literacy rates had increased.
It could be argued then the India had witnessed a significant improvement in the area of education over the past 70 years. Indeed some strong facts supported this argument: In 1960, less than one-third of India’s villages were located within 10 km of a secondary school, now almost 90 per cent of the country’s villages had access to, at least one secondary school (Foster & Rosenzweig, 2011).
Despite these impressive statistics, expanding educational facilities was a huge challenge. By Independence, India inherited a largely illiterate population and faced a severe lack of basic physical infrastructure connected to education. In the first post-Independence census in 1951, only 9 per cent of women and 27 per cent of men were literate (Census of India, 1951, cited in Kingdon, 2007). In 1947, the literacy rate was an abysmal 18 per cent and glaring differences among the country’s various states also existed (Singh, Monga, & Kaur, 2015). In Punjab, the literacy rate was 76.7 per cent according to the 2011 Census, up from the 33.67 per cent in 1971 (Government of Punjab, 2011), which could be explained by the growth of a number of educational institutions during this time. In Punjab, the total number of schools was 3,819 in 1947–1948 which rose to 16,580 in 1990–1991 and the number reached 23,399 in 2010–2011 (Singh et al., 2015).
Despite this somewhat improved statistical progress, The Probe Team (1998) found that India fared poorly when compared to regions that were conventionally considered ‘backward’: Female literacy rate was lower in India than in sub-Saharan Africa. From the point of view of quality education, the student–teacher ratio was also not inadequate and there were wide differences between states in accessing public schools. Researchers noted that wide economic and social inequalities and rigid hierarchies persisted across states, regions and villages in India.
To analyse and discuss the growth or the lack of growth of the Indian education system, it is necessary to understand the country’s plurality of economy and society. As Rubinstein and Stoneman (1972) argued in the context of Britain’s educational canvas, it was hierarchal, elitist, establishmentarian, static, closed and anti-democratic. The very same attributes that were embodied in British society were also traits evident in India: wide income gaps, social hierarchy, gender differences, rural and urban divide, and additionally ‘forward caste’ and ‘backward caste’ divided across regions. Brown (1988) pointed out that all societies experienced stratification but the degree of hierarchy was not the same in every society. Less hierarchical societies were more open and inclusive, with more avenues and scope for social mobility, whereas rigidly hierarchical societies were closed and conservative, in which only those from privileged families or castes were able to get ahead. Many critics argued that the spread of the education played a fundamental role in reshaping society and economy in a democratic manner. This was again a question of distribution, availability, opportunity and reach of services supplied by the state. For example, if people located in rural areas wanted to access secondary or higher education institutes, they would have to travel to the nearest rural town or big city for which there should be easy transportation facilities. However, people who lived in urban area had easier access to education institutions. However, the urban poor did not have the same level of opportunity as the middle and upper strata of urban society did. Hence, the rural and urban poor paid a higher price to receive education even though the Constitution of India said that the nation should offer every citizen an ‘equal opportunity’ to enrol in popular or specialised educational institutions.
There are two main views expressed on the role and expansion of education. First, investment in education played an important role in increasing productivity, efficiency, economic growth, and hence, there was a positive relationship between education and economic development. Second, education had the potential to build a society with a more egalitarian, democratic and just order. True, there was an enormous preoccupation in developing countries on essential questions of livelihood, even the right to life of vast populations. But it was often forgotten that the right to education was an integral part of the same right.
The uneven distribution of basic services and amenities which were provided by the state, especially in the area of education, deserved particular attention because society was hierarchal and segregated in nature. The unequal distribution seemed to be arbitrary due to economic and social inequalities that existed in the country over a long period of time. Similarly, traditional social inequalities, based on notions of pollution and impurity that governed caste relations, were transformed into class inequalities because of different levels of educational attainments (Desai & Thorat, 2012). Economic and cultural inequalities in people led to an imbalance in education at various levels. According to Beteille (2008), where access to education was concerned, the political leadership had given more attention in recent years to the redressal of social disparities among communities than towards the reduction of economic inequalities among individuals. Economic disparities were perhaps the most pernicious, resulting in the perpetuating of a cycle of inequality across generations (Desai & Thorat, 2012).
By attempting to understand the economic and social structure of a village in Punjab, believed to one of the more prosperous states of India, this article has endeavoured to understand its education system. This study was a micro-empirical study looking at prevailing education system at the level of a village’s economy.
One could argue that typically a Punjab village was always segmented with respect to its economic and social class (Sharma, Tiwana, & Shergill, 2014). There was a commonly held belief that different economic, social groups and gender groups accessed educational opportunities unequally especially in a hierarchal society as it existed in a village. There might be many reasons for this—economic, social, cultural and historical. The main questions raised in this article were, first, were various social and economic classes educated equally because of the availability of equal educational opportunities and were opportunities of education increasing? Second, if this wasn’t so, why did inequalities persist and what were the reasons behind existing inequalities? The argument behind the first question was that social and economic categories mainly determined income levels of a household in villages in Punjab. The second query was based on two arguments. The first one was that education attainment depended on the productive asset holding of the concerned household. The second was that households which do not hold agricultural land nor follow viable self-employment activities and employment do not have equal opportunities to access education, at whatever level. Could literacy and education attainment then play a role in reducing structural inequalities among the masses? Economists, sociologists, demographers and politicians have debated this question over a long time. Our aim was to understand two questions regarding the general notion of expansion of education. We argued that these patterns reflected the education system in the sample village.
Hypothesis 1. There were inequalities in attaining education cutting across economic and social classes at the household level in the village.
Hypothesis 2. The rate of literacy rate and education attainment played a role in reducing structural inequalities.
To understand the prevailing national education system, and consider its colonial background and the current neoliberal setting, this paper is by examining a micro picture of a village education system trying to understand a giant production system which we believe is shaped by a new world economic order.
This article was based on fieldwork done in Sekha village by the authors during June–July 2013 and during many visits undertaken over the year. The empirical evidence was based on a census survey which covered 197 households in the village. Sekha village is located in Ludhiana district, the first district of Punjab where the Intensive Agriculture District Programme was launched in 1960–1961. This district was also known as a highly developed district. This was why this village from a highly developed district was chosen to examine the education status in various social and economic groups. The village is located 15 km away from the tehsil headquarter and 32 km away from Ludhiana district's headquarters. The nearest town was Maloud which lies 3 km away and had a pucca road. The village had a post office, a Primary Health Centre, and a primary and high school. Of the 197 households, 91 belonged to the general category, 23 to the Backward Caste category and 83 belonged to the Scheduled Caste category. Sekha was relatively a small village with a total population of 1,086 (556 males and 530 females). General Caste and Backward Caste categories constituted 60 per cent of the total population. The percentage share of the Scheduled Caste population was 40 per cent which was very high when compared to the Scheduled Caste population at the state-level which was 28 per cent.
This article has been divided into three sections. The first section focusses on a brief introduction which outlines the reason why we have looked at a village’s education system; the second, focusses on an empirical verification based on a field survey and conversations with respondents; and the third outlines our broad conclusions.
Empirical Evidence
In this section, we look at tracing the literacy rate; the literacy of a village’s population and at the education level of the village since 1934, the year when the oldest living man of the village was born. The other part dealt with the composition of school enrollment at the primary, middle and high education levels; secondary and degree levels across economic categories and social class; share of school enrollment in government, private unaided and private affiliated schools across categories and parent’s preference regarding admissions of their wards. The per capita expenditure on education and the male–female share on education expenditure with regard to inter- and intra-economic and social classes is analysed. Also, the mean years of schooling (MYS), expected years of schooling (EYS) and Human Development Index (HDI) across social classes have been calculated.
Literacy Rate by Social and Economic Class
Literacy rate as a measure is basically a rough scale of education attained by people who live in a particular geographical area. After 1947, the national education system improved because of policies that were enforced. The state of Punjab as compared to other states was relatively prosperous which was reflected in its average literacy rate.
It is clear from Table 1 that the literacy rate of the village was 78.63 per cent. The literacy rate of the male population was 81.83 per cent, more than that of female population at 75.28 per cent. The table presents a general phenomenon which was noticed in the study. The difference in the literacy rate of male and female population was very low in the general category and was the highest in the Scheduled Caste category, although the difference was low in all categories. We applied the chi-square test to see whether the difference among social groups in the case of the literacy rate was significant or not. The results showed that the calculated value was less than the table value at a 5 per cent level which meant there was no significant difference in the literacy rate among social groups.
Literacy Rate by Social Class
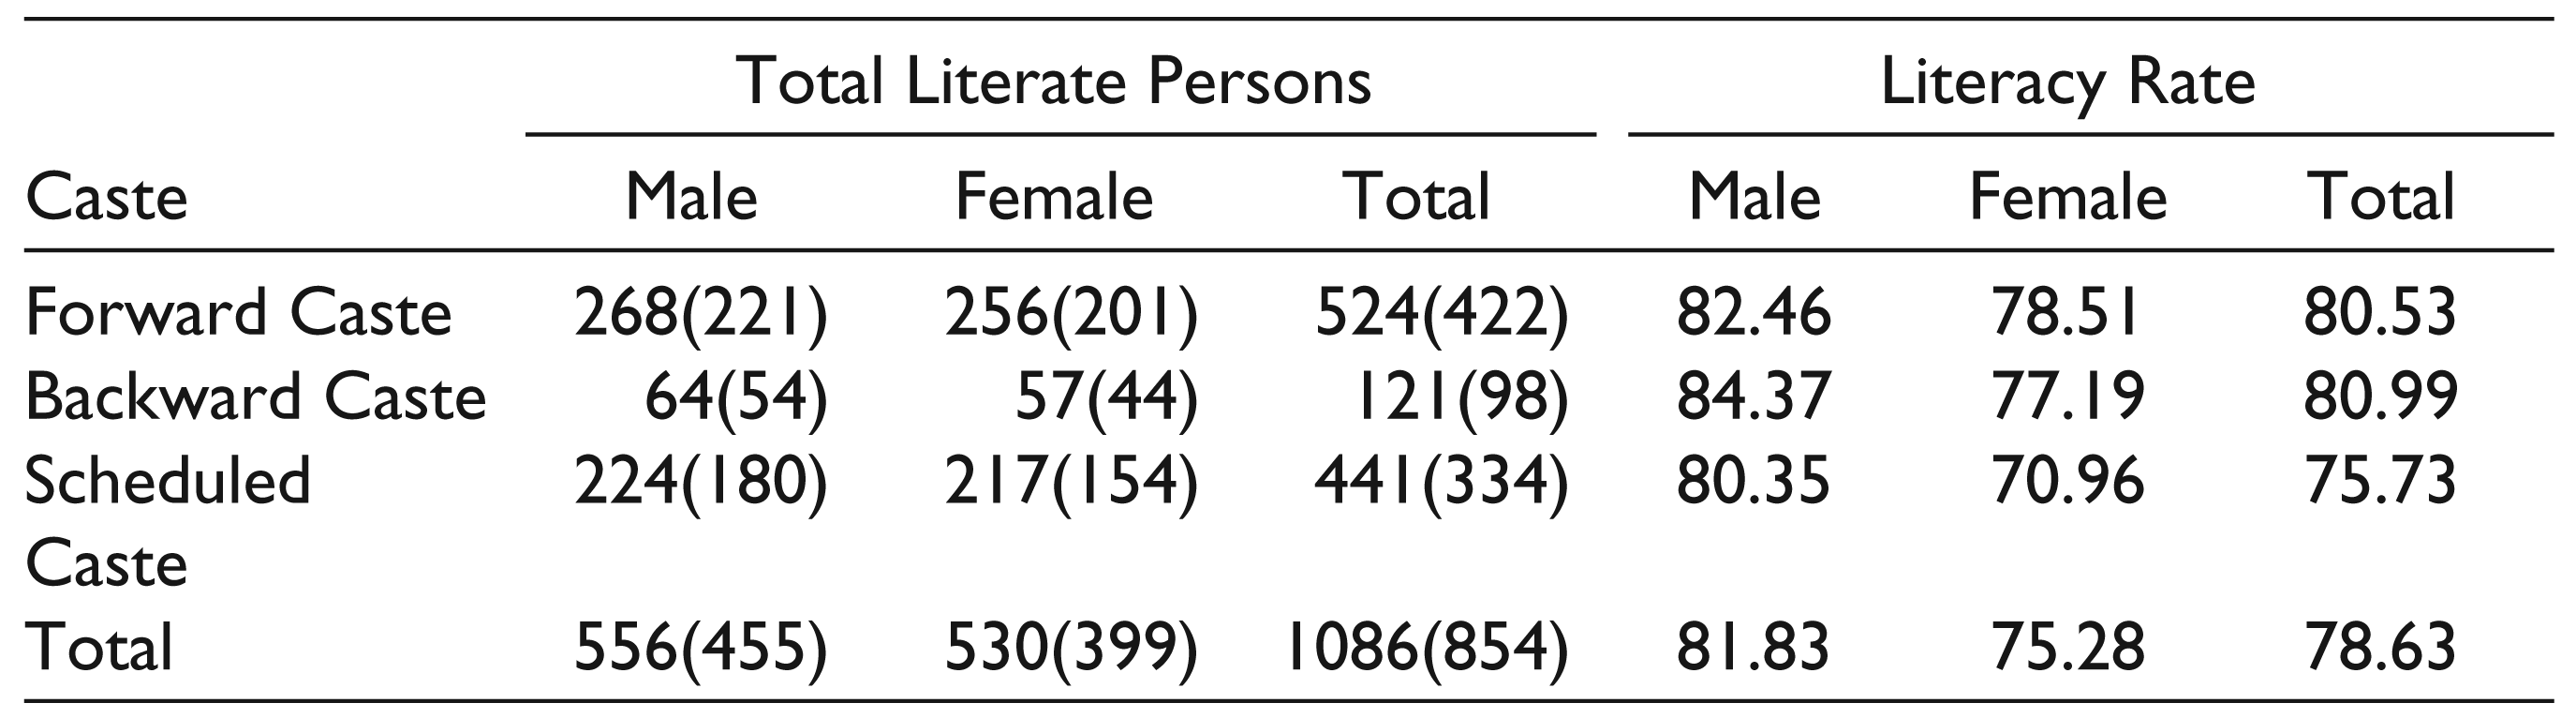
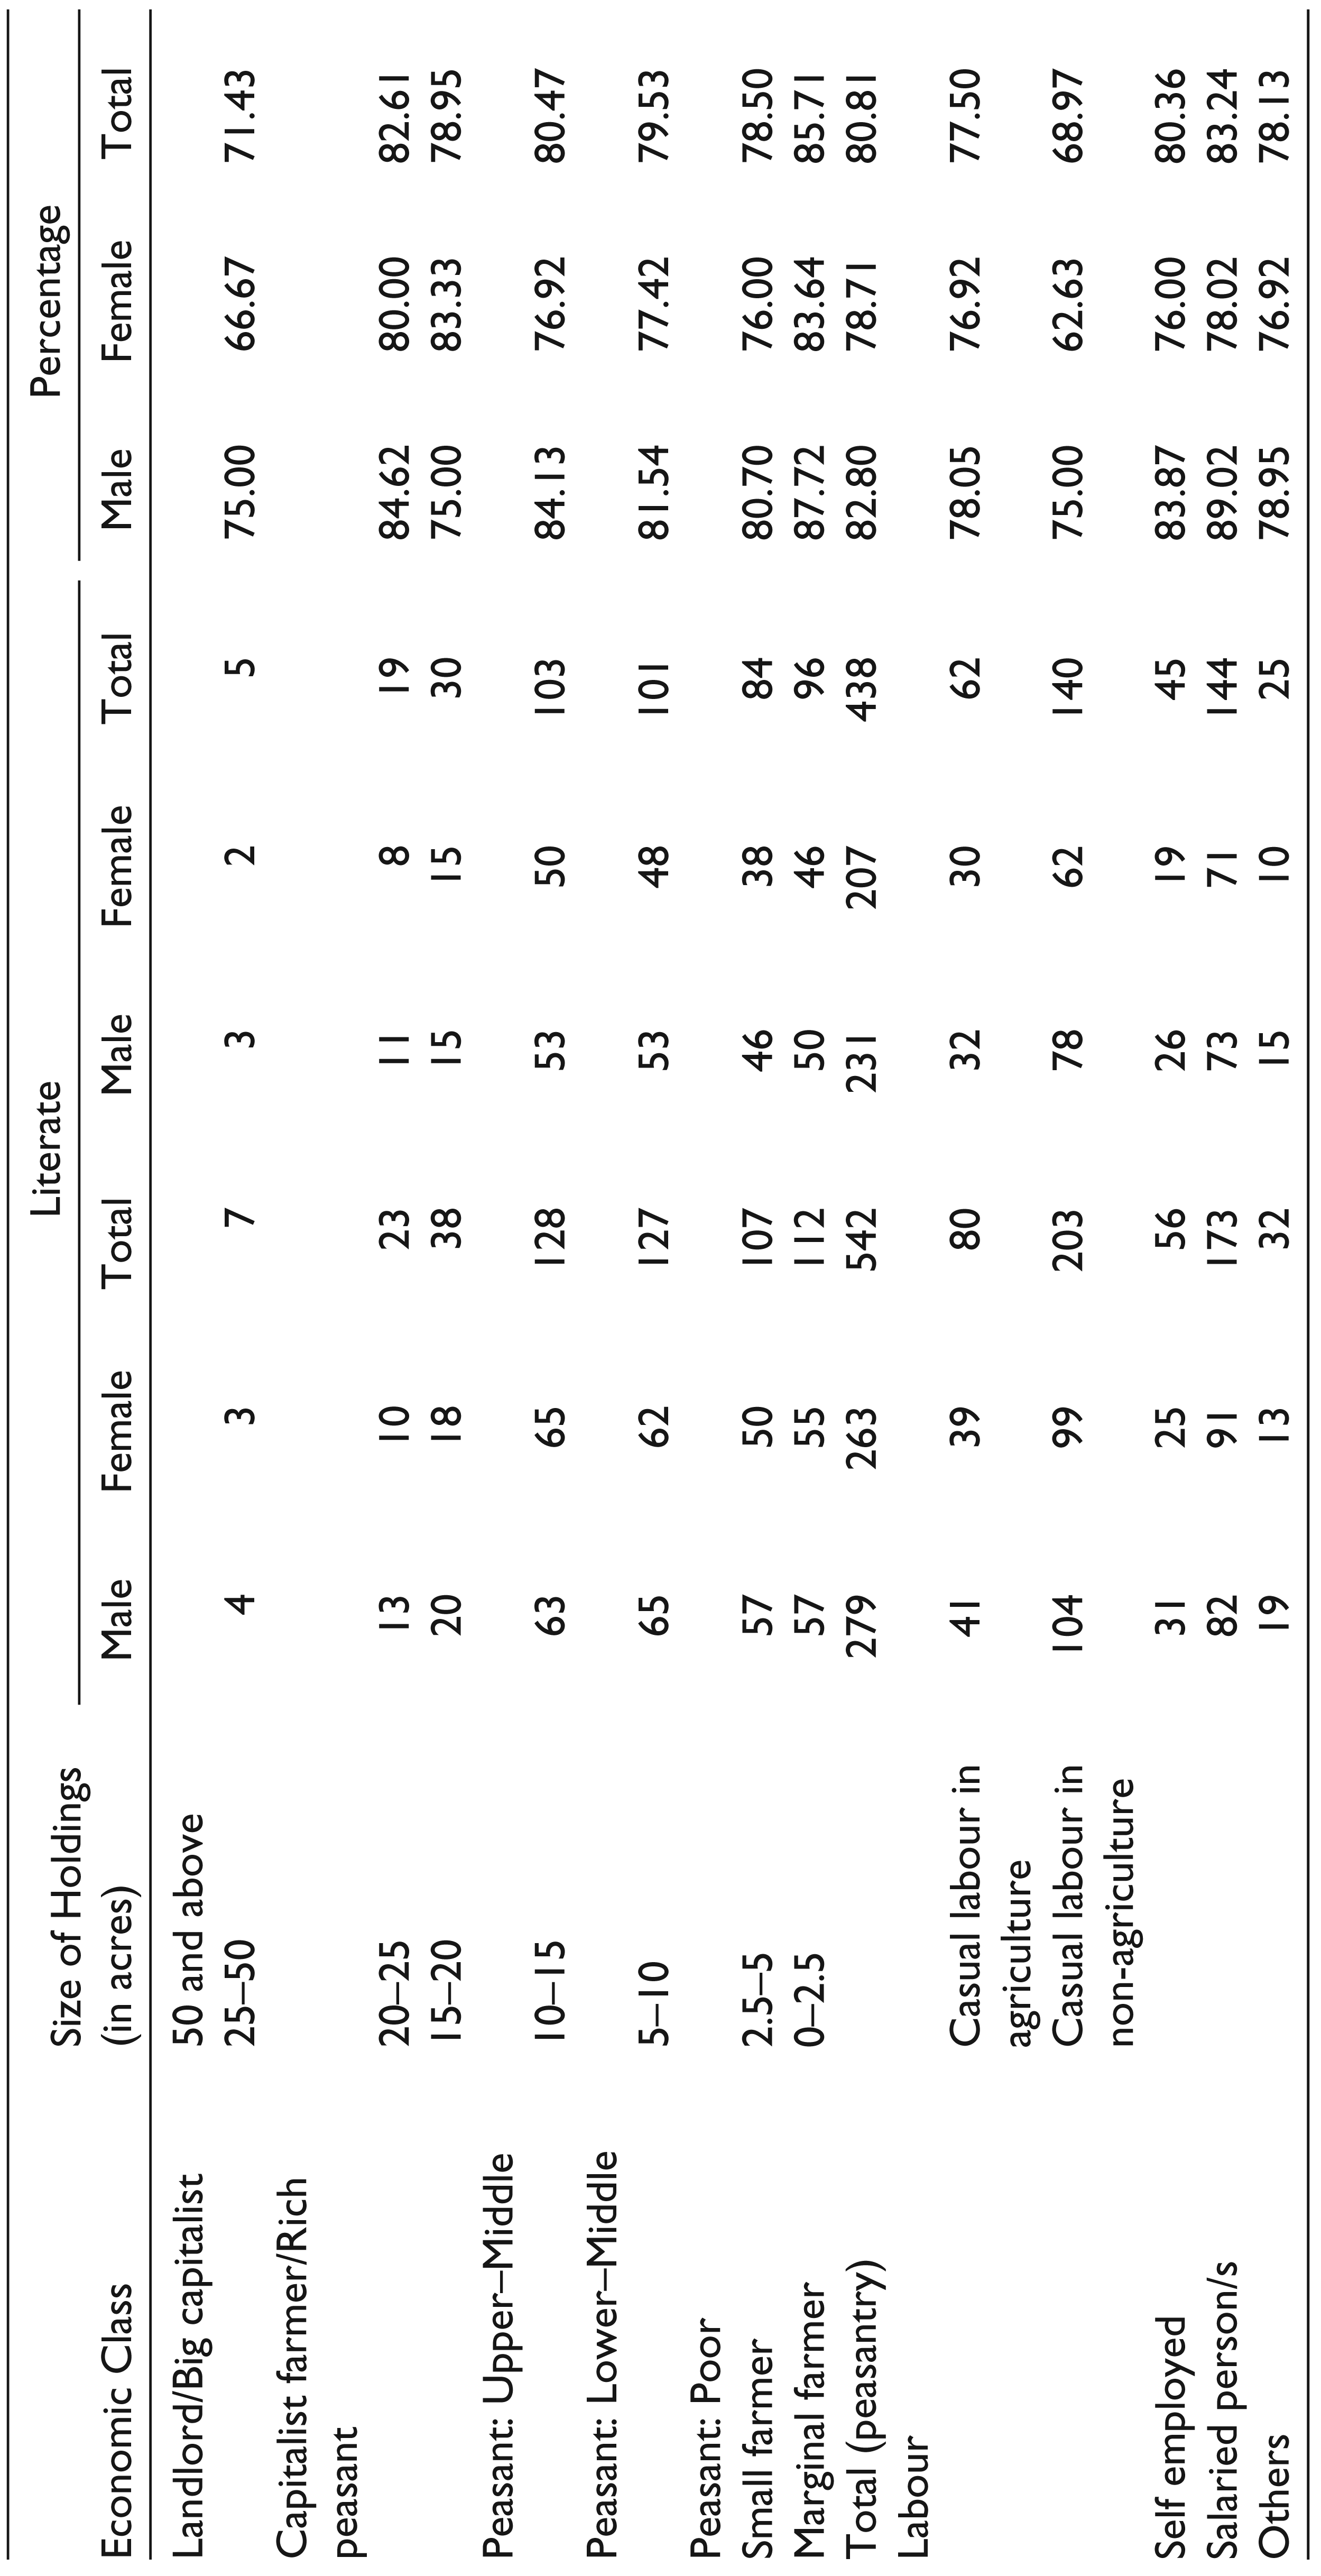
Table 1A reveals the literacy rate of various economic classes in the village. The lowest literacy rate (68 per cent) among social classes was found in the casual labour in the non-agricultural sector. The second lowest literacy rate (71 per cent) was noted amongst landlord/large capitalists. One could understand why the literacy rate was very low among the casual labour category. This economic class did not have any productive assets and was mainly dependent on its livelihood on daily wages. This could be understood in the context of their immediate needs; clearly education was not a priority. The literacy rate among marginal farmers (85 per cent) was the highest among all categories. This was quite surprising and quite inexplicable given that the literacy rate of salaried persons (83 per cent) and rich peasantry (82.6 per cent) was lower. But one possible explanation, as our field survey observations showed, was that since marginal farmers were being financially supported by relatives who migrated abroad and were relatively rich, they provided the money for the education of the school-going children. The literacy rate of all socio-economic classes, except casual labour in non-agriculture areas was higher than the literacy rate of Punjab. The male literacy rate was higher as compared to the female literacy rate among all socio-economic classes. The difference in the literacy rate of male and female population was highest in the casual labour in the non-agricultural sector and lowest in casual labour in agriculture. The highest male literacy rate was noticed in salaried persons and the lowest was in the landlord, rich peasant and casual labour in the non-agriculture category. Further, the male literacy rate was the same in casual labour in non-agriculture and rich peasants, landlords/big capitalists. The highest female literacy rate was noticed in marginal farmers and rich peasantry. However, the lowest female literacy rate was in casual labour in the non-agricultural class.
Literacy Rate by Economic Class
Tracing Literacy in Village’s Demography across Social Classes since 1952
There were no records available to trace the history and evolution of school education at the village level. At the time of our first study of the village, data were collected from people who had information about the village. These discussions indicated that in the early days before a school which was opened in 1952, the Pandit in the mandir and the Imam in the masjid used to provide informal and moral education. To trace education in the village’s demography, we collected data age-wise and ascertained levels of education among the total population of the village. This was of two types: first, students who were currently enrolled in schools, colleges and higher educational institutions; second, the remaining village residents from different age-groups, whether they were educated or not. Through data, we tried to explore education levels and progress in the literacy of people of different age groups looking at their gender, 1 economic and social class category. We divided the total population into eight different age groups––5–10 years, 11–20 years, 21–30 years, 31–40 years, 41–50 years, 51–60 years, 61–70 years and 71–80 years.
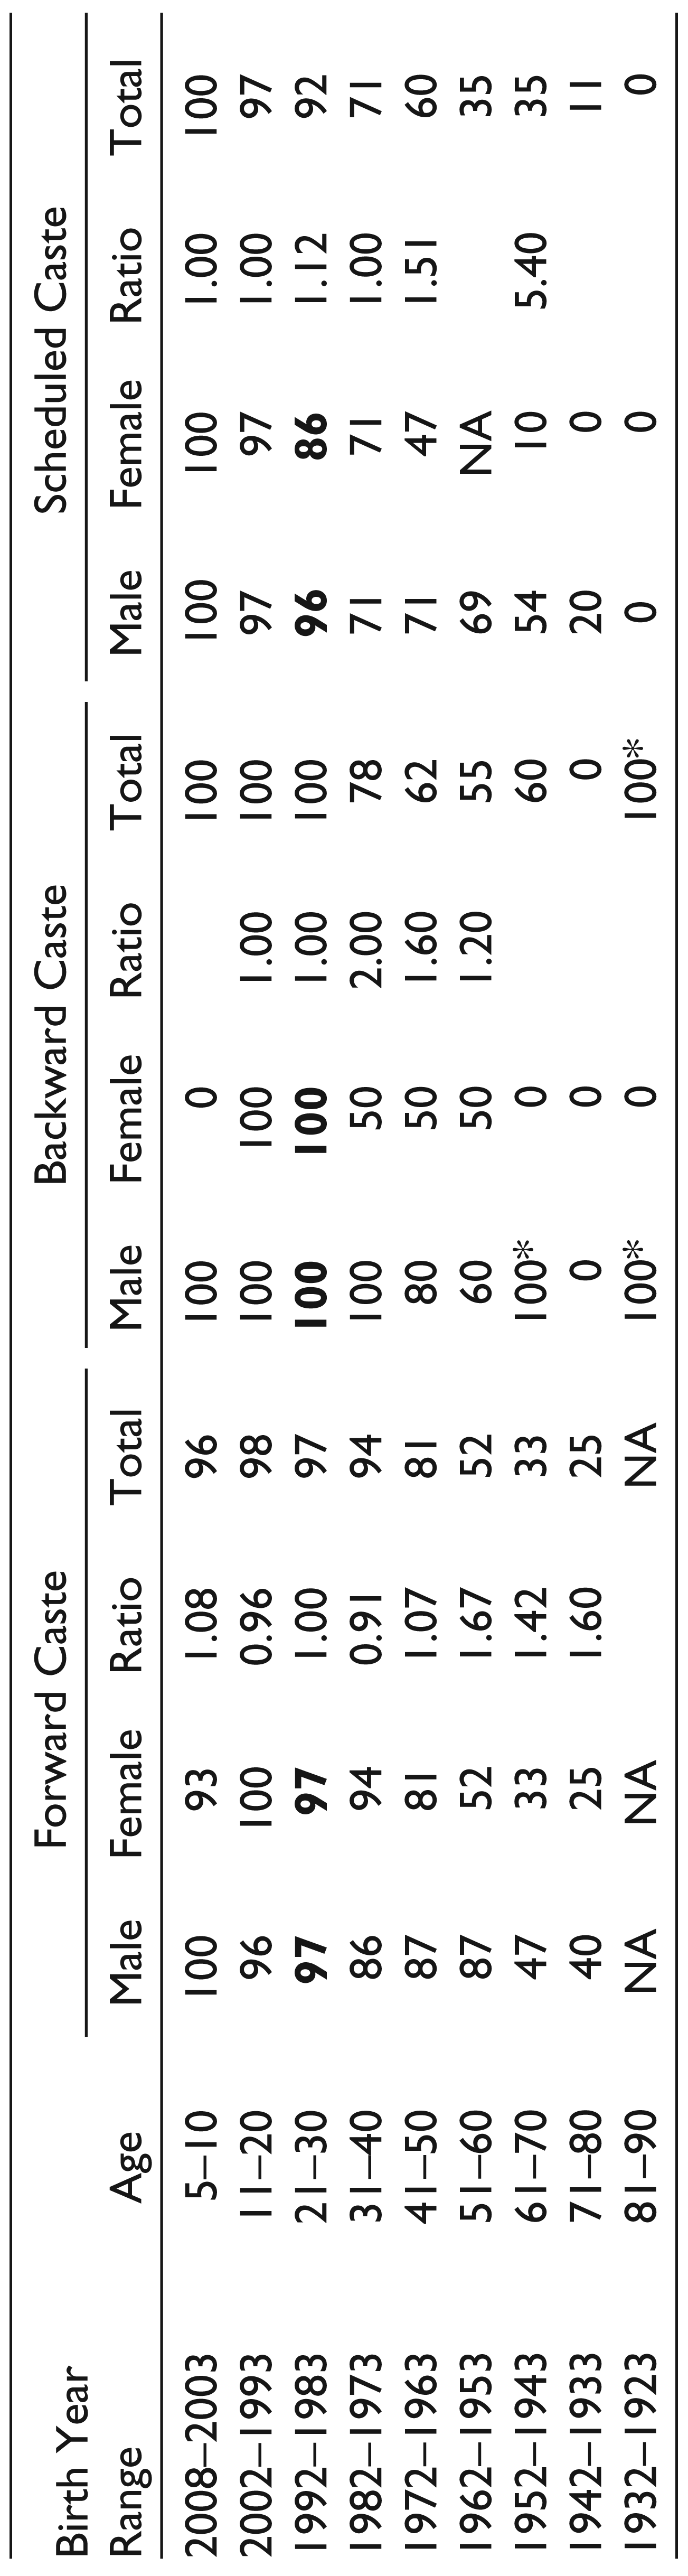
Table 2 shows that the literacy rate among the 80–70 age group was 11 per cent. It showed that from the 1953–1963 decade to the 1963–1973 decade there was an overall rise in the literacy rate cutting across social classes. The highest upward mobility was found in the case of the forward class (from 52% to 81%) while the backward caste category moved from 55 per cent to 62 per cent and Scheduled Caste category shifted upwards from 35 per cent to 60 per cent. During this period, the gender gap in literacy reduced sharply in the case of the forward caste (1.67 to 1.07 ratio) as compared to other two categories. These records recognised literacy inequalities across social classes and at the gender level. In the case of the Scheduled Caste category, the literacy rate was 71 per cent during the 1973–1983 decade. During the same period, the literacy rate of the backward castes was 78 per cent as compared to 94 per cent for forward castes. From 1983–1993 onwards, the gap reduced sharply across gender and social classes. Punjab was a state where differences in gender literacy levels reduced rapidly (Ramachandran, 2012). Nevertheless, these gaps revealed structural inequalities in the economy and the society of a village which facilitated an unending cycle of inequality that spanned generations.
Education Demography across Social Class
Parent’s Preference Regarding Nature of School: Social and Economic Class
The intention to analyse school enrollment cutting across economic categories and social class was to understand where children were going to school, to government schools or private schools. There was a general consensus that people who had the capacity to pay generally preferred private schools rather than government ones for their children. Our field survey observations endorsed this general view, too. But even with this preference parents did not seem to have information on schools per se: whether these were aided by the state, private trusts or religious bodies or were unaided; whether schools were affiliated to the state board or central board or not. Though private schools were mushrooming and preferred by the poor, there was no evidence that they provided better school infrastructure or even an improved quality of education (Kaur, 2017). Parents simply believed that private schools were better than government schools, where English was being taught and teachers were more hard working than government school teachers.
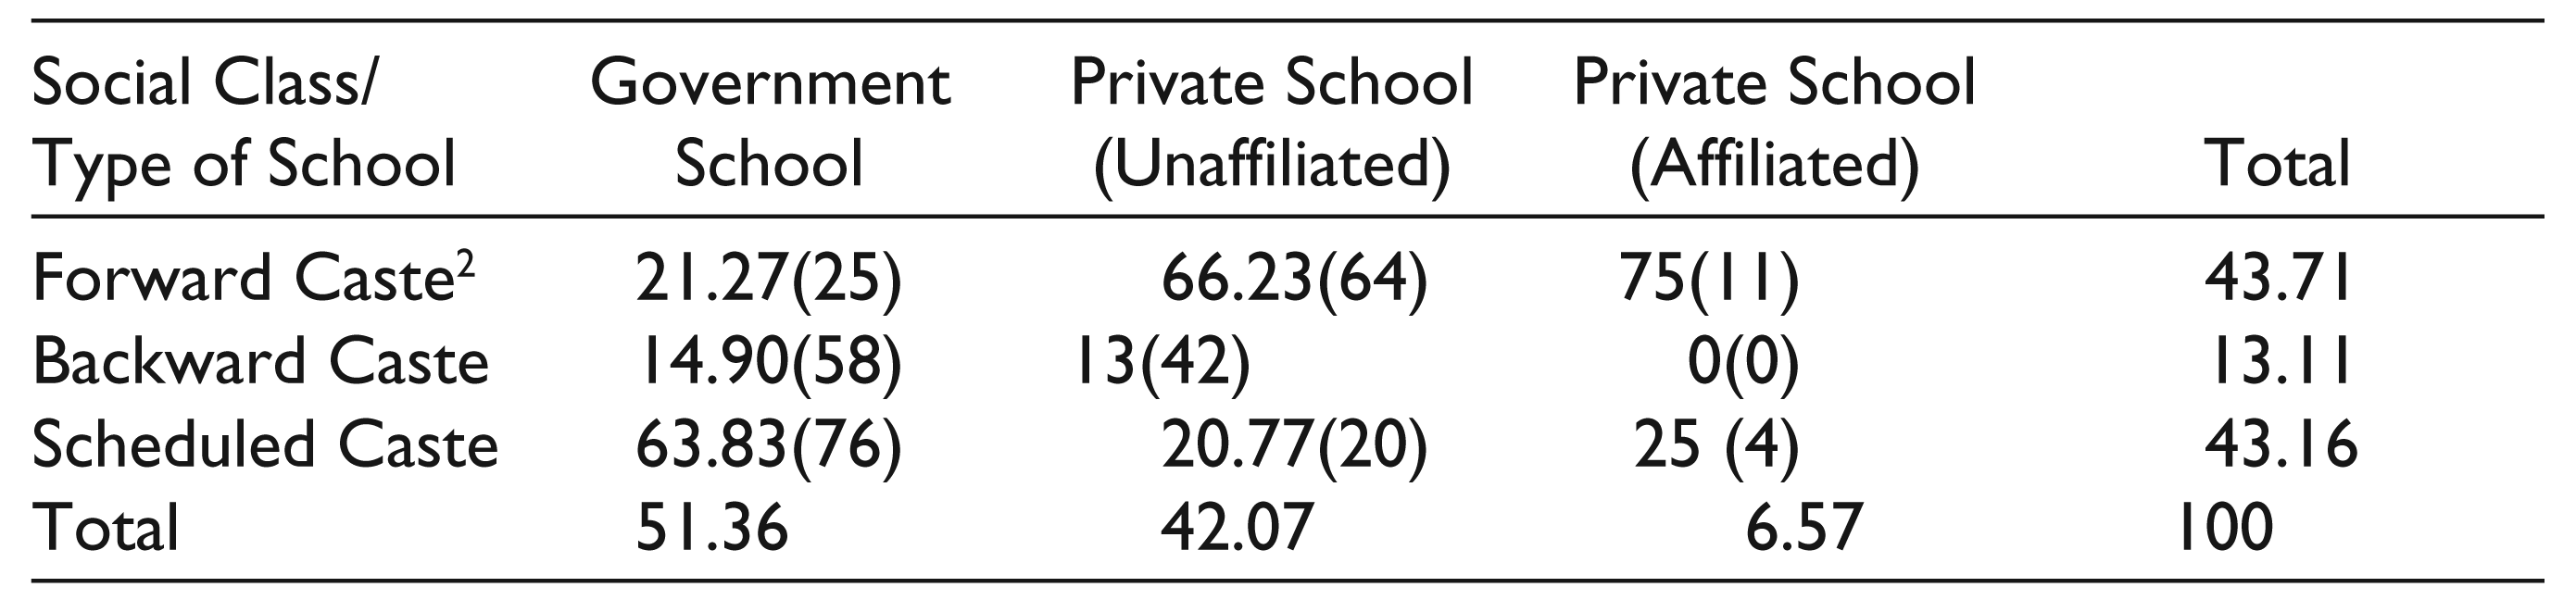
Table 3 shows that 64 per cent students belonging to the Scheduled Caste category were studying in government schools as compared to 21 per cent and 14 per cent belonging to the forward caste and backward caste respectively. In case of private affiliated schools, the share of enrollment of forward castes was higher––75 per cent as compared to just 25 per cent of Scheduled Caste students. In case of private unaided schools, the share of forward caste was relatively higher than that of backward caste and the Scheduled Caste category. Different views were evident: forward caste parents believed that there was a lack of crucial facilities in government schools––vacancies for teachers were high, there was a low number of classrooms, absence of toilets and drinking water. A majority of parents pointed out that earlier all the children living in the village used to get admissions in the village government school irrespective of their caste or economic class. But, as education gradually lost its priority in the state’s agenda and private schools opened up the state’s focus regarding public education started to diffuse. Given this milieu, their regard for public education changed, parents started preferring private schools where at least their children seemed to be occupied during school hours. That is why they sent their wards to private schools. On the other side, poor parents said that they did not have any option but to send children to government schools because they did not have the money to pay fees, for uniforms and other expenditures incurred at private schools. Another study showed the admission patterns among social classes: approximately, 65–80 per cent of students in rural government schools belonged to the Scheduled Caste, other backward classes and other economically weaker sections (Rani, 2007, cited in Ghuman, 2008). There was another interesting aspect of the changing pattern of admissions in schools which was observed by Singh et al. (2015) that the burden of indebtedness increased in some groups as they strove to meet the financial requirements to provide private education to their wards.
Share in School Enrollment by Social Class
Caste and Gender Composition of the Enrolled Children in the Village Government School
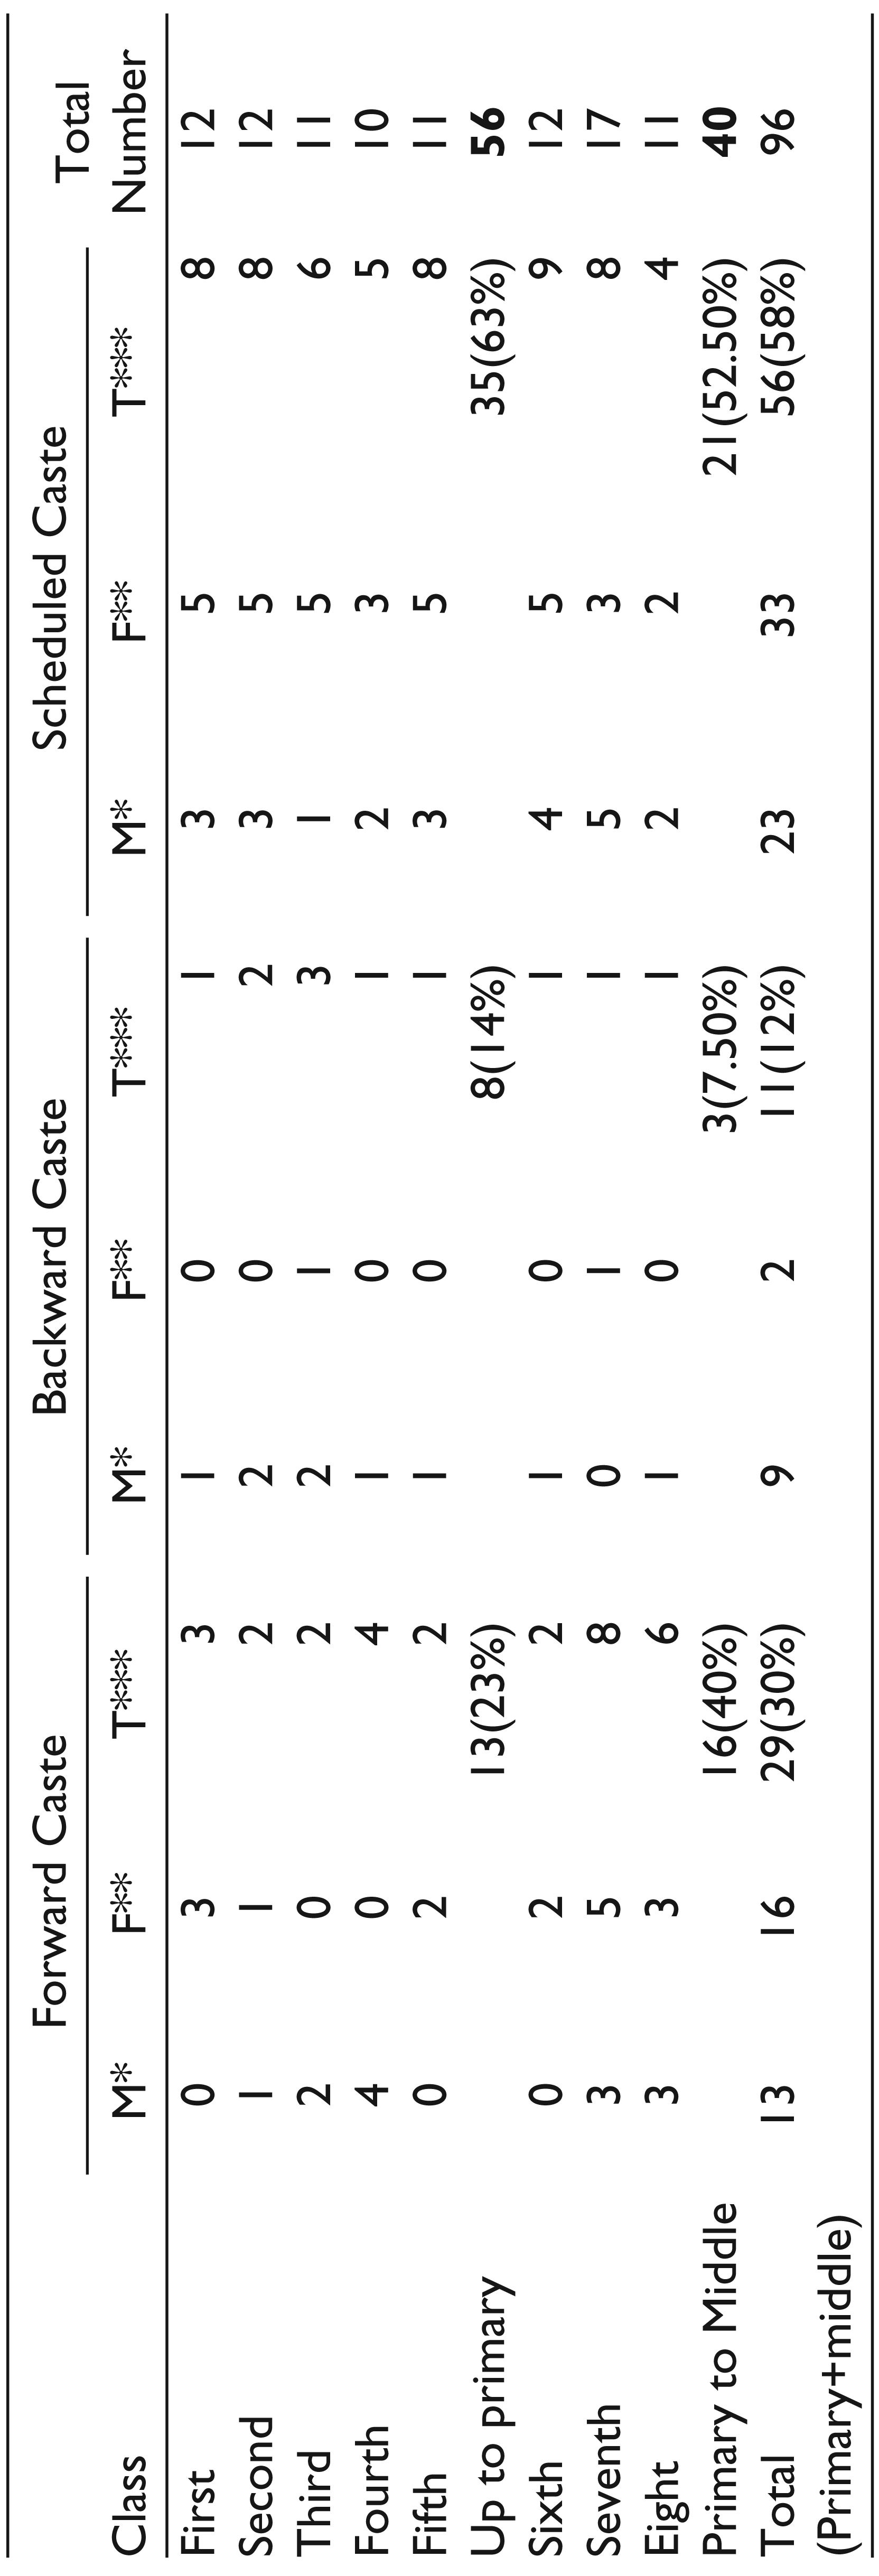
The decline in admission in government schools was an issue of debate and discussions in regional, national newspapers as well as in villages and academic circles. Students from poor economic and social background were joining government schools because their parents were unable to pay private school fees and associated charges. In order to understand this phenomenon, we collected data from school admission records. Table 4 shows that the enrollment of students who belong to the Scheduled Caste category had a high percentage at 58 per cent as compared to the forward caste (30 per cent) and backward caste (12 per cent). In the case of primary level enrollment, 62.5 per cent students belonged to the Scheduled Caste category and only 23 per cent belonged to the general caste. At the middle level, the highest percentage of students (52.5) came from the Scheduled Caste category as compared to a 40 per cent share of general caste and 7.5 per cent share of backward caste. The data clearly indicated the low enrollment of forward caste category students in government schools.
Number of Students Studying in the Government School in the Village: Caste-wise and Gender-wise
Enrollment Rate at Different Levels of Education and across Social Classes
Our purpose was to examine the composition of students in the village studying at different levels. Table 5 showed the caste-wise Gross Enrollment Rate of total households at primary, secondary and higher levels of education. Among the forward caste, the enrollment rate in these levels was 96 per cent, 92 per cent and 67 per cent, respectively. The enrollment rate at the primary level of backward class was 100 per cent, declining to 92 per cent at the secondary level and sharply declining to 25 per cent. In case of the Scheduled Caste category, the primary school enrollment rate was 93 per cent, declining to 88 per cent at the secondary and sharply declining to only 5 per cent at higher levels. Data in the table revealed that there was no education gap at the primary and secondary level and tended to widen at higher education levels across social groups. Various reasons could be seen from the formal and informal discussions held with villagers, respondents, youth and social and political activists.
Firstly, parents did not have additional money to spend on education because of low or no household savings. School education was relatively cheaper than higher education with respect to fees, books, uniforms, transport expenditure and additional expenses. Second, there was a consensus that most higher education institutions provided poor education that did not match with the social, cultural and economic needs of individuals, their families or society. Third, private institutions provided education just for the sake of distributing certificates or degrees; people could even buy degree certificates. Whoever had the means could purchase certificates. Fourthly, employment opportunities were very low and students equipped with certificates didn’t have a basic understanding of the concerned subject. Some time students didn’t even know the expanded abbreviations of their degrees. Lack of knowledge meant they generally didn’t get any employment in an imperfect labour market. This was another reason that discouraged potential students. Fifth, the youngsters came with a fixed mindsets. They believed that not only did education not guarantee them employment but they didn’t have money to give bribe/donations to politicians or concerned authorities to get even a contractual job.
Percentage Distribution of Enrollment Rate by Social Class and Gender
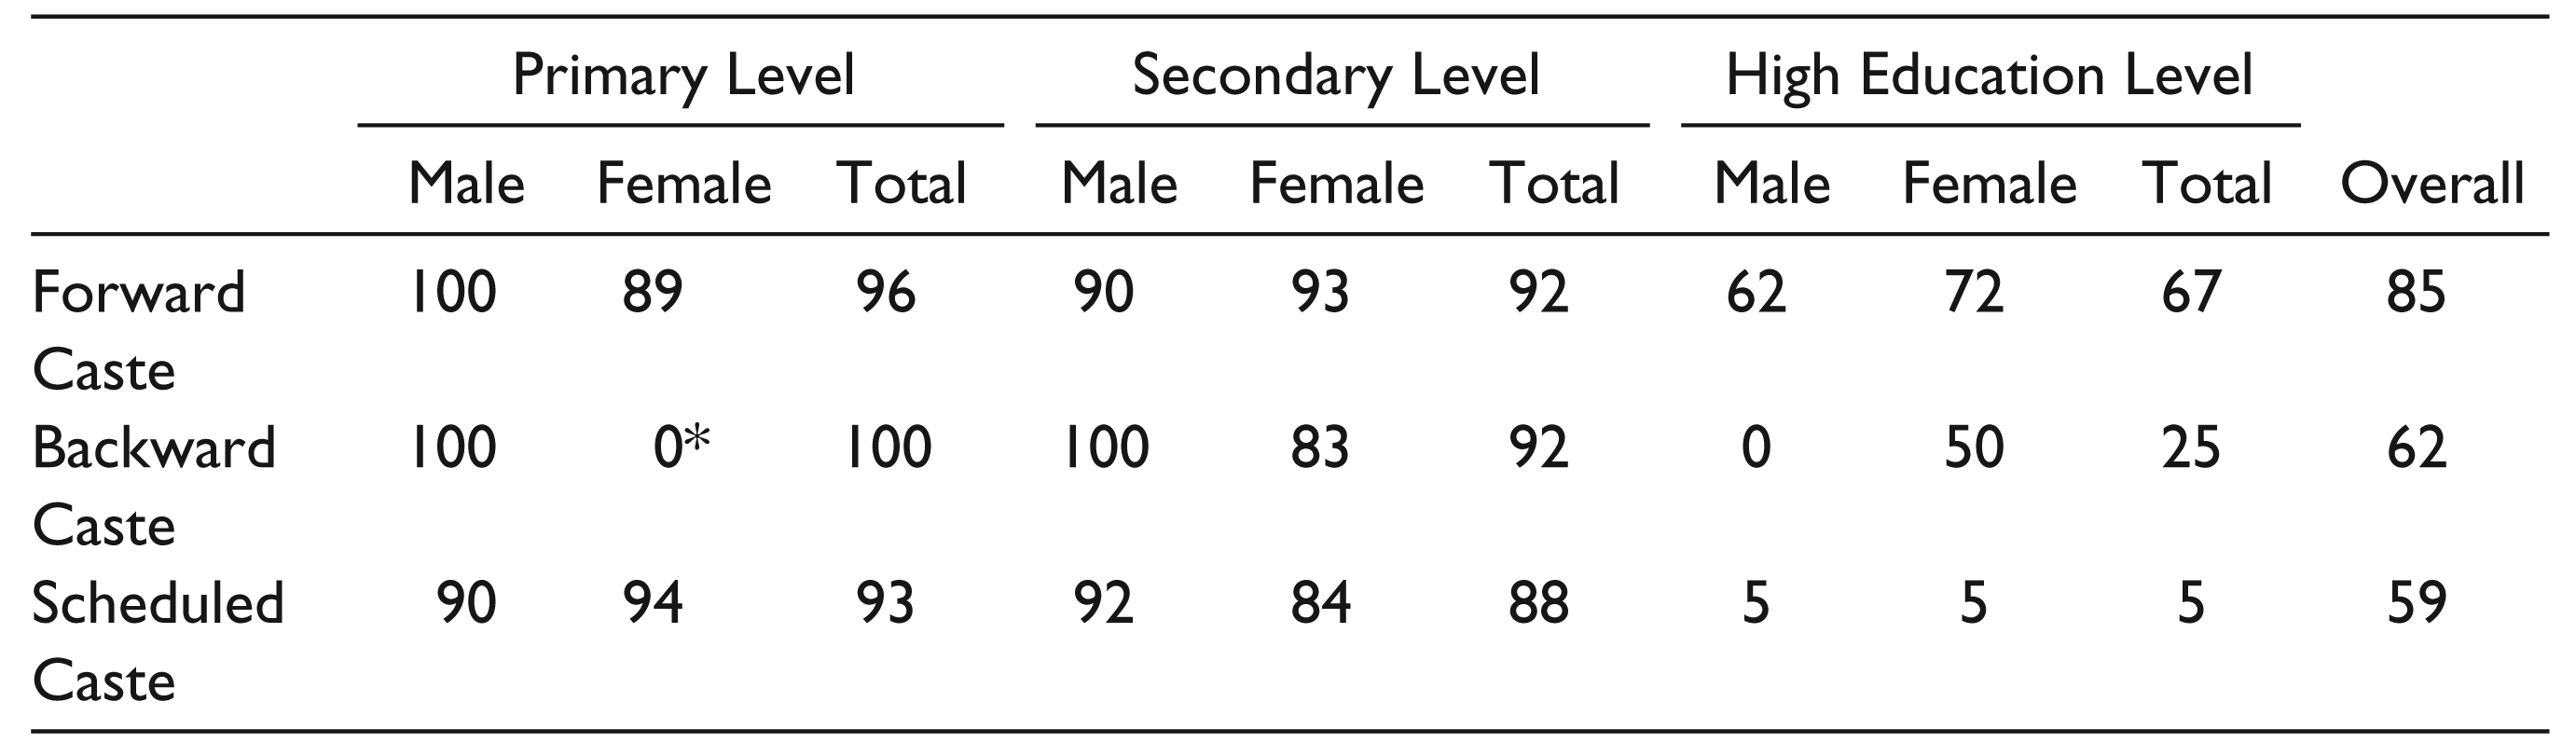
When larger parts of the population gains access to higher education, it extends equality of opportunity (Hansen, 2001). But do students from different social classes/origin have equality of opportunity in accessing higher education? The perusal of Table 5 doesn’t support this argument. While educational inequalities are not the sole determinants of economic status they do play an important role in creating disparities in earnings. Caste-based differences in education, income and other aspects of wellbeing have long been recognised (Desai & Thorat, 2012).
Education Levels across Economic and Social Class: Primary to Higher Education
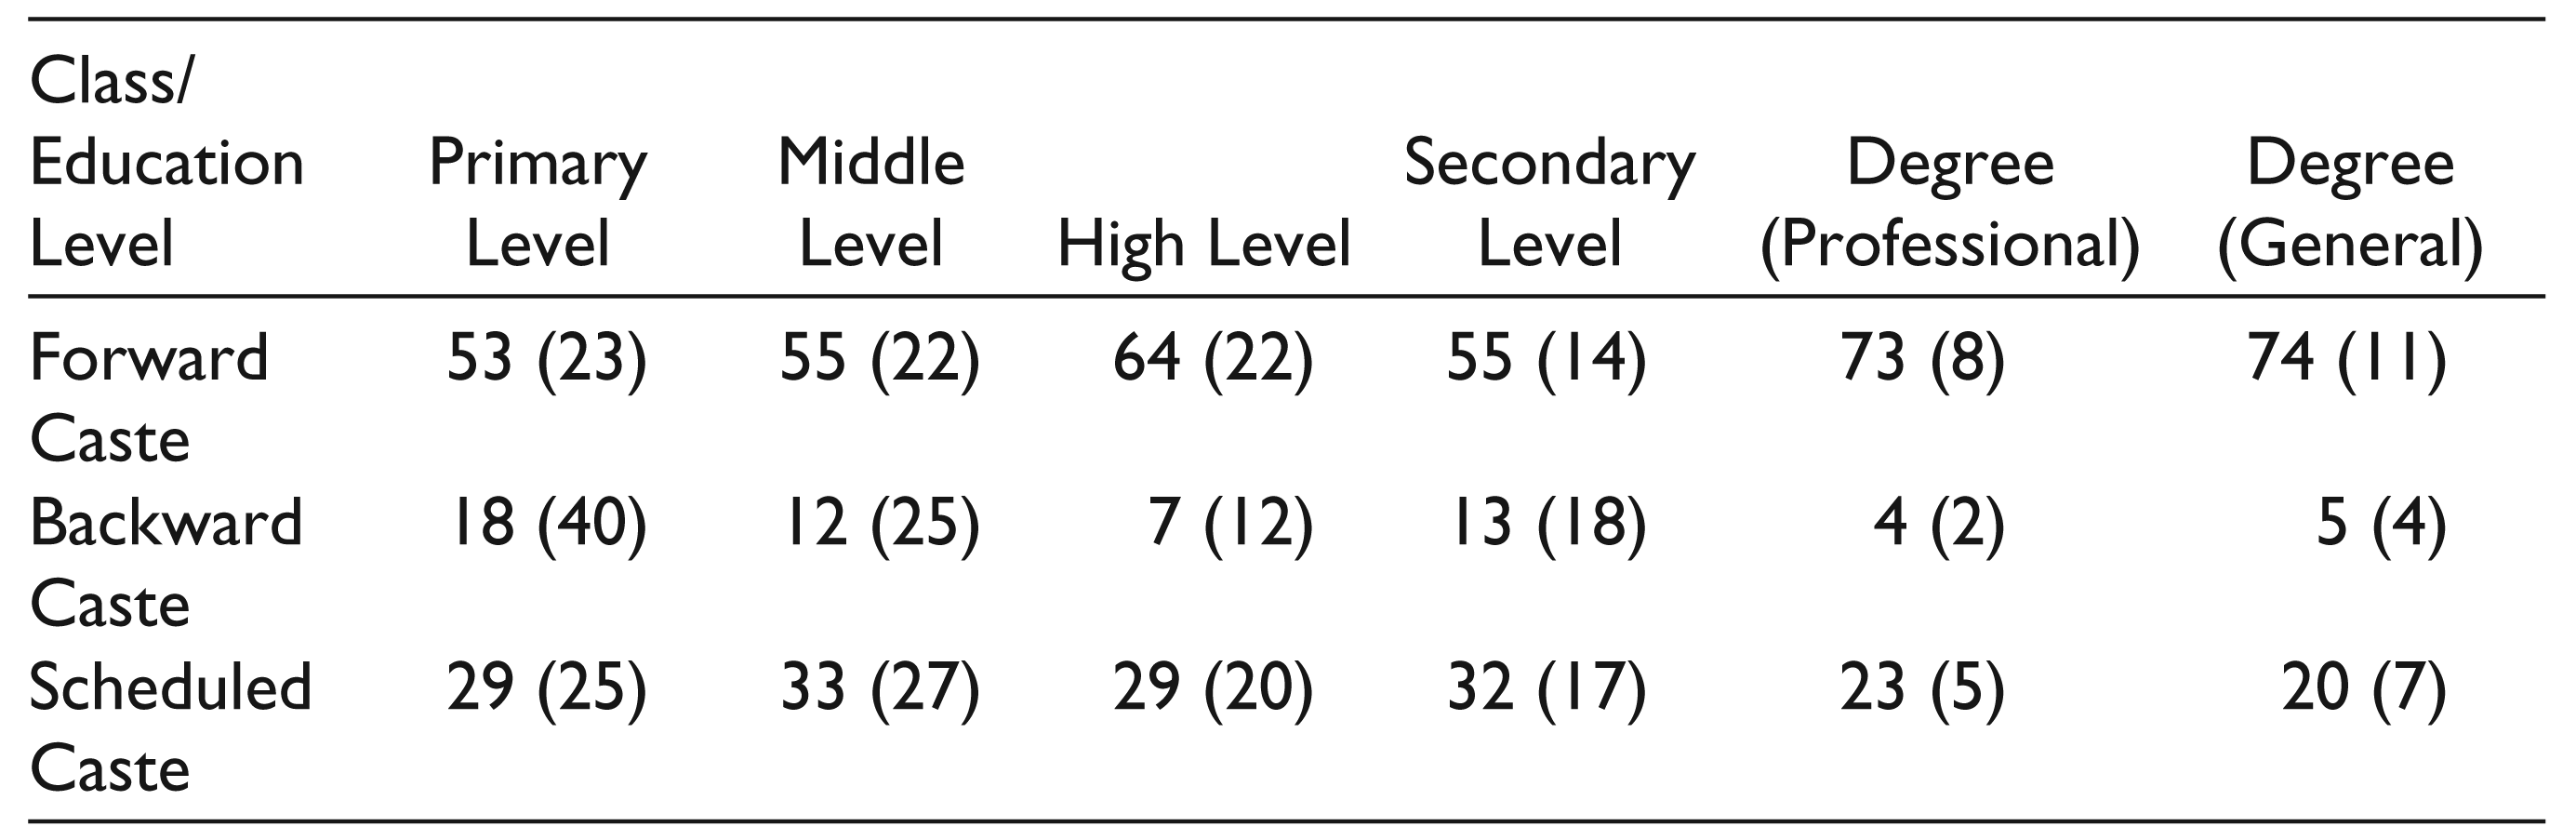
In this section there is an attempt to understand the percentage share of economic and social groups move from primary to higher education. Table 6 shows the different education levels by social classes. Of the total population which was educated at the primary level, 53 per cent belonged to the forward caste, the share of backward caste constituted 18 per cent and the share of Scheduled Caste was 29 per cent. At the middle level, the proportionate share of these classes constituted 55 per cent, 12 per cent and 33 per cent, respectively. In the context of higher education level, the share of the forward caste was 74 per cent followed by the Scheduled Caste and backward caste with 20 per cent and 5 per cent share, respectively.
Table 6A also explores education levels seen in different economic categories. Big farmers and self-employed and salaried categories had relatively a more percentage share as compared to other categories from primary to higher education. On the other side, marginal farmers and labour categories had a lower share from secondary to high education than other categories. This indicated that as fees and other education-related expenditures increased and due to various other reasons, the wards of marginal farmers, small farmers and labourers had less capacity to pursue studies for their wards. Sam Bowles (1971a) argued that in capitalist least developed countries (among whom India qualifies), the benefits from higher education tended to go to elite groups while the benefits from primary education veered to the masses (Bhagwati, 1973). Our concern in this article was not to explore Bowles’s hypothesis but focus on the same lines of the hypothesis in the context of the social hierarchy as it existed in Punjab. We were interested in exploring the enrollment in higher education that tended to go to the forward caste which had assets and enrolment in primary and secondary education to the Scheduled Caste category. The perusal of Table 6 indicated that at all levels of education, from the primary to degree level, the share of the forward caste in the literacy was more than half. The results showed that the lower and backward castes didn’t have productive assets and/or adequate sources of income. This table showed that the dropout rate was high in backward and Scheduled Castes relative to forward castes.
Expenditure on Education by Social Class Origin and Gender Share on Education Expenditure
This section explored the expenditure on education spent by parents for education of their wards. Education expenditure came from two sources: state expenditure or private expenditure incurred by parents. Parents spent money on the education of their wards specifically for fees, uniforms, books and stationary, tuitions, transportation and other related tasks. The expenditure on the education of children depended on the economic conditions of the parents, the extended family, and their economic and social status which also determined the choice of choosing schools. To explore this dimension, Table 6 reveals that the forward caste spent more money on educating female children, approximately ₹13,000 and approximately ₹12,000 on male education. In the case of the backward caste, expenditure on their male wards was very high as compared to female wards. The same was true of the Scheduled Caste category. The data clearly indicated gender inequalities among backwards and Scheduled Caste social groups at the village level. This explored the nature of a hierarchal society in terms of gender. Second, people had a clear choice to spend more money on the male child because boys would end up being the sole earners of the family, whereas girls would leave their homes after marriage.
Education Level Division by Social Class (Number and Percentage)
Education Level Division by Economic Class
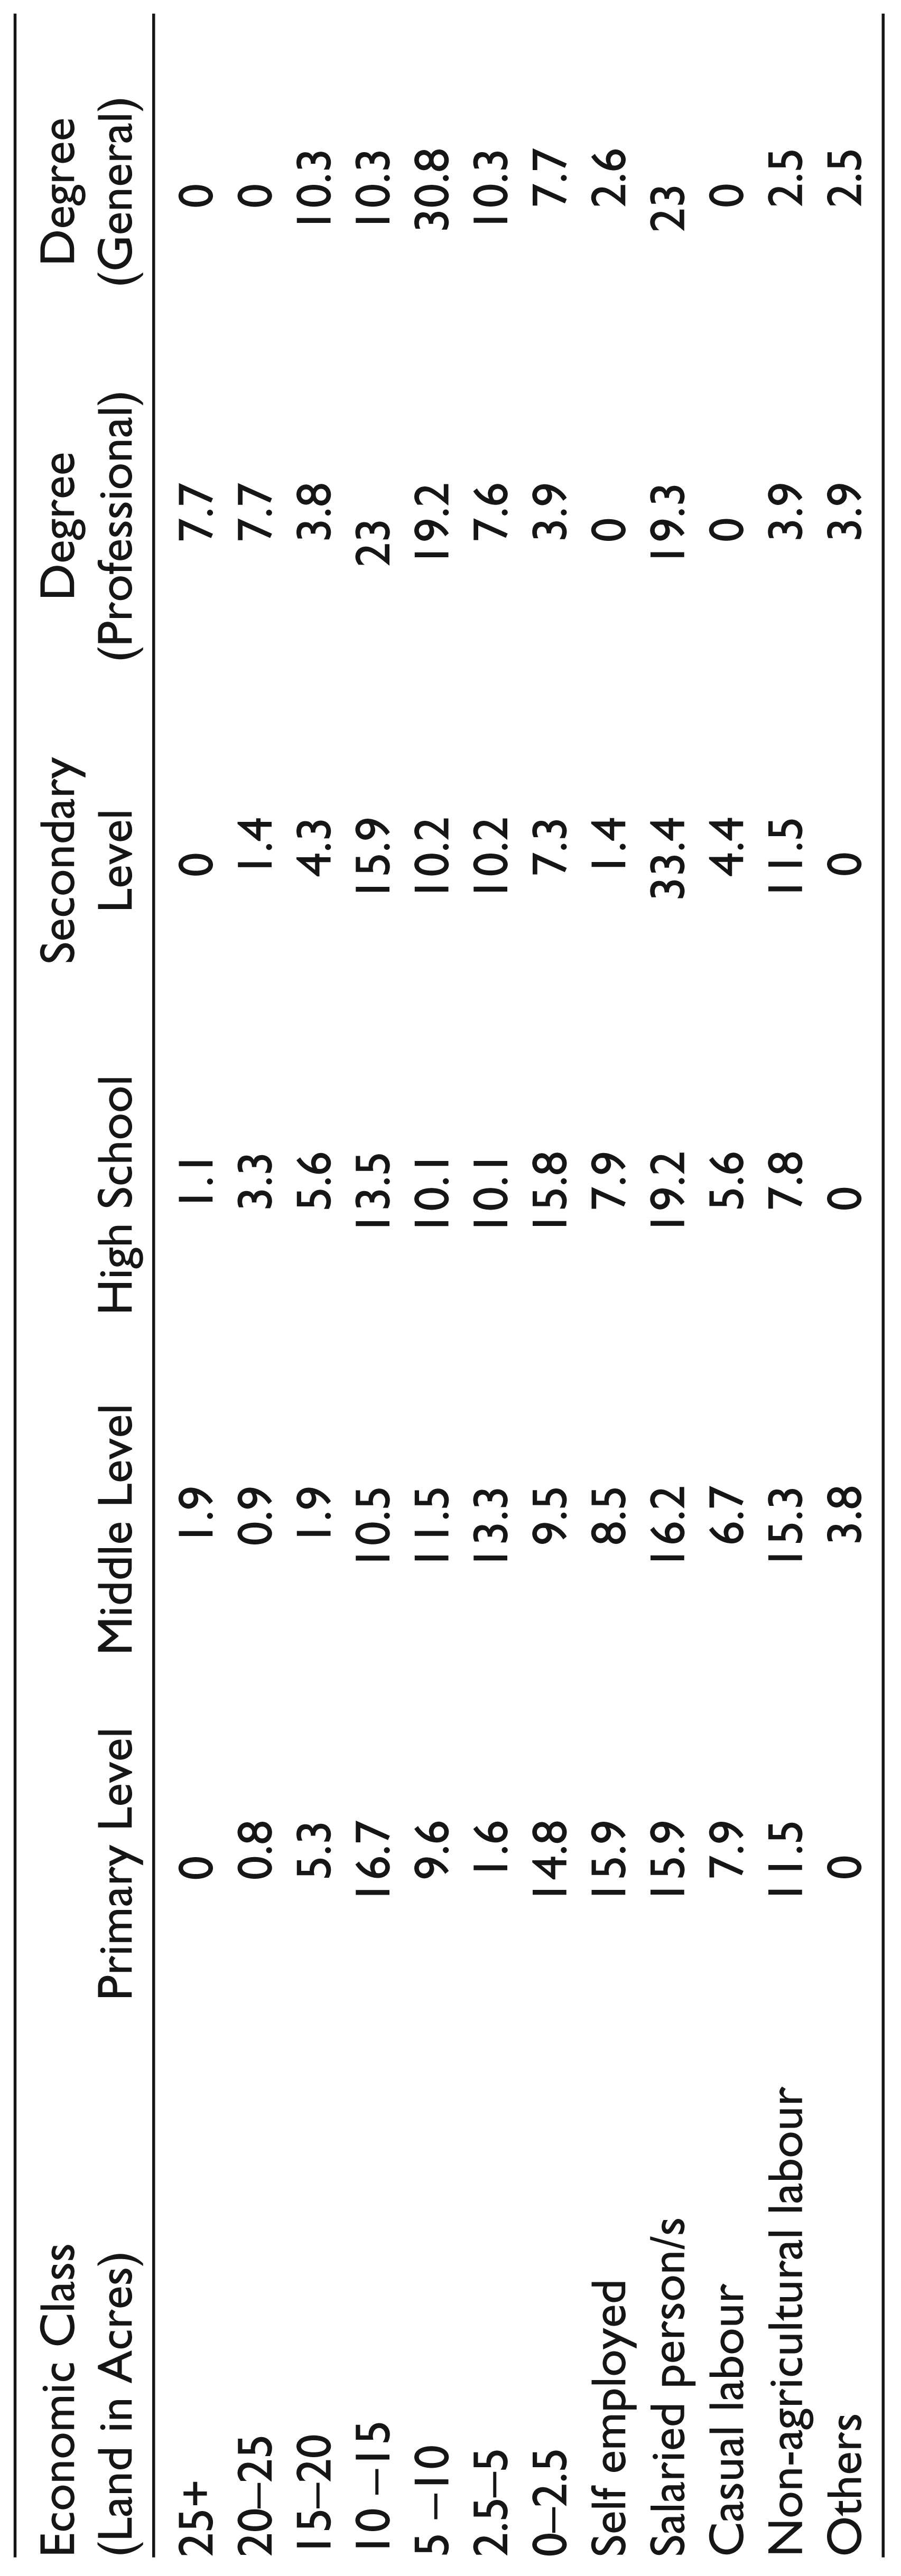
Table 7 explores the difference in education expenditure for male and female wards in their respective caste category. In the context of the forward caste category, the male population share was approximately 52 per cent incurring 48 per cent expenditure and female had a population share of 48 per cent bearing 52 per cent expenditure share. In the case of a backward caste category, male population’s share of 53 per cent drew the approximately 80 per cent share of education expenditure. The male population share in the total Scheduled Caste population was 55 per cent but the share of expenditure was 77 per cent. This table clearly shows that the difference in the share of education expenditure was not the same according to their population share. The data indicated that households which had a low income, preferred educating the male child. It was backward and forward caste groups which incurred equal expenditure on both sexes. It was very interesting to understand why the forward caste spent more money on girls than boys. The reasoning was clear: Most young boys argued that as there were no jobs available what was the use of wasting their precious time and money on education. Second, as the young male population was involved in family economic activities and in a patriarchal society, these males were eventually going to head their family units so their futures were in a sense assured. Another reason was that young males were often involved in petty political activities, drug addiction and anti-social activities during their college days, and either they dropped out or did not succeed at the college level. This trend could be traced due to the negligible presence of progressive student movements in Punjab since the 1980s.
Expenditure on Education by Social Class and Gender (in rupees and percentage)
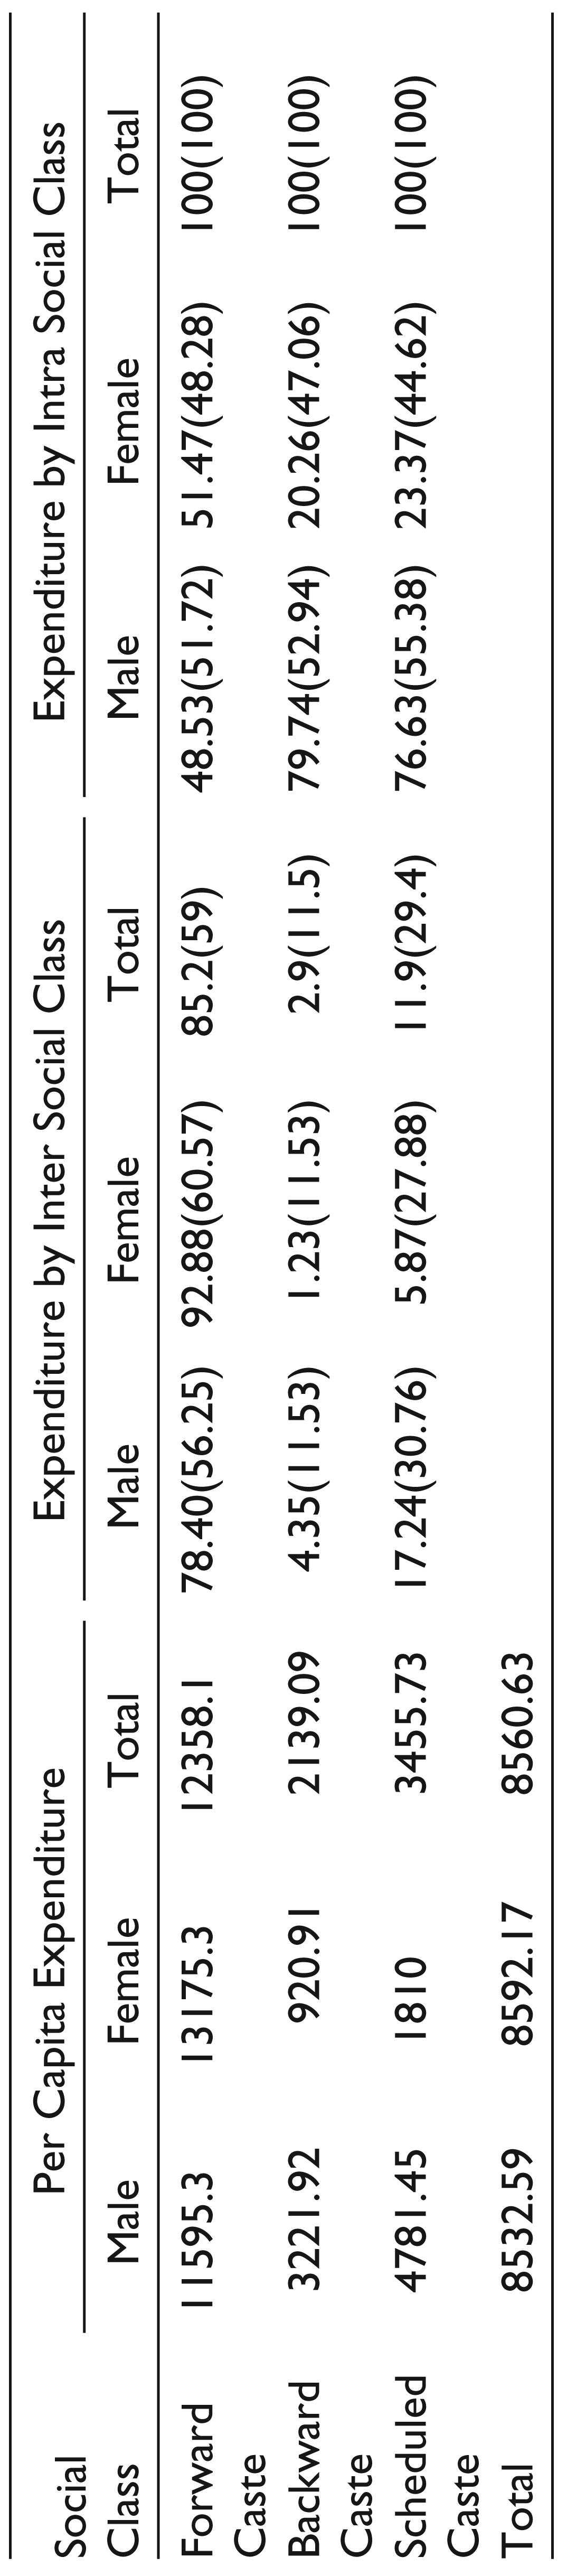
Further, the table also explores the share of male population and education expenditure between caste groups. In the case of the backward caste category, the population share of 11 per cent shared only 4 per cent on education expenditure. Seventeen per cent share of the total education budget was spent on 31 per cent male students in the case of the Scheduled Caste category. So far as female students were concerned, 93 per cent of the total budget went to forward caste women which constituted 61 per cent share. In the case of the backward caste, 11 per cent women shared only one per cent of the education budget. Similarly, 28 per cent women shared only 6 per cent budget. In totality, 59 per cent of general caste student population grabbed 85 per cent of the total education budget as compared to 11 per cent of backward caste students who 3 per cent of the education budget. Twenty-nine per cent of Scheduled Caste students shared only 12 per cent of the education budget. This depicted clear disparities of education expenditure in the context of the student population among social groups and at the gender level.
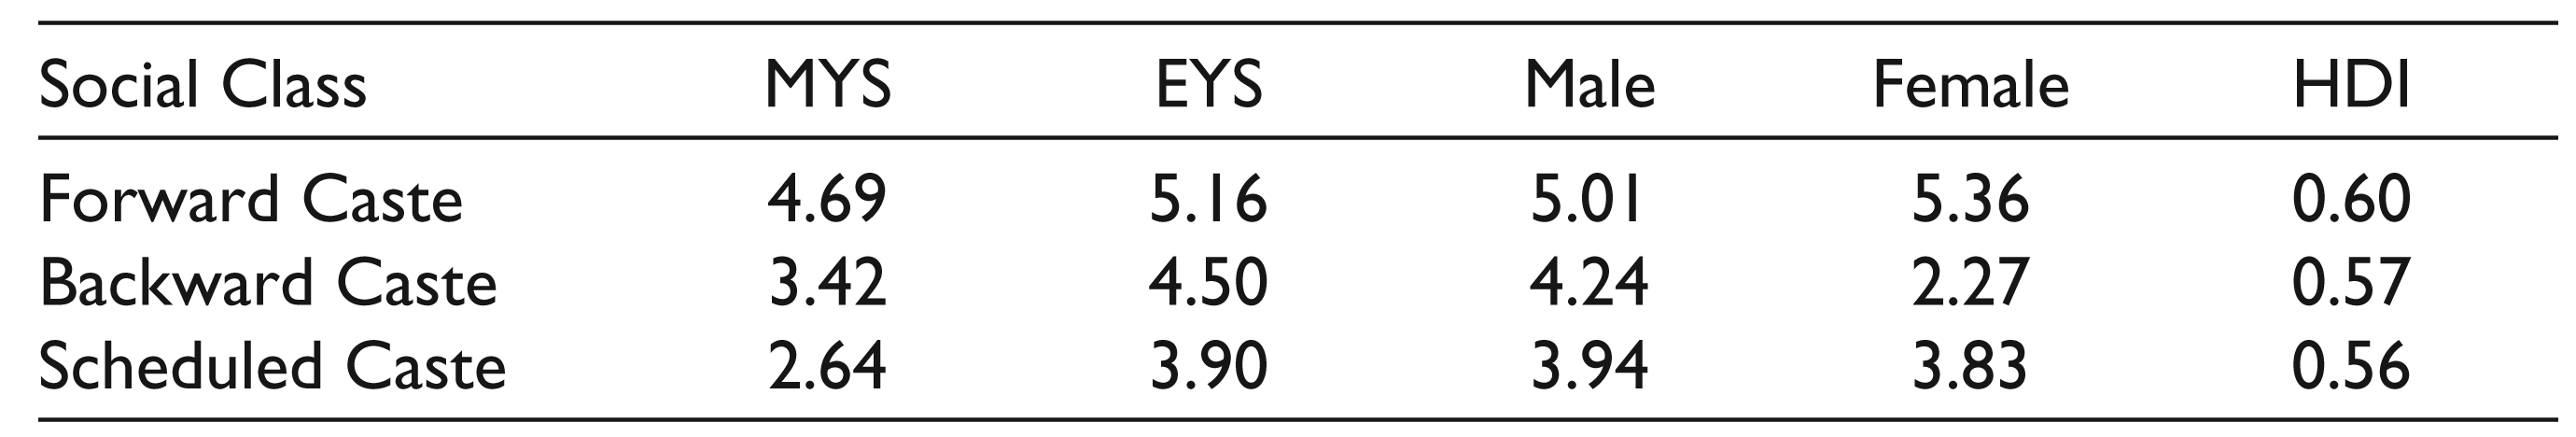
Mean Years of Schooling, Expected Years of Schooling and Human Development Index among Social Classes
Table 8 summarises the mean year of schooling, expected year of schooling and the HDI among the different social groups. For this two synthetic cohort measures were constructed (Government of Punjab, 2004). The value of MYS was 4.69 points in the case of the forward caste which was higher than backward caste and Scheduled Caste, that is, 3.42 and 2.64 point, respectively. Another cohort measure, expected years of schooling also indicated differences among three caste categories. Forward caste scored 5.16 expected years of schoolings as compared to backward caste with 4.50 points and Scheduled Caste with 3.90 points. In the case of the HDI, among different social groups, the HDI value of forward caste was 0.60 which was higher than rest of the groups, backward caste’s HDI was 0.57 point while Scheduled Caste category was 0.56 point. The knowledge-adult literacy rate and enrollment at school level was an important input along with life expectancy at birth and estimated earned income to work out an adequate HDI.
HDI, Mean and Expected Year of Schooling among Social Class of the Village
Thus, in today’s world, school education, is still the most important yardstick to assess the development of a particular country (Chaudhry, 2007, p. 54). The process of education acts as a vehicle of social transformation beginning at the level of elementary education. It was at this formative age that important traits like inquisitiveness, logical and coherent thinking, scientific temper, a boldness to ask inconvenient questions, the desire to confront the world around him/her to understand its dynamics and so on develop in a child (Chaudhry, 2007, p. 55). However, the village in question was facing severe challenges with a low HDI as Chaudhry describes so clearly.
Conclusion
After 1947, Independent India focussed on expanding the new nation’s education fabric by adopting various policy measures and developing adequate educational institutions thereby reduce regional inequities. But apart from the literacy rate, there were differences in the enrollment rate of three stages and education levels. This research also recognised differences in MYS, expected years of schooling and HDI across social classes. As a result of the state education policy initiated after Independence, class, caste and gender inequalities were from the primary education level towards higher education. Such a lopsided development of education and wide differences would inevitably lead to even more a more unequal, unjust and shoddier economy and society given that village’s economy and society was in any case fragmented since its inception.
Based on our survey, it could be argued that high income groups and forward castes were benefitting more from the national education system over time while the lower castes groups and Scheduled Caste population were getting less benefits. It was observed that public schools were playing an important role by catering to the education of poorer households. In the current policy discourse, the education system doesn’t tend to distribute equal benefits irrespective of class, caste and gender. This article emphasised the contradiction between the constitutional promise of equality of opportunity and the reality as could be seen from the prism and context of one village located in Punjab state. Thus we argued that education had not become an instrument of egalitarianism and a way to a better life as had been promised in our Constitution. Hence, our first hypothesis was supported and second was not supported by empirical evidence. However, whether these policies would make a dent in the prevailing socio-economic environment is a moot question which will haunt every concerned citizen.
Declaration of Conflicting Interests
The author(s) declared no potential conflicts of interest with respect to the research, authorship, and/or publication of this article.
Funding
The author(s) received no financial support for the research, authorship, and/or publication of this article.
Footnotes
Acknowledgements
We are thankful to Dr Kamaljit Singh, Punjabi University Regional Centre, Bathinda, and Rohot Photela, DAV College, Chandigarh, for helping us in various ways.