
Abstract
The present contribution makes the seventeenth part of the Social Change Indicators series. We have previously deliberated on several social and economic issues and the topics have included vulnerable households across social classes, poverty, migration, living conditions, social protection, displacement of labour, old-age health and morbidity conditions, women’s time use patterns, and intimate partner violence. In this part, we examine the assets and indebtedness of households across rural and urban areas, occupational types as well as social classes in different states of India.
Keywords
Wealth and assets bear an important link in the household’s budget decisions to economic choices and living conditions, while over-indebtedness is known to set off financial fragility. Inequalities in income and wealth within emerging markets and developing countries have increased and aspects of rising wealth concentration in individual economies are being studied in the post-COVID-19-pandemic years. While India is emerging as one of the fastest growing economies, it is also one of the unequal countries, with high-income groups getting richer and the poor finding it difficult to earn basic income.
The National Statistical Office (NSO) under the Ministry of Statistics and Programme Implementation has published the latest All India Debt & Investment Survey (AIDIS) for January–December 2019, as part of the 77th round of the National Sample Survey (NSS). This publication (Government of India, 2021) follows the previous survey in NSS 70th round, 2013. Its main focus is providing information on household assets, liabilities, and capital expenditures incurred under different heads.
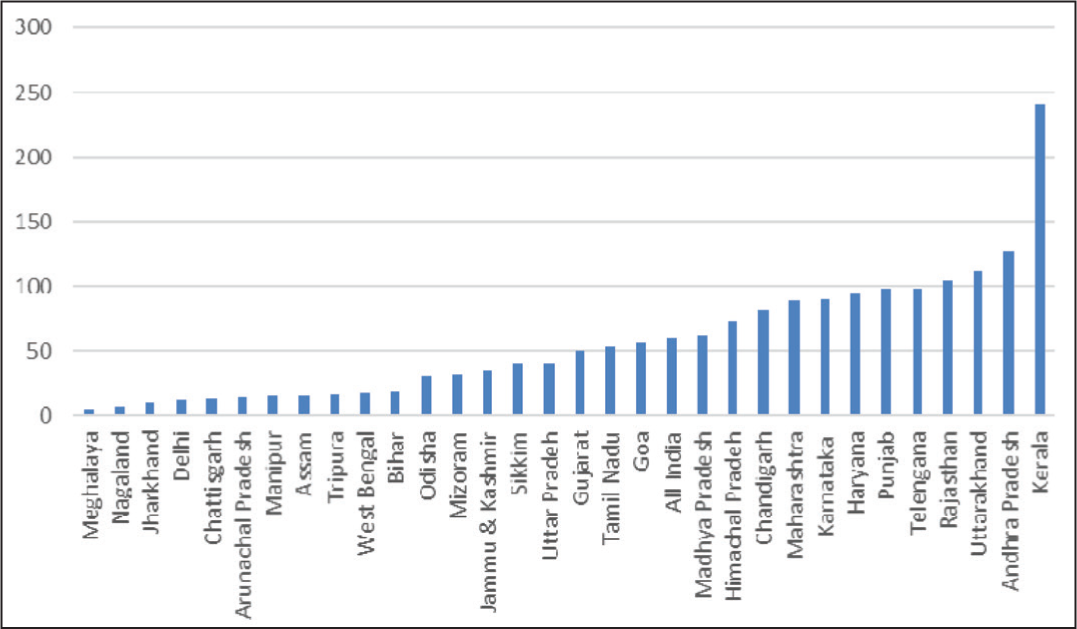
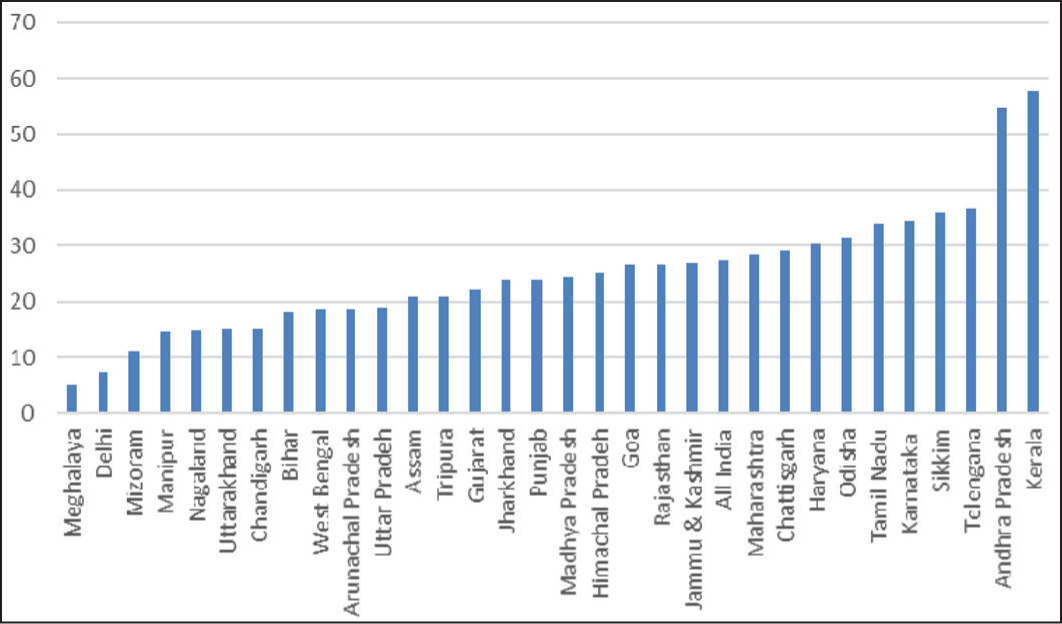
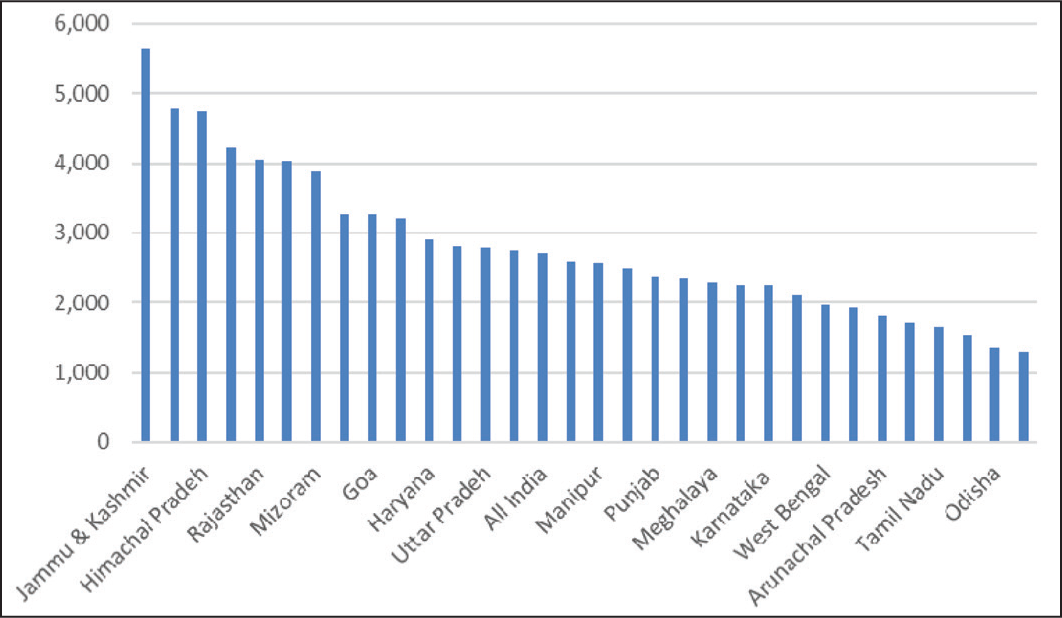
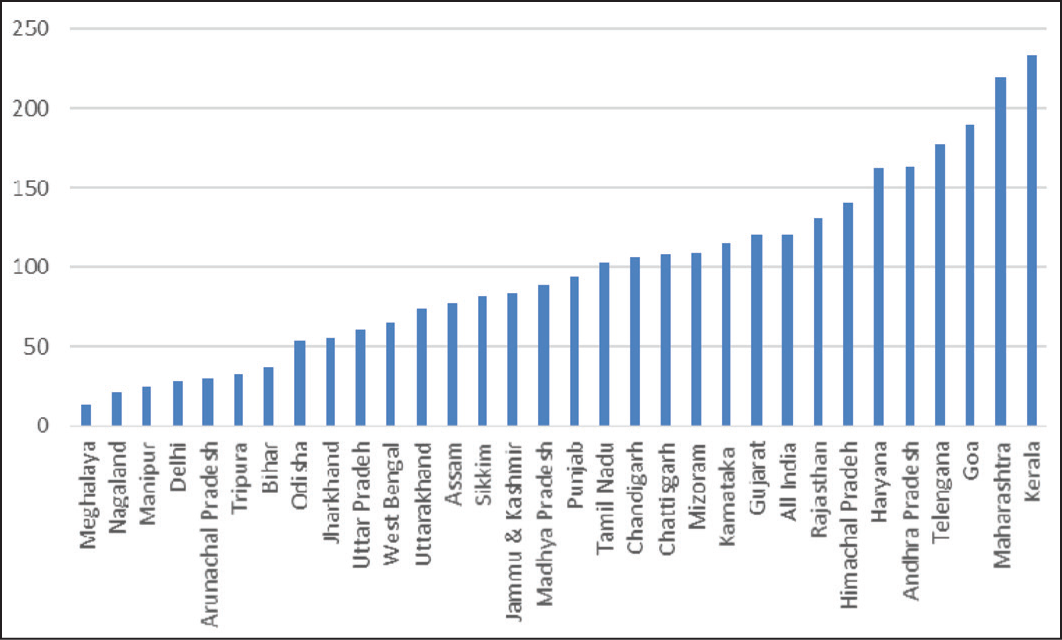
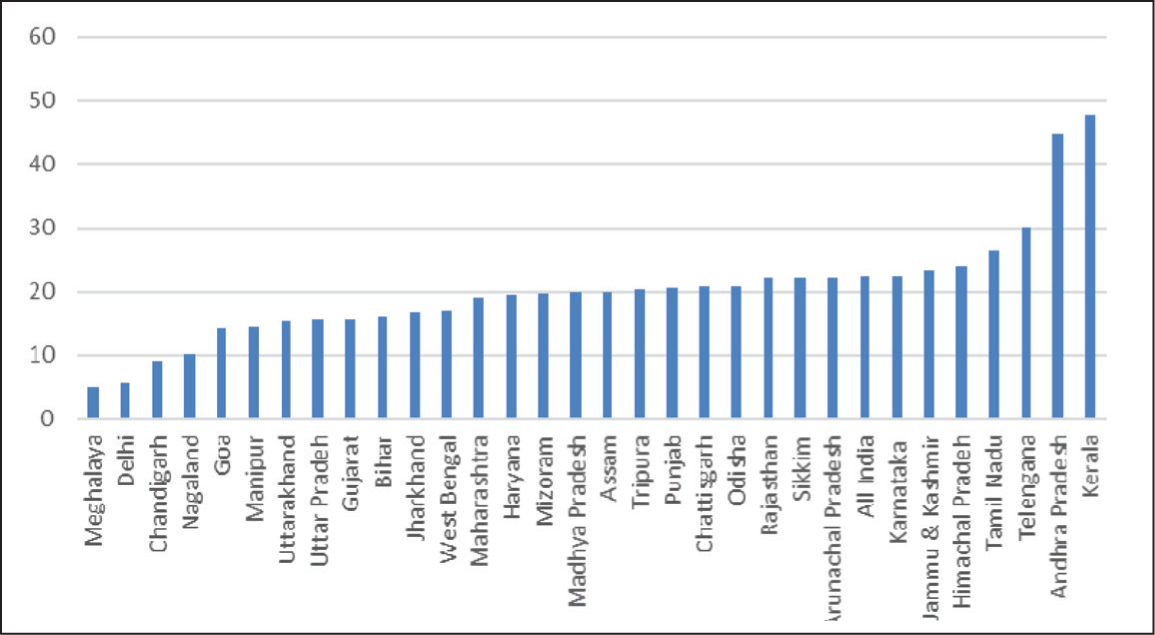
Drawing from this source (Government of India, 2021), the seventeenth part of the Social Change Indicators series examines the average value of assets, average amount of debt, and the incidence of indebtedness separately for the states’ total rural and urban households. We also provide the same information for the occupational categories of cultivators and self-employed households within the rural and urban households of different states, respectively (Figures 1–12).
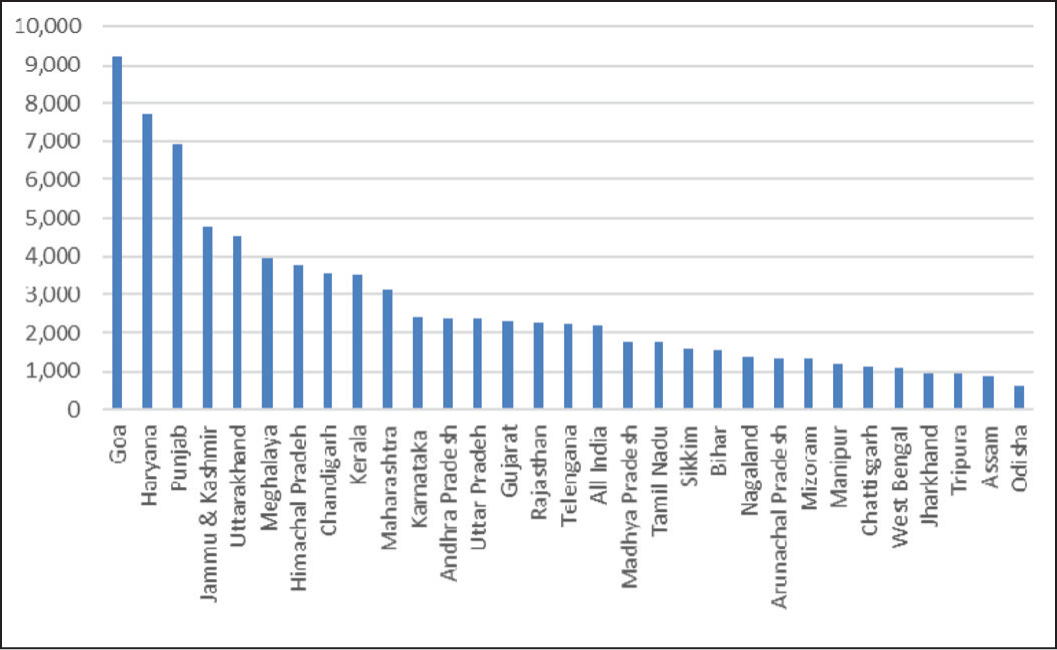
Source: Government of India (2021).
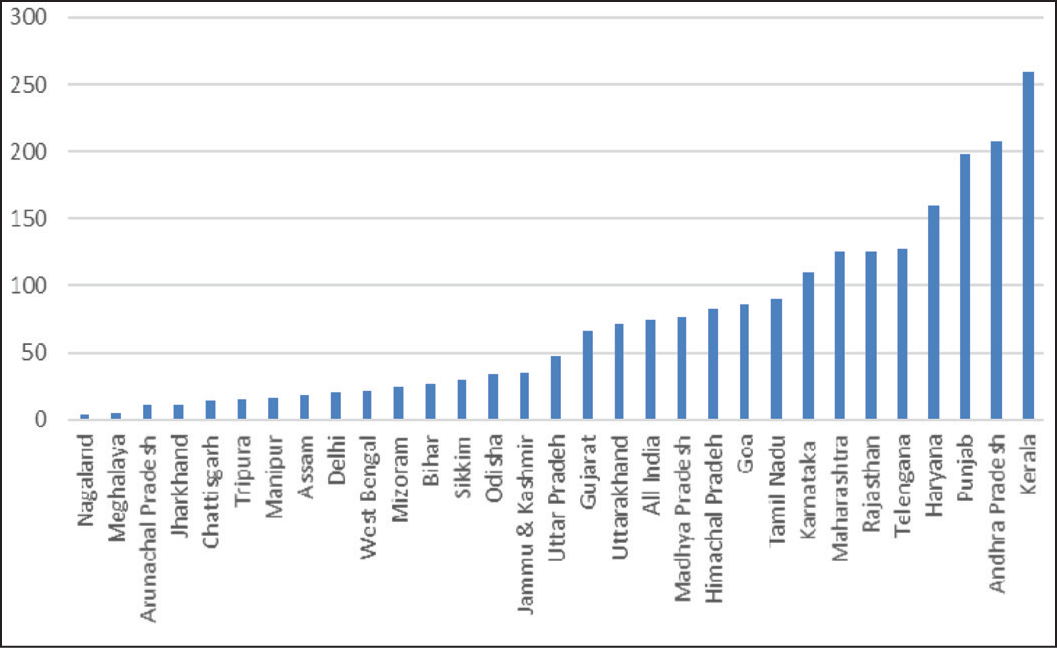
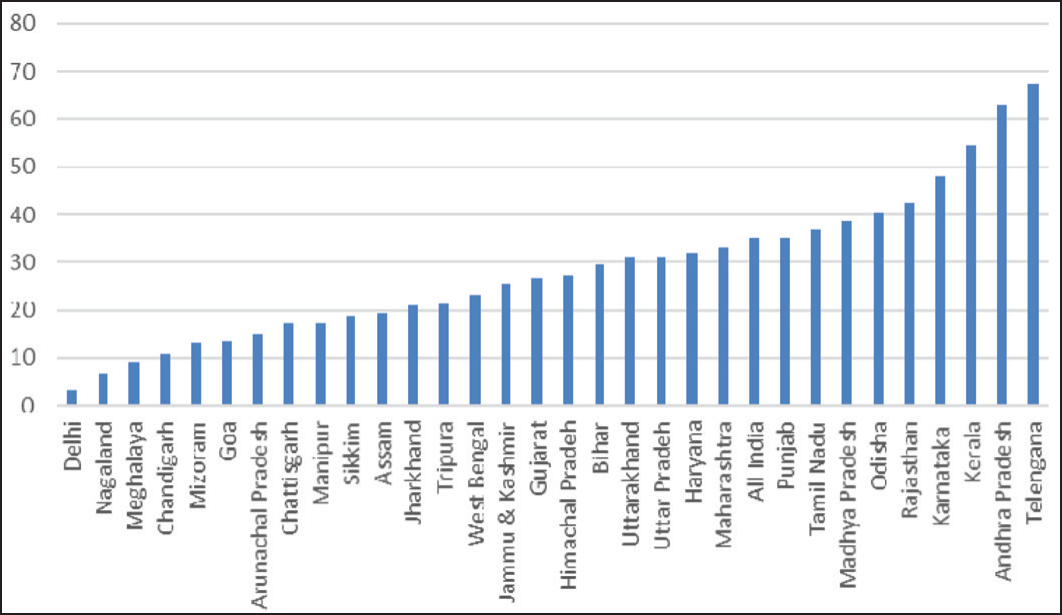
Source: Government of India (2021).
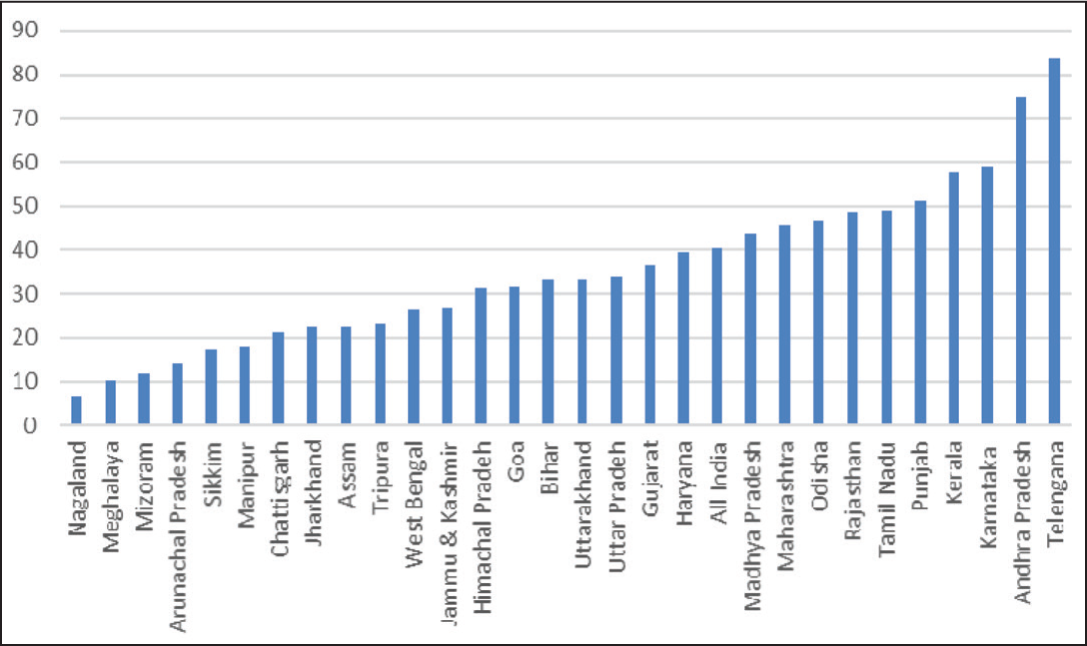
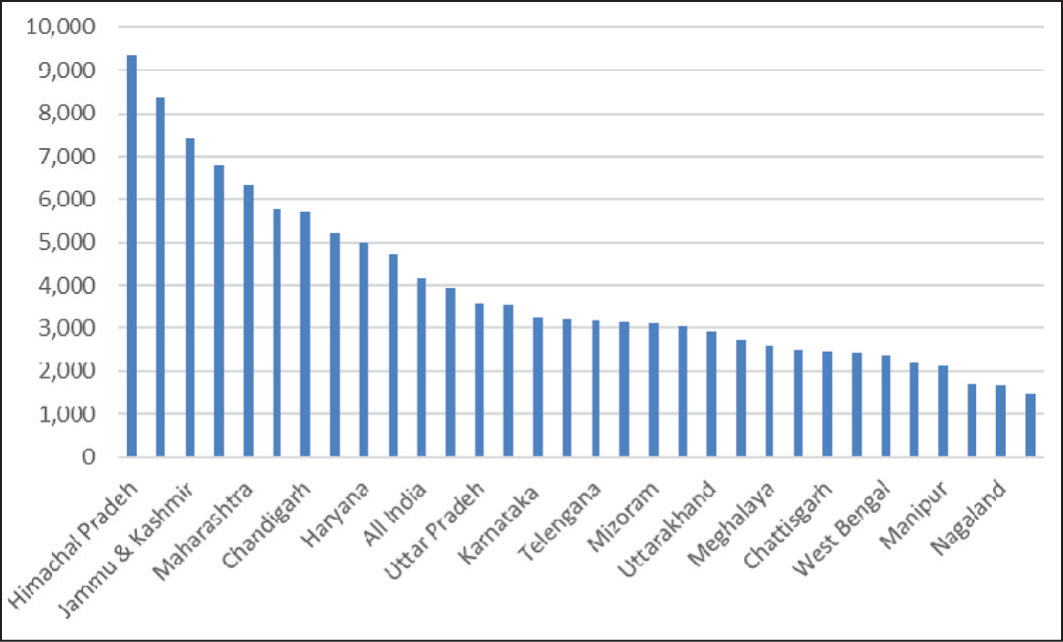
Source: Government of India (2021).
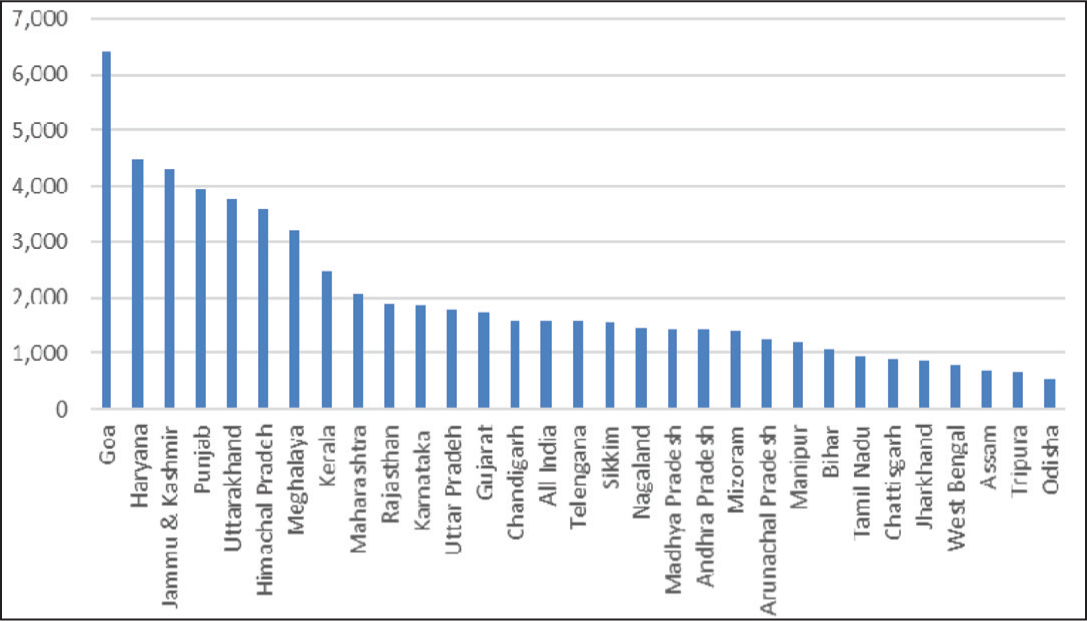
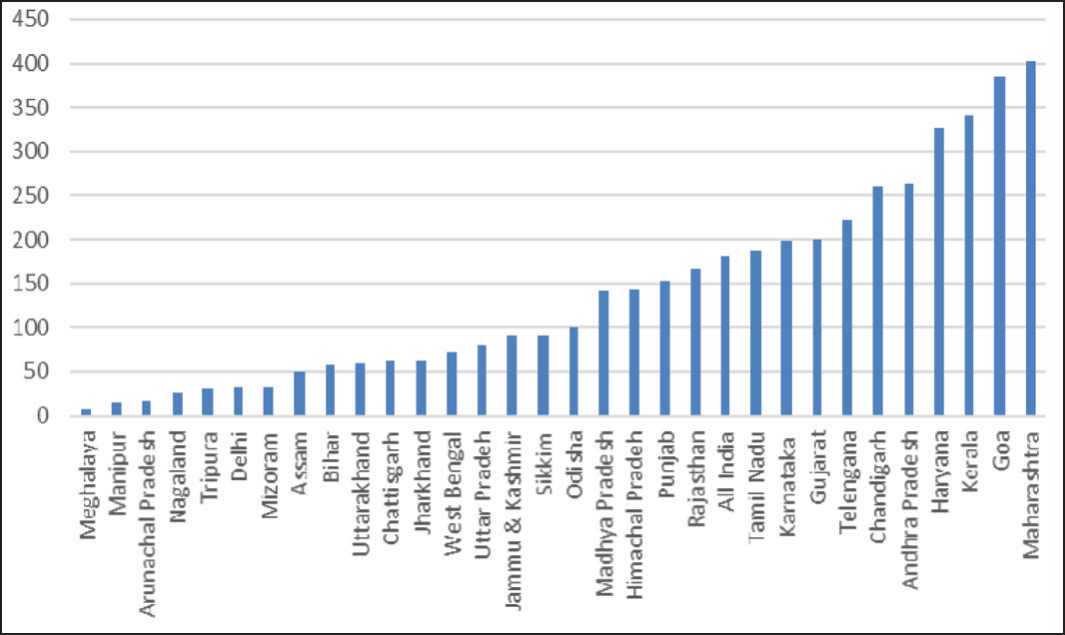
Source: Government of India (2021).
Source: Government of India (2021).
Source: Government of India (2021).
Source: Government of India (2021).
Source: Government of India (2021).
Source: Government of India (2021).
Source: Government of India (2021).
Source: Government of India (2021).
Source: Government of India (2021).
Finally, the information on the average value of assets per household and the percentage of indebted households under different social classes are provided separately for the rural and urban segments of various states (Tables 1 and 2).
Average Value of Assets (in Thousand Rupees) per Rural and Urban Household.
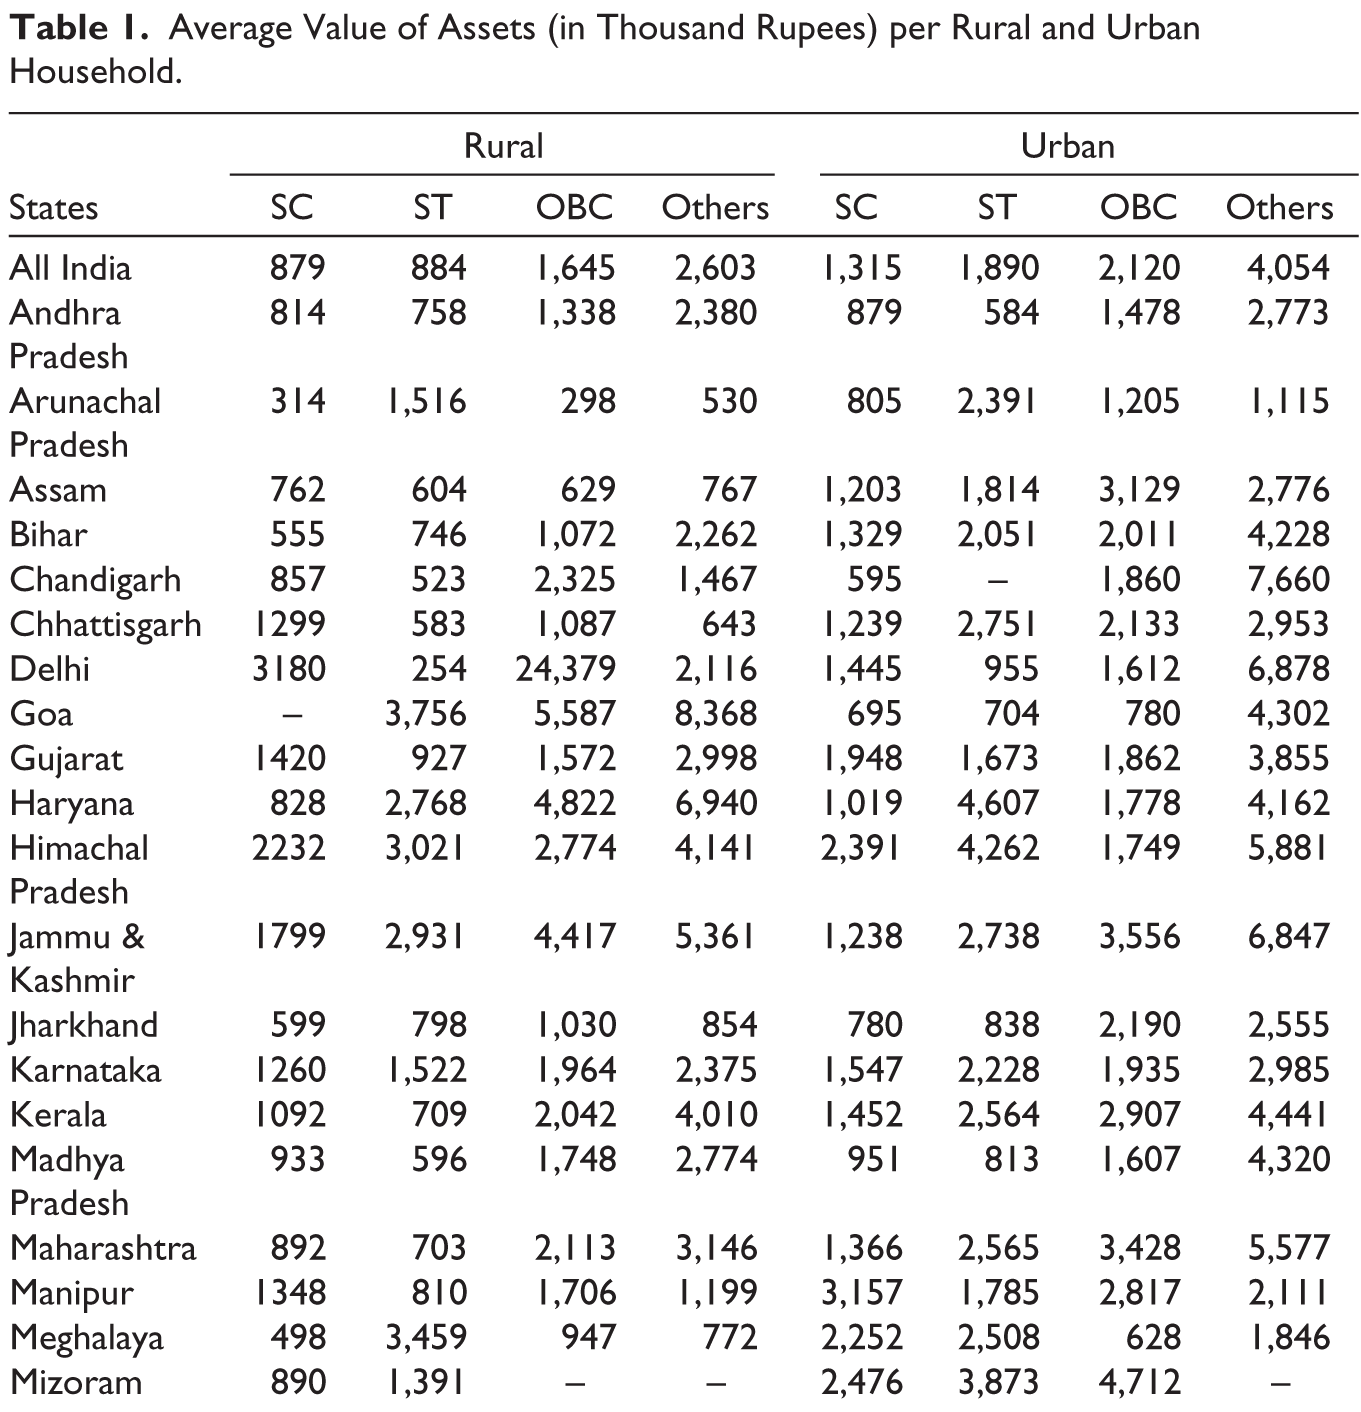
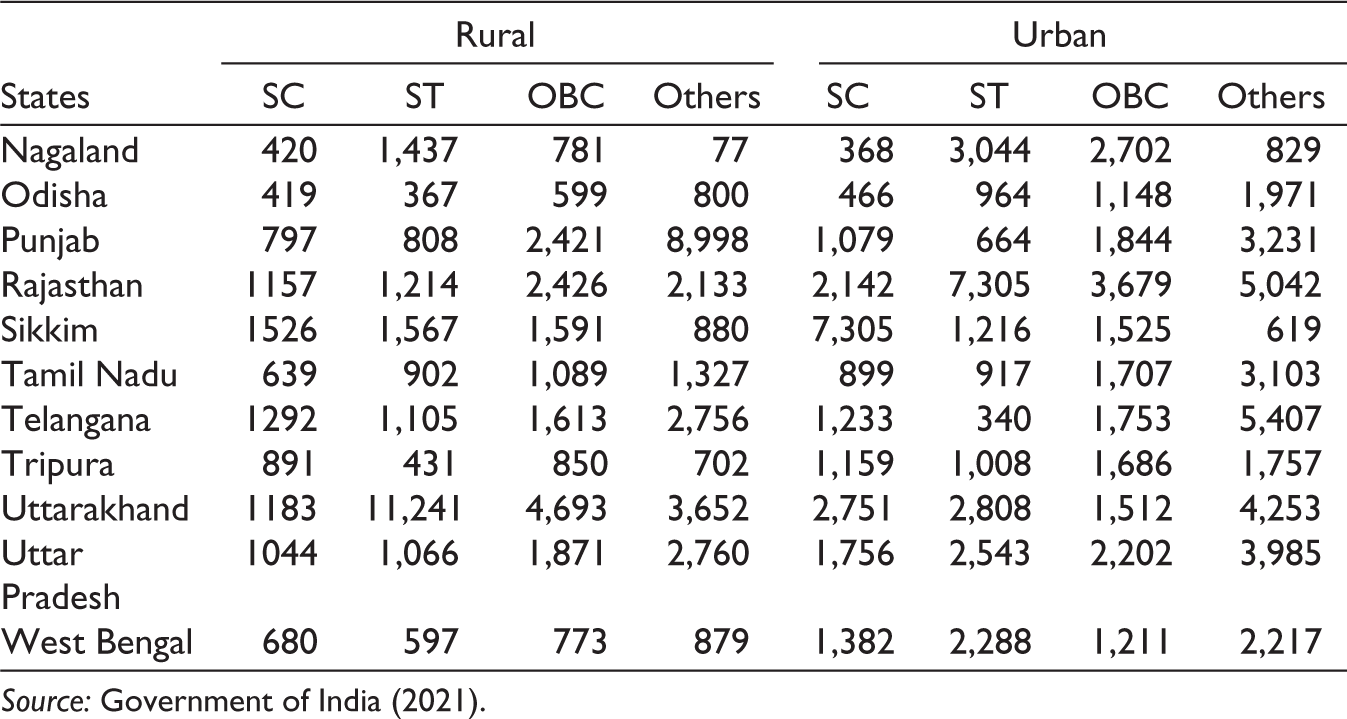
Source: Government of India (2021).
Percentage of Indebted Rural and Urban Households.
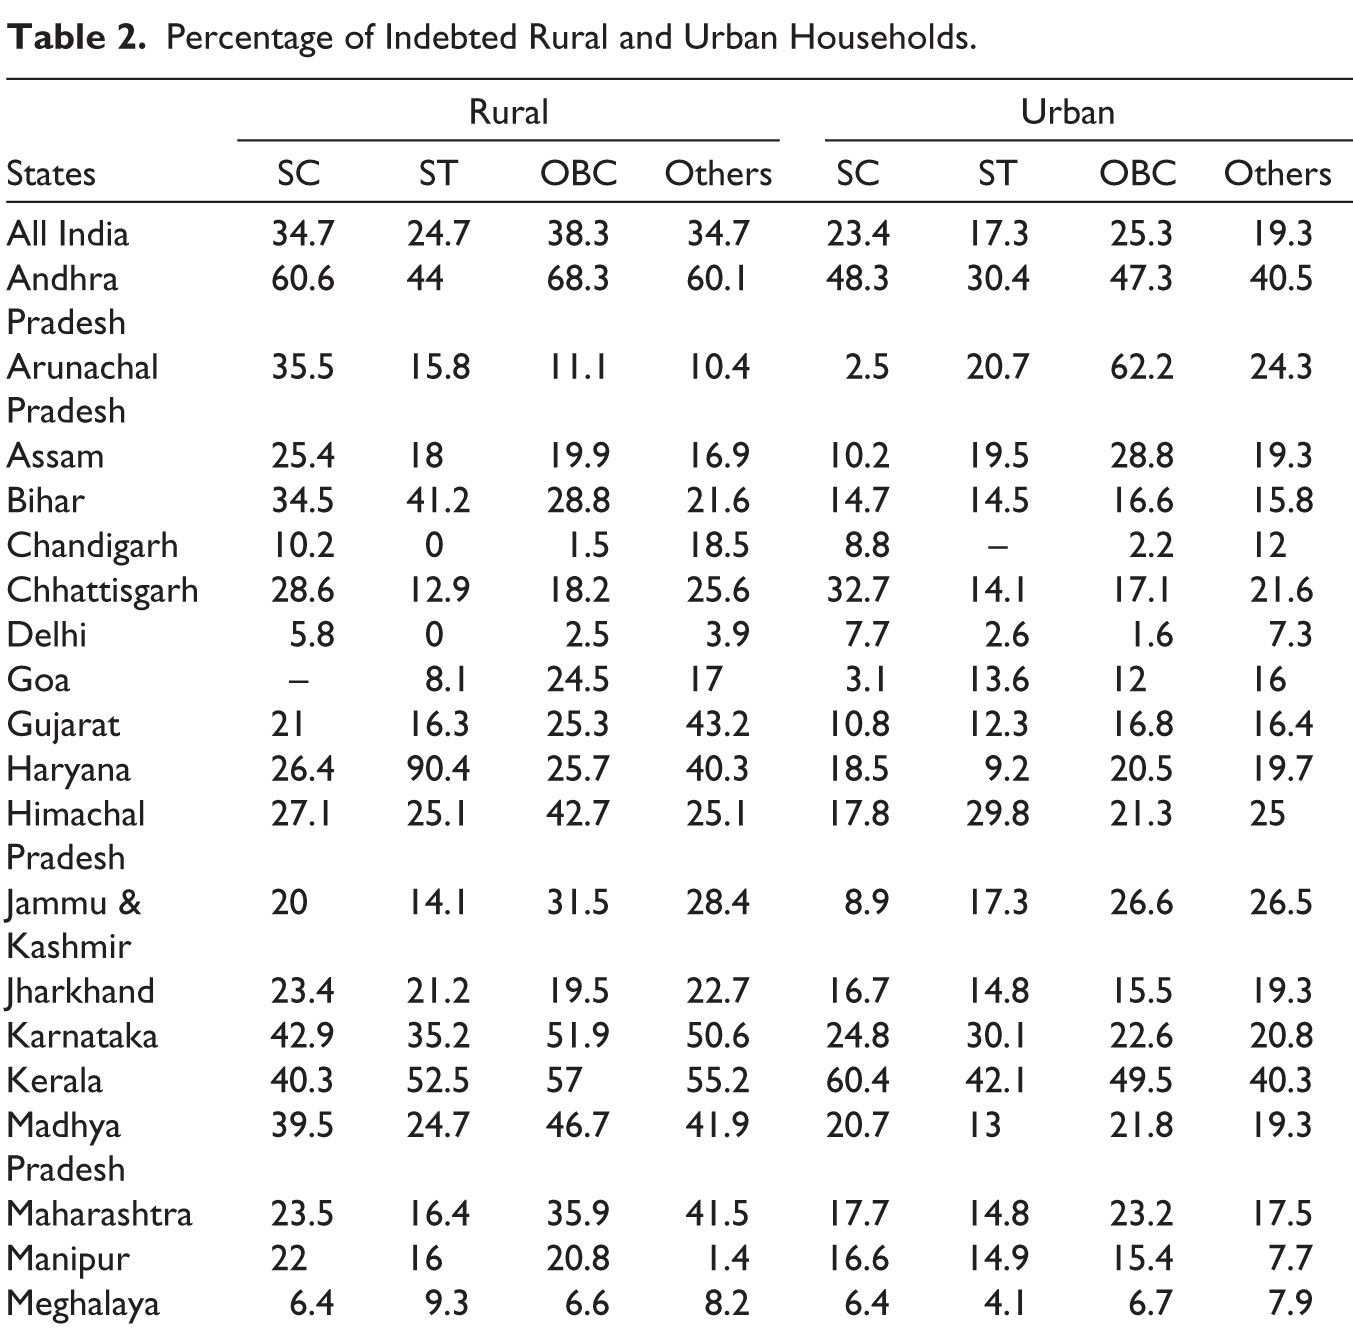
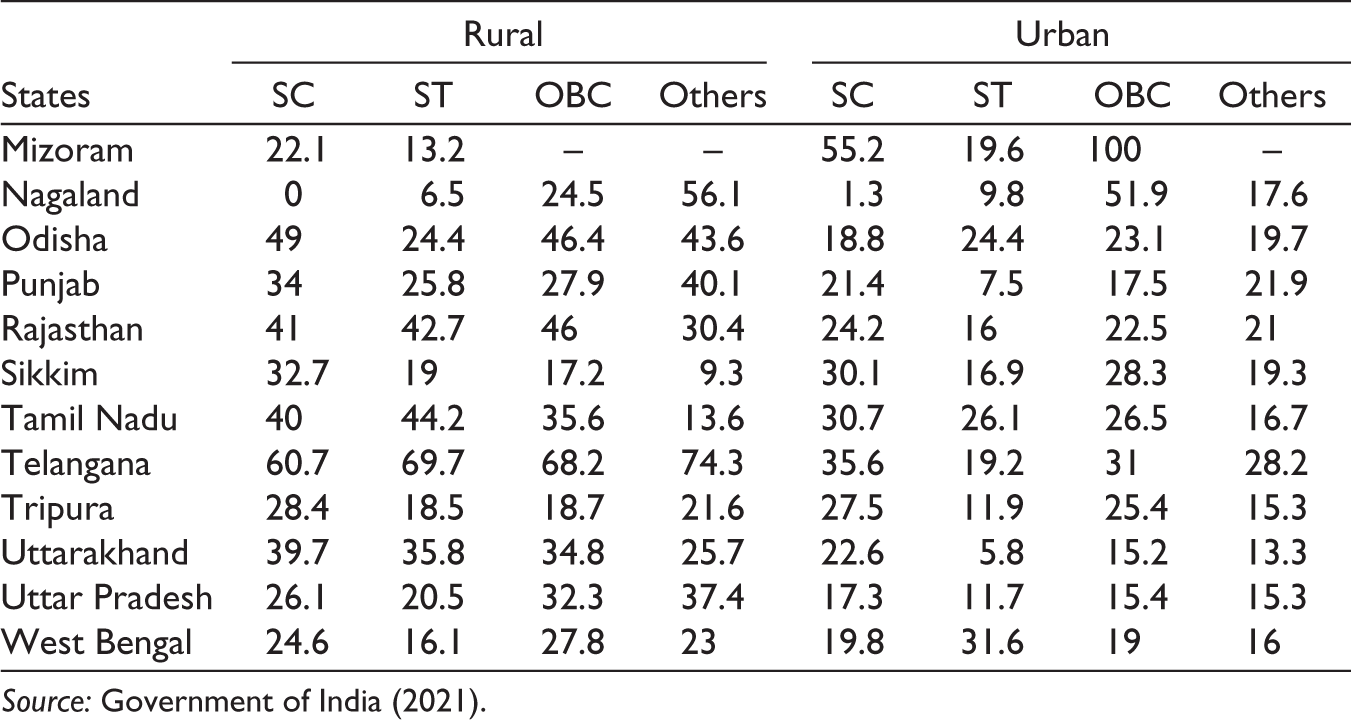
Source: Government of India (2021).
Footnotes
Declaration of Conflicting Interests
The author declared no potential conflicts of interest with respect to the research, authorship, and/or publication of this article.
Funding
The author received no financial support for the research, authorship, and/or publication of this article.