
Abstract
Qualitative comparative analysis (QCA) is an influential methodological approach motivated by set theory and boolean logic. QCA proponents have developed algorithms to analyze quantitative data, in a bid to uncover necessary and sufficient conditions where causal relationships are complex, conditional, or asymmetric. This article uses computer simulations to show that researchers in the QCA tradition face a vexing double bind. On the one hand, QCA algorithms often require large data sets in order to recover an accurate causal model, even if that model is relatively simple. On the other hand, as data sets increase in size, it becomes harder to guarantee data integrity, and QCA algorithms can be highly sensitive to measurement error, data entry mistakes, or misclassification.
Keywords
Qualitative comparative analysis (QCA) is an influential methodological approach motivated by set theory and boolean logic. It was originally developed in the 1980s to integrate and formalize tools for the comparative analysis of macro-historical social processes (Ragin 1987 2009). Since then, QCA has been deployed in thousands of published articles, in a wide variety of domains including political science, sociology, management, public health, environmental science, education, and criminology (Roig-Tierno, Gonzalez-Cruz, and Llopis-Martinez 2017).
QCA is perhaps best understood as a holistic “approach,” which aims to identify interwoven “conditions of occurrence” (Berg-Schlosser et al., 2009). It stresses the need to integrate qualitative analysis and more formal quantitative methods. To that end, QCA offers a set of tools and algorithms for the analysis of quantitative data (Berg-Schlosser et al., 2009). Proponents argue that those algorithms can uncover necessary and sufficient conditions in complex, conditional, and asymmetric causal relationships. They also suggest that QCA algorithms perform well in the analysis of small-to-intermediate data sets (e.g., 10 to 50 observations), where multiple regression may be less useful (Berg-Schlosser et al., 2009).
Several researchers have used computer simulations to probe the robustness and accuracy of the algorithmic tools developed in the QCA tradition (e.g., Baumgartner and Ambühl 2019; Hug 2013; Krogslund, Choi, and Poertner 2014; Lucas and Szatrowski 2014). These authors take the value of qualitative analysis as given and assess how well the QCA tool kit performs in quantitative data analysis. They manipulate features of the data or estimation procedure in experimental fashion to identify the conditions under which QCA routines yield correct answers.
This article builds on prior simulation-based work to highlight a vexing double bind. In most real-life applications of crisp set QCA, some combinations of explanators are more likely to occur than others. In such cases, the performance of available algorithms can suffer, 1 and the sample sizes that are needed to produce satisfactory results become much larger. When a sample increases in size, it becomes harder for researchers to guarantee data integrity. As this article shows, measurement error, data entry mistakes, classification problems, or typological ambiguity can have deleterious effects on QCA solution quality. 2 Thus, researchers in the QCA tradition often face a choice between studying small data sets with limited configurational diversity or large data sets with measurement error. In both contexts, QCA algorithms can fail to recover complete or truthful causal models.
In support of this argument, I present the results of extensive Monte Carlo experiments. These experiments yield three main conclusions. First, the sample size required for credible inference using QCA is much larger than is usually acknowledged in the literature. In the typical case where some combinations of explanators are more likely to occur than others, analysts have no guarantee that crisp set QCA will recover a simple four-variable model, even if the number of observations exceeds 300.
Second, a very small amount of measurement error can severely degrade the quality of QCA solutions. For instance, in data sets with 49 “good” observations and a single “bad” one, about 30 percent of the causal claims produced by a QCA algorithm are strictly incorrect. 3 Three mismeasured observations make the proportion of false causal claims jump to about 60 percent. 4 Even if the sample exceeds 300 observations, one would need exceptional data quality or configurational diversity to ensure that the routine produces less than 5 percent of incorrect claims. 5
Third, the tuning parameters that users select for their QCA algorithms can have a major effect on inference. For example, analyzing a data set with 300 observations, a single error, and the default consistency threshold of a popular QCA routine produces nearly 40 percent of false causal claims. Introducing three mistakes in a data set of 300 observations makes the share of false causal claims cross the 70 percent bar.
Beyond these substantive insights, this article also makes three methodological contributions to the simulation-based literature on QCA. First, I propose a flexible mechanism to manipulate configurational diversity in Monte Carlo simulations. This mechanism draws an explicit link between diversity and a quantity of great practical interest to empiricists: sample size. The results described below thus offer strong intuition about the sample sizes which ensure configurational diversity and about the number of observations that QCA users should make in order to draw credible inference about complex conditional processes.
Second, to test the effect of sample size and measurement error on QCA solutions, I introduce two new formal criteria: wrongness and completeness. Those two criteria measure the extent to which QCA solutions are compatible with the data generating process. In addition, I evaluate the performance of QCA algorithms by adapting a measure of classification accuracy which is standard in the statistics and machine learning literatures: root mean squared error (RMSE). Taken together, those three criteria offer a more comprehensive and fine-grained view of QCA performance than is typical in simulation studies.
Third, the results reported in this article improve on prior work by taking to heart two major critiques of QCA simulation studies. To begin, my simulations consider that even if a QCA solution does not match the complete true model, that solution could still be a correctness-preserving submodel of the truth (Baumgartner and Thiem 2017b). In addition, my simulations take into account the presence of model ambiguities, that is, the possibility that several boolean causal models could be consistent with the observed data (Baumgartner and Thiem 2017a; Rohlfing 2015). Since very few (if any) simulation studies answer both of these challenges, the results presented here constitute an important step forward in terms of offering a credible assessment of QCA performance.
Taken together, the results of this study suggest that QCA analysts face a double bind: When configurational diversity is limited, QCA algorithms need large samples to recover complex boolean models of conditional causal processes. As we increase the size of our samples, however, measurement error risks being introduced, and this can negatively affect the performance of our algorithms. This conclusion reinforces the crucial role that qualitative analysis must play in QCA, as it can help guard against measurement error and limit the inferential risk posed by incorrect algorithmic solutions.
A Double Bind
In its original incarnation, QCA was developed for the analysis of substantive problems where a relatively small number of cases could be compared. Later, QCA algorithms were used to analyze much larger data sets, with observations numbering in the thousands. Yet, most QCA methodologists still tout its advantages in the analysis of data sets of small-to-intermediate size, and this remains the predominant use case.
To illustrate, I collected data on the number of cases studied in 199 peer-reviewed articles published between 2016 and 2019 using QCA techniques. Twenty-five percent of those studies considered fewer than 25 cases, and 50 percent leveraged information on less than 63 cases. Figure 1 shows the full distribution of sample sizes across the 199 studies. 6 Based on these data, it seems fair to say that the performance of QCA in relatively small samples remains critical.
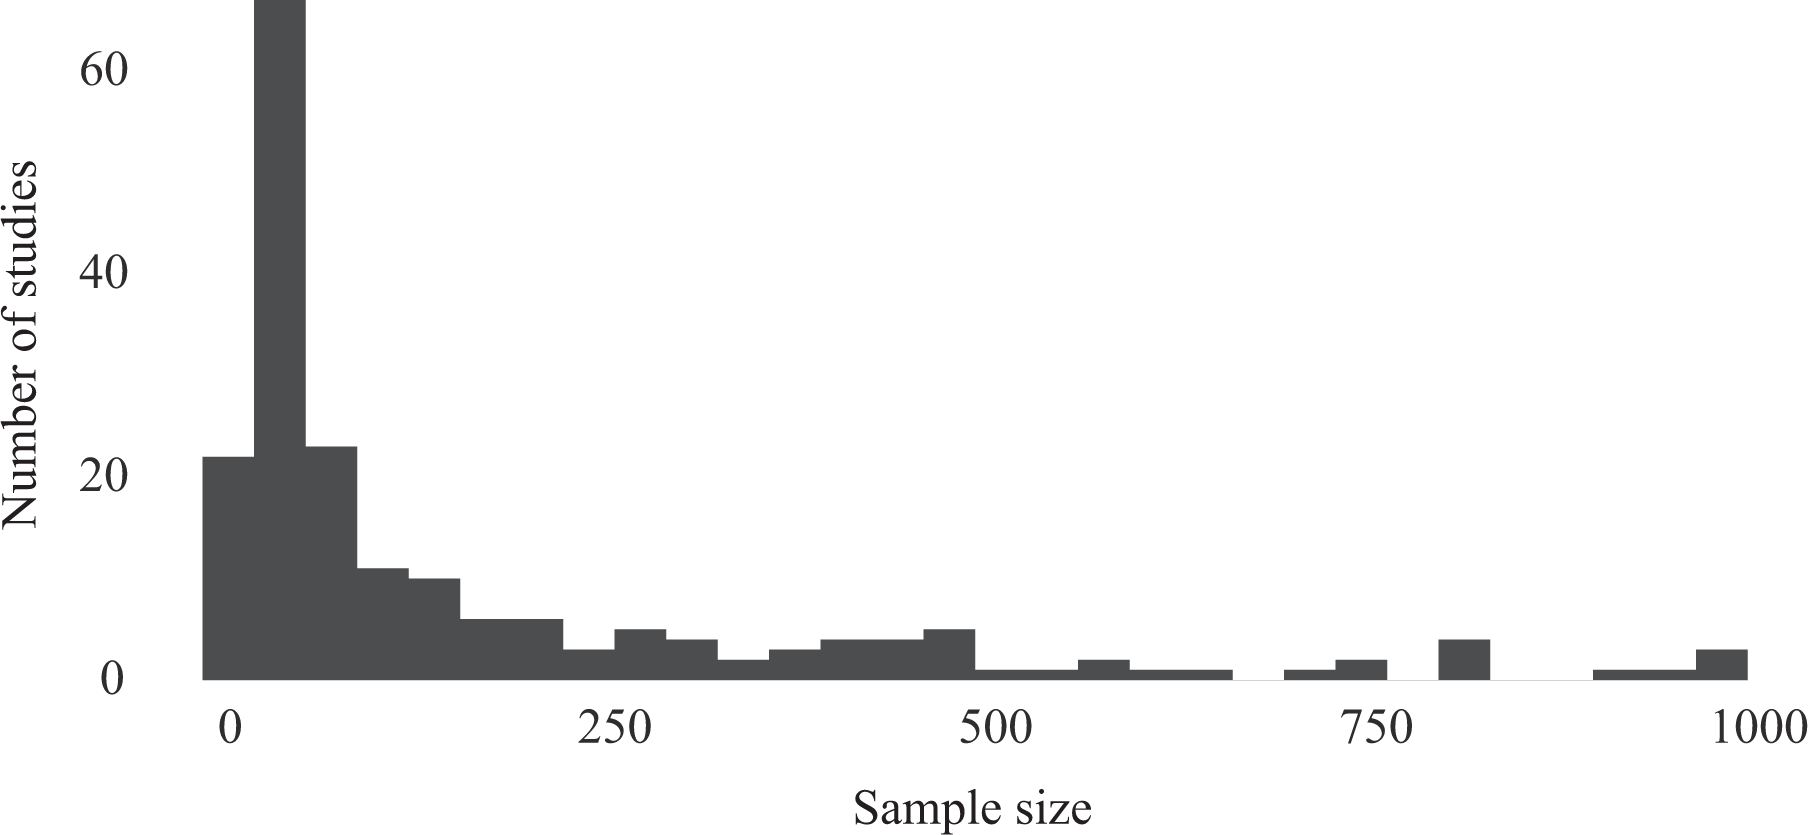
Number of cases considered in 199 qualitative comparative analysis applications (2016–2018).
One important practical challenge is that if the number of observations is limited, configurational diversity may also be limited. As all practitioners know, some combinations of explanatory factors are usually more likely to occur than others in real-life data sets. Missing data can also limit the types of cases that one can consider for analysis. Often, some combinations of causal factors are not observed at all. When configurational diversity is limited, QCA algorithms may fail to recover the full causal model.
The most obvious way to improve configurational diversity is to collect more data. However, increasing the sample size comes with an important drawback. As more units are observed, it becomes more difficult to guarantee the integrity of our data sets, that is, it becomes more difficult to limit measurement error.
Measurement error comes in different flavors. In its simplest form, it could be the result of a simple data entry mistake, when a researcher (or research assistant) fails to record the correct value for a given unit of observation. It can also arise at the data processing stage, as in the case of Reinhart and Rogoff (2010), who mistakenly excluded five important countries from their analysis of public debt and economic growth (Thomas, Michael, and Robert 2014). Measurement error can also be introduced before analysts even get a hold of their data. For example, in 2014, the gross domestic product of Nigeria doubled overnight, following an overdue recalculation by the country’s National Bureau of Statistics (Mezue 2014). Similarly, Linsi and Mügge (2019) show that international economic statistics are systematically biased, and Kerner, Jerven, and Beatty (2017) suggest that national statistical agencies could be engaging in “aid-seeking data management.” Of course, measurement error could also be related to ambiguities of a more conceptual nature. If a researcher’s theory is imprecise, observable units could be misclassified or mischaracterized, which has important implications for the analysis of sufficient and necessary conditions.
The goal of this article is to measure analysts’ ability to escape the double bind posed by limited configurational diversity and measurement error. To put this exercise in proper context, it is useful to note that the task that QCA routines set for themselves is a very difficult one because their search target is more complex than that of typical regression analyses. It is obviously more difficult to recover a complex boolean ordering than a simple conditional expectation. The fact that QCA researchers often try to recover complex models from limited data compounds the difficulty. Under these circumstances, it should not be surprising to find that measurement error and sample size have some effect on the performance of QCA algorithms. As always, what matters is that practitioners know where a tool can be expected to perform well and that they be able to assess the degree of scientific uncertainty that remains postanalysis. 7
In that constructive spirit, the next section introduces three fine-grained evaluation criteria which can be used to evaluate the performance of QCA algorithms. These formal criteria are then put to use in extensive Monte Carlo simulations. The results offer some of the most credible estimates to date of the performance of crisp set QCA in a range of realistic conditions.
Evaluation Criteria
To evaluate the fitness of QCA solutions, I adopt two complementary strategies. The first approach is most common in the field of qualitative comparative analysis, where complex combinations of causal factors are the main object of interest. The second approach is more common in the fields of statistics and machine learning, where classification (or predictive) accuracy is often a central concern.
Data Generating Process
The goal of QCA algorithms is typically to find a complex boolean ordering over a set of causal factors. Therefore, when evaluating the performance of a QCA solution, it makes sense for simulation studies to test whether that solution is logically compatible with the true data generating process. To do this, I propose two new fitness criteria: wrongness and completeness.
The wrongness and completeness concepts build on work by Baumgartner and Thiem (2017b), two leading QCA methodologists who formulated sharp rebukes of prior simulation-based work in this field. In a recent Sociological Methods & Research article, these authors claim that although QCA is “often trusted,” it is “never (properly) tested.” The crux of their critique is simple, yet powerful: In the face of causal complexity, QCA may not always retrieve the full model of the truth, but it can nevertheless identify “submodels” that are consistent with the truth.
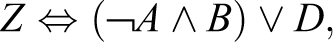
For example, consider an event Z which occurs if at least one of three conditions obtains:
Intuitively, a correctness-preserving submodel is a set of conditions which are simpler than the reference model, while remaining logically consistent with that benchmark. In other words, even if a submodel does not capture the full truth, the factors that it identifies as relevant still lie on the causal path to the outcome variable. 8 Since most existing simulation-based tests do not take submodels into account, they could overstate the practical problems of QCA.
To improve the credibility of simulation results, I introduce two fine-grained and complementary measures of solution fitness:
Wrongness: A QCA solution is “wrong” if at least one of its submodels is not a submodel of the truth. I measure the level of wrongness by counting the proportion of solution submodels that are not submodels of the truth.
Completeness: A QCA solution is “complete” if all the submodels of the truth are submodels of the QCA solution. I measure the level of completeness by counting the proportion of submodels of the truth that are also submodels of the solution.
Roughly speaking, we can think of a QCA solution as allowing analysts to make a certain number of claims about causally relevant variables. Wrongness measures the share of causal claims that are ostensibly supported by the QCA solution but which are in fact erroneous. Completeness measures the share of possible true claims that our QCA solution captures. 9
Classification Accuracy
Researchers who work in the QCA tradition do not usually report measures of classification accuracy, since classification is not always considered to be an explicit goal of QCA analysis. Nevertheless, it can be useful to approach the problem from this perspective, since it allows us to build a bridge between QCA and conventional statistics; classification-based fitness criteria can easily be understood and interpreted by researchers working in both traditions.
One natural way to measure the performance of QCA solutions in terms of classification power is to test whether a given QCA solution correctly classifies units with different combinations of explanatory variables. For example, if the true model of the world is

and if an individual has traits
we would expect that same individual to exhibit
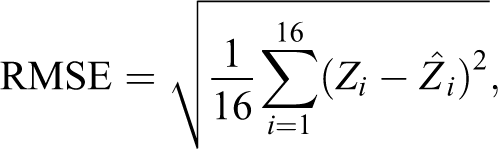
where Zi
is the true value of Z for the ith configuration, and
Simulation Design
To test the performance of QCA, I take three steps: (1) simulate hundreds of thousands of data sets governed by a known causal model; (2) estimate QCA models to extract solutions from each data set; 10 and (3) measure the wrongness, completeness, and RMSE of each solution. Figure 2 gives a more detailed description of this Monte Carlo design.
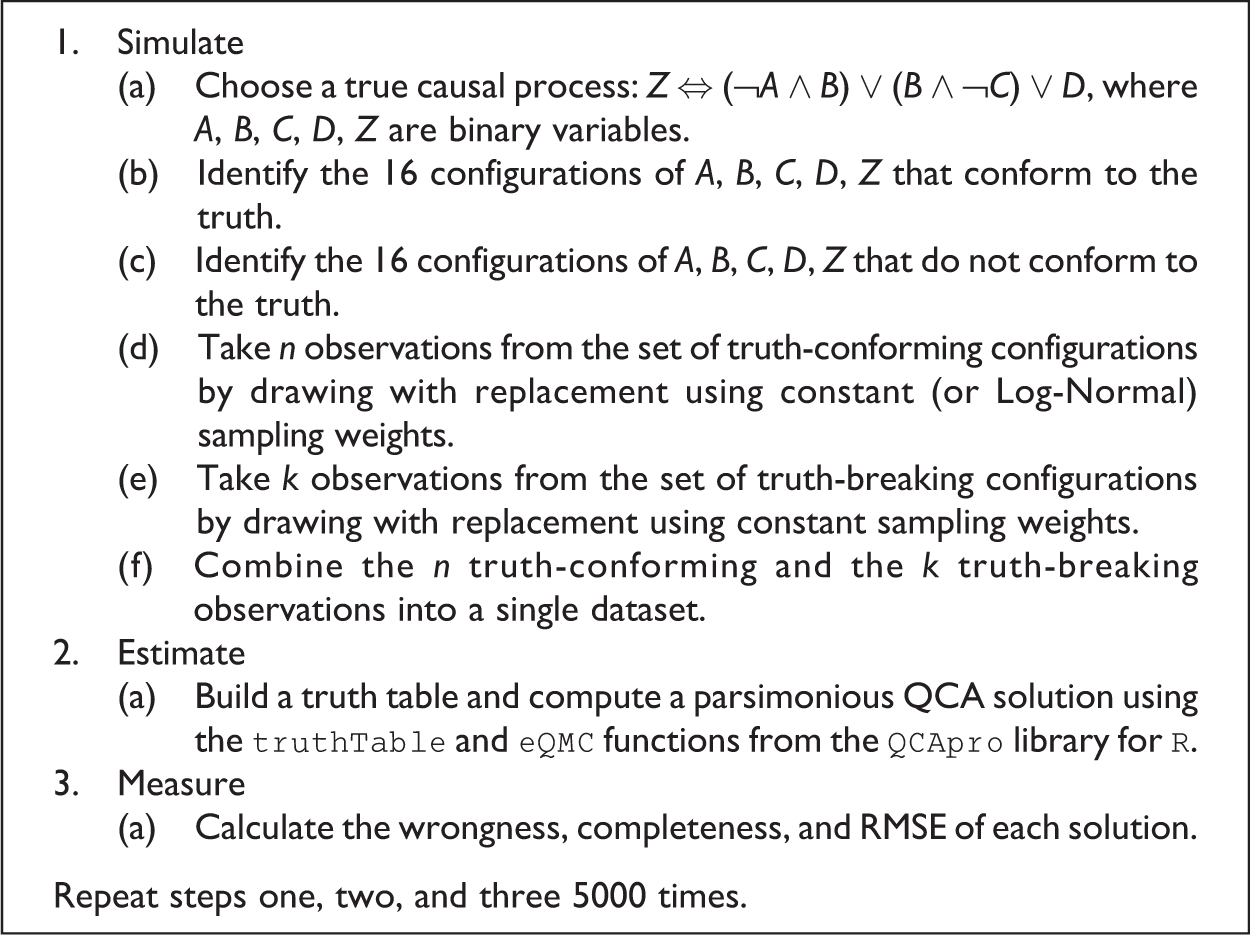
Monte Carlo simulation design.
For continuity and simplicity, I consider the same data generating process as in Baumgartner and Thiem (2017b). Each data set includes five binary variables which conform to this law:
Sample Size and Configurational Diversity
As mentioned above, it seems reasonable to expect that configurational diversity will affect the quality of solutions proposed by a QCA algorithm. Consider the same case as above, where five binary variables are related by this law:
Unfortunately, even if drawing a link between configurational diversity and QCA solution quality is commonplace, that link is of limited use to practitioners. Unless all the possible combinations of explanators are actually observed, data analysts will never be certain that their data are diverse enough because this would require a priori knowledge of the true causal model. 11 In this article, I use explicit distributional assumptions to tie the concept of configurational diversity to the size of a data set. This is an important contribution because it can help analysts develop intuition about the sample size that they need to draw credible inference using QCA.
In an ideal world, each truthful configuration of explanators would occur with equal frequency in our data sets. This guarantees a certain level of configurational diversity, even with relatively few data points. As every analyst knows, however, some configurations of variables are much more likely to occur than others in real-life data sets.
To operationalize this intuition, I create simulated data sets with sample sizes ranging from 20 to 300. In some simulations, I assign a constant sampling weight to each true configuration of
Figure 3 illustrates the distinction. In the unrealistic best-case scenario, where each truthful configuration has the same chance of occurring (constant sampling weights), we need a sample size of just under 100 observations to reach full configurational diversity. When some configurations are more likely than others (log-normal sampling weights), even a large sample size (e.g.,
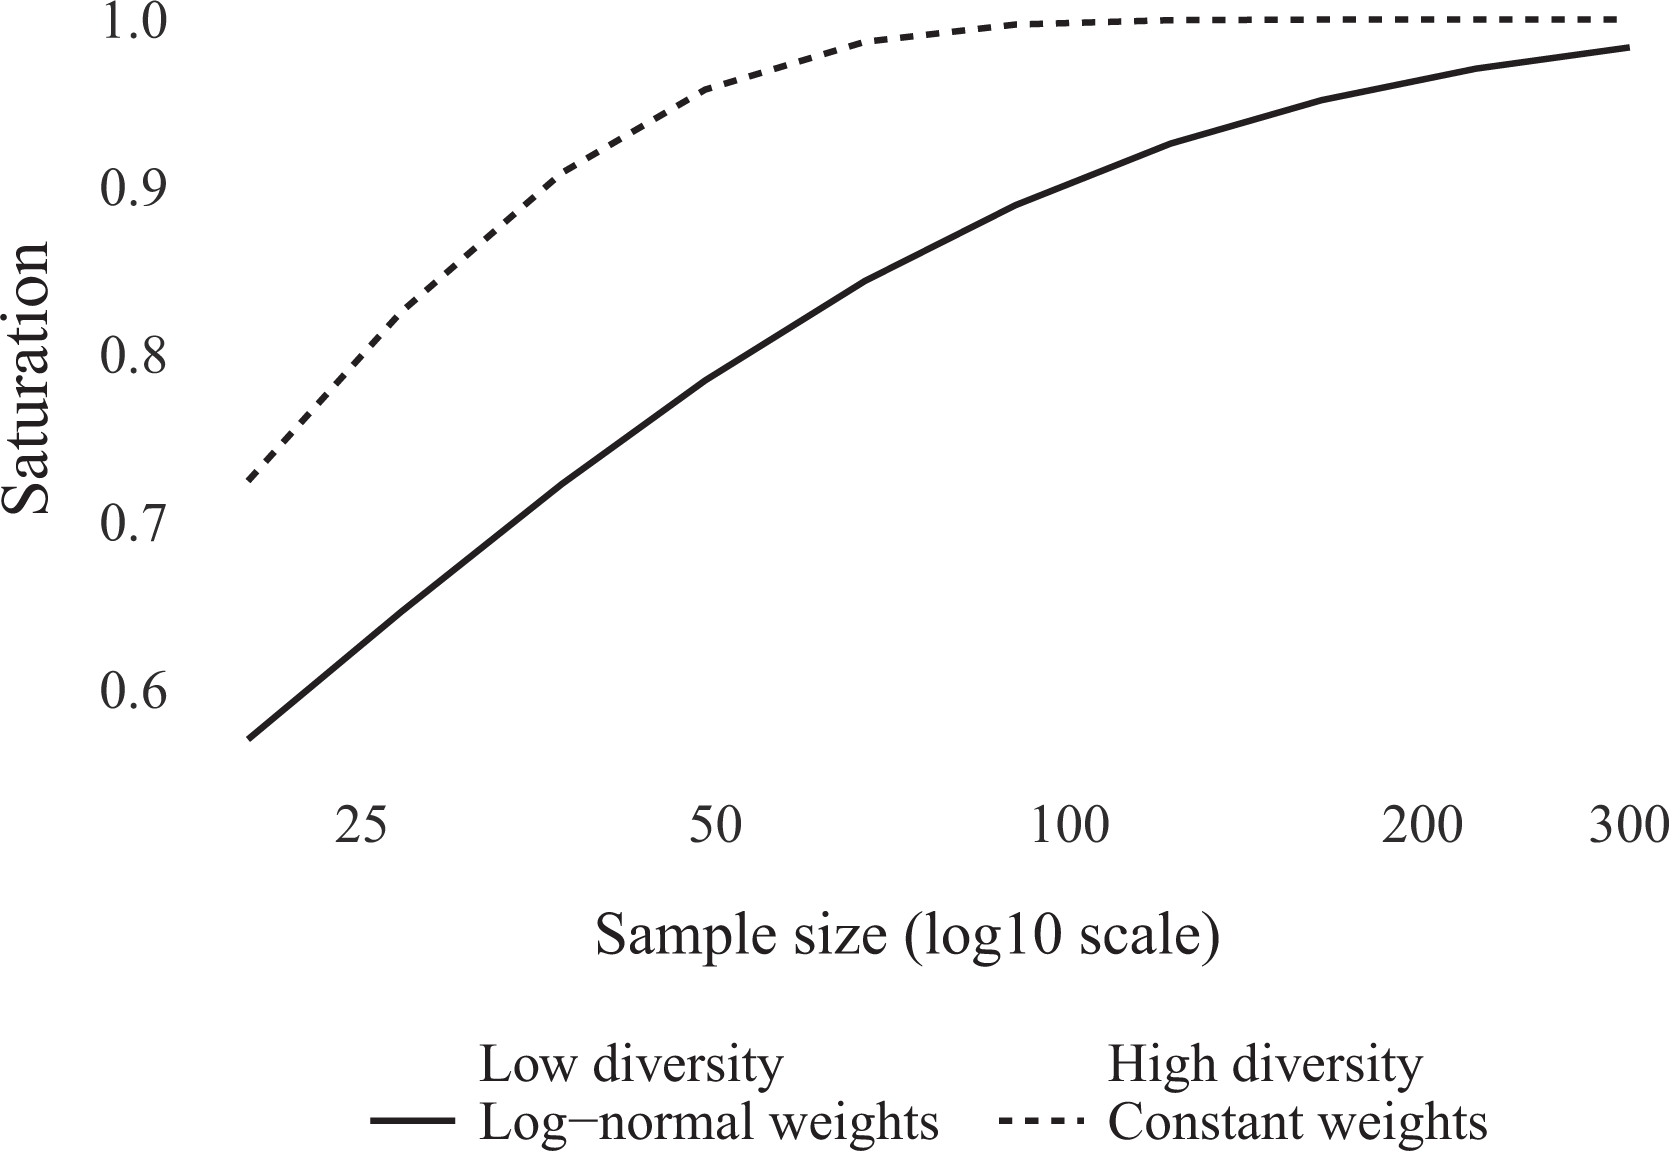
On average, what share of the 16 truthful configurations of
Measurement Error
To study the effect of measurement error, I introduce 0, 1, 2, or 3 randomly selected “bad” observations in each data set. An observation is considered “bad” if its combination of
Consistency and Overfitting
Ragin (2006:292) introduced the concept of “set theoretic consistency” to QCA analysis, defining it as “the degree to which the cases sharing a given condition or combination of conditions […] agree in displaying the outcome in question.” Many modern QCA software routines allow users to define a consistency threshold, which relaxes the need for every case to conform exactly to a single causal process. It is well-known that QCA can overfit data when the consistency thresholds of algorithms are set too high (Schneider and Wagemann 2012). Thus, when analysts expect some measurement error, it makes sense for them to choose a lower threshold. As Rohlfing (2015) argues, ignoring overfitting in simulation studies could produce misleading results.
To explore the importance of user-selected settings for QCA performance, I report two sets of results: one with the consistency threshold set to 1.0 and the other with the consistency set to 0.75. The 1.0 threshold is important because it could be selected by applied researchers who mistakenly believe that their data are error free. It is also the default threshold used by several QCA software routines. Even if applied researchers have access to clear guidelines and best practices, we know that software defaults remain extremely important because they have strong behavioral effects. The 0.75 threshold is also important because it reduces the likelihood of overfitting and because it has become a focal point of sorts in both applied work and simulation-based studies (Baumgartner and Ambühl, 2019).
Model Ambiguities
Wrongness, completeness, and RMSE are solution-level criteria. However, QCA algorithms often propose a “model space” composed of several candidate solutions rather than a single solution. For instance, in the thousands of simulations conducted for this article, QCApro produced a unique solution in 77 percent of cases, two candidates in 13 percent of cases, and three in 2 percent of cases. At the other end of the spectrum, one data set yielded a model space with 72 candidates.
The ability to offer several solution candidates is an important feature of QCA routines. Indeed, it has long been recognized that several logical models can be compatible with the same set of configurational data (Simon 1954; Sprites, Glymour, and Scheines 2000). When empirical data underdetermine their own causal modeling, the proper thing to do is to display epistemological humility and to propose the full range of data-consistent model candidates.
In a recent contribution, Baumgartner and Thiem (2017a) argue that model ambiguities are widespread in real-life applications of QCA and that failure to consider the full range of data-consistent models can lead researchers astray. Baumgartner and Thiem (2017b) also point out that when a QCA routine produces several model candidates, those candidates should be interpreted disjunctively. A QCA routine succeeds if it includes the correct model as one of the candidates in its model space. Clearly, model ambiguity needs to be considered in any simulation exercise (Rohlfing 2015).
To move from the solution level of analysis to the model space level of analysis, we thus ask the following question: How good is the best solution in each model space? More specifically, to measure the wrongness of a QCA model space, we take the minimum level of wrongness of all the solution candidates. To measure completeness, we take the maximum level of completeness. 14 To measure the RMSE, we take the minimum RMSE.
Focusing on the best available solution is generous to the QCA algorithm, it is logically correct, and it is consistent with prior methodological work. One potential downside of that approach is that it could yield simulation results which are less directly relevant to applied researchers. Indeed, practitioners will never know which of the proposed candidates is the best one in any given application. Focusing on maximum completeness and minimum wrongness could also favor less informative methods which generate a lot of candidate solutions. For instance, a model space with 50 candidates could have perfect scores on all criteria, even if it includes 49 wildly incorrect solutions. Despite these trade-offs, the proposed treatment of model ambiguities seems like the most principled approach.
For the rest of the analysis, we will only consider the best available QCA solution in any given model space. In the discussion of results, a claim such as “X percent of the causal claims are correct” will be shorthand for “X percent of the causal claims compatible with the best QCA solution in the model space are correct.”
Results
Figure 4 reports the average level of wrongness of QCA solutions. 15 The most striking finding is that when using the default consistency threshold of 1.00, a single truth-breaking observation suffices to lead QCA routines astray in a large proportion of data sets. 16 In a sample of 300 observations with a single bad case, about 38 percent of the causal claims which are ostensibly supported by QCA turn out to be false. Introducing three bad observations (of 300) makes the proportion of false causal claims jump above 70 percent. Importantly, the wrongness does not improve as we increase the number of “good” observations in the data set.
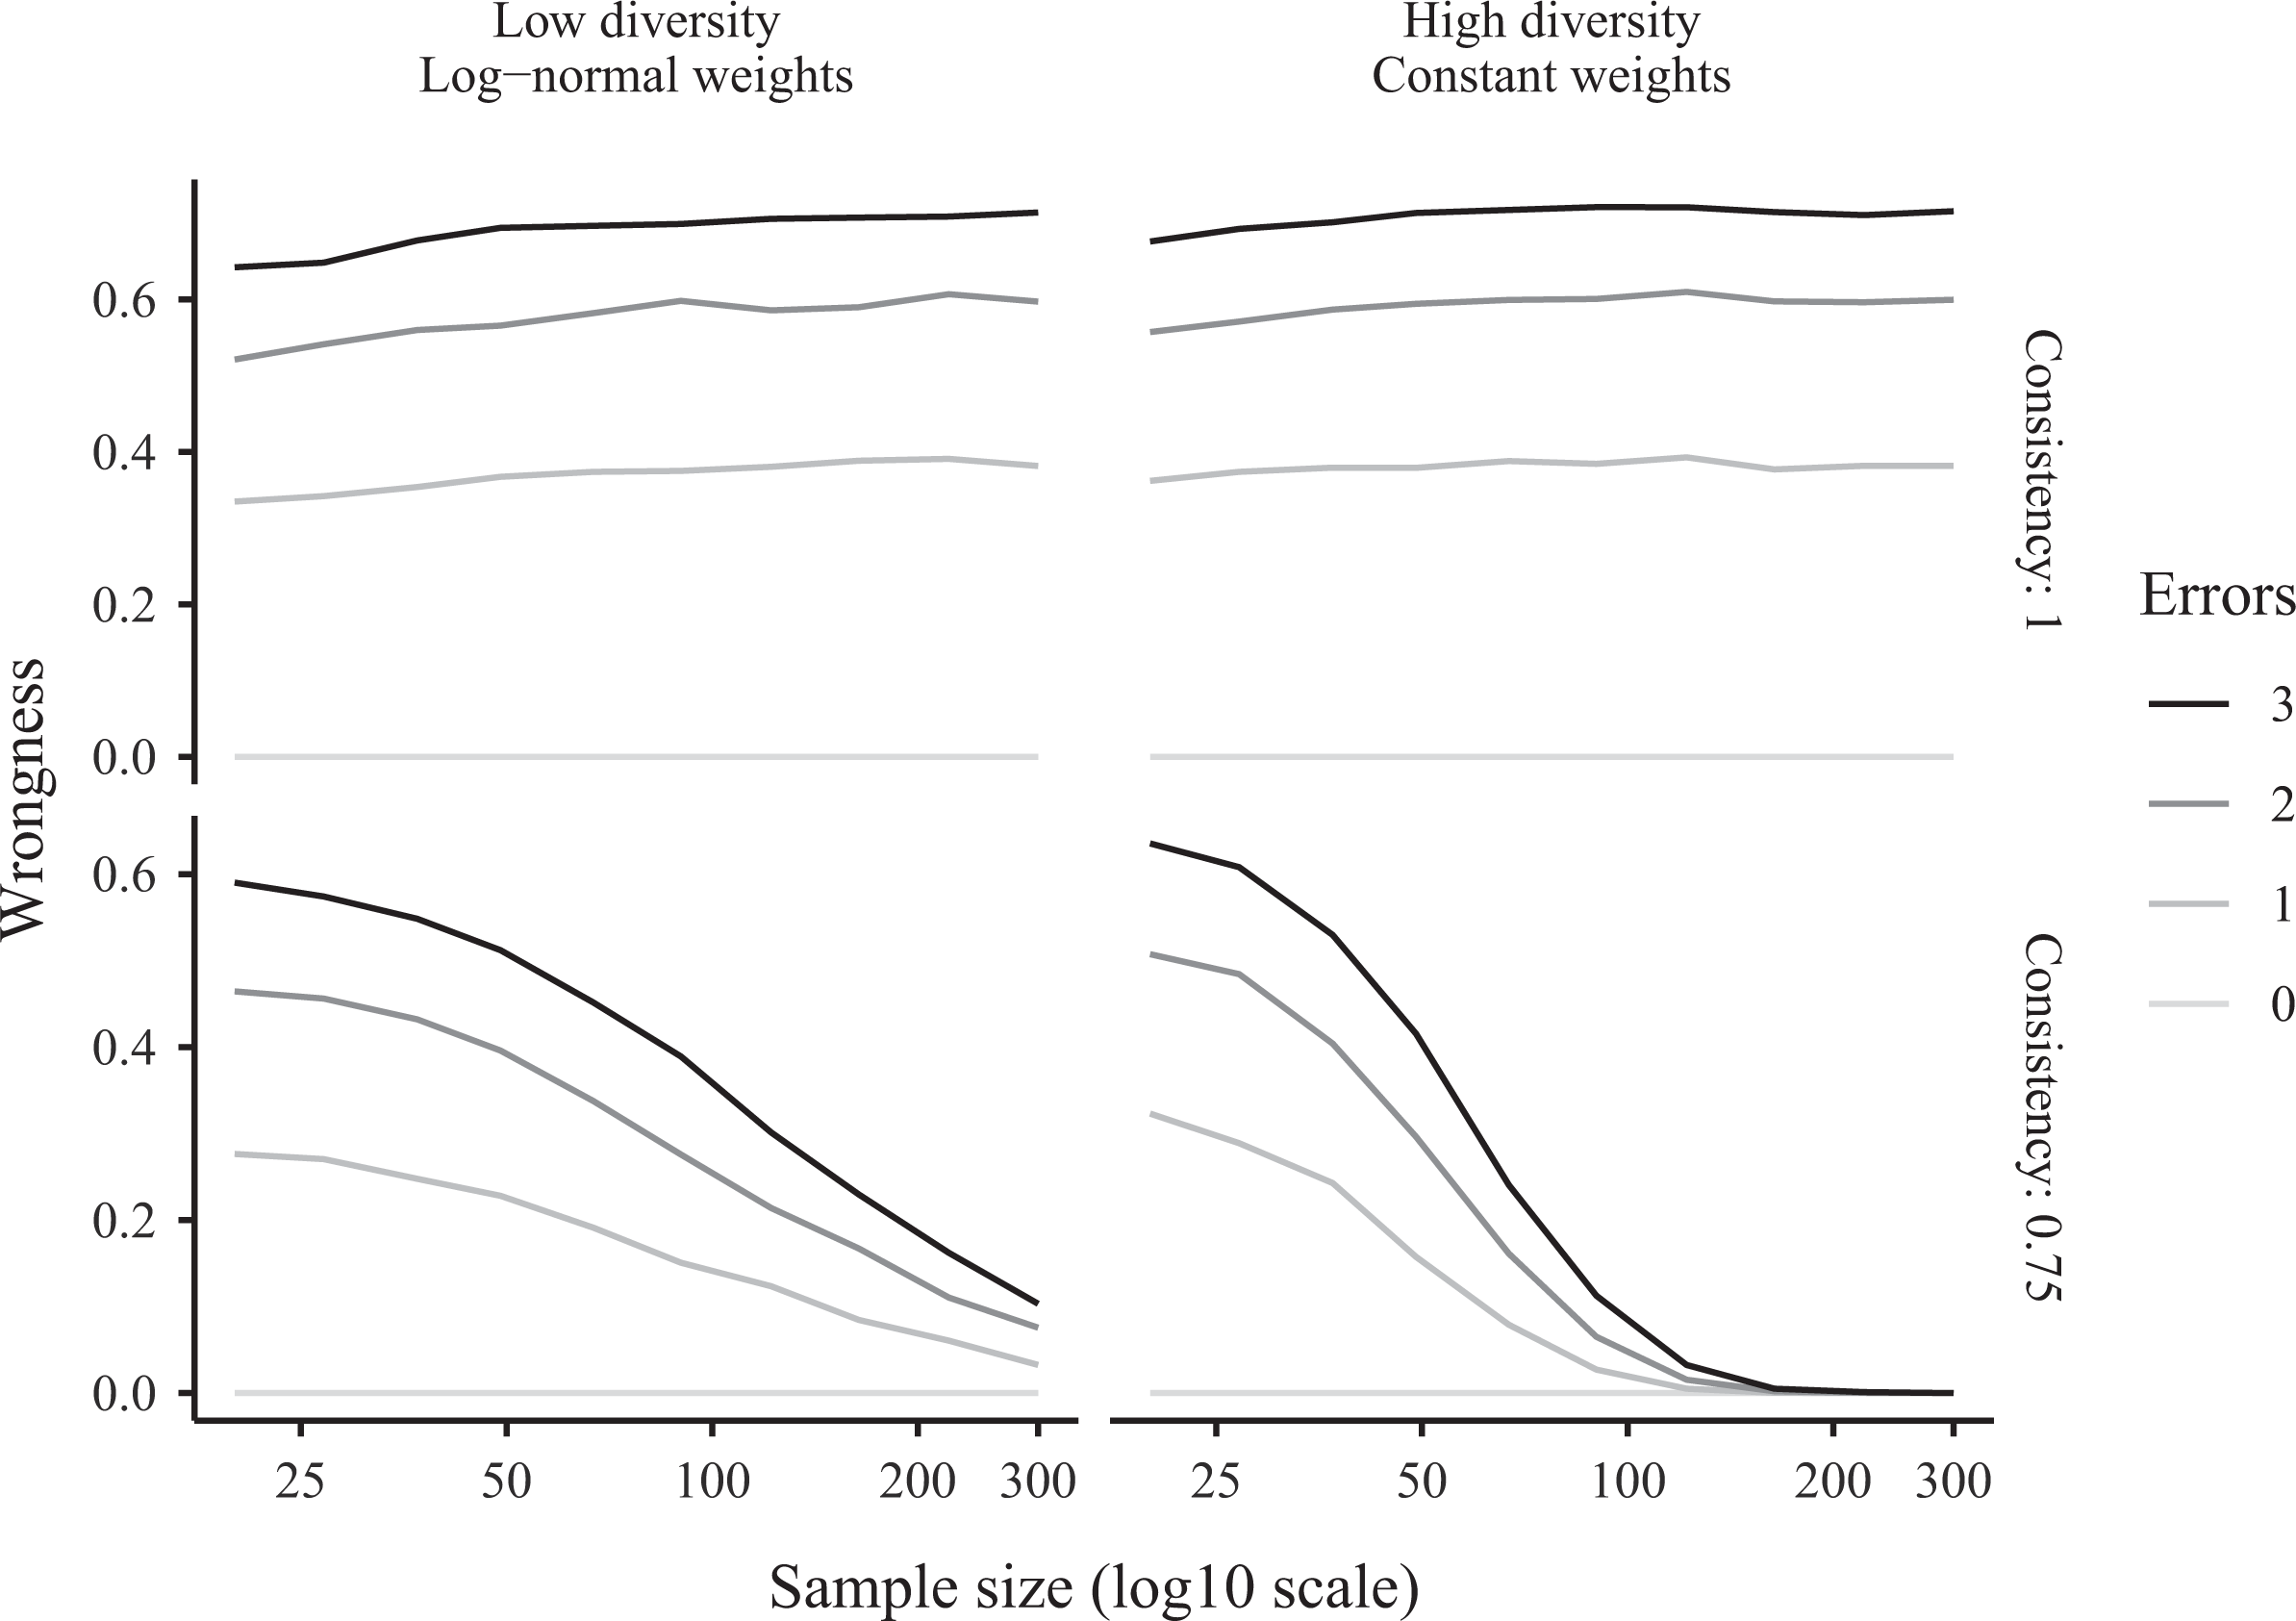
Average wrongness of parsimonious qualitative comparative analysis solutions in Monte Carlo simulations.
Setting the consistency threshold to 0.75 improves matters considerably but only in large data sets. Moreover, the level of wrongness remains high in most realistic settings. For instance, when the sample includes 20 good units and 1 erroneous observation, QCA produces about 30 percent of incorrect causal claims. When there are three erroneous observations, about 60 percent of causal claims are incompatible with the truth. When the sample size includes 50 units with one error, about 20 percent of solution submodels are wrong. In short, to ensure that a QCA algorithm will produce an acceptable number of false claims, researchers need to analyze a large data set of exceptional quality using the correct tuning parameters.
Figure 5 reports the average level of completeness of QCA solutions. The first conclusion to draw is that the sample size required to recover a complete boolean model is much larger than is typically acknowledged in the literature. Unless a sample includes over 70 observations, QCA routines are unlikely to recover the full causal process, even in a simple four-variables case. Moreover, when some configurations are more likely to be observed than others, the rate of convergence toward 100 percent completeness slows down considerably. When some configurations are observed more frequently than others, researchers will typically need over 300 observations to recover a complete model. 17
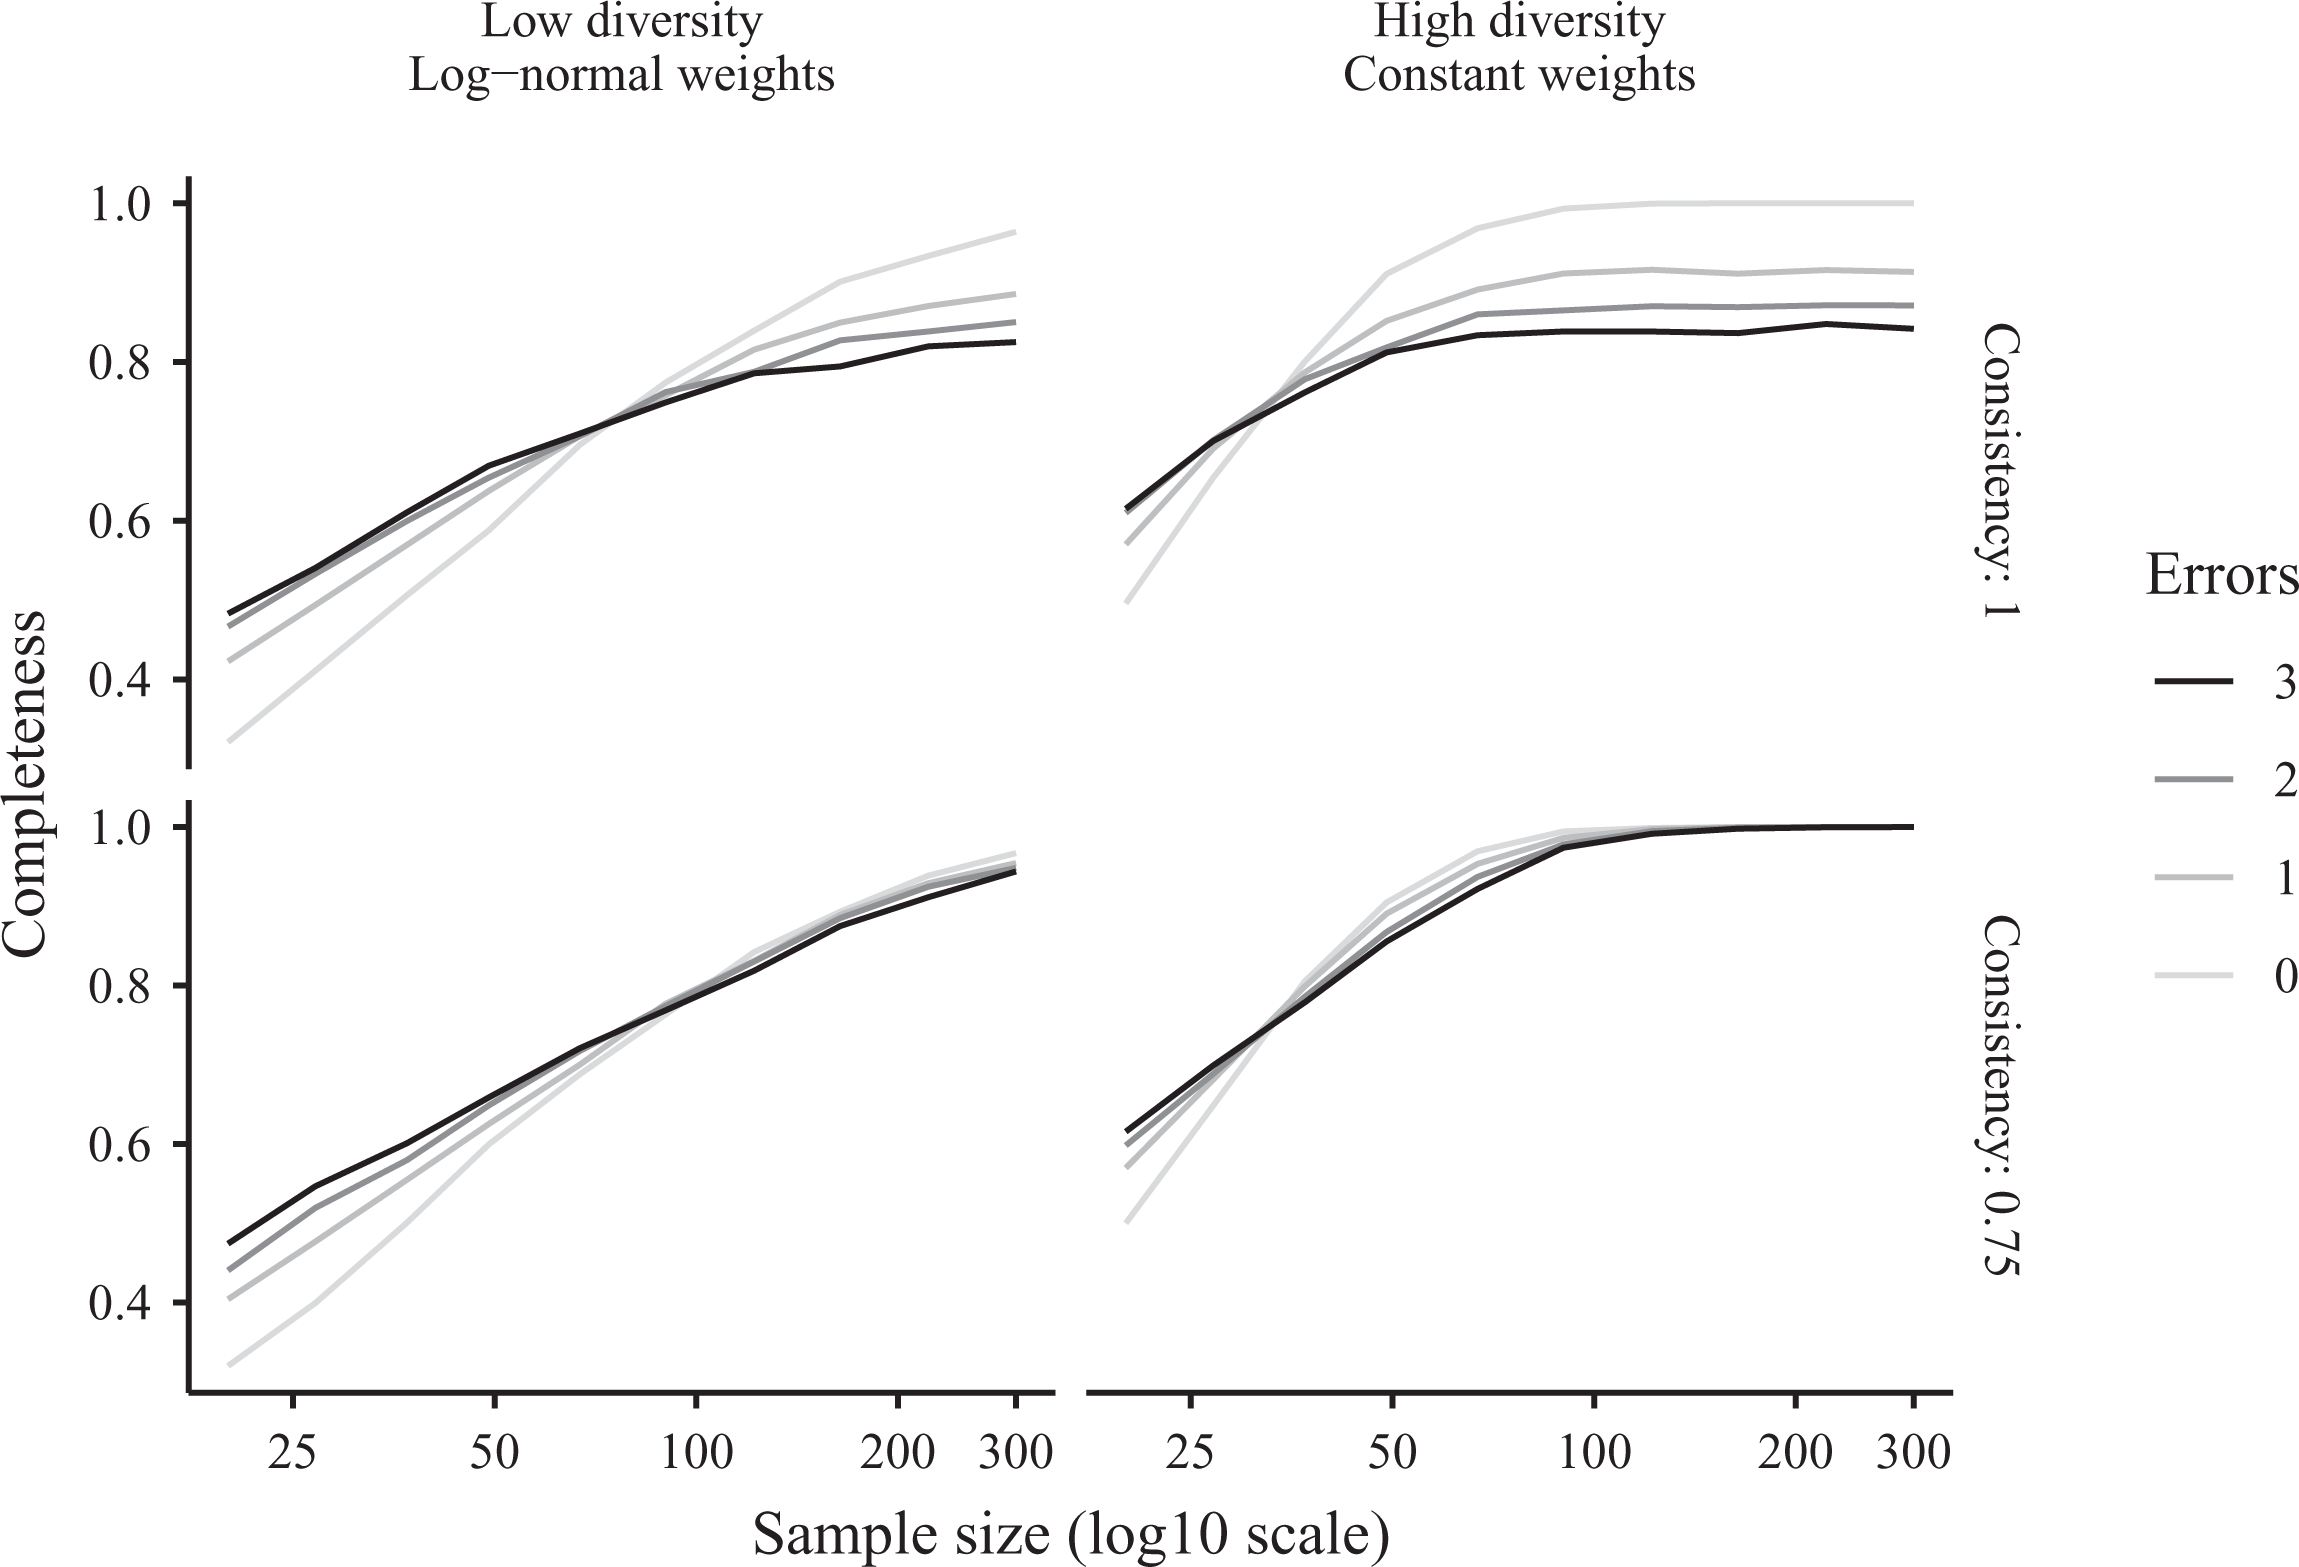
Average completeness of parsimonious qualitative comparative analysis solutions in Monte Carlo simulations.
The second result to notice is that, in the presence of measurement error, the consistency threshold has an important effect on performance: The top right panel shows a substantial decrease in completeness when errors are introduced, but not the bottom right panel. This reinforces the idea that users should be extremely careful when choosing the tuning parameters of their preferred QCA software. Given that measurement error is ubiquitous in social science and considering the powerful effect that software defaults can have on user behavior, these results also suggest that QCA software developers must seriously consider the default parameters of their routines.
These results also show that, in most real-life applications, limited configurational diversity forces researchers to use large data sets if they hope to recover complete QCA solutions. Unfortunately, as we increase the size of data sets, it becomes harder to guarantee data integrity, and QCA routines can produce false causal claims in the presence of measurement error.
So far, we have assessed whether QCA solutions are compatible with the data generating process used to simulate data. A complementary approach is to measure the classification accuracy of QCA solutions. Figure 6 reports the average RMSE of the solutions computed for the same simulated data we used thus far. The results suggest that measurement error, sample size, configurational diversity, and tuning parameters can have important effects on performance.
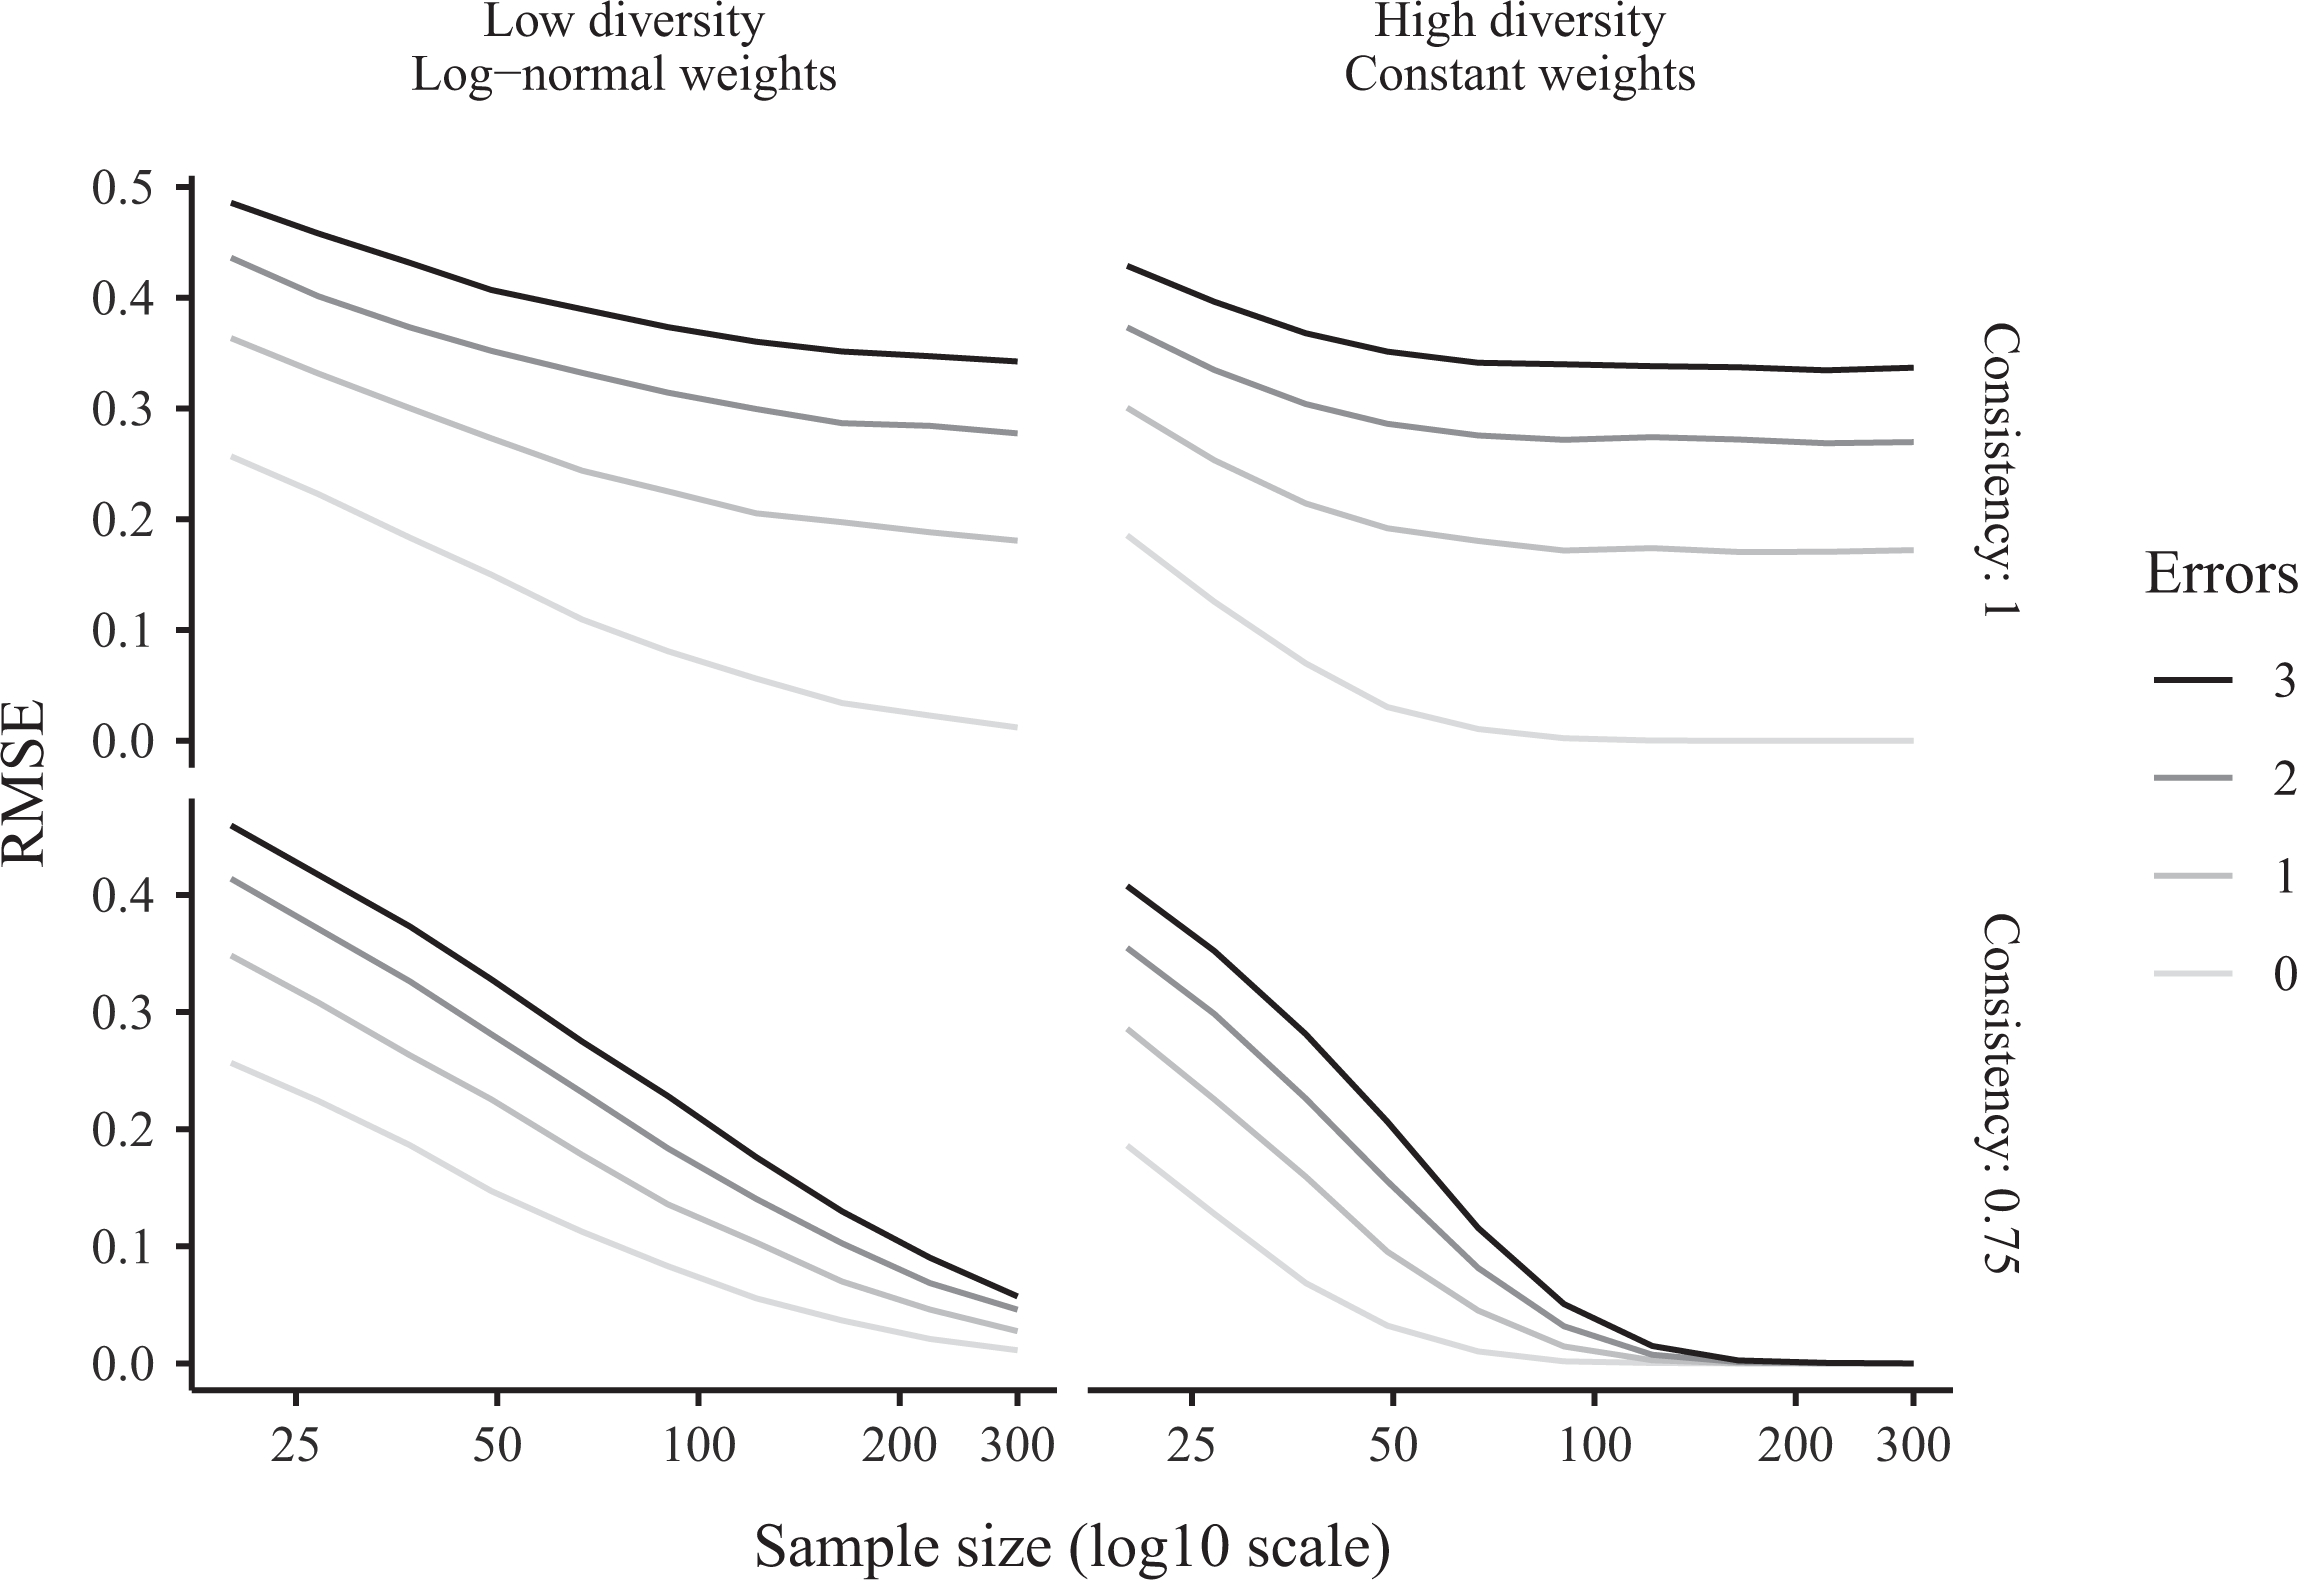
Root mean squared error of parsimonious qualitative comparative analysis solutions calculated in Monte Carlo simulations.
Specifically, Figure 6 shows that introducing a single error can sometimes increase the RMSE of a QCA model space by 100 percent or more. With the exception of cases where the sample is very large and configurational diversity is high, introducing a single error increases RMSE by at least 50 percent. Introducing three errors can increase the RMSE by a factor of three or four.
Figure 6 also offers good news for QCA advocates: RMSE trends downward as the sample size increases, and this downward trend is accelerated when users select appropriate tuning parameters. To minimize classification error, the main challenge is, again, to increase the sample size while preserving data integrity.
Conclusion
This article introduced two new formal criteria, and adapted a third one, in order to evaluate the performance of QCA in simulated data: wrongness, completeness, and RMSE. These criteria have intuitive interpretations and allow us to take into account two major critiques of prior simulation-based efforts to evaluate QCA. Specifically, the simulations described above take into account the possibility of model ambiguities, and the importance of correctness-preserving submodels (Baumgartner and Thiem 2017b; Rohlfing 2015).
Based on extensive Monte Carlo simulations, I conclude that crisp set QCA algorithms can be very sensitive to measurement error. In principle, analysts could circumvent this problem by building small data sets that are completely error free. Unfortunately, the results presented here also suggest that QCA requires rather large data sets in order to work effectively.
Given the vast potential for human error at all stages of the scientific process—from the development of a typology, to measurement, classification, and data entry—it seems likely that most large (or even medium) sized data sets will contain some measurement error. Unless data analysts can guarantee that their data sets are completely error free, and unless they can pick optimal tuning parameters for QCA algorithms, prudence in interpretation is warranted.
Debates on the value of QCA often revolve around the distinction between deterministic and probabilistic types of arguments. But one does not need to make strong ontological commitments to conclude that the extreme sensitivity of QCA algorithms to measurement error is a major problem; all one needs to do is acknowledge that the social scientists who build data sets are human and fallible. The field of statistics was transformed in the 1980s by the development of robust high breakdown point estimators, which could yield reliable inference in the presence of outliers (Huber, 1981). If QCA proponents want the approach to flourish, they will likewise need to innovate and offer algorithms that are more robust to mild departures from the ideal world.
Footnotes
Acknowledgment
The author thanks Damien Bol, Gabrielle Péloquin-Skulski, Bear Braumoeller, Christopher Winship, and two excellent reviewers.
Declaration of Conflicting Interests
The author(s) declared no potential conflicts of interest with respect to the research, authorship, and/or publication of this article.
Funding
The author(s) received no financial support for the research, authorship, and/or publication of this article.