
Abstract
In factorial survey designs, respondents evaluate multiple short descriptions of social objects (vignettes) that experimentally vary different levels of attributes of interest. Analytical methods (including individual-level regression analysis and multilevel models) estimate the weights (or utilities) assigned to the levels of the different attributes by participants to arrive at an overall response to the vignettes. In the current paper, we explain how data from factorial surveys can be analyzed in a structural equation modeling framework using an approach called structural equation modeling for within-subject experiments. We review the use of factorial surveys in social science research, discuss typically used methods to analyze factorial survey data, introduce the structural equation modeling for within-subject experiments approach, and present an empirical illustration of the proposed method. We conclude by describing several extensions, providing some practical recommendations, and discussing potential limitations.
In factorial surveys (sometimes referred to as vignette studies), respondents are asked to evaluate multiple vignettes, which are short descriptions of social objects that experimentally vary attributes of interest (Auspurg and Jäckle 2017). This experimental variation allows researchers to quantify the effect of each of the attributes on respondents’ evaluations (Auspurg and Hinz 2015; Auspurg and Jäckle 2017; Dülmer 2016; Shamon, Dülmer, and Giza forthcoming; Su and Steiner 2020). The aim of factorial surveys is to estimate the relative contribution of different levels of each attribute to overall evaluations (Wallander 2009). For instance, a researcher could use a factorial survey to assess the impact of different levels of racial diversity (the attribute) in a neighborhood (the social object) on willingness to live there (the evaluation; Emerson, Chai, and Yancey 2001). In such a study, respondents would be asked to rate their willingness to live in neighborhoods described in vignettes that experimentally vary racial diversity (probably along with some other neighborhood attributes). By contrast, in a more traditional approach, respondents would indicate their degree of agreement with classical Likert-type items such as “I prefer to live in a neighborhood with people of the same race as me.”
Factorial surveys are increasingly being used in the social sciences in general and in sociology in particular (Auspurg and Hinz 2015; Dülmer 2016; Jasso 2012; Liebe et al. 2020; Su and Steiner 2020), in part because vignettes offer several advantages over classical (Likert-type) attitude items (Dülmer 2007, 2016; Jasso 2006; Shamon et al. forthcoming; Wallander 2009). Firstly, analyzing people's responses to vignettes containing concrete descriptions is likely to yield more realistic representations of judgments and evaluations than asking people to indicate their reaction to certain attributes of social objects directly. In particular, a major benefit of factorial surveys is that they incorporate the tradeoffs between attributes that frequently arise in practice. Secondly, responses to vignettes tend to be less prone to social desirability bias because when an object is described on several attributes simultaneously, participants may feel less pressure to have to defend the relative influence of each attribute on their response, as each response can be justified in multiple ways (Tomassetti, Dalal, and Kaplan 2016).
When researchers analyze data from factorial surveys, they employ analytical methods to estimate the weights (or utilities) assigned to the levels of the different attributes by participants to arrive at an overall response to the vignettes. This is typically done by estimating a regression-type model in which the response variable is specified as a linear function of the levels of the vignette attributes (Jasso 2006). In the current paper, we propose that data from factorial surveys can be analyzed in a structural equation modeling framework using an approach called Structural Equation Modeling for Within-Subject Experiments, or succinctly as SEMWISE (Weijters and Baumgartner 2019). In this approach, a factor model is specified in which the responses to the different vignettes serve as the indicators of latent weight factors that represent individual variation in the weights or utilities assigned to the levels of the attributes manipulated in the factorial survey. Individual differences in how strongly different attributes and their levels influence overall ratings can then be related to various antecedents or consequences in an integrated model. In addition, the usual advantages of structural equation modeling apply, that is, measurement error in the observed responses can be accounted for, the fit between model and data can be thoroughly assessed based on established model fit indices, and the generalizability of relationships across groups of respondents can be investigated using multisample models.
In the following, we will review the use of factorial surveys in social science research, discuss typically used methods to analyze factorial survey data, introduce the SEMWISE approach, compare the SEMWISE model to the multilevel approach, illustrate its use in an empirical illustration, and suggest some possible modeling extensions. We will conclude by making some practical recommendations and discussing potential limitations of this approach.
Factorial surveys
Factorial surveys in the social sciences and sociology
Factorial surveys are popular in marketing research, policy studies, organizational research, and applied psychology, as well as in sociology (Liebe et al. 2020; Shamon et al. forthcoming). In research domains outside sociology, the method is often presented using different names (the most common names include conjoint analysis in marketing; policy capturing or judgment analysis in organizational research; factorial surveys or vignette studies in sociology and political science). This has led to cross-disciplinary fragmentation, and consequently researchers in one discipline are frequently not aware of the methodological advances of the approach in other disciplines (Aiman-Smith, Scullen, and Barr 2002).
In marketing research, the term rating-based conjoint analysis is used for factorial surveys in which each respondent rates multiple vignettes (usually descriptions of products along various attributes) in terms of attractiveness or purchase intention. Conjoint analysis (which can also be based on choices between products) has a long research tradition in marketing (Green and Rao 1971) and has grown into a highly specialized and sophisticated academic field (Carroll and Green 1995; Green, Krieger, and Wind 2001; Green and Srinivasan 1990). The method is also widely used by applied marketing researchers (Gustafsson, Herrmann, and Huber 2000), particularly for designing new products, making pricing decisions, and forecasting market shares following product introductions (Green and Srinivasan 1990). The goal of conjoint analysis is to derive respondent-specific weights (called part-worth utilities) that show the relative contribution of the different levels of the product attributes of interest (e.g. whether a coffee is organic or not, has a good or average flavor, and a low vs. high price) to a product's overall utility.
Factorial surveys are also popular in organizational research and applied psychology, where they are called policy capturing (Aiman-Smith et al. 2002; Karren and Barringer 2002; Tomassetti et al. 2016) or, less commonly, judgment analysis (Tomassetti et al. 2016). As these names suggest, in organizational research the method is typically used to understand issues such as how people in organizations make hiring decisions, assign performance ratings, or set compensation. In this context, policy capturing is employed to study which factors influence people's judgments and how heavily each factor is weighted (Aiman-Smith et al. 2002). Similar to marketing, this method has a long tradition dating back almost half a century (Doherty and Keeley 1972; Mertz and Doherty 1974).
In sociology, factorial surveys are mainly used to study the factors that drive social responses (including evaluations, judgments, and beliefs) toward social objects such as individuals, groups, or situations (Dülmer 2007, 2016; Emerson et al. 2001; Jasso 2006; Liebe et al. 2020; Shamon et al. forthcoming; Wallander 2009). People routinely judge multidimensional phenomena in everyday life, as the following examples illustrate (Shlay 2010): deciding whether to buy a house based on factors such as location, price, and neighbors; determining whether a sex act constitutes rape based on the attire of the victim, the presence of alcohol, and other factors; evaluating the appropriateness of a mate based on education, family background, and ethnicity; or voting for a president based on political position, race or ethnicity, and gender.
Analyzing factorial surveys
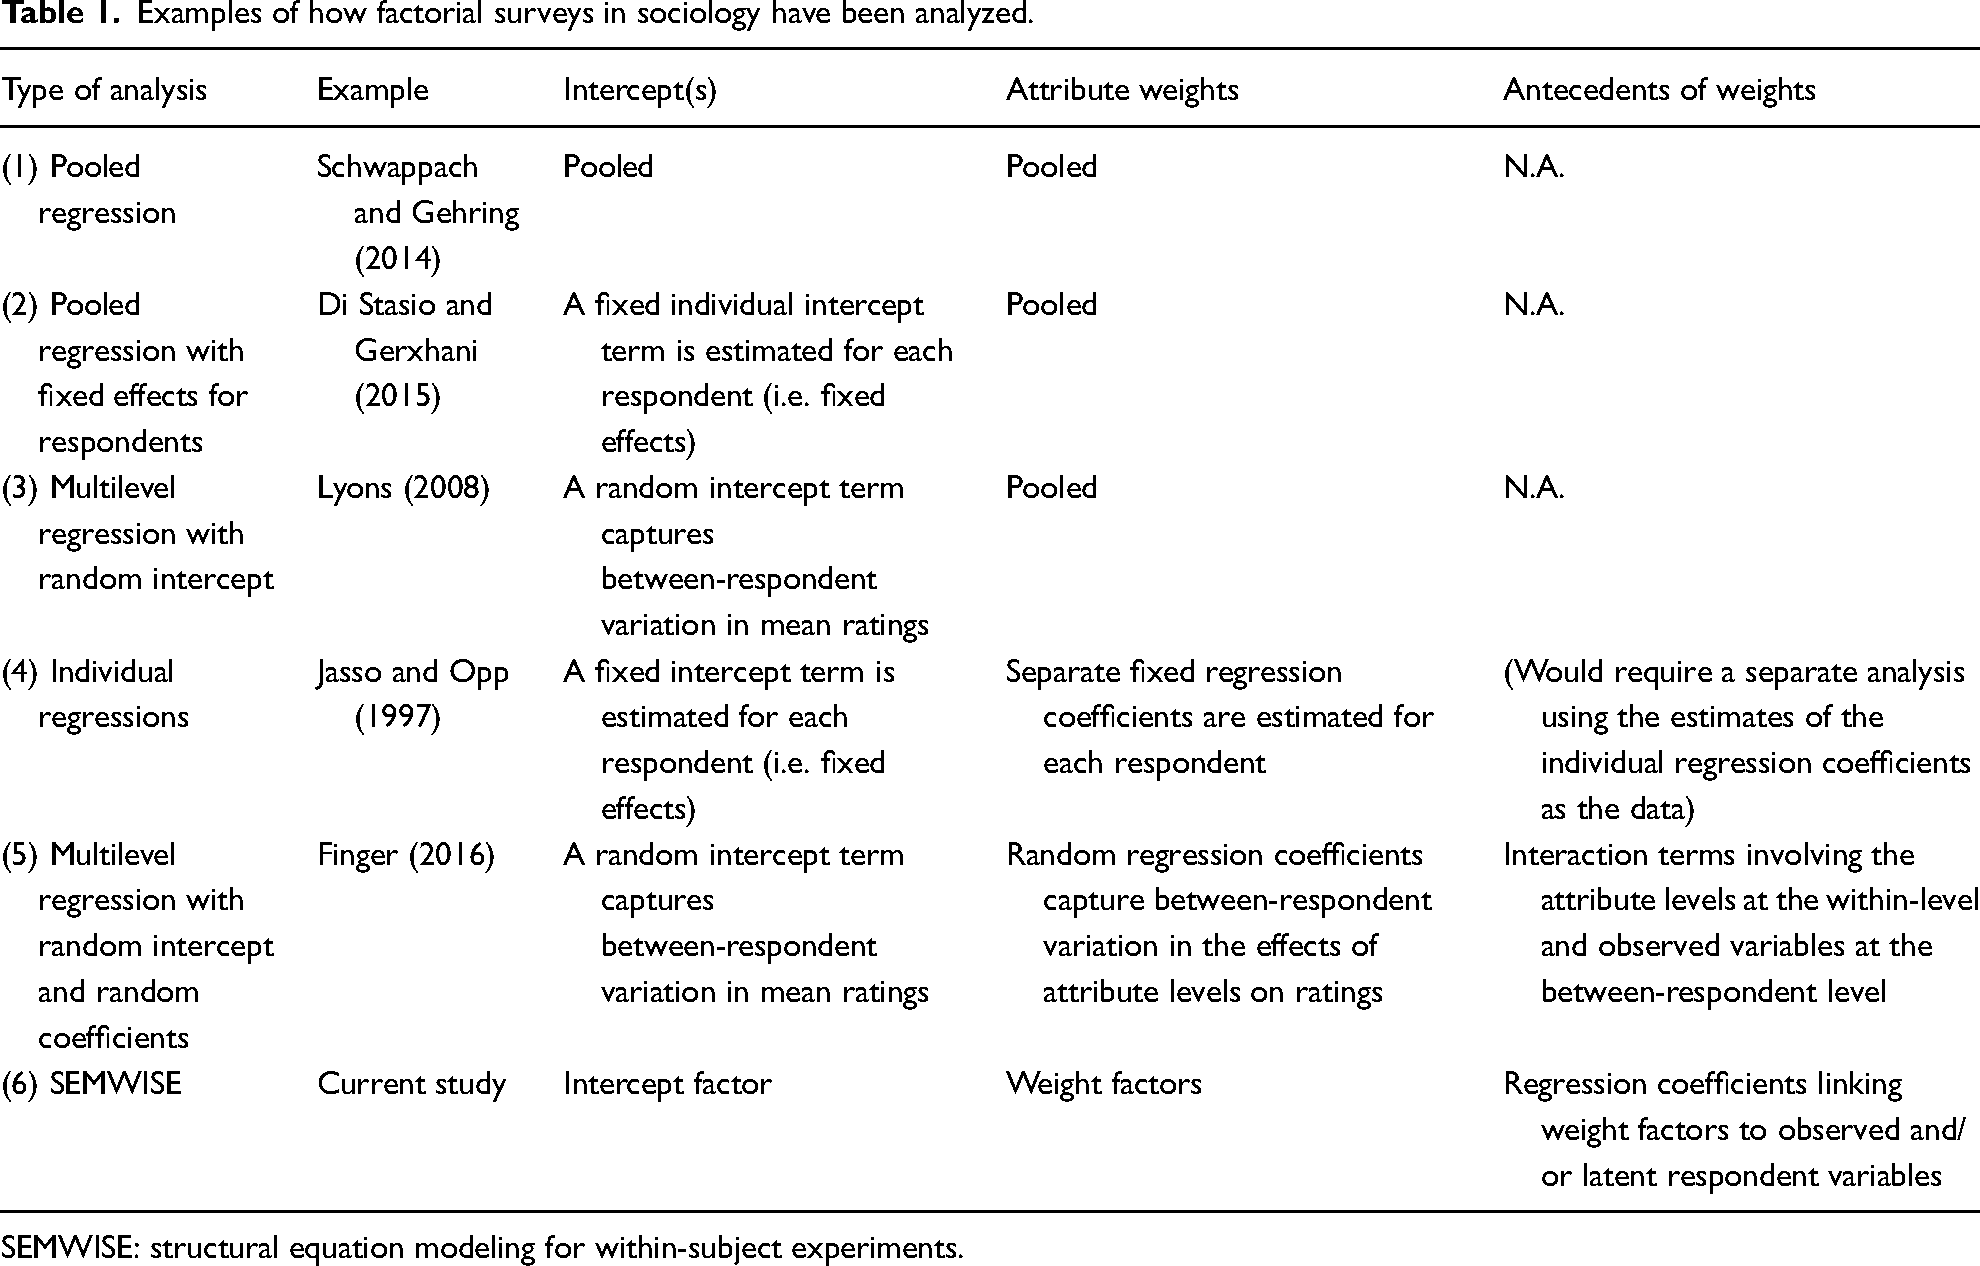
Factorial surveys are typically analyzed using linear regression models or extensions thereof (Wallander 2009). In these models, the vignette attribute levels are used as the (categorical) independent variables and vignette ratings as the dependent variable. Table 1 provides an overview and examples of regression-based analytical approaches that have been used in sociological research. The most straightforward approach is to run a pooled regression across all individual vignette ratings provided by respondents, estimating one intercept term and one set of regression coefficients for the entire sample of respondents (see row 1 in Table 1). As an example, Schwappach and Gehring (2014) study how attributes of medical situations (error in checking a prescription, missed hand disinfection, rule violations in medication preparation, rule violation during lumbar puncture) affect the likelihood of speaking up about safety concerns among healthcare professionals, using pooled multiple linear regression (i.e. one set of regression coefficients is estimated for the entire sample of respondents). This approach has two key shortcomings. First, since each respondent contributes multiple data points, the assumption that all observations are sampled independently from an underlying population is violated. Second, estimating a single equation for all respondents assumes that the effects of the vignette attributes on responses are homogeneous across respondents, which also prevents researchers from studying potential antecedents or consequences of between-respondent differences in how vignette attributes affect ratings. Whereas the first issue is mainly a statistical nuisance, as it may result in faulty estimates of standard errors if the dependencies of the observations are not accounted for, the second issue may have important substantive implications.
Examples of how factorial surveys in sociology have been analyzed.
SEMWISE: structural equation modeling for within-subject experiments.
To address the issue of nonindependent observations, researchers can use a fixed effects model in which a separate intercept is estimated for each individual respondent (see row 2 in Table 1). As an example, Di Stasio and Gerxhani (2015) use this approach to study how applicant characteristics (gender, previous work experience, participation in an internship at the firm, level of education, field of study, study duration, grade point average, extracurricular activities) affect hiring propensity, applicant trainability, and applicant–organization fit among a sample of English employers in the Information and Communication Technology industry. Alternatively, researchers can use a random intercept model in which the individual intercepts are assumed to follow a known probability distribution (usually a normal distribution) and only the mean and variance of this distribution have to be estimated (see row 3 in Table 1). As an example, Lyons (2008) studies how incident characteristics (offender race, number of offenders, victim race, victim sex, victim sexuality) affect perceptions of seriousness of the offense among students, using a random intercept specification to account for data dependencies at the respondent level.
Allowing for variation in the intercept does not address the limiting assumption of effect homogeneity in the other regression coefficients. Researchers in sociology analyzing factorial surveys are often interested not only in the social component (the generally agreed-upon or average component) but also in the individual component (the individual deviation from the social component) of people's judgments (Rossi and Anderson 1982). For example, respondents may favor neighborhoods with low racial diversity on average (the social component), but some may do so more than others and a few may actually prefer higher racial diversity (i.e. there are individual deviations from the social component). Although some researchers have shown an interest in individual differences, Wallander (2009) points out, based on her extensive review of the literature, that many researchers (particularly in earlier studies) have largely overlooked the potentially relevant between-respondent variation in judgments.
Researchers who have accounted for individual differences in the weighting of vignette attributes have done so in different ways. One solution is to estimate a separate regression model for each individual respondent (see row 4 in Table 1). These individual-level regression weights could then be used in a subsequent analysis in which the weights are linked to individual background variables such as age or sex (Jasso 2006) and/or other observed respondent-level variables (Castillo, Olivos, and Azar 2019; Finger 2016). As an example, Jasso and Opp (1997) study how characteristics of protests (economical/political discontent, legal/illegal protest, low/high personal influence, personal risk, expected number of participants, gender) affect normative evaluations of protest participation among German citizens, using individual-level regression models to account for the fact that respondents differentially weigh the protest characteristics in their evaluations. The disadvantage of individual regressions is that it requires the estimation of a large number of parameters, and these estimates may be unstable, particularly when the number of repeated observations per person is relatively small. Recent methodological advances and related software developments have encouraged the use of multilevel modeling to analyze factorial surveys (Shamon et al. forthcoming). In multilevel models (see row 5 in Table 1), random regression coefficients capture the between-respondent variation in the effects of different attribute levels on overall ratings. As in individual-level regression, the individual variation in the random coefficients can be related to various antecedents specified to explain this variability (technically, these effects are cross-level interactions between the within-respondent and between-respondent effects), but the advantage of random effects models is that the parameter estimates tend to be much more stable. As an example, Liebe et al. (2020) study the effect of offense (knocked over milk, stole milk), type of sanction (scolding, beating), and sanctioning person (relative, nonrelative) on the acceptability of punishment among rural Benin residents, accounting for between-respondent heterogeneity in average ratings and effects by means of a multilevel model involving a random intercept and random slopes. As another example, Finger (2016) studies the effect of application situations (distance, reputation, selection procedure, information about application and admission procedure of the university, personal interest in subject, social networks, size of the university city) on intention to apply to university among future students as a function of their academic background, using a multilevel model with random intercepts and random slopes and interaction terms between the vignette attributes and respondent-level variables.
In this paper we will present another approach for analyzing factorial surveys called SEMWISE, which generally yields the same results as multilevel modeling but offers important advantages under specific circumstances, as described in more detail below. In the following, we will first provide an intuitive explanation of how SEMWISE works using a simple example of a specific factorial survey. We will then present a more formal development of the SEMWISE approach and demonstrate its equivalence to the multilevel modeling framework.
Analyzing factorial surveys using SEMWISE
In this section, we first provide an intuitive explanation of the SEMWISE approach to introduce the basic idea and then develop the SEMWISE model more formally. Since it is likely that many readers are already familiar with multilevel modeling, we start out with the multilevel specification and then show how the multilevel specification can be translated into the SEMWISE specification.
Intuitive explanation of the SEMWISE approach
As a specific example, consider a factorial survey in which two attributes of immigrant profiles are varied orthogonally at two levels each: (1) the country of origin (COO) of the immigrant is either Canada or Mexico, and (2) the immigrant's level of education is having or not having a university degree. Respondents rate four immigrant profiles or vignettes (two countries of origin by two levels of education) by indicating to what extent they approve or disapprove of an immigrant from a given country with a given level of education being allowed to enter the country based on a rating scale ranging, for instance, from 0 (definitely disapprove) to 10 (definitely approve). The SEMWISE approach can then be used to model individual variation in the extent to which respondents are (a) more or less accepting of immigrants in general, (b) more or less sensitive to immigrants’ COO (i.e. Canada vs. Mexico in the present case), and (c) more or less sensitive to immigrants’ level of education (i.e. whether or not they have a university degree). This is done as follows.
The ratings of the four immigrant profiles per person are used as the four observed indicators of three latent factors: an intercept factor (FINT), which captures respondents’ average approval rating of immigrants in general; a weight factor for country of origin (FCOO), which captures the effect of immigrant country of origin (Canada vs. Mexico) on respondents’ approval ratings; and a weight factor for university degree (FUD), which captures the effect of immigrant education level (university degree vs. no university degree) on respondents’ approval ratings. The distinguishing feature of the SEMWISE approach is that the loadings of the weight factors are not free model parameters but fixed to specific values such that they correspond to the different attribute levels. Although different coding schemes are possible, we propose to use effect coding, which means that the loading on the FCOO weight factor is +1 (−1) for profiles in which the immigrant is from Canada (Mexico) and the loading on the FUD weight factor is +1 (−1) for profiles in which the immigrant has (does not have) a university education. The loadings on the intercept factor FINT are fixed to +1 for all profiles.
Figure 1 shows how the SEMWISE model decomposes the overall ratings of the four profiles into component utilities for one fictitious respondent. Although the factor loadings are fixed for all respondents, the factor scores for the intercept factor and the two weight factors capture how this respondent rates immigrants in general and how an immigrant's COO and level of education influence the overall ratings. In the example, the respondent's average approval rating of immigrants in general is 4 on a scale from 0 (definitely disapprove) to 10 (definitely approve), and the respondent is more approving of immigrants from Canada than Mexico and less approving of immigrants with a university education than those without a university immigration. To illustrate the interpretation of Figure 1, consider a fictitious respondent who has latent weight factor scores of FINT = 4, FCOO = 2, and FUD = −1 and whose ratings are perfectly determined by the weight factor scores and profile attributes for the sake of the example. The factor scores can be interpreted as follows. First, the factor score of 4 for the intercept factor indicates that this respondent gave the vignettes an average rating of 4 (since all vignette ratings have a unit loading on the intercept factor, they are all affected equally by the intercept factor score). Second, the factor scores of + 2 and −1 for the two weight factors mean that the respondent provided higher ratings for Canadian immigrants (whose factor loading is +1 which, when multiplied by the factor score of + 2, increases the overall rating by + 2) than Mexican immigrants (whose factor loading is −1 which, when multiplied by the factor score of + 2, decreases the overall rating by −2), and that the respondent also gave lower ratings to immigrants with a university degree (whose factor loading is + 1 which, when multiplied by the factor score of −1, decreases the overall rating by −1) than immigrants without a university degree (whose factor loading is −1 which, when multiplied by the factor score of −1, increases the overall rating by + 1).
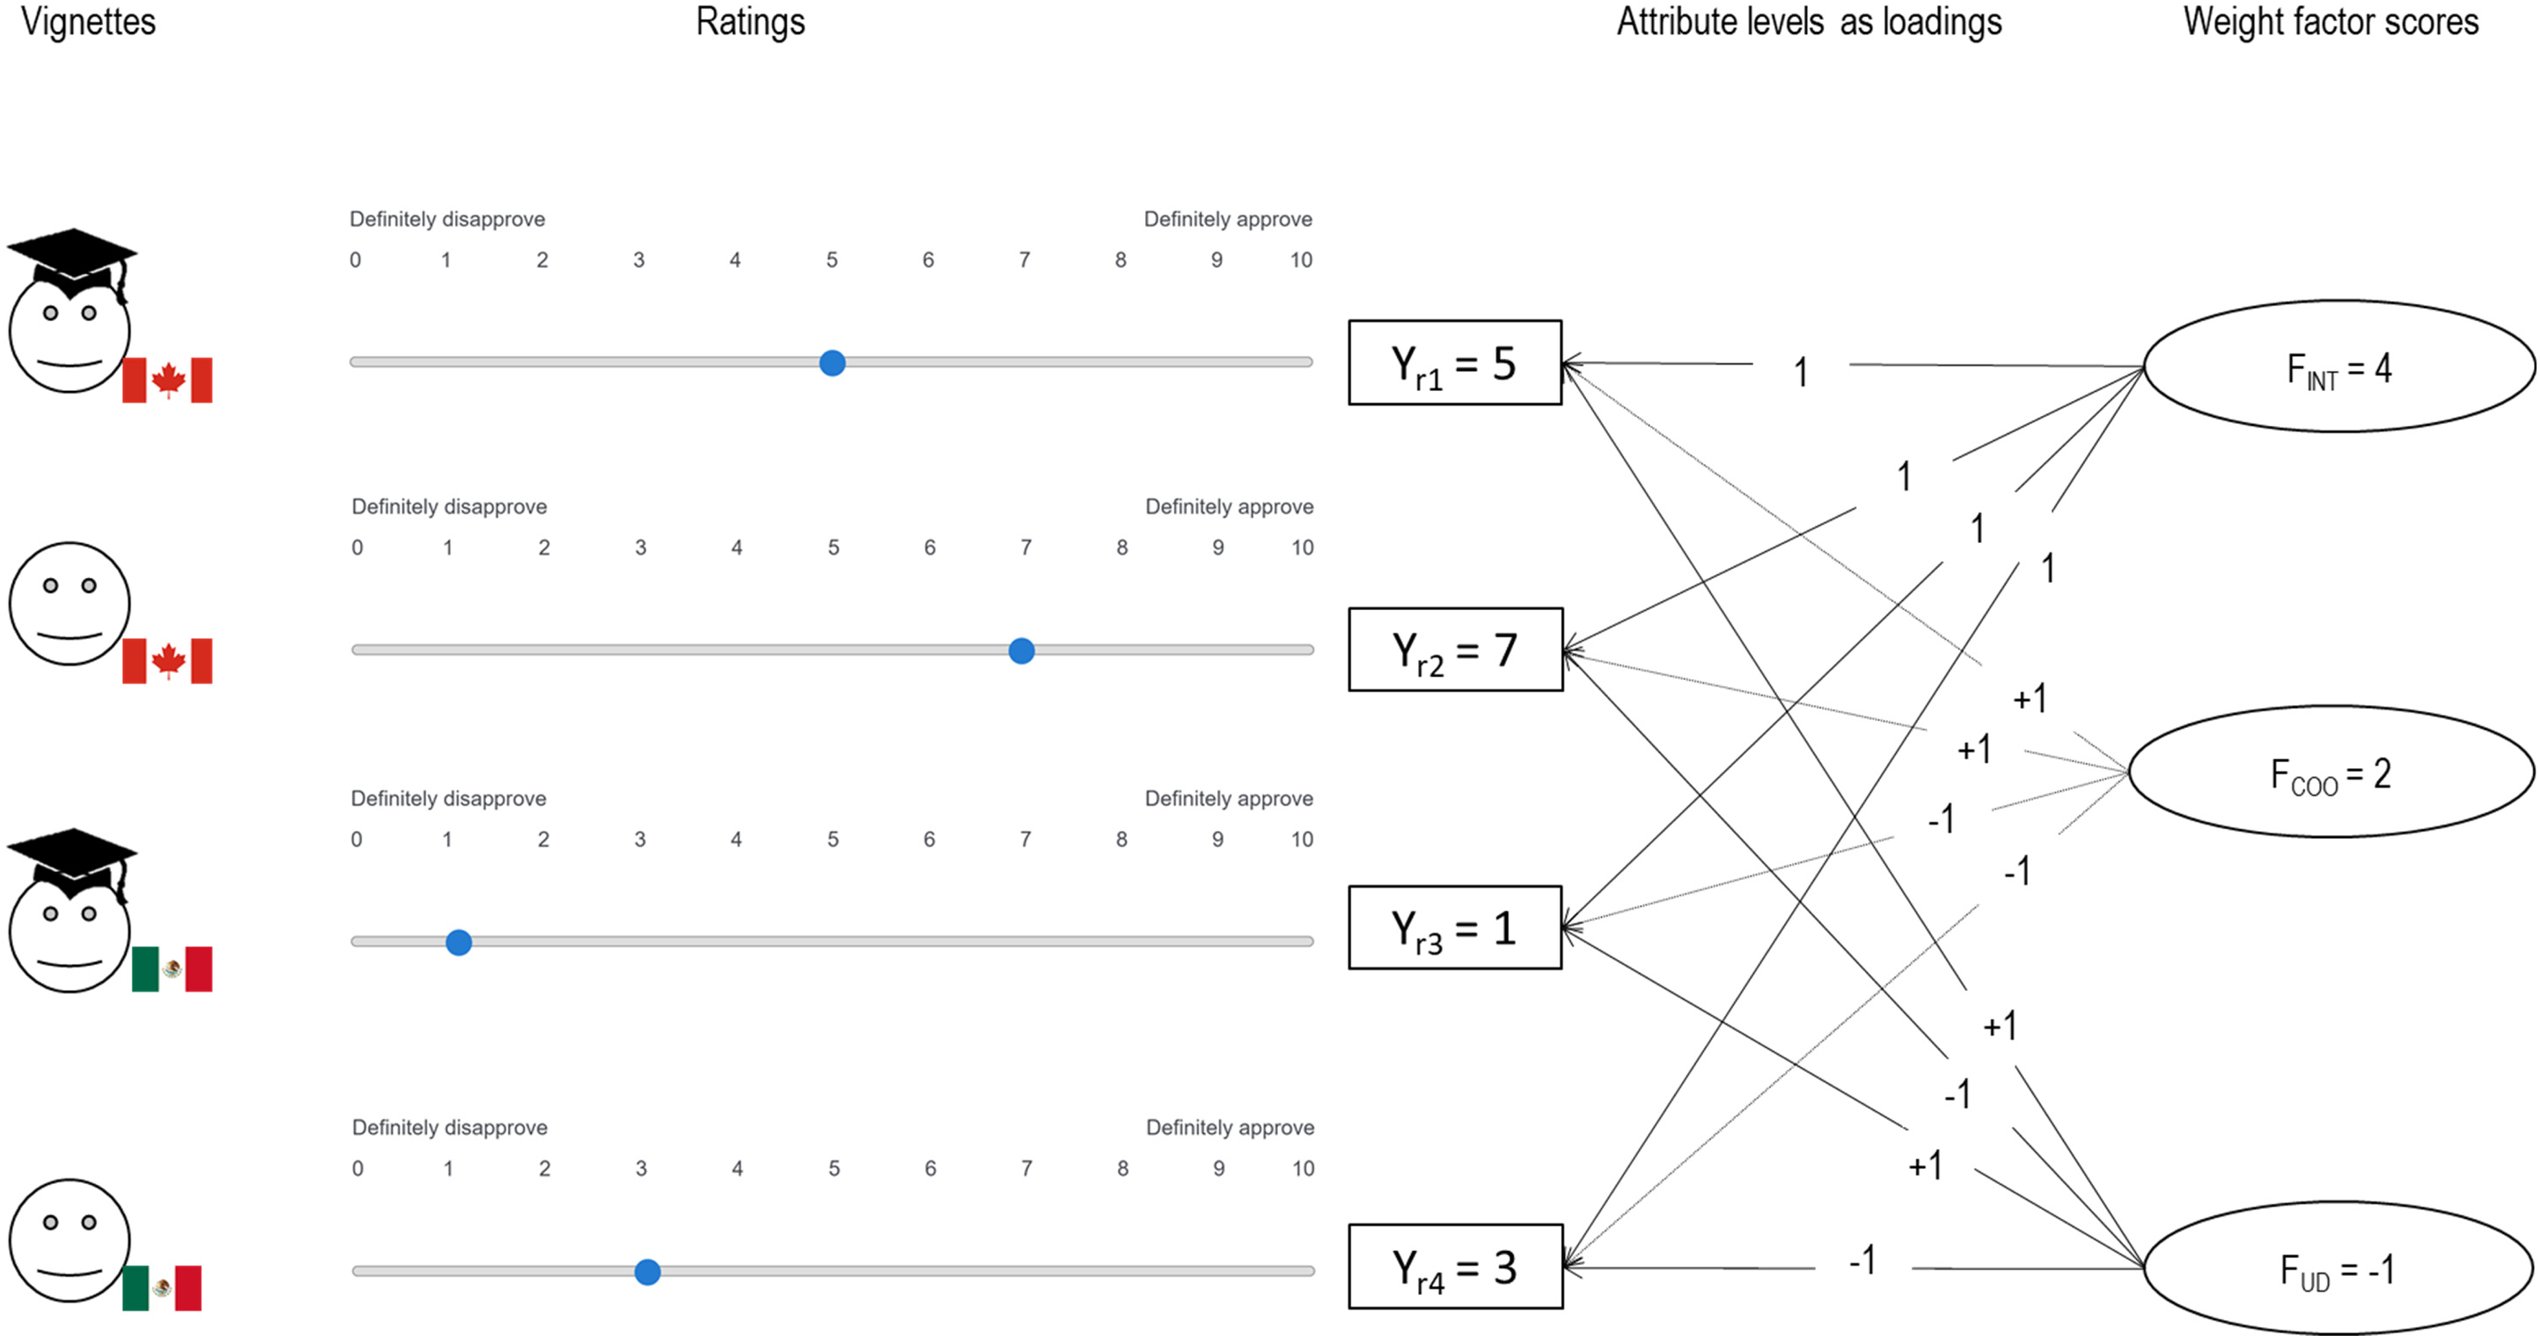
SEMWISE (structural equation modeling for within-subject experiments) model rationale for one fictitious respondent.
Figure 2 shows the specification of the core SEMWISE model across all respondents in graphical form. The intercept and weight factors now capture individual variation in average ratings and the influence of the manipulated attributes on overall ratings. Note that the intercept and weight factors can be correlated. For instance, a positive correlation between FCOO and FUD would indicate that respondents who like Canadian (vs. Mexican) immigrants also tend to like immigrants with (vs. without) a university degree. The intercept and weight factors each have a mean (the gamma (γ) parameters in the figure), which represents the social component of the effects of the immigrant attributes on approval ratings. The intercept and weight factors also have a variance, which represents the individual component (as variation around the mean) in the effect of the immigrant attributes on approval ratings. Finally, the approval ratings each have a unique factor, which captures random error and other stochastic variance not related to either the average rating or the effect of the two immigrant profile attributes.
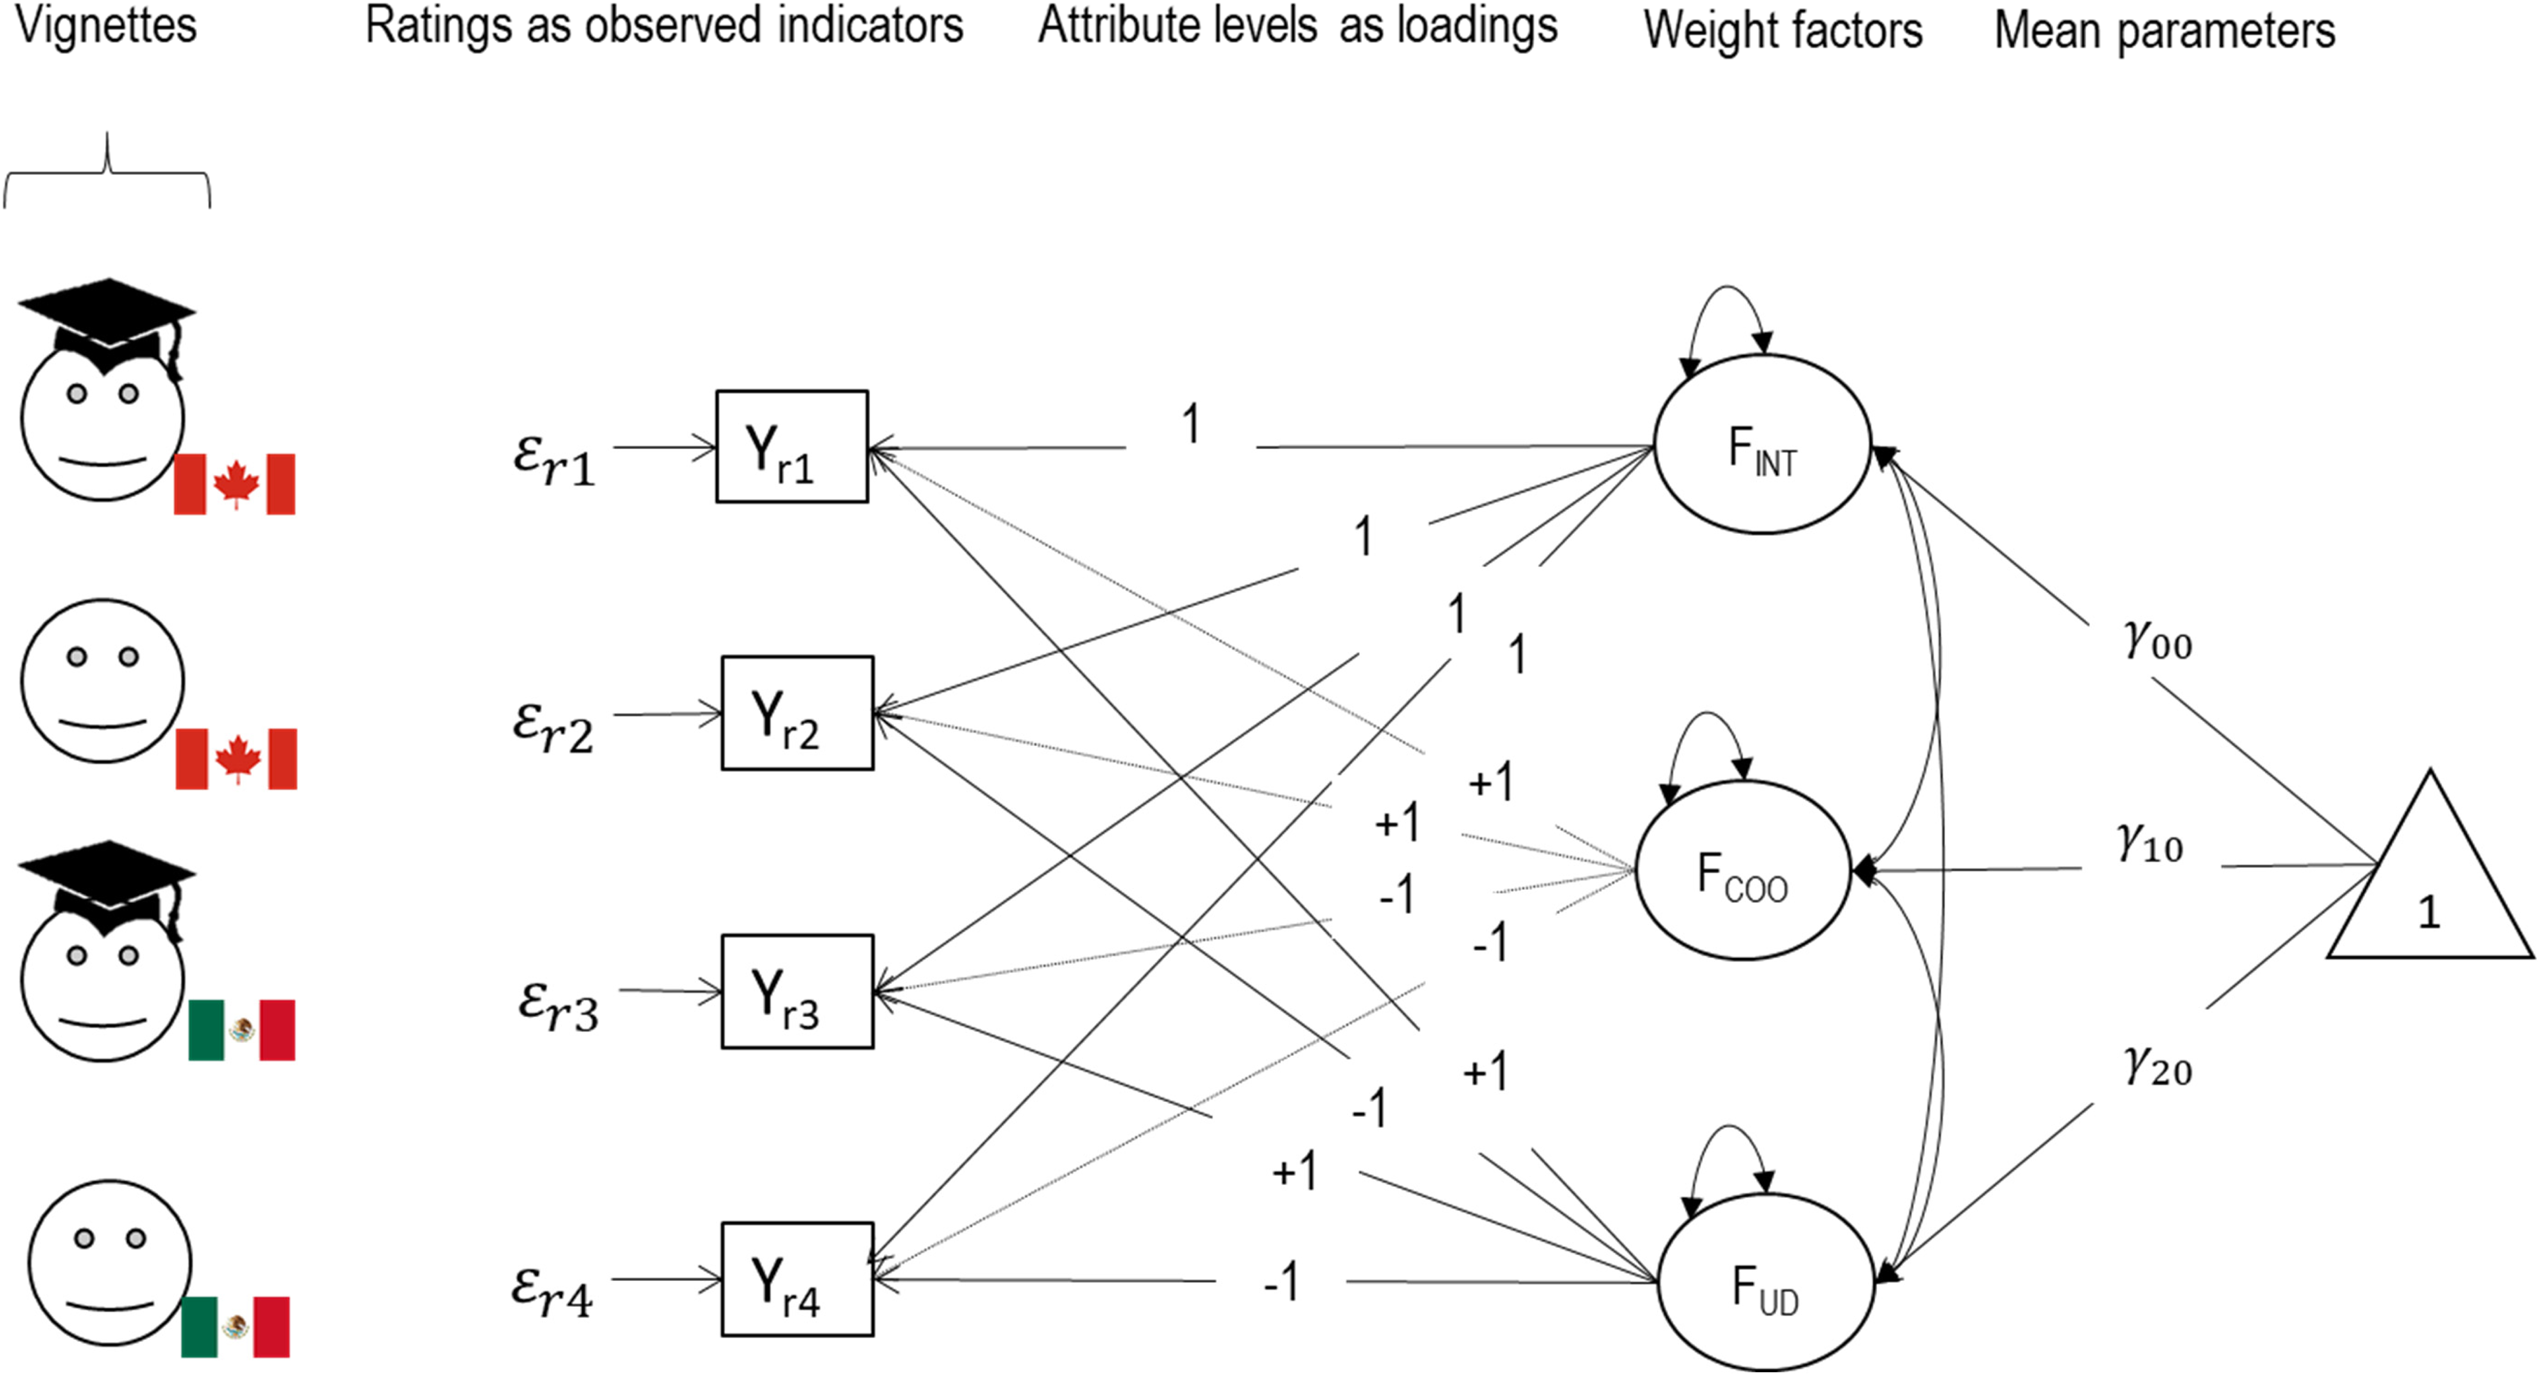
Structural equation modeling for within-subject experiments model.
In the current example, there are two binary attributes and four profiles, and three weight factors are needed to model the variation in the intercept and the effect of the binary attributes on ratings. As specified, the SEMWISE model in Figure 1 only accounts for the main effects of University Degree (UD) and COO on the profile ratings; the fit of the model to the data indicates whether this specification is appropriate (extensions that include interactions will be described below). Researchers can formally test whether a specified model is consistent with the data, using the usual chi-square (χ2) goodness-of-fit test, or rely on alternative fit indices and conventional rules of thumb (e.g. root mean square error of approximation (RMSEA) ≤ .06; standardized root mean squared (SRMR) ≤ .08; comparative fit index (CFI) ≥ .95; Tucker-Lewis index (TLI) ≥ .95; Hu and Bentler 1999) to assess whether the model provides a reasonable approximation to the data. If the model is judged to be adequate, the parameter estimates of interest can be interpreted; typically, the interpretation will focus on the intercept and weight factor mean and variance estimates (as illustrated in Figures 1–3).
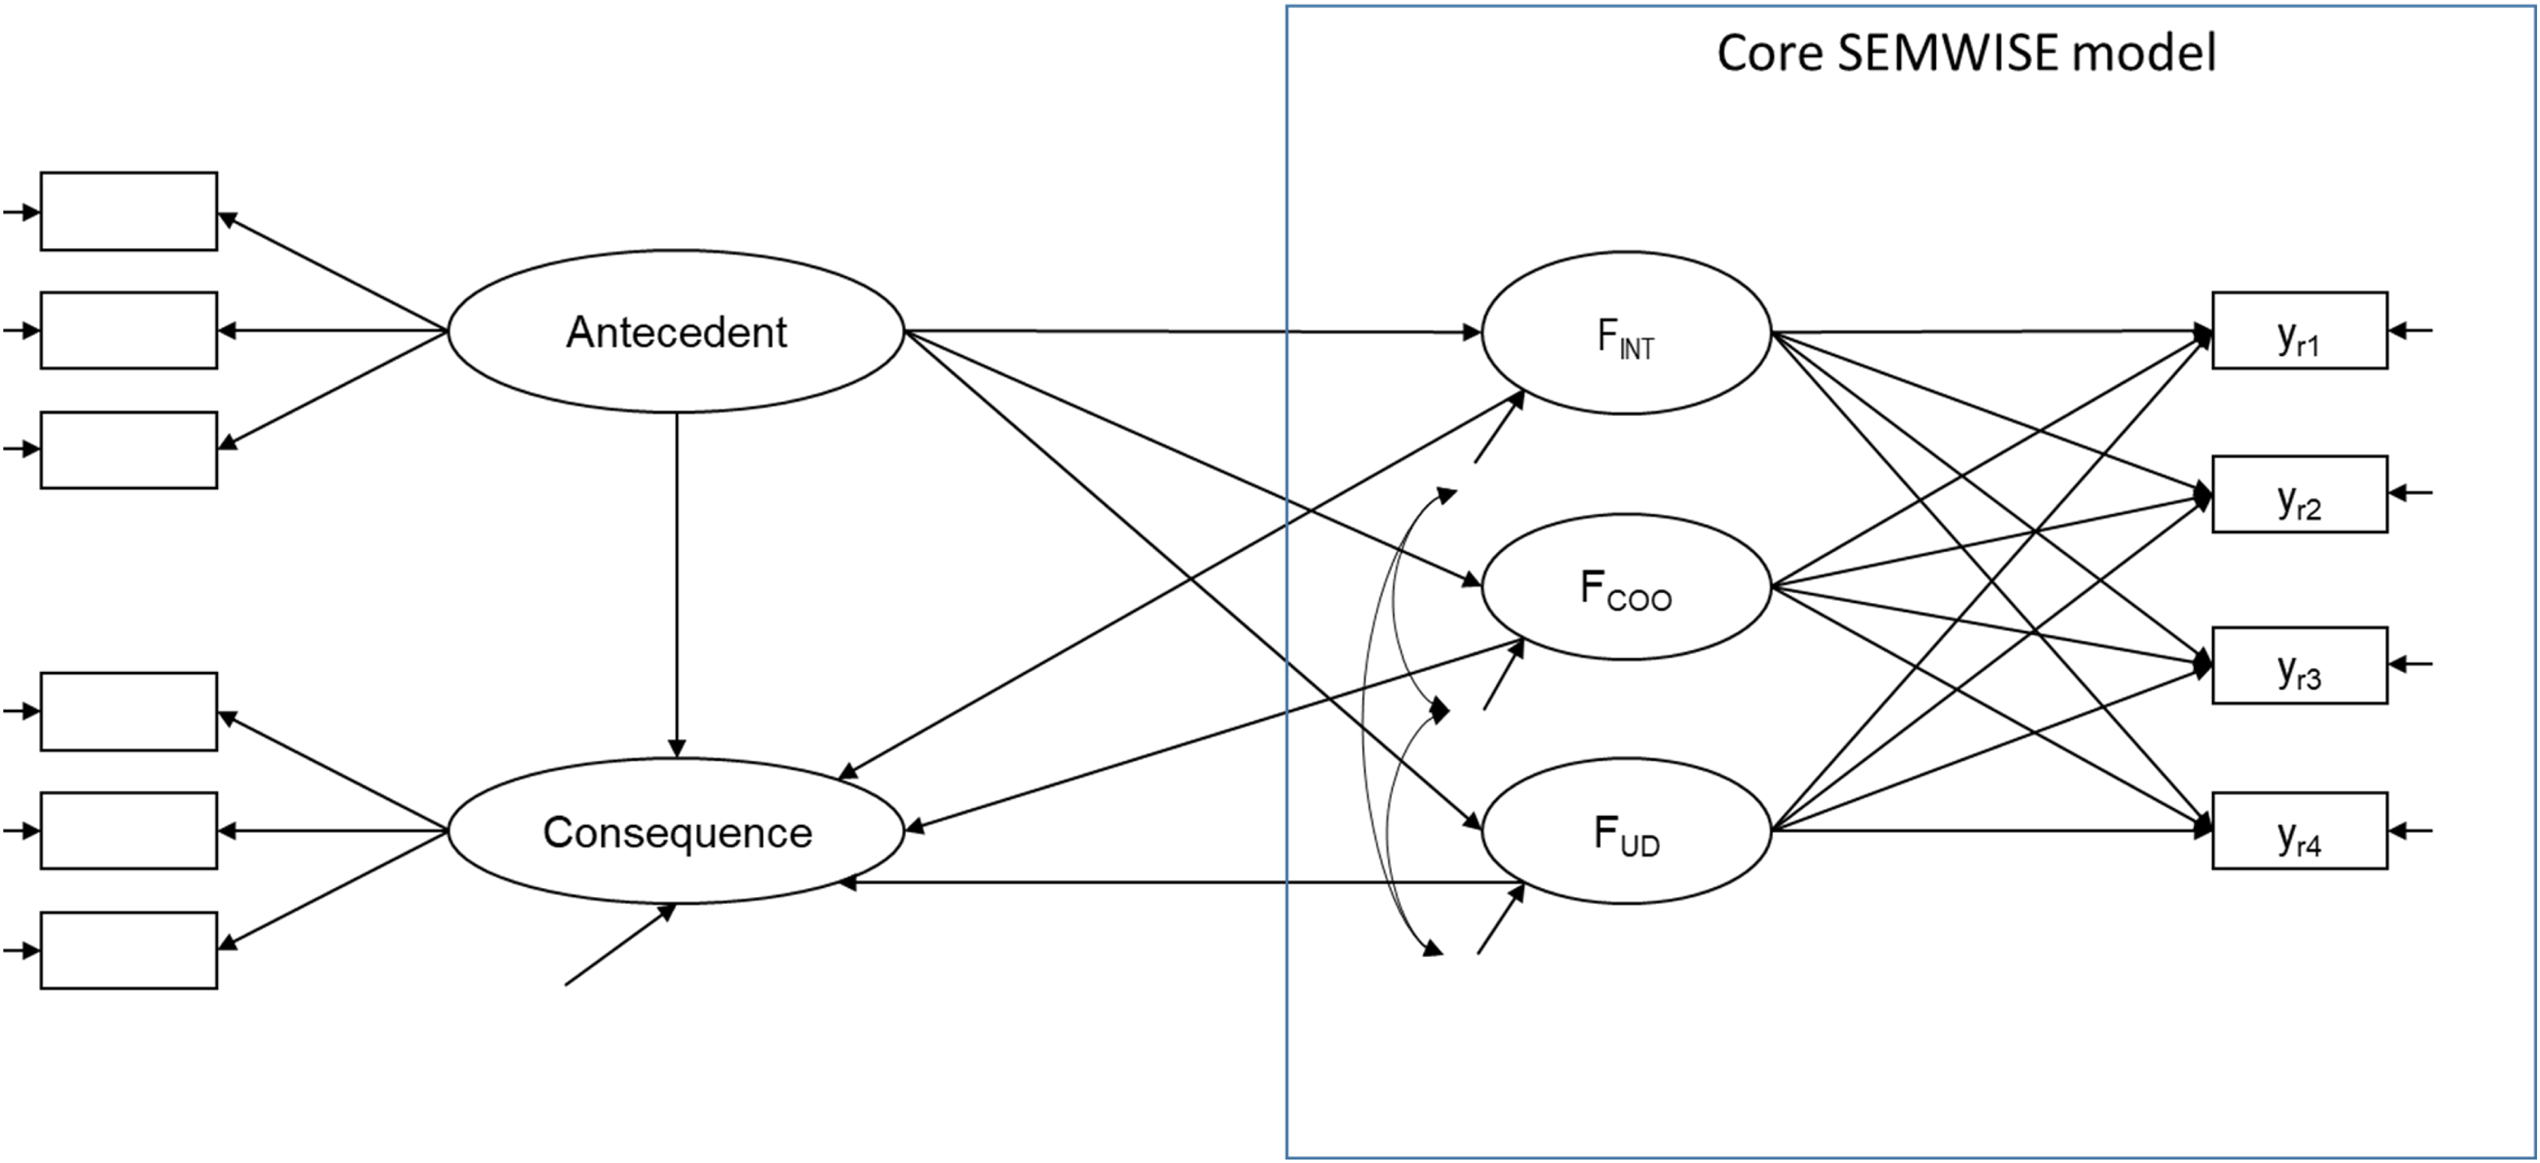
Extended structural equation model for within-subject experiments.
Once the core model has been tested and found to be acceptable, researchers can extend the model by embedding the intercept and weight factors in a broader nomological net of antecedents, correlates, and consequences. Figure 3 illustrates how latent antecedents and consequences can be related to the SEMWISE factors (a similar approach applies to observed variables). For example, personal values could be added as antecedents of the intercept and weight factors (this will be discussed further in the empirical application), and willingness to sign an anti-immigration petition could be considered as a potential consequence. Before including antecedents and consequences, we recommend that researchers carefully evaluate the measurement model underlying the latent antecedents and/or consequences in a preliminary analysis. Also, when the intercept and weight factors are modeled as dependent variables, residual covariance terms should be included because it is unlikely that the antecedents considered in the model will be able to account for all of the shared variance between the factors. This would also apply to the situation in which the factors are treated as antecedents because in most cases the factors will be correlated. If the extended model shows acceptable fit, the key parameters of interest are the regression coefficients relating the antecedents to the intercept and weight factors or the intercept and weight factors to the consequences. Their interpretation will be further illustrated in the empirical example. The next section provides a more formal development of the SEMWISE model and compares it to a multilevel specification that may be more familiar to some readers; readers who are unfamiliar with multilevel modeling can skip to the empirical illustration.
Formal specification of the core SEMWISE model
In this section, we develop and explain the SEMWISE model formally and contrast it with the more common multilevel modeling approach. For ease of exposition, we again use the same example as before (see Figure 1). Since there are four ratings per person, the data set consists of R × 4 observations, where R is the total number of respondents. To analyze the data by means of multilevel modeling, the data set is typically structured in long format: Each record contains a particular respondent's rating of one of the four vignettes. In other words, in long format, the repeated observations of a given respondent are separate records and, consequently, each respondent is represented using four lines in the data set.
A multilevel model for these data can be specified as follows. The level-1 model is:
The level-2 model is given by:


Substituting equations (2) to (4) into equation (1) yields
The model in equation (5) can be contrasted with two other models. If the three coefficients are constant across respondents (which implies that the variability in these coefficients is zero), one obtains the pooled regression model, in which a single regression with constant coefficients is specified across all observations (see row 1 in Table 1). Another possibility is to specify a separate regression model for each individual respondent (individual-level regression; see row 3 in Table 1). As it turns out, the multilevel model is a weighted combination of the pooled regression and the individual-level regressions (Gelman and Hill 2007). When there is little variability in coefficients across respondents, the multilevel model estimates will be close to the pooled estimates, but as the variability in coefficients across respondents increases, the multilevel model estimates move toward the individual-level estimates. This weighting is advantageous because it allows for effect heterogeneity across respondents while avoiding the instability of the individual-level regression coefficients (particularly when the number of profiles is small).
The SEMWISE approach is formally identical to the multilevel model approach, but the model specification is quite different (Weijters and Baumgartner 2019). To begin with, the data have to be structured in wide format (or multivariate format), where each respondent is represented with one line of data and the four ratings are treated as four different variables (i.e. 


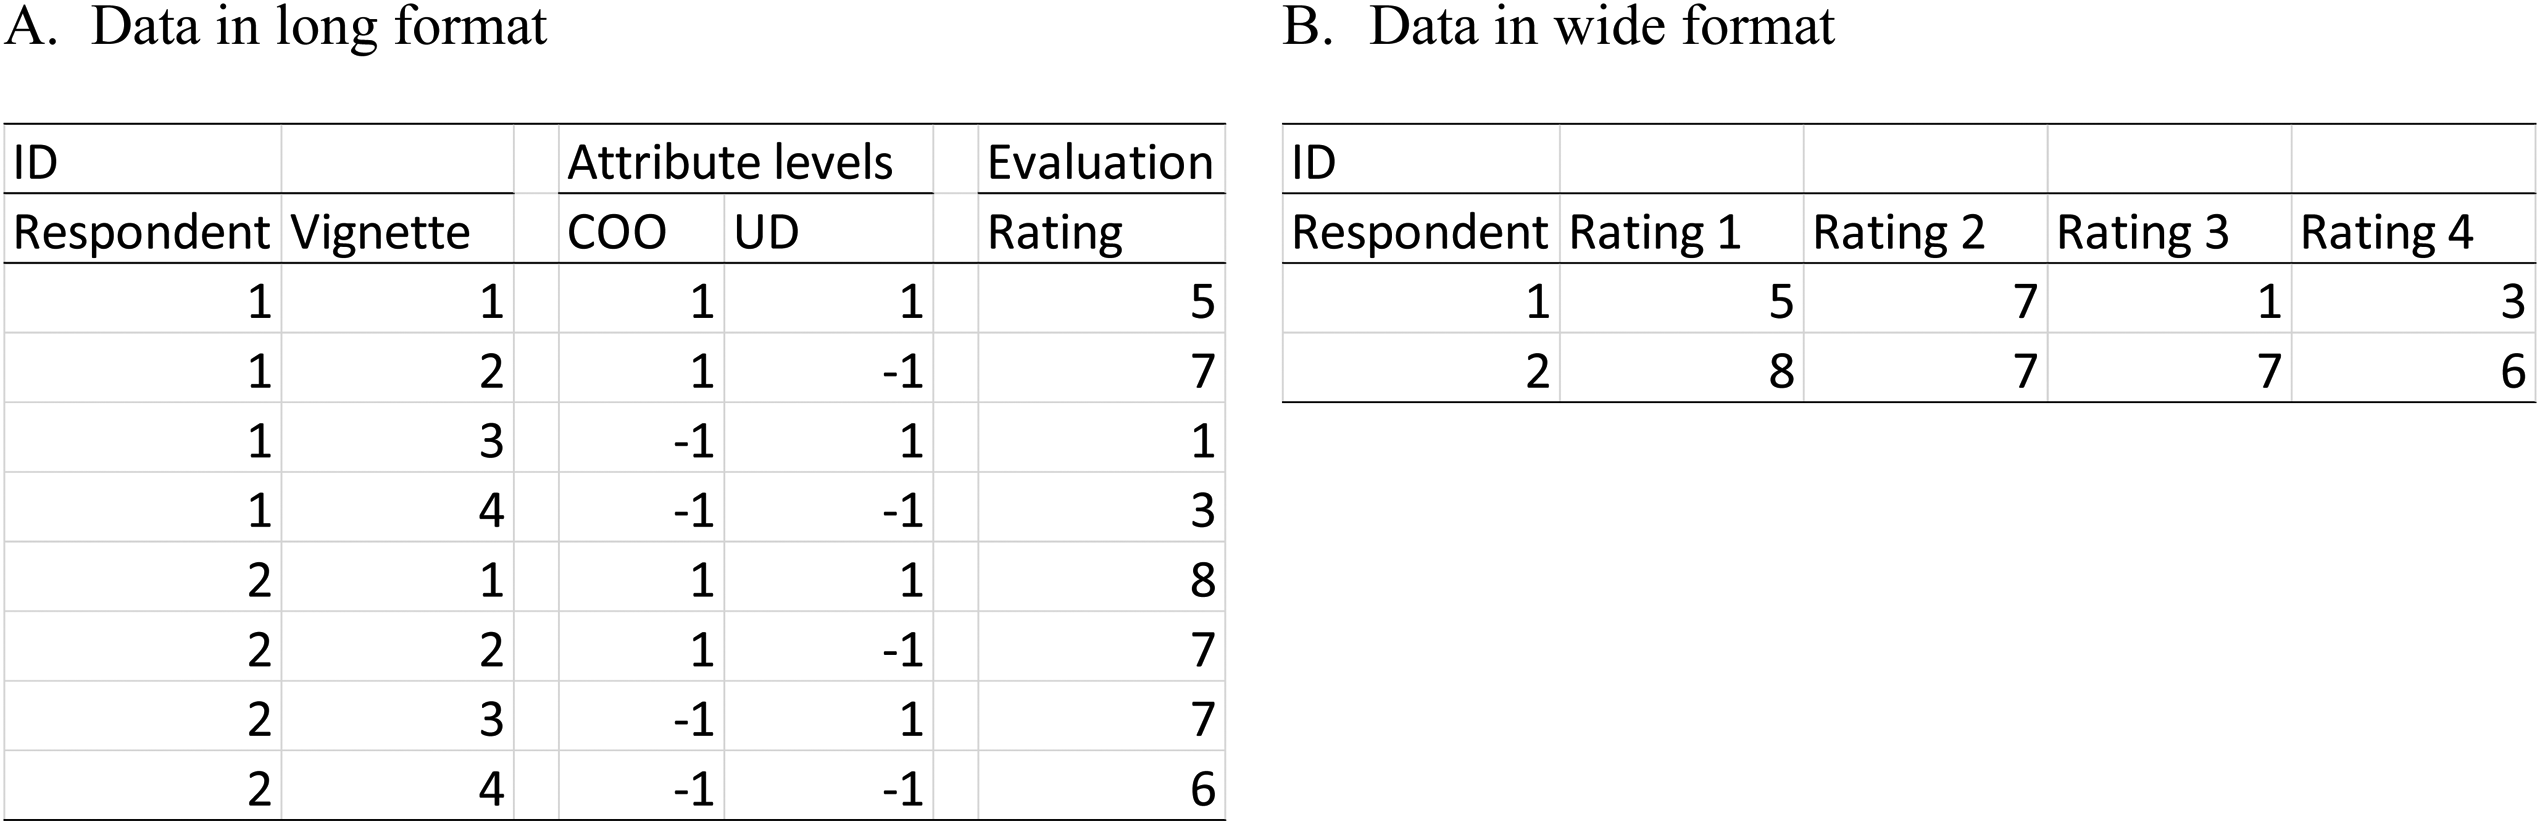
Illustration of long format versus wide format.
By setting 


In the SEMWISE approach,
In the SEMWISE approach it is straightforward to relate the variation in the intercept and weight factors to various respondent-level antecedents, correlates, or consequences. As the data are already structured by respondent, the model can be easily extended to incorporate observed or latent variables that are associated with the intercept and weight factors. If the respondent-specific intercept and weight factor scores vary significantly across respondents, a researcher may be interested in investigating the determinants of this variation. In a multilevel model, antecedents of the random effects can be added to equations (2) to (4) as cross-level interactions (i.e. interactions involving variables from two different levels in the data). In the SEMWISE model,
Advantages of the SEMWISE approach relative to the multilevel model approach
For basic factorial survey designs, the multilevel modeling and SEMWISE approaches will yield identical results. However, the SEMWISE approach has several advantages. Firstly, SEMWISE enables sophisticated measurement model specifications that in some cases are likely to prove more realistic. For example, in multilevel models, the level-1 error variances are usually specified to be the same (see
Secondly, SEMWISE makes it possible to investigate antecedents and consequences of the latent intercept and weight factors and study potential mediational mechanisms in nomological networks of related constructs. Although antecedents of the random effects can be accommodated in multilevel models, they are not modeled as latent variables (whereas modeling the random effects as random variables facilitates modeling their antecedents and/or consequences). Also, studying consequences of the random effects and multistage frameworks of antecedents and consequences is less straightforward in multilevel modeling but can be done easily with SEMWISE.
Thirdly, SEMWISE provides tests of overall model fit and facilitates model comparisons. Both global and local fit tests and comparisons of models and model parameters can be conducted using a variety of estimation procedures that take into account nonnormality, nonindependence of observations, and other violations of standard estimation methods.
Fourthly and finally, as explained in more detail below, multisample models can be formulated that allow researchers to study the (in)variance of model parameters across groups of respondents. In particular, the multisample SEMWISE approach can be used to investigate moderator effects of grouping variables (e.g. gender) on any of the single-sample model parameters.
Empirical illustration
In this section, we will present an empirical example to illustrate the specification, estimation, and testing of SEMWISE models and to demonstrate several key benefits (e.g. overall model testing and model comparisons, investigating antecedents of the latent intercept and weight factors). Specifically, we will estimate a model for factorial survey data corresponding to the example shown in Figure 2, and we will additionally demonstrate how individual variation in the intercept and weight factors can be related to other (latent) variables. In particular, we will investigate whether acceptance of immigrants in general and acceptance of immigrants as a function of the immigrant's COO and level of education is associated with the personal values held by the respondent. The main purpose of the empirical illustration is to provide a practical application of the SEMWISE approach.
Conceptual background
In previous studies, universalism and security (Schwartz et al. 2012) have been found to be positively and negatively related to acceptance of immigrants, respectively (Beierlein, Kuntz, and Davidov 2016; Davidov and Meuleman 2012). We will therefore test whether participants who score higher on universalism and lower on security values are (a) more accepting of immigrants in general; (b) less sensitive to immigrants’ COO (i.e. Canada vs. Mexico in the present case); and (c) less sensitive to immigrants’ level of education (i.e. whether or not they have a university degree). More specifically, based on previous literature (e.g. Davidov and Meuleman 2012), we expect that individuals who endorse universalistic values are more likely to approve of immigration (H1a) and to be less sensitive to the country of origin (H1b) and level of education of immigrants (H1c). In contrast, we expect that individuals who endorse security values will be less supportive of immigration (H2a) and will prefer immigrants from Canada (vs. Mexico; H2b) and immigrants with a university degree (vs. no university degree; H2c).
Design
Immigrant COO and level of education were manipulated in a factorial survey in which participants (who were U.S. residents) rated all four possible immigrant profiles. We also included several filler attributes. Some were part of the background story (e.g. male) and were kept constant across vignettes (Shamon et al. forthcoming); others (e.g. name) were randomized across vignettes and respondents. This strategy has two advantages: (a) although the design based on the two attributes is simple, the inclusion of additional attributes enabled us to sample from a broader set of possible profiles and, as a consequence, (b) the task becomes less transparent and respondents can justify their choices based on other attributes that are not of interest, which should reduce socially desirable responding. Including fully randomized filler attributes adds variance to the response variable, but this is accounted for by the unique variance terms for each of the observed variables in the model (see the model specification below). Table 2 summarizes the vignette design used in this illustration.
Vignette design.
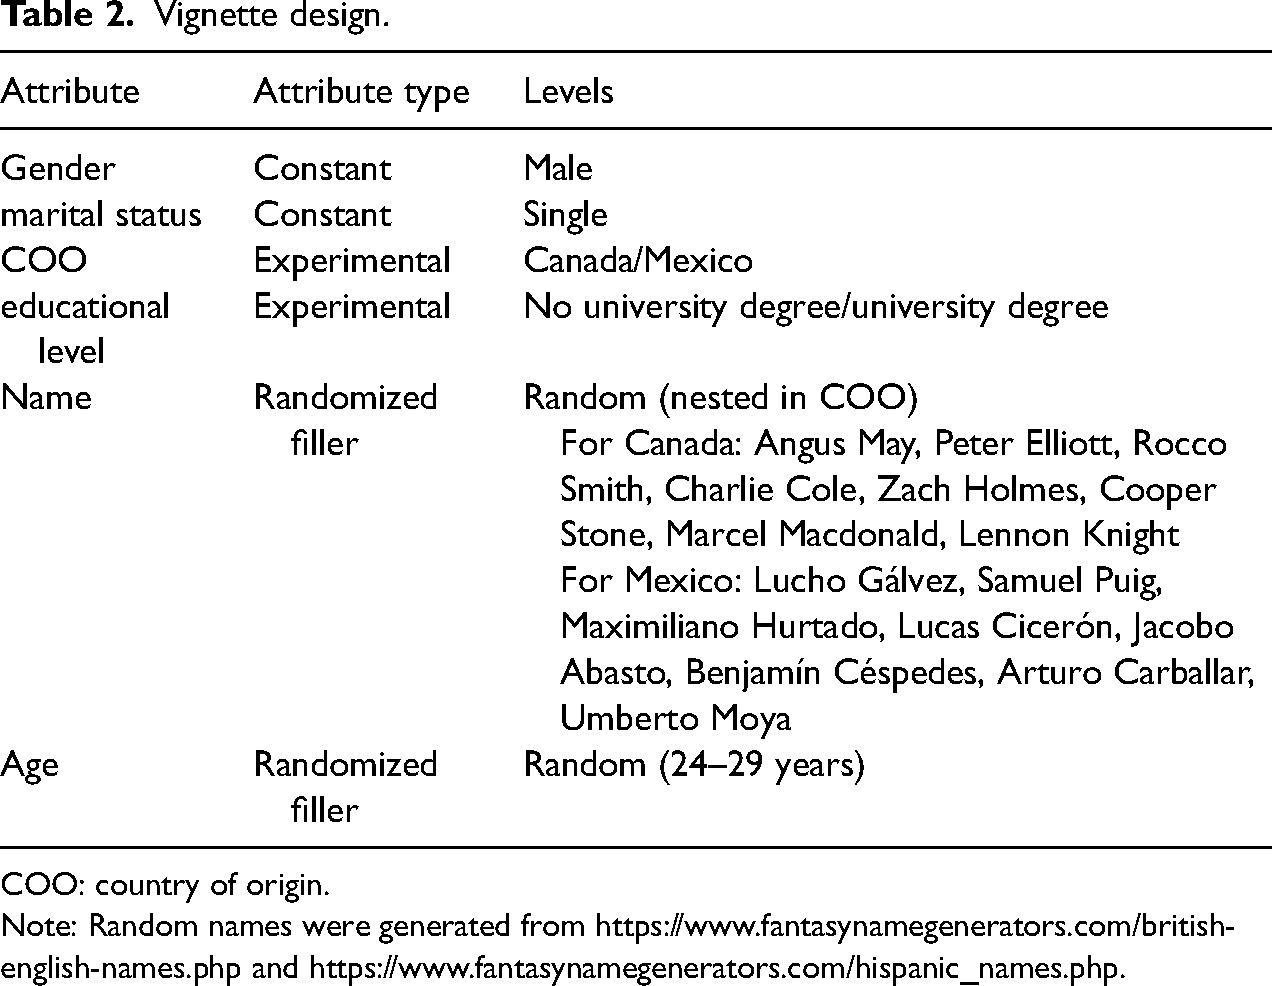
COO: country of origin.
Note: Random names were generated from https://www.fantasynamegenerators.com/british-english-names.php and https://www.fantasynamegenerators.com/hispanic_names.php.
We presented the profiles using textual (not tabular) presentation in order to minimize potential social desirability bias (Shamon et al. forthcoming). Figure 5 displays the four example vignettes used in the study. Participants were instructed as follows: “On the following pages, you will be presented with the personal profiles of four single men who recently moved to the U.S. and who are applying for a residency permit. Please indicate to what extent you personally feel each person should or should not be granted a permit. There are no right or wrong answers, only your personal opinion matters here.”

Example vignettes.
Measures
Vignette response variable. For each vignette, participants were asked the following question: “Please indicate whether you would approve or disapprove of a residence permit application for the individual described above?” Respondents indicated their answer on a slider rating scale ranging from 0 (definitely disapprove) to 10 (definitely approve).
Antecedents. We measured values by means of selected items from the PVQ57 (Cieciuch et al. 2014; Schwartz et al. 2012), using the following instructions: “Here we briefly describe some people. Please read each description and think about how much each person is or is not like you. Tick the box to the right that shows how much the person in the description is like you (very much like me, like me, somewhat like me, a little like me, not like me, not like me at all)” (Davidov, Schmidt, and Schwartz 2008; Zercher et al. 2015). Measures of the value domains universalism (concern and tolerance, portrait values questionnaire (PVQ) items 5, 37, 52, 14, 34, 57) and personal and societal security (PVQ items 13, 26, 53, 2, 35, 50) were of particular interest to us (see Table 3 for the items used; e.g. Davidov and Meuleman, 2012).
Value items (shown here in the male version only).

Note: The first column reports the item number in the PVQ.
SEC: security; UNI: universalism; items were assigned to three parcels per value domain (cf. the column labeled “parcel”).
Background variables. For sample descriptive purposes, we included the following background variables: year of birth, gender, education (“About how many years of education have you completed, whether full-time or part-time? Please report these in full-time equivalents and include compulsory years of schooling. Type in …”), immigration status (“Were you born in the USA? Yes/No/Don't know”), and self-reported income (“Which of the following descriptions comes closest to how you feel about your household's income nowadays? Living comfortably on present income = 1, Coping on present income = 2, Finding it difficult on present income = 3, Finding it very difficult on present income = 4, Refusal = 7, Don't know = 8”; ESS 2001).
Sample
A convenience sample of U.S. residents from the Amazon Mechanical Turk panel responded to a Qualtrics survey. Nine respondents were deleted because they responded negatively to the question, “In your honest opinion, should we use your data in our analyses in this study? Please answer honestly, this will not affect your compensation” (Meade and Craig 2012). In addition, six respondents were dropped because they provided no responses to the four profiles in the factorial design. The resulting sample included N = 232 respondents, with ages ranging from 20 to 79 years (Mean = 38.47); 36.64% of the respondents were female, and respondents had 13.86 years of formal education on average (min = 1, max = 30). A total of 3.9% of respondents were immigrants (i.e. they were not born in the USA), and the income distribution suggested that 36.2% were “Living comfortably on present income,” 41.4% were “Coping on present income,” 12.5% were “Finding it difficult on present income,” and 8.2% were “Finding it very difficult on present income.”
Results
The mean ratings and standard deviations in response to the four vignettes were M = 6.35 (standard deviation SD = 2.59) for Canadian immigrants with no university degree; M = 7.85 (SD = 2.07) for Canadian immigrants with a university degree (i.e. the most positive attitude); M = 5.97 (SD = 2.81) for Mexican immigrants with no university degree (i.e. the least positive attitude); and M = 7.60 (SD = 2.16) for Mexican immigrants with a university degree.
For the analysis, we used the R package lavaan 0.6–3 (Rosseel 2012). However, any general structural equation modeling (SEM) package could be used to analyze the data (i.e. the model specification is not specific to lavaan). In the current empirical application, we fit the SEMWISE model corresponding to Figure 2 to the four profile ratings. Table 4 reports the SEMWISE model syntax for lavaan and Mplus. The SEMWISE model fits the data well (χ2(1) = .467, p = 0.494, CFI = 1.00, TLI = 1.02, RMSEA = .000, SRMR = .008). Note that this model includes main effect weight factors only (i.e. it is assumed that there is no interaction between country of origin and education level), and the fact that the model showed no significant misfit to the data implies that the interaction effect between country of origin and education level is not significantly different from zero.
SEMWISE model syntax in lavaan and Mplus.
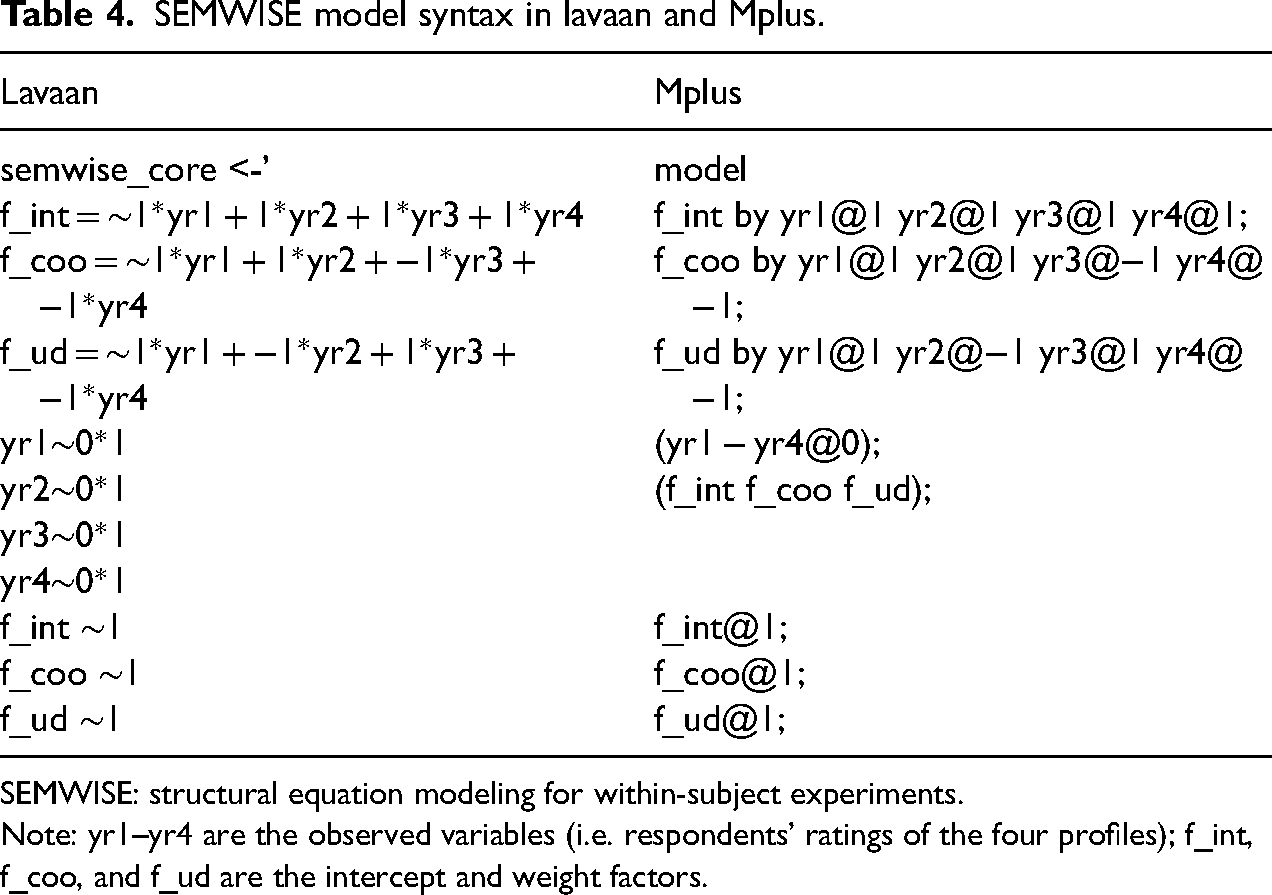
SEMWISE: structural equation modeling for within-subject experiments.
Note: yr1–yr4 are the observed variables (i.e. respondents’ ratings of the four profiles); f_int, f_coo, and f_ud are the intercept and weight factors.
The parameter estimates for this model are reported in Table 5. The estimated mean of the intercept factor of 6.946 shows that respondents are, on average, moderately positively predisposed toward immigrants in general (as the response scale ranged from 0 to 10). The average effect of Canada (Mexico) as COO is .149 (−.149), which implies that, on average, immigrants from Canada are rated .298 (i.e.149 − (−.149)) points higher than those from Mexico (p = 0.002). Furthermore, immigrants with a university degree are, on average, rated 1.560 (i.e. 0.780 − (−.780)) points higher than those without (p < 0.001). These fixed effects capture the mean rating and the mean differences between the levels of the two attributes across respondents, but importantly all the factors show statistically significant and substantial variance. This finding indicates that there are individual differences in mean profile ratings and in the effects of country of origin and education level on acceptance of immigrants. Given this variability, we can relate the intercept and weight factors to other variables, thus utilizing the extended SEMWISE approach (in this case, a conditional SEMWISE model) in which the latent weight factors are expressed as functions of potential antecedents.
Parameter estimates for the core SEMWISE model in Figure 2.
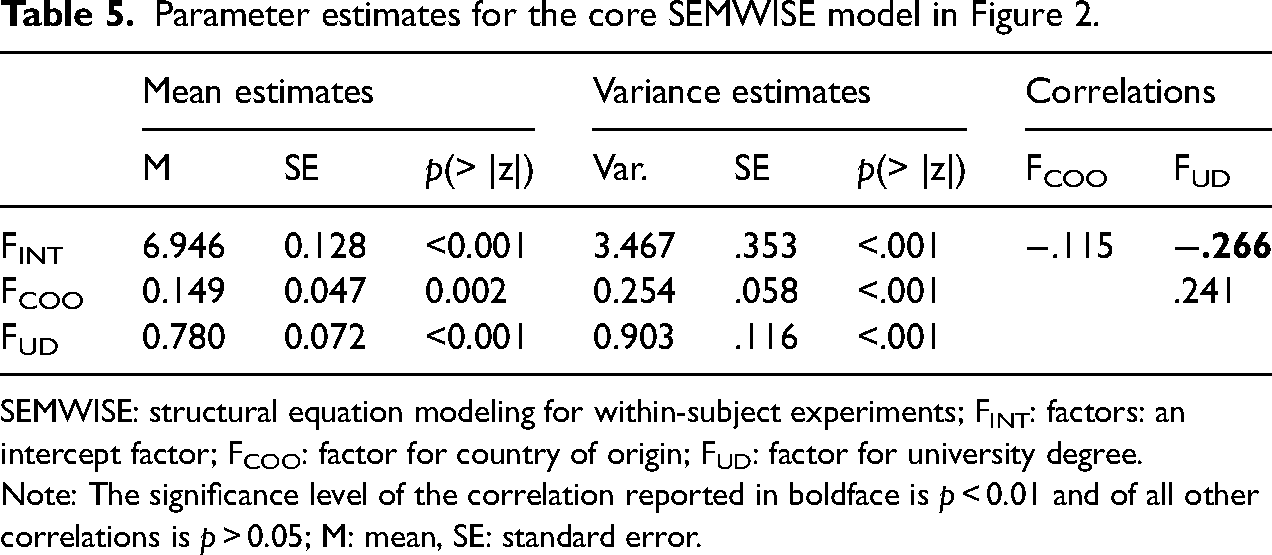
SEMWISE: structural equation modeling for within-subject experiments; FINT: factors: an intercept factor; FCOO: factor for country of origin; FUD: factor for university degree.
Note: The significance level of the correlation reported in boldface is p < 0.01 and of all other correlations is p > 0.05; M: mean, SE: standard error.
For the illustration we use value measures as antecedents. We first evaluate the measurement model for the value factors. Specifically, we constructed three parcels for universalism and three parcels for security (Cole, Perkins, and Zelkowitz 2016), and our specific parceling approach is reported in Table 3. A confirmatory factor analysis with universalism and security as latent factors, each with three parcels as indicators, yields an acceptable fit based on most fit indices (χ2(8) = 26.08, p = 0.001, CFI = .984, TLI = .971, RMSEA = .099, SRMR = .031). In addition, the standardized factor loadings range from.82 to.92 (all p-values <0.001), and both factors show good internal consistency with composite reliabilities of C.R. = .93 for universalism and C.R. = .90 for security.
Adding the universalism and security factors (each with three parceled indicators) as antecedents of the intercept and weight factors to the SEMWISE model resulted in an acceptable model fit (χ2(27) = 47.345, p = 0.009, CFI = .988, TLI = .979, RMSEA = .057, SRMR = .030). The estimates of the structural coefficients for the intercept and the weight factors are reported in Figure 6. Consistent with expectations, and as evidenced by the relationship between the values and the intercept factor, participants who scored higher on universalism values were more positively predisposed toward immigrants in general, supporting H1a. In contrast, participants who scored higher on security values were less positively predisposed toward immigrants in general, supporting H2a. The associations between the values and the weight FCOO and education displayed in Figure 6 suggest that universalistic individuals are approximately equally supportive of immigrants regardless of country of origin and level of education. This is demonstrated by the small and nonsignificant association between the universalism scores and the two weight factors, which is consistent with hypotheses H1b and H1c. By way of contrast, individuals who attribute greater importance to security values prefer immigrants from Canada (vs. Mexico) and immigrants with a university degree (vs. not having a university degree), as demonstrated by the significant and positive associations between the security value scores and the two weight factors, which supports H2b and H2c.
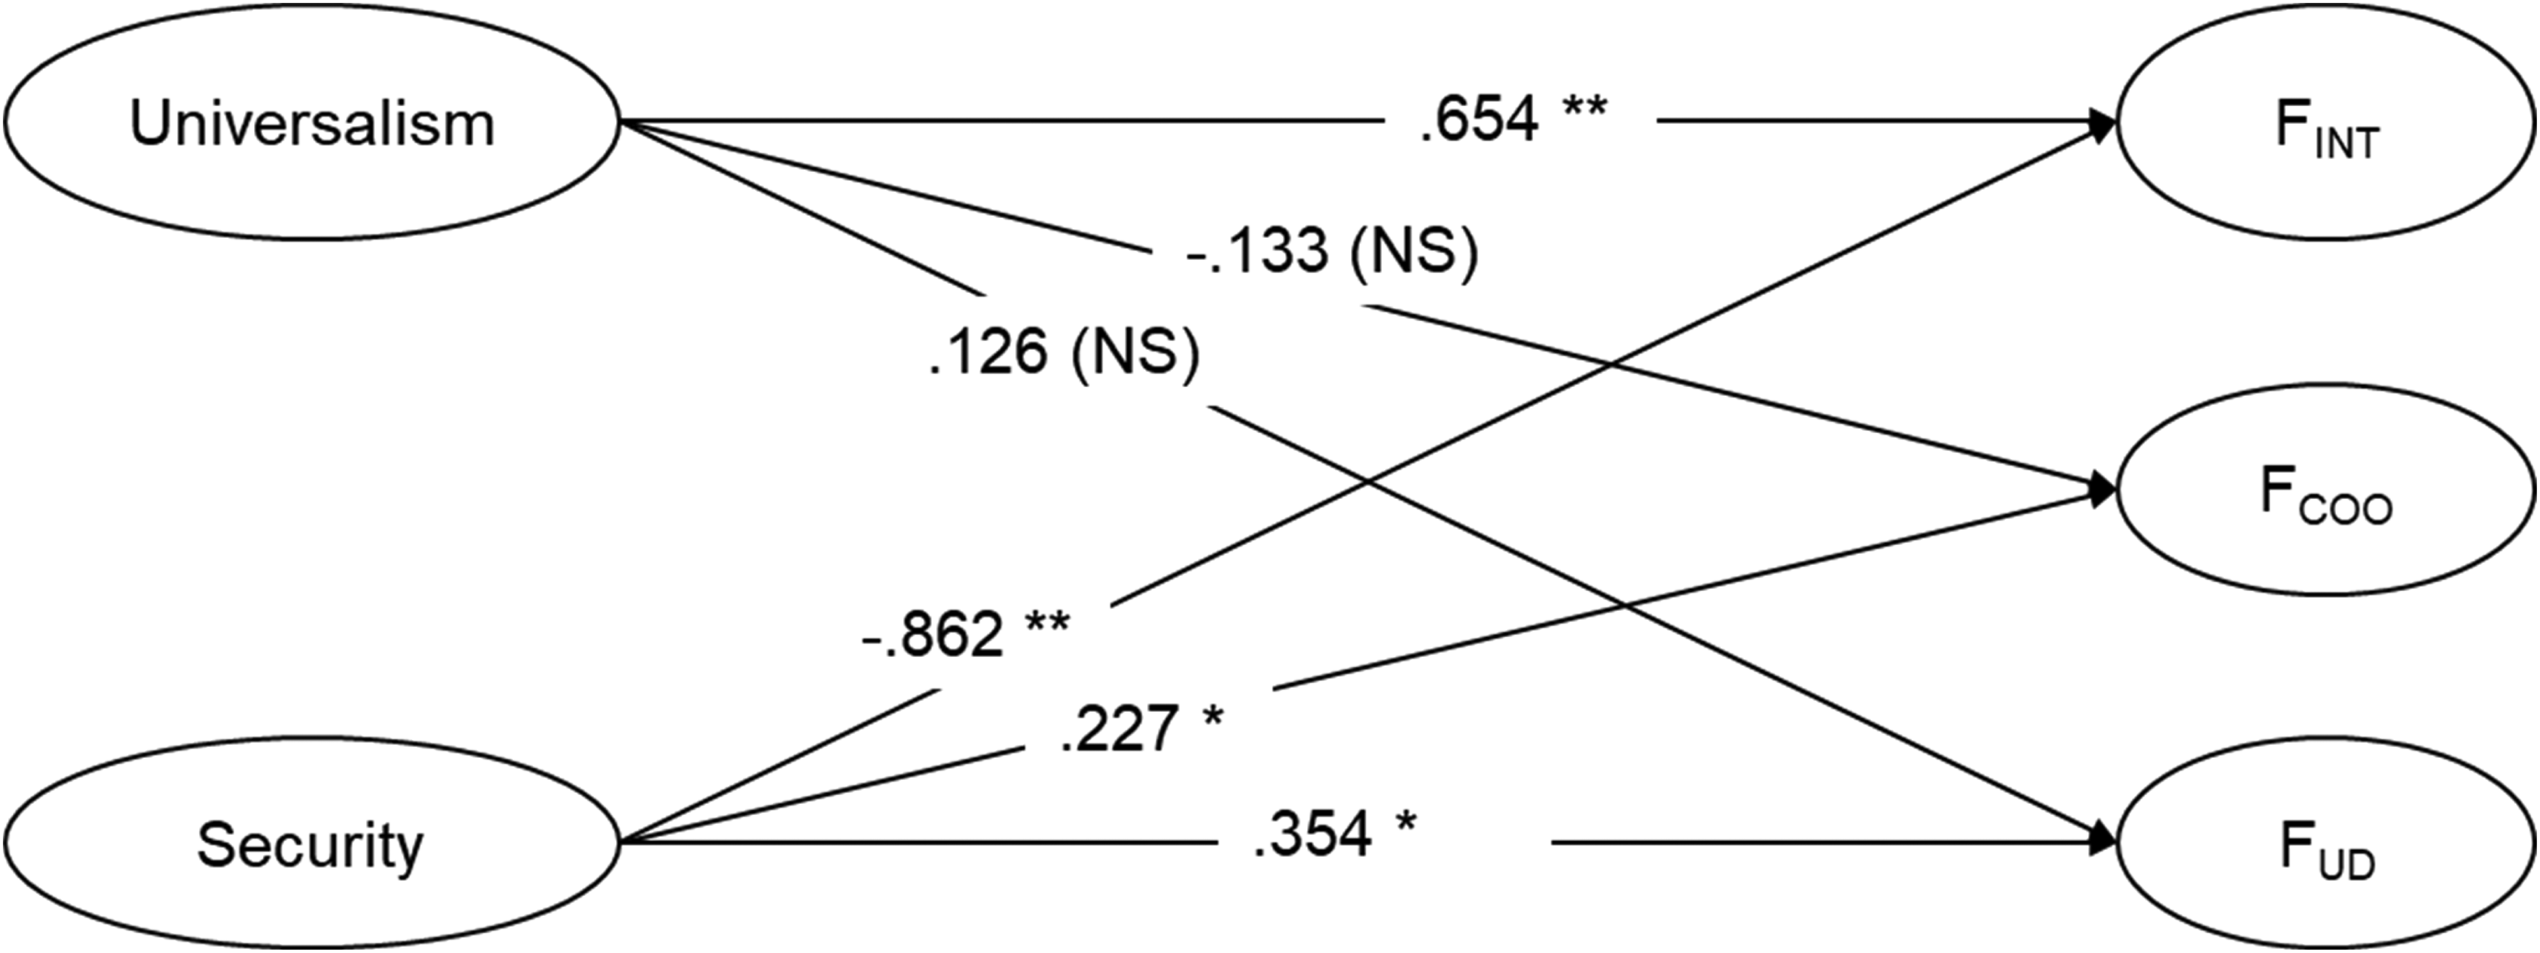
Structural model with estimates.
Extensions of the SEMWISE model
The previous empirical example demonstrated the basic SEMWISE model with added latent antecedents. This basic SEMWISE model can be extended in various ways. These extensions relate to the factors manipulated in the survey, the measurement of the dependent variable (ratings), and differences in model parameters across groups of respondents.
In the basic model, the manipulated factors were binary nominal variables. If a factor is metric and the effect of different levels of the factor on responses is thought to be linear, loadings with equal intervals can be used (e.g. loadings of 1, 2, and 3 for price levels of $1, $2, and $3, respectively). It is also possible to model interactions between the manipulated factors. The loadings of interaction factors are obtained by multiplying the loadings of the components of the interaction. For example, if a researcher expects that COO and level of education have an interactive effect on acceptance of immigrants, an interaction weight factor with loadings of + 1, −1, −1, and + 1 can be added to the model (although it should be noted that for the model to be identified, further restrictions should be imposed).
Often, the dependent variable is measured with a single indicator, especially when respondents are asked to rate many different profiles. However, if a researcher believes that single measures may not be sufficiently reliable, multiple measures may be used to assess respondents’ reactions to each profile. A second-order factor model can be specified in this case, in which the first-order factors capture the commonality of the multiple responses to each profile and the first-order factors are then related to the second-order weight factors. It is also possible to account for method variance in the ratings (Podsakoff et al. 2003), for example, by relating the observed responses to a hypothesized method factor (e.g. social desirability) or including an (implicit) method factor (e.g. if there are reverse-keyed items, a method factor for the reversed items could be specified; see, e.g. Billiet and Davidov 2008; Billiet and McClendon 2000).
Finally, the basic SEMWISE model was formulated for a single-sample context. However, it is possible to specify a multisample model in which separate models are estimated and tested for different groups of respondents. For example, a researcher may hypothesize that men and women respond differently to immigrants and thus might want to investigate gender differences explicitly. Gender would be employed as a grouping variable in this case, and the multisample model could be used to formally assess similarities and differences in acceptance of immigrants between men and women (e.g. in terms of mean differences and homogeneity of effects as well as relationships with various antecedents and consequences). Consequently, one could estimate if the means and variances of the weight factors differ across males and females. The multisample approach may be particularly beneficial in cross-cultural and cross-country studies.
Summary and general discussion
Factorial surveys are commonly used by researchers in many disciplines, including the social sciences in general and sociology in particular. One likely reason is that they offer several advantages over classical (Likert-type) attitude items. Analyzing people's responses to vignettes with concrete descriptions is likely to yield more realistic and direct representations of judgments and evaluations than using more general survey questions. In addition, responses to vignettes tend to be less prone to social desirability bias. In the current paper, we proposed that data from factorial surveys could be analyzed in an SEM framework using the Structural Equation Modeling for Within-Subject Experiments, that is, SEMWISE, approach. In SEMWISE, the weights linking the factorial attributes to responses are modeled as latent variables and the model is essentially a confirmatory factor model with a fixed loading matrix. The key advantages of using SEMWISE to analyze factorial survey data are that (a) the latent intercept and weights can be easily related to observed or latent antecedents and outcome variables—thus making it possible to model interindividual variation in these weights; (b) measurement error in observed responses can be accounted for; (c) the overall fit of the model can be assessed; and (d) the generalizability of the means of the intercept and weights and their relationships with other variables across groups of respondents can be studied using multisample models.
In this paper we began by introducing the method, we illustrated how it can be applied, and we explained its advantages over other approaches to analyze factorial surveys. In the practical illustration we examined how the (positive) effect of universalism values and the (negative) effect of security values on people's willingness to allow immigrants into the country may vary as a function of immigrants’ country of origin (Canada vs. Mexico) and level of education (university degree or no university degree). The goal of the empirical illustration was to provide a hands-on example of how the SEMWISE approach can be used in practice and to verify that it yields results that are consistent with the extant literature. In line with expectations, the results suggested that universalists more strongly endorsed, and individuals scoring higher on security more strongly rejected, immigrants in general. Importantly, individuals who attributed greater importance to security values preferred immigrants from Canada (vs. Mexico) and immigrants with a university degree (vs. not having a university degree).
Even though we pointed out some advantages of factorial surveys, there are also some limitations, and these limitations cannot be avoided by using structural equation modeling during data analysis. First, while the factorial survey approach tries to address the problem of social desirability by employing specific scenarios rather than more general questions as commonly implemented in surveys, it does not resolve the problem fully. It could still be the case that respondents provide socially desirable responses, which may bias the conclusions. Furthermore, although the description of specific vignettes for the measurement of dependent variables may help to establish causality, the direction of the causal process linking the individual difference variables to the weight factors is not entirely clear (i.e. people's responses to specific scenarios may influence the values they express later in the survey). Only panel or experimental studies can address this issue more concretely. Finally (and as pointed out by a reviewer), vignette studies are not commonly included in large social surveys such as the European Social Survey, the European Value Study, or other large-scale international surveys. One reason may be that classical Likert items are perceived as relatively efficient, especially when the aim it to measure many evaluations that do not involve tradeoffs. However, if the aim is to understand (individual differences in) the way attributes of social objects influence respondents’ evaluations of these objects, especially when tradeoffs between attributes are involved, factorial survey designs may be the more useful approach.
The SEMWISE approach may be particularly useful when researchers want to model individual variation in individuals’ responses to the attributes manipulated in a factorial survey, and when they want to relate this individual variation to other variables, especially if these relations involve conceptual networks or sequences of multiple variables (e.g. with mediation) and/or latent variables (e.g. personal values). Our practical illustration demonstrated that the effects of vignette attributes on responses vary significantly across individuals, and the SEMWISE approach may help identify and model such variation more accurately.
Footnotes
Acknowledgments
Eldad Davidov would like to thank the University of Zurich Research Priority Program Social Networks. Hans Baumgartner gratefully acknowledges support from the Smeal Chair Endowment. All three authors would like to thank Lisa Trierweiler for the English proof of the manuscript.
Declaration of conflicting interests
The authors declared no potential conflicts of interest with respect to the research, authorship, and/or publication of this article.
Funding
The authors received no financial support for the research, authorship, and/or publication of this article.