
Abstract
This study addresses the complexities of midpoint and non-substantive responses, such as “Don’t Know,” in Likert scale surveys on gender attitudes. While existing research often assumes these responses are neutral or random, this study challenges that notion by applying the item response tree model to disentangle respondents’ attitudes from their response tendencies. Analysis of data from the Chinese General Social Survey shows that traditional gender attitudes are associated with a higher likelihood of such responses, indicating biases in conventional methods. After disentangling these elements, I reassemble them through latent profile analysis to examine the dominant configurations of gender attitudes and response tendencies. Five distinct profiles emerge: Passionate Egalitarians, Genuine Neutrals, Forthright Moderates, Evasive Traditionalists, and Unembellished Traditionalists. Passionate Egalitarians advocate strongly for gender equality, while Evasive Traditionalists use non-substantive responses to conceal traditional views. This study provides a refined approach to rating scale analysis, advancing both sociological methodology and gender studies.
Keywords
Introduction
Rating scales are a fundamental tool in survey research, commonly used to measure constructs such as attitudes, opinions and beliefs across various disciplines in social science. A typical example is a five-point Likert scale that measures the level of agreement with statements through categories like “strongly disagree,” “disagree,” “neither disagree nor agree,” “agree,” and “strongly agree.” Alongside these scales, options such as “Don’t Know” (DK) and “Refuse to answer” are often included. These options were originally designed to provide respondents with an “escape route” when they truly have no opinion or feel uncomfortable giving a substantive answer, thereby preventing insincere responses. Their simplicity has made rating scales, especially Likert scales, ubiquitous among researchers (Keusch and Yang 2018; Sturgis et al. 2014; Truebner 2021).
The typical approach to Likert-type scales in survey-based research involves implicit yet critical assumptions. Researchers often treat DK and refusal responses as missing data, assuming these responses occur randomly and are unrelated to the underlying attitudes (Kuha et al. 2018; Mignogna et al. 2023). Subsequently, summary statistics like the mean or sum score are calculated to measure the construct’s level (Kulas et al. 2008). This approach further assumes that midpoint responses, such as “neither disagree nor agree,” reflect true neutrality on the latent construct’s spectrum (Sturgis et al. 2014).
However, these assumptions do not always hold true (Kulas et al. 2008; Mignogna et al. 2023; Sturgis et al. 2014). Survey research shows that response categories can be strategically used to obscure respondents’ true attitudes (e.g., Gilljam and Granberg 1993; Graham 2021; Tourangeau et al. 2000). This deviation between true attitudes and observed response can arise from factors such as a lack of effort, known as “satisficing” (Krosnick 1991), or from a desire to avoid providing socially undesirable answers (Fisher 1993). When such deviations are systematically related to underlying attitudes, they introduce measurement error and threaten the validity of survey-based inference (De Leeuw 2001).
Given these challenges, the first research objective of this study is to explore a method for disentangling underlying attitudes from respondents’ tendencies to use categories, particularly non-substantive ones like DK and refusal responses, as well as midpoint categories. This approach aims to identify true attitudes and examine the relationships between these attitudes and response tendencies.
I focus on gender attitudes as the primary construct of interest for several reasons. These attitudes reflect support for dividing paid work and family responsibilities along gendered lines, making them a crucial area of study in social science (Davis and Greenstein 2009). Additionally, gender attitudes are frequently measured using Likert scales, providing a relevant context for examining response category issues. Moreover, questions about gender roles are often sensitive, potentially leading to attitude-response discrepancies, which makes studying these discrepancies important.
Building on this focus, I explore the innovative application of the IR Tree (IRTree) model from the Item Response (IR) theory (De Boeck and Partchev 2012; Jeon and De Boeck 2016) to achieve the first research objective. The tree structure of the model views observed responses as the outcome of a series of decision processes. These processes are driven by latent traits representing respondents’ underlying attitudes and tendencies towards response categories, including non-substantive and midpoint categories. I do not refer to these tendencies as response styles, as they are specific to gender attitudes and may not exhibit the stability required for response styles across different contexts and time points (Paulhus 1991; Van Vaerenbergh and Thomas 2013; Weijters et al. 2010). Instead, I interpret these tendencies as context-specific ways respondents report gender attitudes. This interpretation is supported by empirical analyses reported in subsequent sections.
After disentangling attitudes from response tendencies, the second objective is to reassemble these components to identify the dominant configurations that naturally emerge within this context. I employ latent profile analysis (LPA; Gibson 1959; Oberski 2016), a statistical technique designed to reveal hidden patterns and groupings within the data (Spurk et al. 2020). LPA classifies respondents into distinct profiles based on their attitudes and how they report them, in terms of their tendencies towards different response categories. This approach provides a comprehensive understanding of how gender attitudes are held and, more importantly, expressed across different population segments.
The third objective, which follows naturally, is to examine the demographic characteristics associated with each profile, gaining deeper insights into the factors driving different attitudes and response tendencies.
By disentangling underlying attitudes from response tendencies (research objective one), this paper is the first to apply the IRTree model to test the often unexamined assumptions that non-substantive responses are random missing values or that midpoint selections are neutral—assumptions commonly questioned in survey methodology but still prevalent in gender research. The results offer new insights into the latent attitudes underlying non-substantive and midpoint responses. By reassembling the separated attitudes and response tendencies to identify emergent combinations (research objectives two and three), I integrate IRTree models and LPA to reveal the diversity in gender attitudes and their expressions across demographic groups. This framework, from disentangling to reassembling, not only advances attitude measurement methodology but also deepens the sociological understanding of gender attitudes.
Theoretical Foundations and Literature Overview
This chapter lays the theoretical foundations of the study by discussing three interconnected aspects. First, Section “Disentangling Attitudes From Tendencies: Psychological Mechanisms Behind Survey Responses” reviews relevant theories from survey methodology on the response process, emphasizing potential discrepancies between attitudes and responses. Building on this, Section “Challenges in Measuring Gender Attitudes” examines specific challenges in gender attitude research, setting the stage for the first research objective. Finally, Section “Reassembling Attitudes and Tendencies: A Multidimensional Analysis of Gender Attitudes” presents the rationale for reassembling attitudes and tendencies to uncover underlying patterns from a substantive perspective, addressing the second and third research objectives.
Disentangling Attitudes From Tendencies: Psychological Mechanisms Behind Survey Responses
Survey methodology research has long focused on designing rating scales, particularly the inclusion of midpoint responses like ‘‘neither/nor” and non-substantive categories such as ‘‘don’t know” (DK) and ‘‘refuse to answer.” Researchers have sought to understand the psychological mechanisms driving respondents’ choices of these options and the nature of these decisions (e.g., Cornesse and Blom 2023; Purdam et al. 2020; Schuman and Presser 1996; Sturgis et al. 2014; Truebner 2021).
A widely used theoretical framework in this context is satisficing theory (Krosnick 1991). This theory suggests that, instead of expending the mental effort required for optimal answers, respondents often settle for satisfactory, less demanding responses. Consequently, they may select non-substantive or midpoint responses to cut cognitive corners, leading to answers that do not accurately reflect their true attitudes and introducing measurement error. Building on the assumed link between the use of certain response categories and measurement error, many studies have used non-substantive and midpoint responses as indicators of satisficing to indirectly assess measurement error (for a review, see Roberts et al. 2019).
However, satisficing is not the only reason respondents choose certain response categories. Respondents may not be avoiding cognitive effort; instead, they might thoroughly consider their options and still choose non-substantive or midpoint responses. For instance, choosing a nonsubstative response may genuinely reflect uncertainty (Cornesse and Blom 2023; Schuman and Presser 1996; Sturgis et al. 2014), and a midpoint response may accurately indicate neutrality (Blasius and Thiessen 2001). The relationship between midpoint and DK responses can also be complex. In some cases, midpoint responses act as a hidden DK, serving the same purpose (Blasius and Thiessen 2001; Sturgis et al. 2014; Truebner 2021), as respondents may feel psychological pressure to answer and thus avoid explicitly selecting DK.
Another scenario that warrants consideration, yet has received less attention in the existing literature, is that respondents might choose certain options to avoid socially undesirable answers. Social desirability bias refers to the human tendency to present oneself in the best possible light (Fisher 1993; Tourangeau et al. 2000). As Purdam et al. (2020) suggests, respondents may use midpoint or non-substantive options to conceal their true opinions, particularly when those opinions might be viewed unfavorably by others.
The mechanisms outlined above, ranging from satisficing and genuine uncertainty to social desirability concerns, highlight the diverse psychological processes that may underlie midpoint and non-substantive responses. Berinsky (2004) dual-process framework offers a useful conceptual integration of these mechanisms. In his study of political opinion and item nonresponse, he distinguishes between two central drivers: cognitive burden, encompassing both effort-avoidance (satisficing) and informational uncertainty, and social desirability pressures. While developed in the context of political surveys, this framework supports a broader view of DK and refusal responses as psychologically motivated choices rather than random or dismissive behaviors, complementing the strands of research reviewed above.
Despite these theoretical developments, empirical research remains limited. One particularly underexplored pathway is the role of social desirability bias in driving such responses. The primary challenge lies in uncovering the underlying psychological processes respondents undergo before selecting a specific answer, a task essential for estimating the true attitude—which is otherwise difficult, if not impossible, to obtain (Tourangeau et al. 2000).
Previous research on non-substantive and midpoint responses has primarily relied on experimental designs, such as split-ballot experiments, and follow-up questions (Alwin 2007; Malhotra et al. 2009; Shoemaker et al. 2002; Sturgis et al. 2014; Tourangeau et al. 2000). Although these methods show how certain response options affect respondents’ final answers, they often fail to uncover the specific psychological mechanisms behind these choices.
Scholars have noted a persistent lack of understanding about the psychological mechanisms respondents employ when answering survey questions, calling for greater attention to these internal processes (Cornesse and Blom 2023; Sturgis et al. 2014).
Challenges in Measuring Gender Attitudes
Building on the understanding of how respondents’ psychological mechanisms influence their selection of response categories, this section narrows the focus to the specific domain of gender attitudes. Also referred to as gender ideology, gender role attitudes, or attitudes about gender, these attitudes generally describe an individual’s level of support for the division of paid work and family duties along traditional gender lines, with distinct roles for men and women (Davis and Greenstein 2009). Surveys often use Likert scales to measure these varying levels of support, making this domain relevant for analysis (for a detailed review of the surveys and items, see Davis and Greenstein 2009).
Empirical research on gender attitudes examines both their formation and impact. Studies have identified key predictors of gender attitudes, including social and demographic characteristics such as gender (Bolzendahl and Myers 2004), racial and ethnic background (Dugger 1988), educational attainment (Bryant 2003; Du et al. 2021), labor force participation (Baxter and Kane 1995; Cassidy and Warren 1996), and the gender attitudes of one’s family of origin (Burt and Scott 2002). Additionally, gender attitudes, either directly or as moderating factors, affect family processes and social outcomes, including the division of household labor (Allen and Webster 2001; Fuwa 2004), union stability and relationship quality (Davis and Greenstein 2004), occupational choices (Bielby and Bielby 1992), maternal employment (Ruppanner et al. 2021), and health outcomes (He and Xie 2022).
Despite the valuable insights provided by survey-based studies, significant measurement issues persist. Researchers often remove nonsubstansive answers without examining them for potential bias, assuming they are missing at random. This practice aligns with concerns raised by Mignogna et al. (2023) about handling missing data in empirical research. Similarly, midpoint responses are often treated as neutral. However, as discussed earlier, choosing a non-substantive response does not necessarily indicate genuine uncertainty, nor does selecting a midpoint response always reflect true neutrality. To address these concerns, some researchers treat non-substantive responses as non-egalitarian (Cotter et al. 2011), and midpoint responses as leaning toward a particular side of the scale, depending on the content, rather than as neutral (Chen and Ge 2018; Du et al. 2021; Wang et al. 2022). While these treatments are reasonable, they rely on intuitive assumptions and lack empirical validation.
The measurement challenges in survey-based research on gender attitudes—unverified and inconsistent assumptions made when handling non-substantive and midpoint answers—highlight the need for greater attention to the respondents’ internal processes, as emphasized in survey methodology.
In response to this challenge, I use the item response tree (IRTree) model (De Boeck and Partchev 2012; Jeon and De Boeck 2016). The IRTree model focuses on the psychological decision-making process behind selecting a response category, rather than just the final response. When applied to a set of Likert scale items measuring the same construct, the IRTree model decomposes the observed responses into multiple underlying factors. These factors include the true attitudes related to the construct and tendencies toward specific response categories, allowing for an exploration of their relationships. A detailed description of the IRTree model is provided in Section “IRTree: Disentangling Attitudes from Tendencies”.
By using this model, the first research objective—to explore a method for disentangling underlying attitudes from response tendencies in the context of gender attitudes—will be addressed. The insights gained not only enhances the understanding of the psychological mechanisms behind respondents’ choices from a survey methodology perspective but also tests unexamined assumptions, improving the measurement and understanding of gender attitudes.
Reassembling Attitudes and Tendencies: A Multidimensional Analysis of Gender Attitudes
The response tendencies disentangled through the IRTree method, include the latent inclination toward selecting non-substantive and midpoint categories, which are the primary focus, as well as extreme categories as an additional outcome. These extreme categories, such as “strongly (dis)agree” or “completely (dis)agree,” are positioned at the endpoints of Likert scales. A relevant term is extreme response style (ERS), which refers to the tendency of respondents to select extreme categories, irrespective of the item content. It is recommended that ERS be captured using large sets of sufficiently heterogeneous items (Baumgartner and Steenkamp 2001; Weijters et al. 2010).
As stated earlier, the estimated response tendencies through IRTree models are not termed as response styles, as they are based solely on gender attitude items. Instead, they are interpreted as content-specific tendencies that respondents temporarily adopt when reporting gender attitudes, leaving open the possibility that such tendencies might change when respondents are asked different questions. Specifically, the tendency toward selecting extreme categories is considered a way for respondents to express the intensity of their gender attitudes. To evaluate this interpretation empirically, I conducted a cross-domain analysis comparing their occurrence across items on gender attitudes and social attitudes. The results of this analysis, presented in Appendix A in the online supplement, support the interpretation that these tendencies are shaped by item content and context, rather than representing stable, general response styles.
In sum, the disentangled response tendencies reflect different ways of respondents choose to express their gender attitudes, as manifested through the use of various response categories. These expression styles are integral to the attitudes themselves, highlighting their multidimensionality. Respondents who occupy the same position on the latent gender attitude spectrum may express their attitudes differently. For example, some may prefer non-substantive categories, while others may favor extreme categories. The IRTree approach, applied at the individual level, enables the identification of predominant expressions across the spectrum of gender attitudes at the population level.
The second and third research objectives are to explore the multidimensionality of gender attitudes by uncovering distinct combinations of attitudes and their expressions using latent profile analysis (LPA; Gibson 1959; Oberski 2016), and to further analyze the demographic variables associated with each profile to understand the characteristics of the individuals within these profiles.
Recent studies on gender attitudes have also explored its multidimensionality using latent class analysis, revealing mixed profiles where individuals hold egalitarian views on some issues while maintaining traditional views on others (Begall et al. 2023; Scarborough et al. 2019), a perspective often discussed in the context of the “stalled gender revolution.” These studies have significantly contributed to our understanding of gender attitudes by highlighting the mixed nature of these views.
While these studies primarily focus on the static distribution of gender attitudes across various domains (e.g., family, workplace) as separate entities, the present study adds a dynamic perspective by examining both the attitudes and their expressions. This shift enriches the existing literature on the multidimensional nature of gender attitudes.
Methods
This section details the methodology employed in this study, beginning with the data source and the survey items used in Section “Data”. Section “IRTree: Disentangling Attitudes From Tendencies” describes the IRTree model, which is used to disentangle the underlying attitudes from response tendencies (research objective one). Next, Section “Latent Profile Analysis: Reassembling Attitudes and Tendencies” outlines the use of LPA to identify distinct combinations of attitudes and their expressions (research objective two). Finally, Section “Multinomial Logistic Regression Model: Latent Profile Membership by Respondent Characteristics” discusses the Multinomial Logistic Regression Model, which examines the demographic characteristics associated with each profile (research objective three).
Data
To achieve the research objectives, data from the Chinese General Social Survey (CGSS) is utilized. The CGSS is a nationalwide, repeated cross-sectional survey that has been conducted since 2003. It employs a multistage, proportional-to-size sampling technique to draw representative samples of the adult Chinese population, with interviews conducted face-to-face. The CGSS offers a comprehensive dataset on demographic characteristics and social attitudes, making it a valuable resource for various research fields, notably in studies of gender attitudes (Du et al. 2021; Liu et al. 2019; Qing 2020; Wang et al. 2024).
Five attitudinal questions regarding gender roles were introduced in the CGSS for the first time in 2010, with responses recorded on a five-point Likert scale ranging from “Agree strongly” to “Disagree strongly”. In 2017, the survey explicitly included options for “Don’t Know”(DK) and “refusals” alongside the existing five-point scale. To ensure consistent exploration of non-substantive responses (i.e., DK and refusals) across different years, the analysis is confined to survey waves from 2017 onward. This includes data from the surveys conducted in 2017, 2018 and 2021, comprising a total of 33,517 respondents.
Detailed information about the five items and their response distributions across all categories is displayed in Table 1. The distributions are expressed as percentages, showing the proportions of respondents’ agreement or disagreement with each item, as well as the frequencies of DK and refusals responses. These items have been extensively used to assess gender attitudes in China, showing strong validity and reliability among Chinese citizens (Du et al. 2021; Qing 2020).
CGSS Gender Attitude Items and Response Distributions.
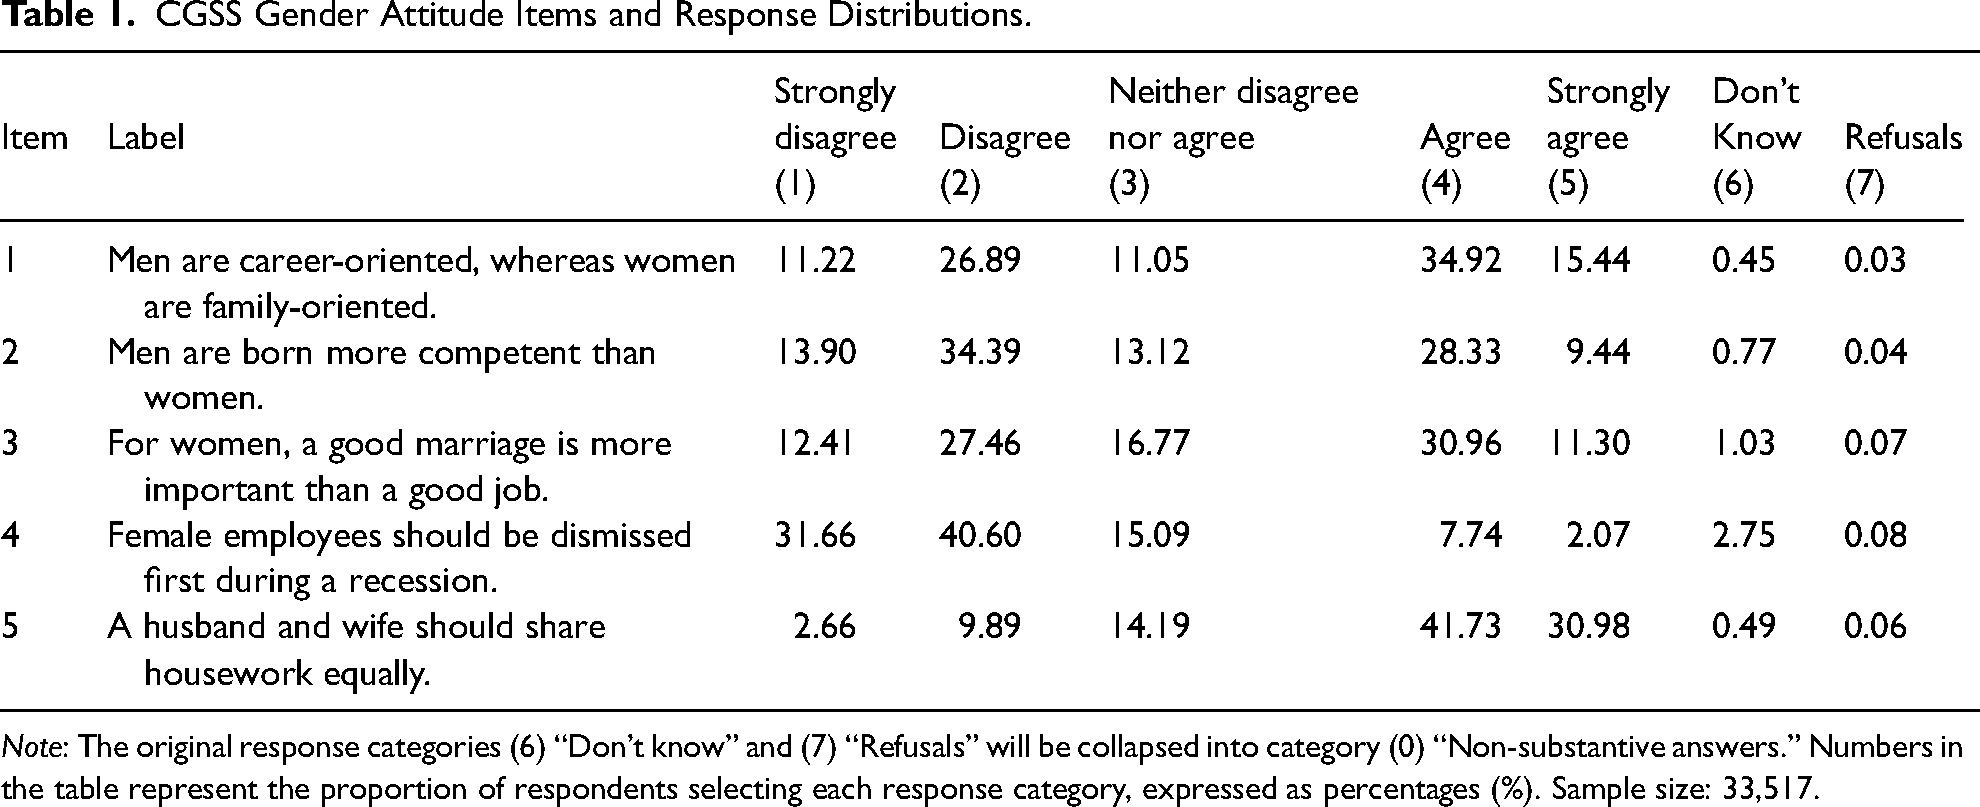
Note: The original response categories (6) “Don’t know” and (7) “Refusals” will be collapsed into category (0) “Non-substantive answers.” Numbers in the table represent the proportion of respondents selecting each response category, expressed as percentages (%). Sample size: 33,517.
Items 1, 2, and 3 reflect essentialist views of gender roles and traditional family structures, emphasizing conventional expectations such as men as breadwinners (Item 1), innate gender differences in competence (Item 2), and prioritizing marriage over professional aspirations for women (Item 3). In contrast, Items 4 and 5 highlight gender equality, with Item 4 addressing employment equity during economic downturns (public sphere) and Item 5 focusing on the division of housework (private sphere). Together, these multidimensional items juxtapose public and private domains, reflecting societal expectations of gender roles and providing a comprehensive framework for analyzing gender attitudes.
Respondents holding traditional views on gender roles are expected to agree (or strongly agree) with the first four items but disagree (or strongly disagree) with the last item. Since Item 5 measures the construct of gender attitudes in the opposite direction to the other items, the coding on the Likert scale for this item is reversed in analysis: coding 1 as 5, 2 as 4, 3 as 3, 4 as 2, and 5 as 1. This ensures that higher scores across all items uniformly reflect more traditional attitudes.
However, as with any Likert scale, there is a potential risk that some respondents may exhibit acquiescence response style—that is, a general tendency to agree with statements regardless of content. This concern is particularly relevant here, as four of the five items are keyed in the same direction, which limits the ability to precisely assess the extent of acquiescence in this set of items. Nevertheless, I conducted a series of robustness checks to explore whether such tendencies may substantially influence the results. The findings suggest that while some agreement patterns are present, they do not appear to substantially drive the observed response distributions in gender attitudes. 1
Notable variations in agreement and disagreement levels are present across items, reflecting their differing capacities to elicit traditional or egalitarian attitudes. For example, Item 5, addressing equity in the division of housework, evokes the most egalitarian responses, while Item 1, emphasizing career-and family-oriented roles, aligns most strongly with traditional views. Additionally, non-substantive responses (DK and refusals), though relatively infrequent overall, show clear variations across items, with Item 4 (dismissal during a recession) provoking the highest proportion of such responses.
While DK and refusals are often referred to as item nonresponse in the literature (De Leeuw et al. 2003), this study follows Cornesse and Blom (2023) in referring to them as non-substantive answers, reflecting a decision not to choose a substantive answer on the Likert scale. Although DK responses and refusals may arise from different mechanisms (De Leeuw et al. 2003), they are typically excluded together as missing data in survey-based studies (Mignogna et al. 2023). Consistent with this approach, they are treated here collectively as a single category of non-substantive answers. Furthermore, the proportion of refusals in the dataset is minimal—for example, only 0.03% of respondents refused to answer Item 1. Distinguishing between DK answers and refusals would yield an insufficient number of cases for robust analysis.
IRTree: Disentangling Attitudes From Tendencies
IRTree and Pseudoitems
When presented with the response categories displayed in Table 1, respondents are hypothesized to undergo a series of decision processes before settling on a specific response category. These processes, driven by various latent traits—including respondents’ underlying attitudes and their tendencies toward non-substantive, midpoint, and extreme category—are posited to form a tree structure, as illustrated in Figure 1.
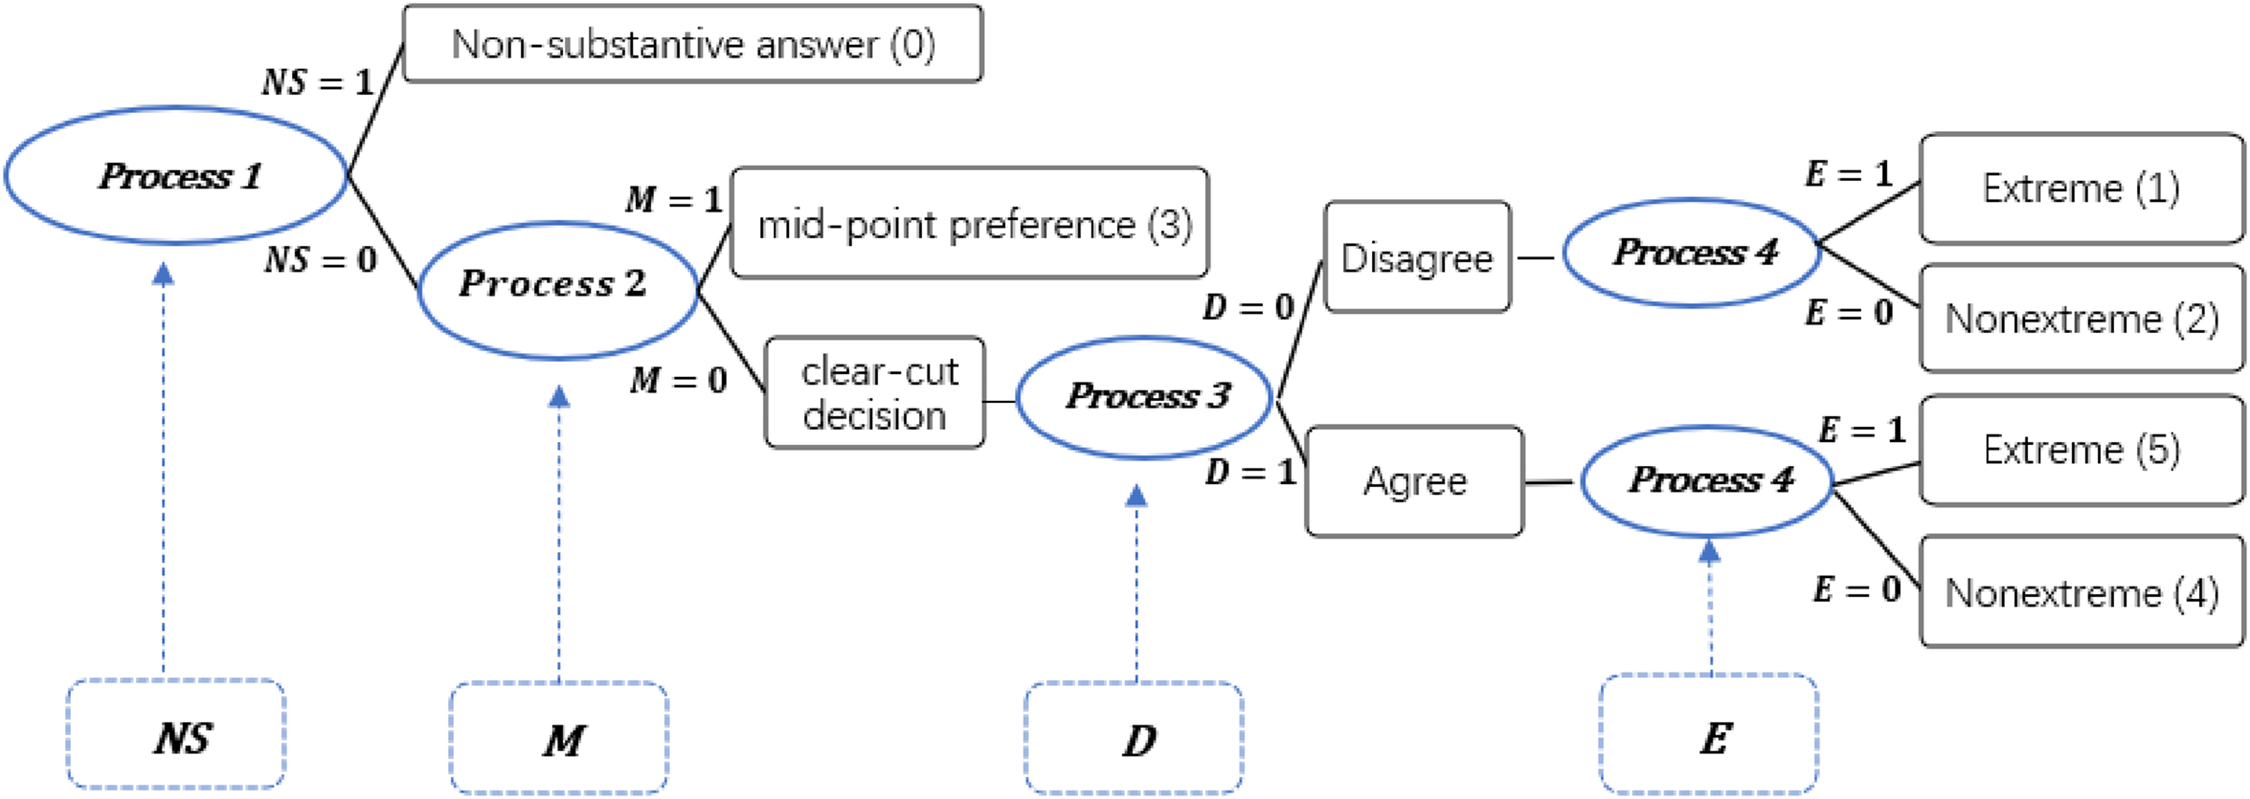
A response tree for a multi-processes model for a five-point Likert scale as well as non-substantive answers. Note: (0)
Process 1 denotes a respondent’s decision-making process regarding whether to provide a non-substantive answer. A pseudoitem, labeled
Process 2 involves the decision of whether to provide a midpoint answer, “Neither disagree nor agree (3),” or a distinct position, such as “Strongly disagree (1),” “Disagree (2),” “Agree (4),” or “Strongly agree (5).” If a respondent selects the midpoint option, the associated pseudoitem
Entering Process 3, the respondent further decides the direction of their attitudes by either (strongly) disagreeing or (strongly) agreeing with the item. Pseudoitem
Process 4 represents the intensity of these attitudes. Respondents who select “Strongly disagree (1) ” or “Strongly agree (5)” result in pseudoitem
Among these four processes, Process 3—representing the stance a respondent takes on the item—primarily reflects the respondent’s underlying attitude toward gender roles. The remaining processes, in contrast, reveal the respondent’s preferences for certain response categories, thereby shedding light on the expression of their attitudes. By converting responses into pseudoitems, it is possible to disentangle the process related to the core attitude (
Mapping Matrix Indicating Connections Between the Original Response Categories and Tree Pseudoitems.
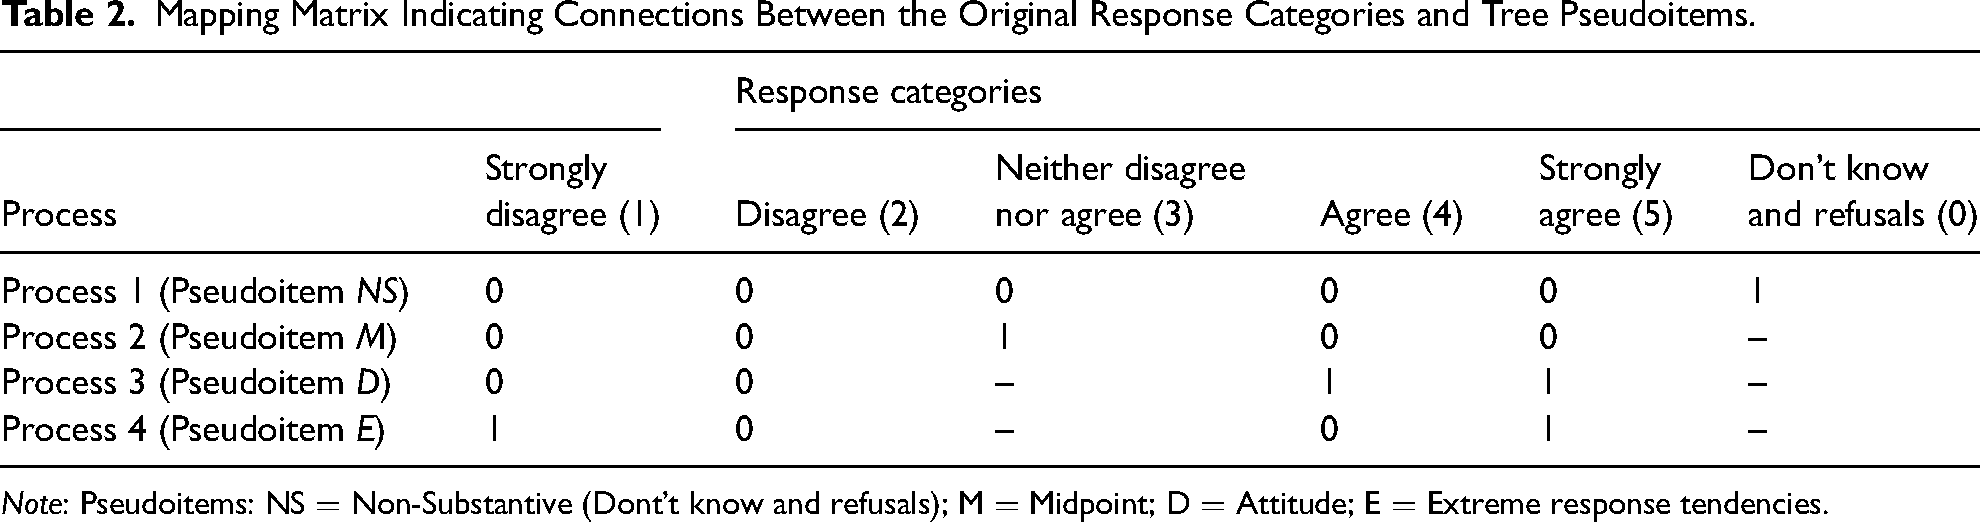
Note: Pseudoitems: NS
Mathematical Formulations
Let the observed response by respondent 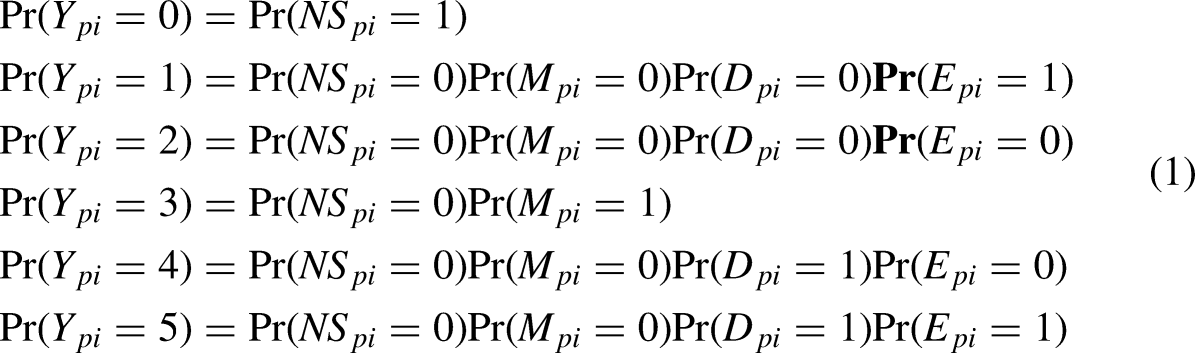
The probabilities of endorsing each pseudoitem are modeled using an item response theory (IRT) two-parameter logistic model: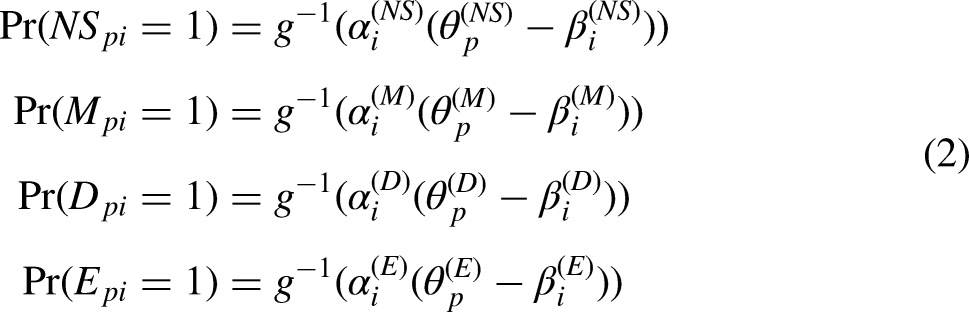
Here,
The parameter
The IRTree approach facilitates the portrayal of the decision-making processes behind observed response outcomes and enables the disentangling of underlying gender attitudes (
In this study, IRTree models were estimated in Mplus using maximum likelihood with robust standard errors (MLR). Estimation employed the expectation-maximization (EM) algorithm with numerical integration, specifying four-dimensional integration to accommodate the four latent traits of interest (
Latent Profile Analysis: Reassembling Attitudes and Tendencies
Building on the IRTree approach, the next step is to explore how these latent traits interact and how they can be used to classify respondents into meaningful subgroups. This leads to the application of Latent Profile Analysis (LPA).
While a closely related method, latent class analysis (LCA), is typically used for discrete variables, LPA is more suitable for continuous variables, as in this study. LPA estimates the probability of each respondent belonging to various unobserved, categorical profiles, allowing group memberships to emerge naturally from the data. Unlike non-latent clustering methods such as discriminant analysis, LPA does not rely on predefined categories. Instead, it adopts a person-centered approach, focusing on identifying respondent subgroups based on their similarities across the four latent traits, rather than exploring relationships among variables as in factor analysis.
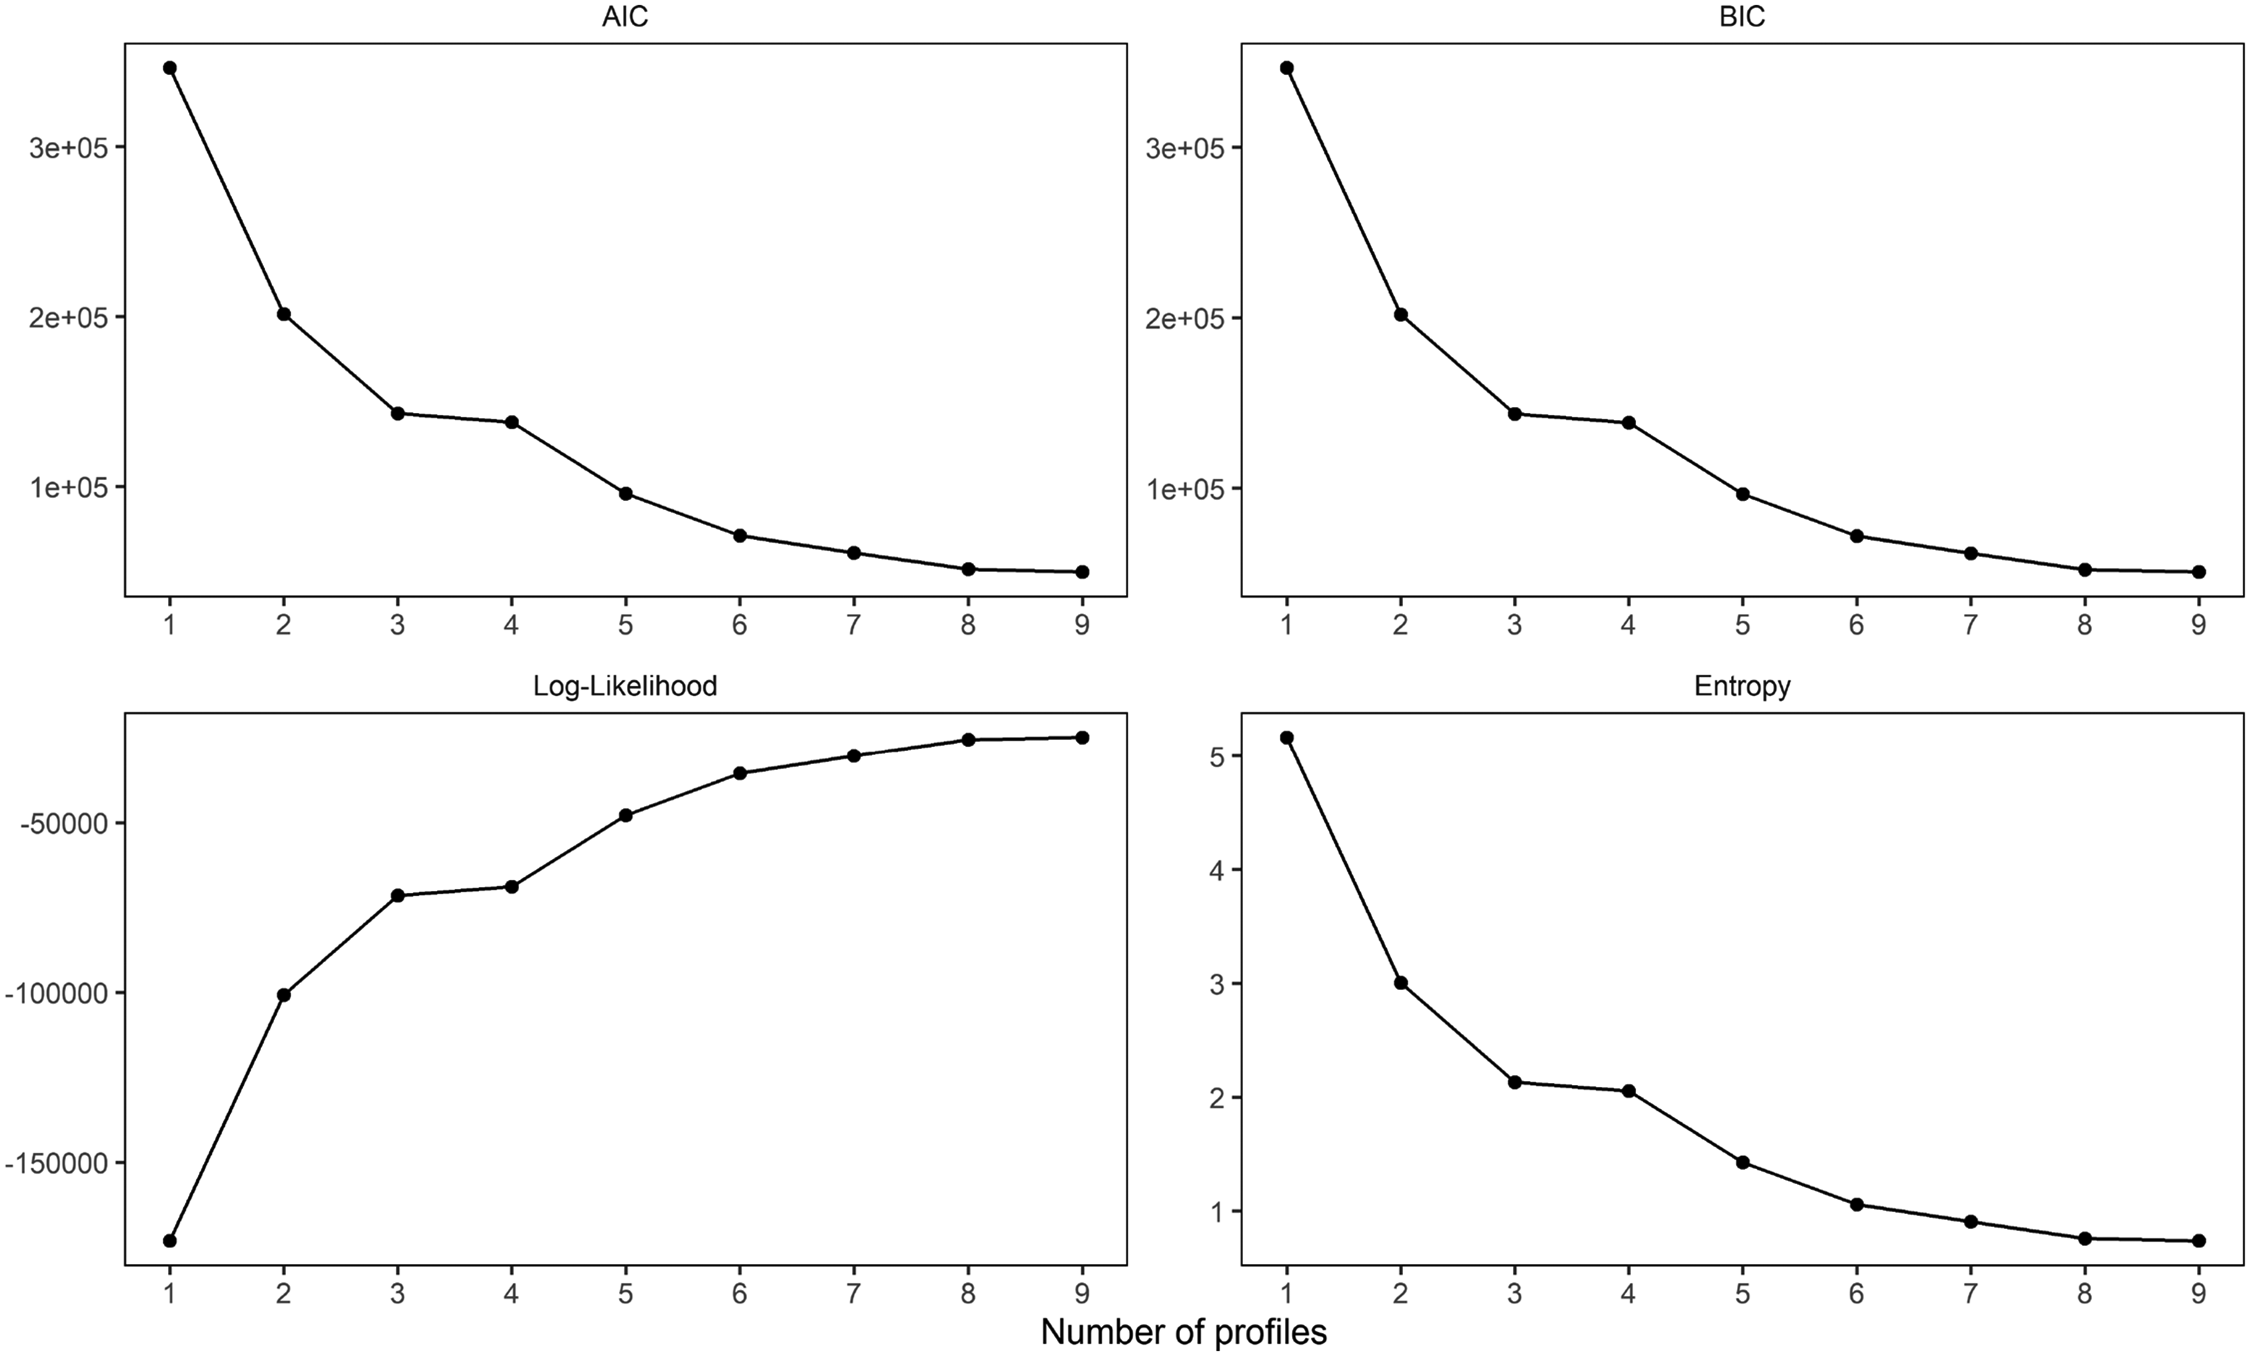
To determine the optimal number of latent profiles, a series of LPA models with varying numbers of profiles are estimated, guided by prior research and methodological recommendations (Bonikowski and DiMaggio 2016; Spurk et al. 2020). These models are evaluated using multiple fit indices, including Akaike information criterion (AIC), Bayesian information criterion (BIC), Log-Likelihood, and entropy. Additionally, content-related factors are considered to ensure that each additional profile provides new and substantive insights. The optimal number of profiles is determined when adding another profile no longer significantly improves model fit or interpretive depth.
The LPA was implemented in Python using Gaussian mixture models (GMMs) via the
Multinomial Logistic Regression Model: Latent Profile Membership by Respondent Characteristics
After identifying distinct subgroups through LPA, the next logical step is to explore how demographic factors influence the likelihood of respondents belonging to specific latent subgroups.
I employ multinomial logistic regression, a method well-suited for examining the relationship between a categorical dependent variable—latent profile membership in this study—and various independent variables, such as respondent characteristics. This model extends the binary logistic regression to accommodate multiple outcome categories, making it ideal for analyzing how predictor variables influence the probability of each outcome.
The multinomial logistic regression model is mathematically represented as follows:
The independent variables for respondent
Results
In this section, I present the findings of this study, organized according to the three research objectives.
Disentangling Attitudes From Tendencies
The 33,517 data entries were first recoded according to Table 2, after which an IRTree model was established as described in Section “IRTree: Disentangling Attitudes from Tendencies”. The estimated parameters from this model include both person parameters—
Descriptive Statistics and Correlations of Latent Traits.
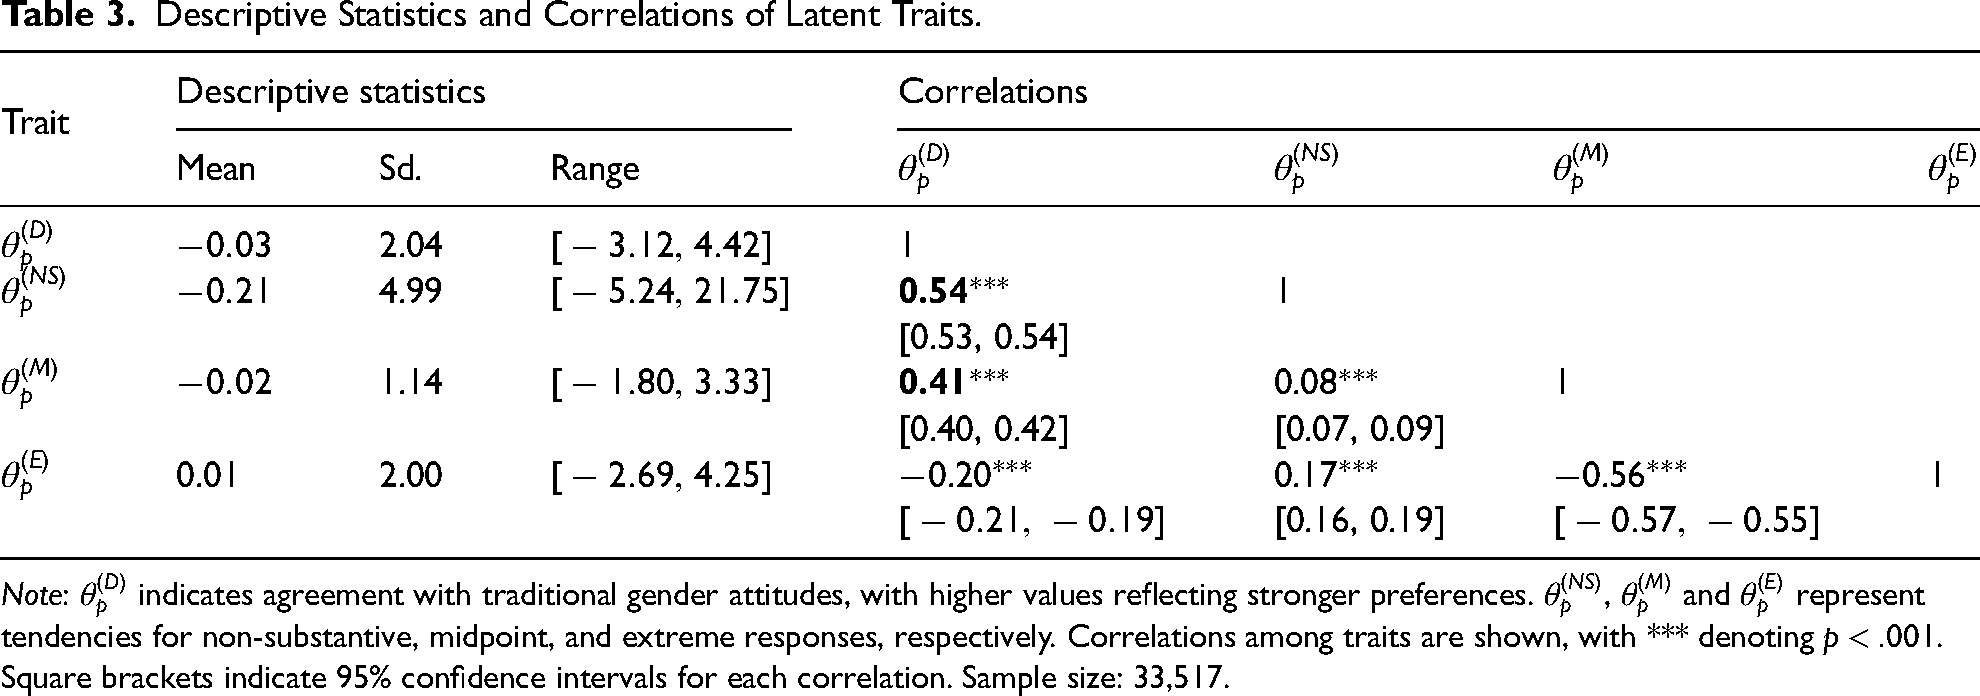
Note:
The analysis revealed a positive and statistically significant correlation between
Similarly, the positive correlation between
In contrast, a negative correlation between
A sensitivity analysis was further conducted to evaluate the robustness of the results. As shown in Tables C1 and C2 in the online supplement, Item 5 displayed atypical parameter behavior, particularly low discrimination on pseudoitem D and high difficulty estimates on pseudoitem NS, raising the possibility of estimation instability. To assess whether these associations were influenced by its inclusion, I re-estimated the IRTree model excluding Item 5. The resulting trait correlations, reported in Appendix Table C3 in the online supplement, remained largely consistent. For example, the correlation between
Taken together, these findings underscore the complex interplay between respondents’ gender attitudes and their response tendencies, revealing a contrast between traditional and egalitarian perspectives in the expression of gender attitudes.
Reassembling Attitudes and Tendencies
Building on the four latent traits estimated in the previous section (
Model selection criteria (AIC, BIC, Log-Likelihood, and Entropy) for determining the optimal number of profiles in latent profile analysis.
Based on the selection criteria, I evaluated profile solutions ranging from 3 to 5 as potential representations of the dataset’s structure. The AIC and BIC values showed significant decreases with the addition of profiles from 1 to 3, with the rate of improvement leveling off beyond the 5-profile solution. Similarly, the log-likelihood values indicated increased model fit up to 5 profiles, after which gains became marginal. Additionally, the entropy metric suggested that profile solutions between 3 and 5 achieved a balance between certainty in profile assignment and model parsimony.
Upon examining the profiles themselves, the 5-profile model presented distinct and substantively interpretable classes. These profiles provided detailed insights into the diversity of gender attitudes and expressions among the respondents, showcasing a level of heterogeneity not captured by the 3-profile model. Consequently, based on both the statistical indicators and profile interpretability, the 5-profile model was identified the optimal choice for elucidating the latent structure within the data.
Figure 3 and Table 4 together illustrate the distinct characteristics of the five identified profiles. Figure 3 presents the distribution of latent gender attitudes (
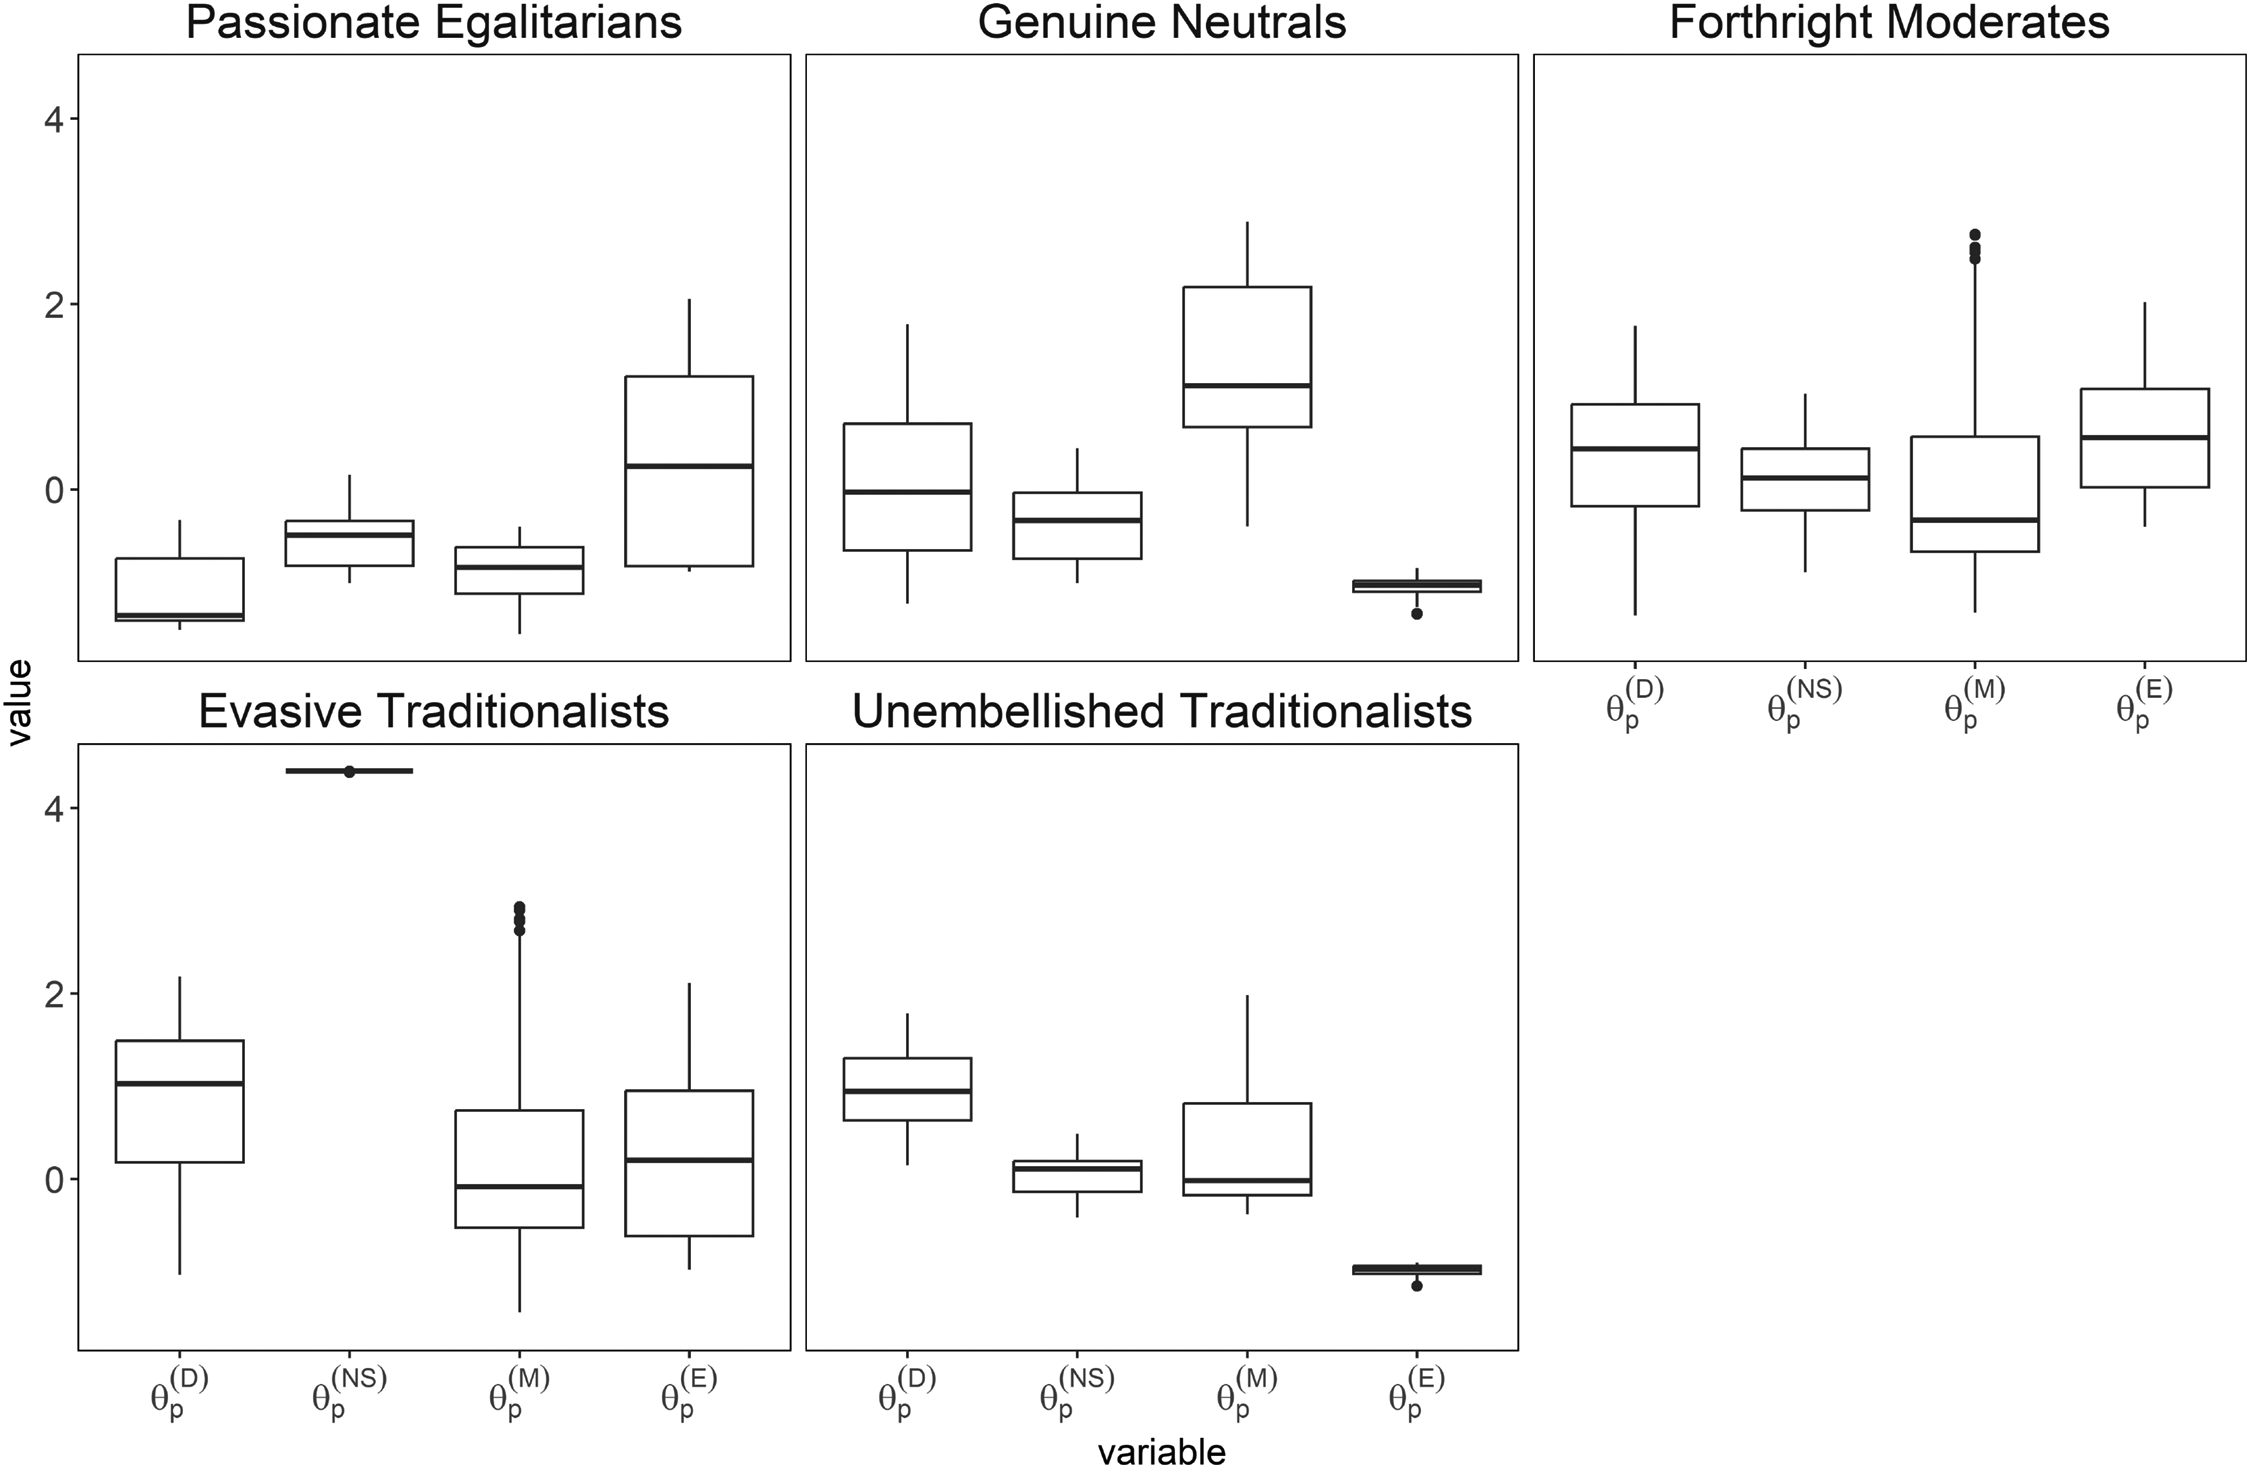
Variability in gender attitudes (
Item Response Probabilities by Profile.
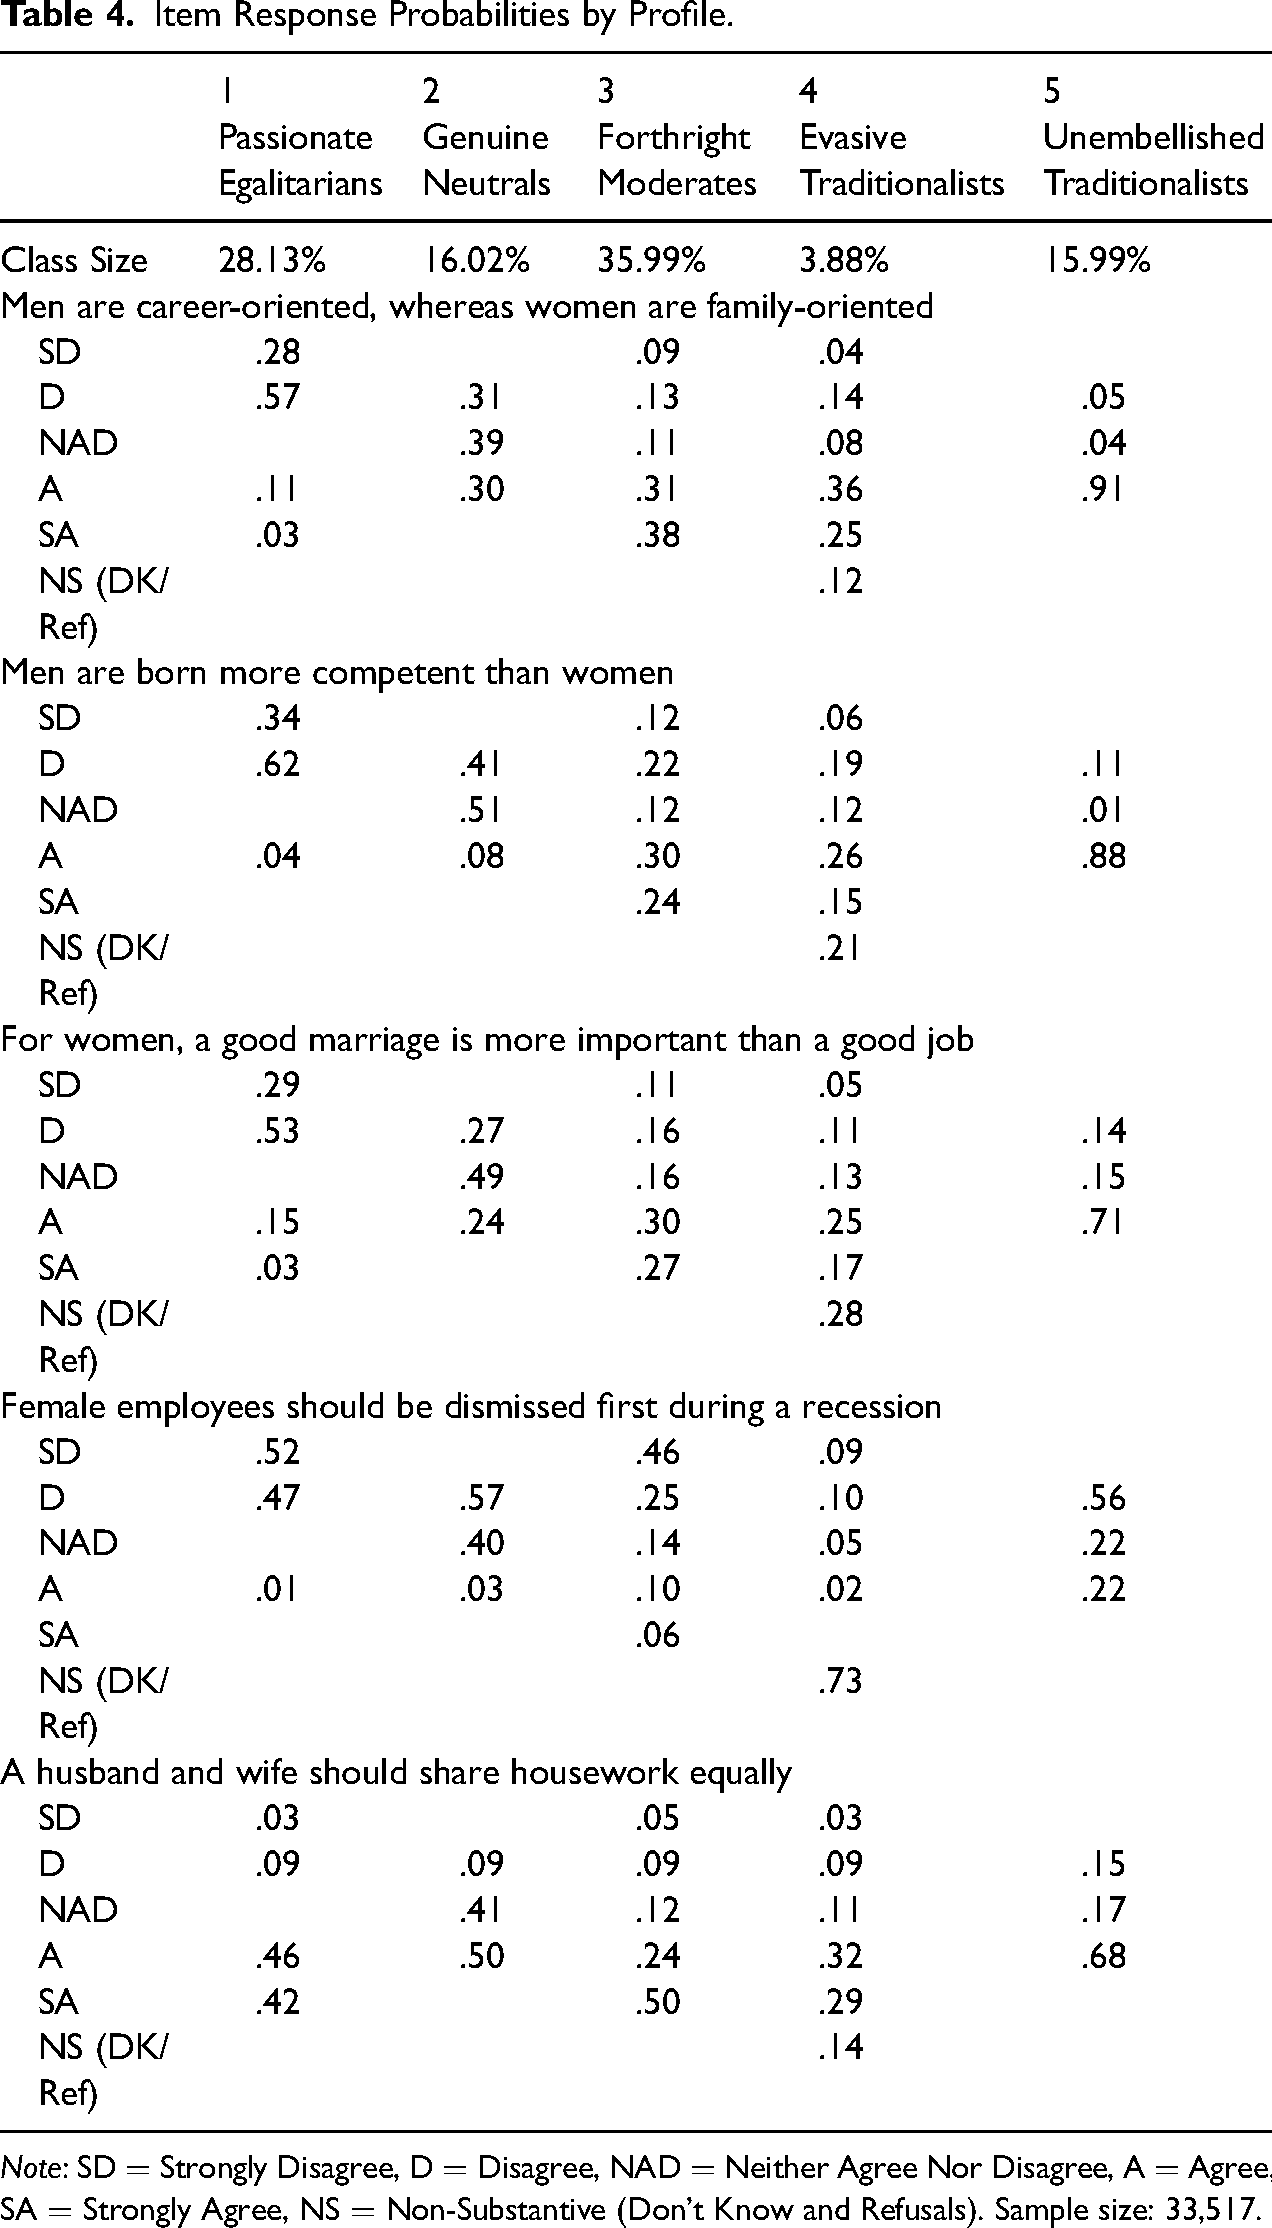
Note: SD
The first profile, “
The “
Accounting for 35.99% of the sample, the “
Among the profiles, the “
This group holds traditional gender attitudes (median
Accompanying their traditional views is a notable use of non-substantive responses, ranging from 12% to 73% across the five items. Item 4 (“Female employees should be dismissed first during a recession”) elicits the highest proportion of non-substantive responses (73%), reflecting the contentious nature of this topic. Respondents may hesitate to openly endorse policies that disproportionately place women at risk of job loss during economic downturns—an issue with considerable societal and ethical implications. This tendency aligns with Table C2 in the online supplement, where Item 4 has a small difficulty parameter, suggesting it easily provokes non-substantive responses. In contrast, items on less contentious traditional views, such as gender roles within the family, elicit much lower non-substantive response rates (e.g., 12%), as these topics carry fewer immediate societal or ethical consequences.
The “
In summary, extreme categories are predominantly preferred by egalitarians, such as
Beyond the profile descriptions, a practical issue is that the LPA uses estimated IRTree trait scores rather than error-free measures. To gauge any impact, a Monte Carlo sensitivity analysis was conducted: each respondent’s four latent scores were perturbed in proportion to their posterior standard errors and the perturbed data were reclassified with the previously fitted five-profile mixture (parameters held fixed). Assignments are highly stable under small–moderate perturbations; when changes arise under stronger perturbations, they mainly involve Passionate Egalitarians and Unembellished Traditionalists moving toward Forthright Moderates/Genuine Neutrals. Full results appear in Appendix E in the online supplement.
I also considered an alternative specification that does not rely on IRTree traits but classifies respondents directly on the five original items after excluding non-substantive answers (DK/refusals). This exclusion-based LPA produced a broadly comparable five-class solution, separating two egalitarian and three traditional groups. The distinctions among these classes were driven by different substantive dimensions of gender attitudes, such as family roles, competence, and housework. However, expressive behaviors were absent from this classification. Moreover, the exclusion-based model allocated a larger share of respondents to the egalitarian side (47.5%), compared with the IRTree-based profiles where the corresponding categories, Passionate Egalitarians (28.1%) and Genuine Neutrals (16.0%), jointly accounted for 44.1%. Full results are presented in Appendix F in the online supplement.
Latent Profile Membership by Respondent Characteristics
Next, I examined the demographic composition of each group to understand their characteristics. As a first step, before analyzing profile membership, it is useful to ask whether response tendencies—before combining with latent attitudes—are systematically associated with demographic characteristics.
Regression results (see Table D1 in Appendix D in the online supplement) show that older age and lower levels of education are associated with stronger tendencies toward non-substantive and midpoint responses, while extreme response tendencies are more common among women and those with higher education. These patterns provide a useful backdrop for interpreting the latent profiles and contribute to existing research on the sociodemographic correlates of response styles.
Building on this, I then analyzed profile membership itself. The multinomial logistic regression results, predicting profile membership using Forthright Moderates as the baseline, are provided in Table 5. To enhance comprehension of these findings, I also analyzed the average marginal effects of key respondent characteristics, including gender, education, and urban versus rural residency. For brevity, detailed visualizations of these effects are presented in Appendix G in the online supplement (Figures G1, G2, and G3).
Results of Multinomial Logistic Regression Model Predicting Profile Membership.
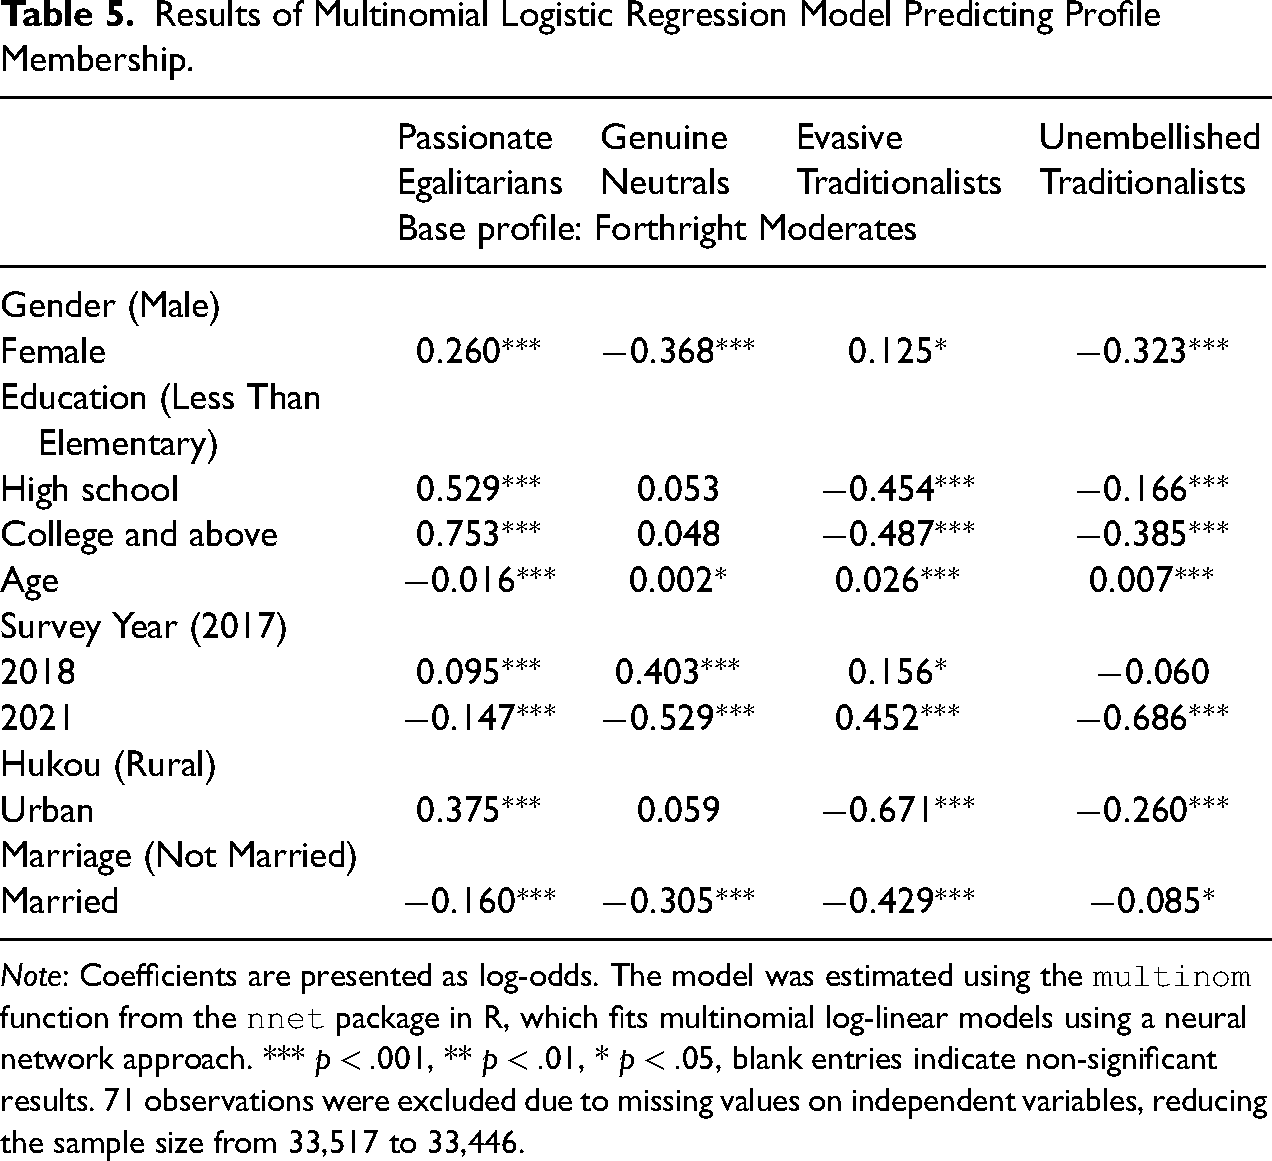
Note: Coefficients are presented as log-odds. The model was estimated using the
Significant demographic differences emerge across profiles, particularly at the extremes of the gender attitude spectrum: Passionate Egalitarians and Unembellished Traditionalists, alongside Evasive Traditionalists. Passionate Egalitarians are more likely to be female, younger, not married, highly educated, and residing in urban areas, epitomizing the progressive end of the gender attitude spectrum.
On the traditionalist end, Unembellished Traditionalists and Evasive Traditionalists present distinct profiles. Unembellished Traditionalists tend to be male, less educated, live in rural settings, and be older. These traits suggest a demographic with conservative gender views, expressed straightforwardly and likely influenced by traditional norms more prevalent in rural areas and among older populations.
Evasive Traditionalists share similarities with Unembellished Traditionalists in terms of older age, lower education, and rural residency, but are predominantly female. This difference highlights a blend of adherence to tradition and the societal challenges women face in openly expressing such views.
Bridging these polarized positions are Genuine Neutrals, who stand in the middle of the gender attitude spectrum. Genuine Neutrals are more likely to be male and unmarried. In terms of education, and urban versus rural residence, they do not differ significantly from Forthright Moderates. Thus, Genuine Neutrals are distributed across a wide range of educational backgrounds, and both urban and rural settings, reflecting a diverse and inclusive nature.
The interplay of factors, including gender, education, and hukou status, on group affiliations was also examined. Consistent with previous findings, to save space, I focus here on the intersection of gender and education, two key factors widely recognized for influencing gender attitudes in prior studies. The results shown in Figure 4 indicate that, for both genders, higher educational levels correlate with a greater likelihood of membership in Passionate Egalitarians group, accompanied by a decline in membership in other groups. This trend is particularly pronounced among women compared to men. Notably, women with only a high school education predominantly fall into the Passionate Egalitarians subgroup. In contrast, men exhibit a similar pattern of predominance only at the level of college education or higher. This underscores the more significant impact of education in fostering progressive gender views among women.
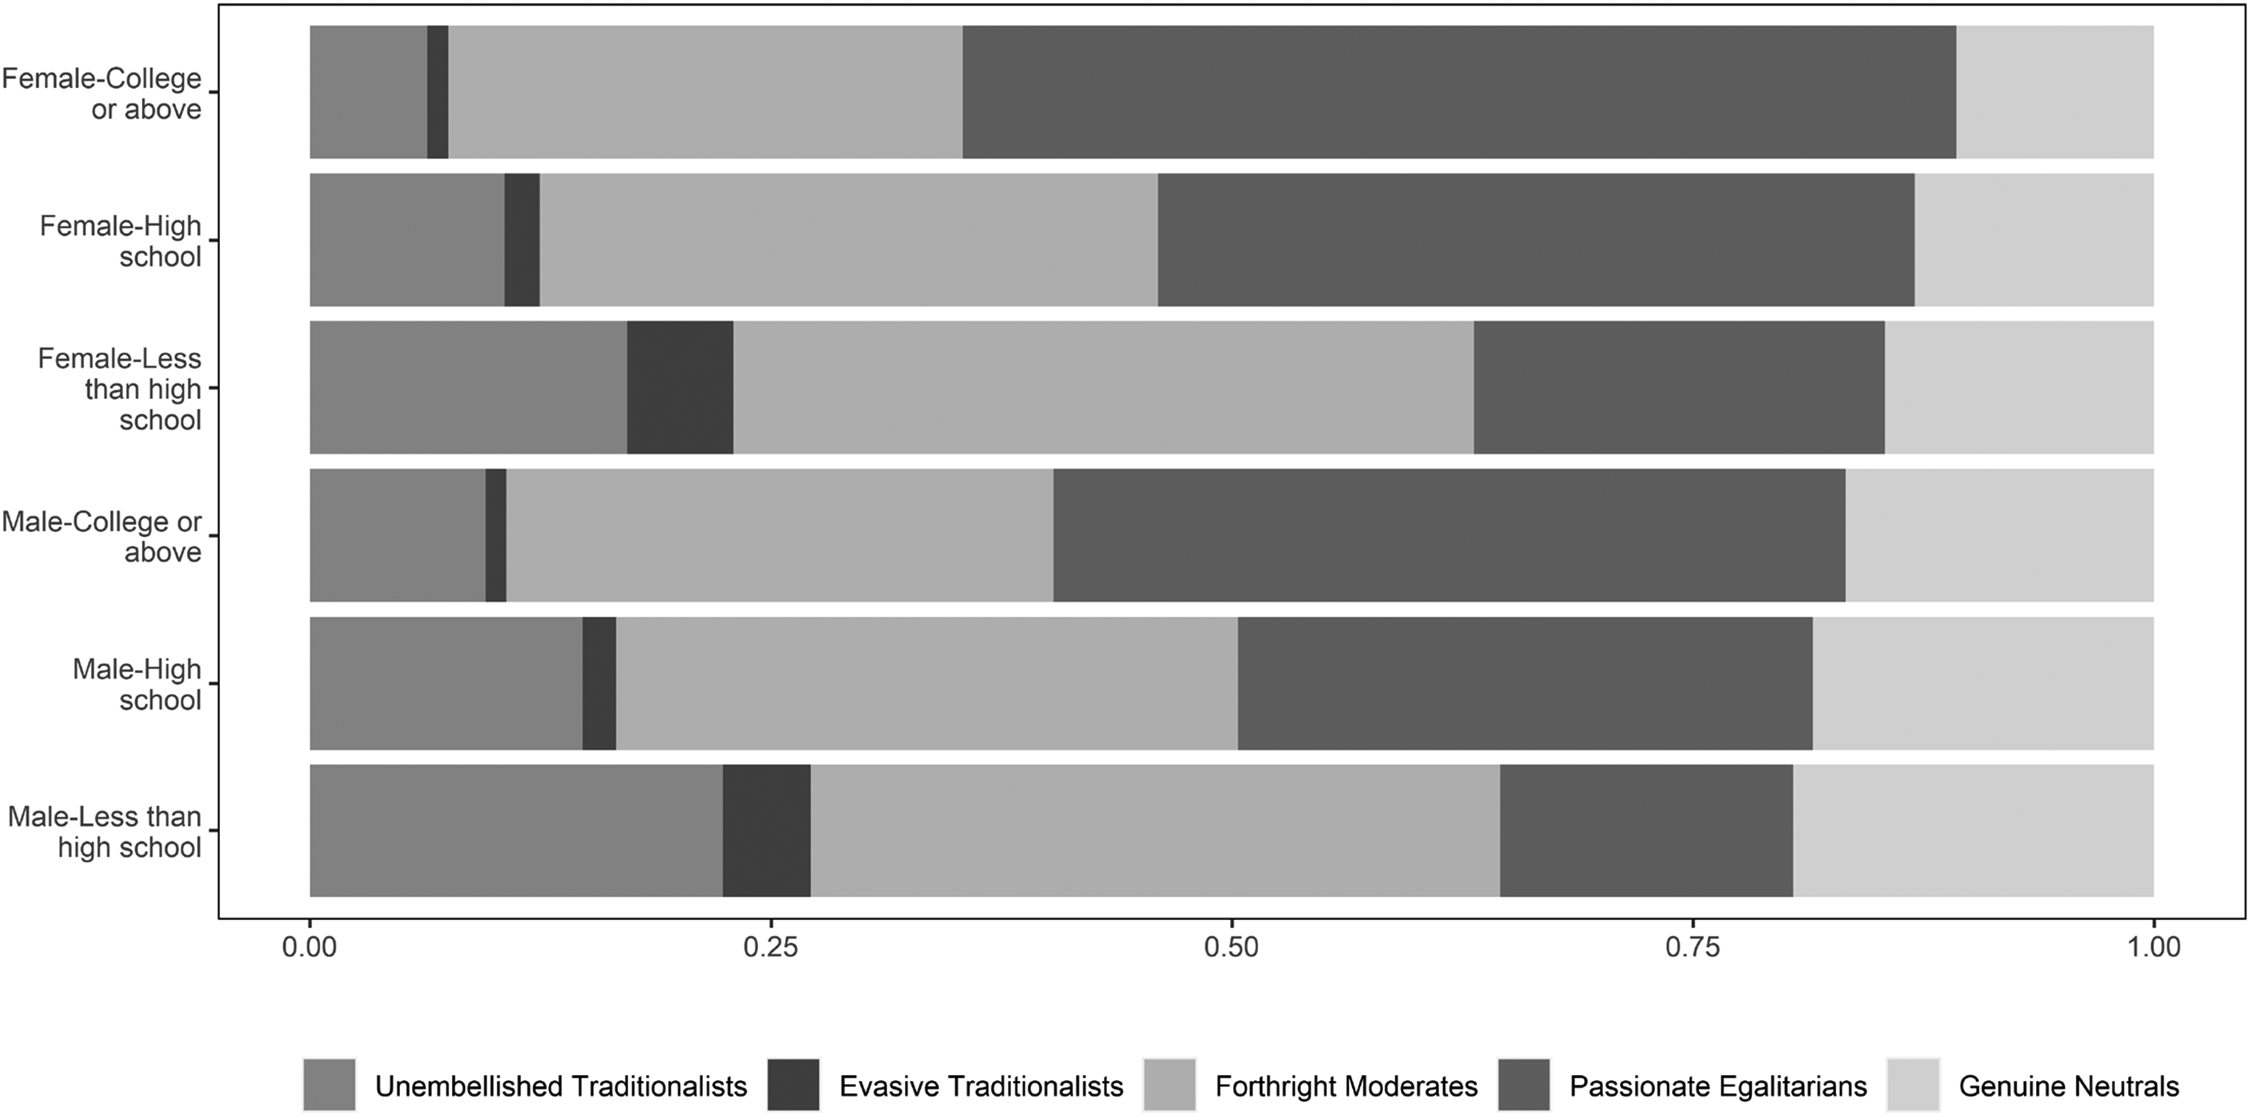
Latent profile membership by respondent gender and level of education.
Although they constitute a relative small proportion across all demographics, Evasive Traditionalists are most prevalent among women with less than a high school education. This reaffirms the earlier findings that, women with lower educational levels may express traditional gender views in a more subtle or indirect manner, as reflected by the term evasive.
Discussions
Survey responses often carry more than just straightforward answers; they reveal the complex interplay between respondents’ thoughts and how they choose to express them. When a respondent selects “don’t know,” do they genuinely lack an opinion, as survey-based studies often assume? And when choosing the midpoint, “neither disagree nor agree”, are they truly neutral? This research challenges these unexamined yet prevalent assumptions and is guided by three key objectives: (1) to disentangle underlying attitudes from response tendencies, (2) to identify the primary configurations of these attitudes and tendencies, and (3) to analyze the demographic variables associated with each profile.
Using the IRTree model, I establish a framework to disentangle underlying attitudes from response tendencies. This approach responds to the calls from scholars like Sturgis et al. (2014) and Cornesse and Blom (2023) to investigate the psychological mechanisms driving survey responses, not just the final answers. The innovative use of the IRTree model in gender attitudes research deepens survey methodology by clarifying why certain responses are chosen and advances gender attitudes research by revealing the complexity of how these attitudes are held and expressed.
In the field of survey methodology, this study builds on previous research, which has largely relied on experimental designs and follow-up questions, to understand the selection of specific response categories in rating scales (e.g., Alwin 2007; Malhotra et al. 2009; Shoemaker et al. 2002; Sturgis et al. 2014). Significant positive correlations were found between non-substantive and midpoint answers with traditional gender attitudes. This suggests that such responses may not simply reflect satisficing or uncertainty, as often proposed in prior research (e.g., Cornesse and Blom 2023; Krosnick 1991; Turner et al. 2015). Instead, these response tendencies appear to serve as deliberate strategies to avoid expressing potentially controversial opinions, particularly among respondents with more traditional views. This aligns with the work of Purdam et al. (2020), highlighting social desirability bias as a factor shaping response behavior (Fisher 1993).
In the context of gender attitudes, this study challenges the conventional treatment of Likert scale data. The results indicate that non-substantive responses, often excluded from analysis as missing values, are significantly more prevalent among respondents with traditional perspectives rather than egalitarian ones. This supports the assertion by Mignogna et al. (2023) that the independence assumption—where nonresponse is assumed to be independent of the outcomes—is often unjustified. Echoing this, Cotter et al. (2011) treated DK answers as indicative of traditional attitudes, highlighting the potential bias introduced by treating such responses as missing.
Midpoint responses present a more complex picture. The analysis shows that as respondents’ traditional views strengthen, they are increasingly likely to choose midpoint responses. This finding suggests that treating all midpoint responses as neutral could lead to an underestimation of traditional perspectives. Should we then treat all midpoint responses as indicative of traditional views, as studies by Du et al. (2021) and Chen and Ge (2018) have done? My subsequent analysis indicates that such an interpretation is also insufficient, as it oversimplifies the complexities involved.
Using LPA, this study further explores the major combinations of attitudes and expressions that emerged from the data. A group termed “Genuine Neutrals” was identified, who genuinely use midpoint responses to express neutrality. This finding highlights the dual nature of midpoint responses: they can serve both as a genuine expression of neutrality and as a “mask” for traditional views. Therefore, in practical application, treating all midpoint responses uniformly—whether as neutral or indicative of traditional perspectives—risks oversimplifying the ways respondents express their attitudes.
Having highlighted the complexities in interpreting Likert scale responses, the focus now shifts to the substantive insights gained by reassembling attitudes and response tendencies. Beyond the Genuine Neutrals, four additional profiles were identified, together reflecting a rich multidimensionality in both content and expression.
Among these, Passionate Egalitarians, primarily comprising younger, urban, highly educated women, stand out for their unequivocal rejection of traditional and essentialist views, coupled with strong advocacy for equality in both public and private domains. Their preference for extreme responses underscores ideological clarity and commitment to egalitarian principles.
Genuine Neutrals, in contrast, maintain neutrality on essentialist items—such as those asserting innate gender differences—while leaning toward egalitarian perspectives on equality-focused items like shared housework. Their preference for midpoint responses on essentialist items, coupled with an even distribution of agreement and disagreement, highlights a genuinely balanced stance. Without normative expectations that women must prioritize family or work, this profile implicitly respects women’s right to choose between these roles. This stance resembles the “flexible egalitarians” described by Brinton and Lee (2016) and the “egalitarian essentialists” identified by Grunow et al. (2018).
At the traditional end of the spectrum, two distinct groups—Unembellished Traditionalists and Evasive Traditionalists—further illustrate the multidimensionality of gender attitudes. Both groups predominantly consist of lower-educated, rural and older individuals with traditional views, consistent with previous findings (Brooks and Bolzendahl 2004; Cunningham 2005). However, neither group is entirely traditional; both express support for shared housework alongside endorsing essentialist items, introducing a subtle egalitarian element. Their expression methods differ significantly: The Unembellished Traditionalists, predominantly male, articulate their traditional views directly, without consistent reliance on specific response tendencies. In contrast, Evasive Traditionalists, a predominantly female group, frequently select non-substantive responses, likely influenced by social pressures or internal conflicts, particularly on sensitive issues such as women’s job security during economic downturns.
While this study primarily focused on the interplay between attitudes and response tendencies, additional analysis (Appendix D in the online supplement) shows that these tendencies themselves are shaped by sociodemographic characteristics. This association has received substantial attention in prior research on response behavior, particularly in studies of item nonresponse (e.g., De Leeuw and Hox 2001; Krosnick 1991; Silber et al. 2021). For instance, older and less educated respondents are more likely to provide non-substantive and midpoint responses, whereas extreme responses are more common among highly educated individuals and women, a pattern mirroring findings from previous survey research. These demographic patterns help contextualize why certain groups, such as the Evasive Traditionalists and Passionate Egalitarians, tend to rely on specific modes of expression. This reinforces the interpretation that response tendencies are socially structured rather than random or purely stylistic.
Taken together, the identified profiles capture not only the coexistence of conflicting attitudes across domains but also the dynamic strategies respondents employ to express these attitudes. The findings align with prior research that underscores the static multidimensionality of gender attitudes, where views on family, work, and public-private roles may conflict (Begall et al. 2023; Knight and Brinton 2017; Scarborough et al. 2019). At the same time, they advance the field by introducing a dynamic dimension: the modes of expression, including reliance on extreme, midpoint, or non-substantive responses. By allowing response tendencies the “freedom” to reveal their alignment with underlying attitudes, hidden patterns emerge—for example, Evasive Traditionalists, profiles that would otherwise remain concealed under conventional methods. This dual lens enriches our understanding of how gender attitudes are both held and conveyed, shedding light on the social and psychological underpinnings of survey responses in this domain.
A comparison with an exclusion-based LPA, conducted directly on the five original items after omitting non-substantive responses, further illustrates this point (Appendix F in the online supplement). That model produced broadly similar attitudinal contrasts, with two egalitarian and three traditional groups, but it failed to identify behavior-defined profiles such as the Evasive Traditionalists or Genuine Neutrals. It also allocated a larger share of respondents to the egalitarian side, reflecting a more optimistic distribution when expressive behaviors are ignored. This difference arises because conventional models implicitly treat DK as missing and midpoint as neutral, whereas our approach makes no such assumptions and lets their associations with latent attitudes emerge from the data. The finding that both DK and midpoint responses are disproportionately linked to traditional views helps explain why exclusion-based models yield a more egalitarian distribution.
While this study provides valuable insights, several limitations should be noted. First, the data come solely from the CGSS, meaning that some conclusions, particularly regarding the five identified profiles, are specific to the Chinese cultural context and may not directly replicate in other settings, though similar patterns might still emerge. Additionally, the analysis relies on five specific questions, which may not capture the full complexity of gender attitudes. As four of the five items are keyed in the same direction, the influence of acquiescence response style cannot be entirely ruled out. While robustness checks suggest that such tendencies are present but not pervasive and largely content-driven, this remains a measurement-related concern. Future research could employ more balanced item designs to better disentangle response styles from substantive attitudes.
A further modeling consideration involves non-substantive responses. The wide range of estimates observed for the non-substantive trait reflects a structural challenge in estimating traits linked to rare response behaviors such as “don’t know” or refusals. Prior research on IRTree models De Boeck and Partchev (e.g., 2012) has shown that low-frequency response categories can yield inflated variance and potential instability, particularly along sparse data paths. While this introduces interpretive complexity, incorporating non-substantive responses remains analytically valuable because it enables the identification of disengagement or ambivalence patterns that would otherwise go undetected, despite the trade-offs in estimation precision. Future research may explore estimation techniques better suited to such rare response categories.
Moreover, the face-to-face nature of the CGSS may further influence response patterns. Respondents with conservative gender attitudes may feel pressure and withhold direct endorsements of traditional perspectives when surveyed in person, particularly on sensitive issues, as evidenced by the Evasive Traditionalists in this study. While clear patterns in response tendencies are identified, the extent to which these findings generalize to other survey modes, such as online or phone-based surveys, remains an open question. Future research could build on these findings by comparing response patterns across different survey modes to assess the stability and generalizability of the identified profiles under varying levels of respondent privacy.
Despite these data- and measurement-related constraints, the methodological framework adopted in this study, namely the combination of IRTree modeling and latent profile analysis, remains broadly applicable. These techniques could be extended to other surveys and cultural contexts to enrich comparative research on gender attitudes.By challenging conventional assumptions and introducing innovative methodologies, it provides deeper insights into how gender attitudes are held and expressed, laying the groundwork for future studies in various contexts.
Supplemental Material
sj-pdf-1-smr-10.1177_00491241251413678 - Supplemental material for Disentangling and Reassembling: Unveiling Hidden Patterns in Gender Attitudinal Surveys
Supplemental material, sj-pdf-1-smr-10.1177_00491241251413678 for Disentangling and Reassembling: Unveiling Hidden Patterns in Gender Attitudinal Surveys by Jiayun Jin in Sociological Methods & Research
Footnotes
Acknowledgments
The author is grateful to the editor and the three anonymous reviewers for their comments and guidance. She also thanks Yang Zhang for stimulating early conversations about this project and Ruhui Zhao for research assistance. The author is indebted to the students in her Social Statistics and Quantitative Research Methods courses at Renmin University of China; the research question explored in this article was first formulated in classroom discussions in those courses.
Declaration of Conflicting Interests
The author declared no potential conflicts of interest with respect to the research, authorship, and/or publication of this article.
Funding
The author disclosed receipt of the following financial support for the research, authorship, and/or publication of this article: This research was supported by the National Social Science Fund of China (Grant No.23BSH028).
Preregistration Statement
This study was not preregistered.
Data,Code,and Materials Availability
Data from the Chinese General Social Survey (CGSS) are available from the official repository (https://www.cnsda.org/). The derived analytic dataset, along with code and documentation, is available via GitHub and archived on Zenodo (![]() ).
).
Supplemental Material
Supplemental material for this article is available online.