
Abstract
Estimating the size of the undocumented migrant population remains a critical challenge for researchers and policymakers. This study assesses the viability of using social media platforms, specifically Facebook and Instagram, to recruit a survey sample of migrants and elicit their status. The research focuses on Mexican and Venezuelan immigrants in Texas, Florida, Illinois, and California. Three methods for eliciting legal status are tested: direct questions, indirect sequential questions (stepwise exclusion), and a list experiment. The study (N = 2,027) finds that while social media recruitment is cost-effective and rapid, it faces challenges such as selection bias, misclassification, and platform-imposed restrictions. The list experiment suggests the presence of response bias in traditional surveys to sensitive legal status questions. Estimates of the share of undocumented migrants deviate considerably from available reference estimates. We argue that social media surveys are best applied in preparation for traditional surveys rather than in their place.
Introduction
Estimating the size of the undocumented migrant population remains a critical challenge for researchers and policymakers. It is estimated that undocumented immigrants represent 27 percent of the foreign-born population in the United States, roughly 13.7 million people (Van Hook, Soto and Gelatt 2025). Important questions—such as how undocumented status affects immigrant family well-being, the role of undocumented immigrants in the labor market, and their economic and fiscal impacts—remain largely unaddressed due to difficulties in surveying this population.
Estimating the number (i.e., stock) of undocumented immigrants residing in a country is methodologically challenging. In the United States, most existing estimates rely on the residual method which exploits differences between survey-based estimates of the total immigrant population (regardless of legal status) and estimates of the documented immigrant population based on administrative records, to arrive at a residual estimate of the undocumented immigrant population (Warren and Passel 1987; Van Hook and Bean 1998; Van Hook et al. 2021; Rodríguez-Sánchez and Tjaden 2023; Warren, and Zheng 2023). Although the estimates adjust for coverage error among the foreign-born in the survey, the approach nonetheless relies on the willingness of large numbers of undocumented immigrants to participate in the survey and is thus affected by the downward trend in survey response rates.
Participation rates in standard population surveys have been rapidly declining among all groups as use of landline phones and mail has declined, and caller ID has enabled potential respondents to screen out calls (Czajka and Beyler 2016). Immigrant populations are especially underrepresented in census surveys (Van Hook et al. 2014; Kissam 2017; Johnson 2022; Quiros and O’Hare 2024). Undocumented immigration is one of the most salient and sensitive political issues in many large destination countries, such as the United States, so immigrants may be reluctant to participate in surveys due to fear of legal consequences or stigma (Aichberger et al. 2012; Méndez and Font 2013; Vujcich et al. 2022; Duvoisin et al. 2023), and to provide answers without some sort of response bias.
In response to the rise in nonresponse to traditional surveys, survey methodologists have increasingly turned to new modes of data collection that rely on recruitment through digital platforms, particularly social media (Schneider and Harknett 2022; Tjaden 2024). Although there is a lack of data quantifying the share of undocumented immigrants using social media, sources suggest high access rates. Research on immigrant communities is deemed to be “smartphone-dependent,” with large shares of Hispanic individuals regularly using digital devices (Gelles-Watnick 2024). Recent data have even started relying on platforms such as Facebook records for estimates of migration flows (Chi et al. 2025). However, official estimates for social media access for undocumented populations are scarce because of fear of detection and sampling challenges (Jauhiainen and Tedeschi 2021; Salas et al. 2022).
In this study, we assess the viability of an alternative method for estimating the share of undocumented immigrants among the immigrant population in the United States that relies on a social media sample recruitment strategy. We test three different approaches for eliciting legal status from respondents and assess whether they produce estimates that align with existing estimates. We apply the approach to immigrants of Mexican and Venezuelan origin residing in four states with large immigrant populations—Texas, Florida, Illinois, and California—in the year 2024. We assess the viability of social media recruitment of these immigrant groups by assessing the speed and effectiveness of sample recruitment, costs, measurement bias, and implementation obstacles. We also assess the elicitation of legal status via a comparison of direct questions, indirect sequential questions (referred to as stepwise exclusion), and a list experiment. The latter has been proposed as a tool to reduce bias in responses about sensitive topics (Blair and Imai 2012; McKenzie and Siegel 2013).
Throughout this paper, we define the undocumented foreign-born population as those who entered the country without inspection or who arrived with a temporary visa (e.g., student visa, tourist visa) but overstayed or violated its terms. This population also includes a rapidly growing group of individuals with “liminal” legality, namely groups receiving an official, temporary reprieve from deportation but whose classification could be revoked: individuals with Temporary Protected Status (TPS), Deferred Action for Childhood Arrivals (DACA), parole, and those with pending asylum applications (Connor 2024). We classify the liminal group as undocumented because their protections could be revoked by executive order at any time.
Our results highlight difficult trade-offs for researchers. While we find strong evidence that using social media to recruit subjects is cost-effective and speedy, we also identify several downsides: sample selection bias, measurement issues relating to the misclassification of origin groups, implementation risks due to the platform's ability to block recruitment efforts at any stage without appeal, response bias regarding legal status for Mexican immigrants, and large differences (5–15 percentage points) between the estimated share of undocumented migration relative to available reference estimates.
The study aims to contribute to two related but distinct bodies of literature. First, we provide another test of social media sample recruitment for a “hard-to-reach” group (Brickman Bhutta 2012; Rife et al. 2014; Pötzschke and Braun 2017; Iannelli et al. 2020; Kalimeri et al. 2020; Kühne and Zindel 2020; Zhang et al. 2020; Archer-Kuhn et al. 2021; Ryndyk 2021; Pötzschke 2022; Rocheva, Varshaver and Ivanova 2022; Schneider and Harknett 2022; Pötzschke et al. 2023; Zindel 2023; Piekut 2024; Soehl, Chen and Erlich 2024; Tjaden 2024; Varona et al. 2024; Rosenzweig et al. 2025). Second, we contribute to the measurement of legal status among a diverse group of immigrants (Bachmeier, Van Hook and Bean 2014; Van Hook, Bachmeier and Coffman 2015).
The article is structured as follows. We first describe the current evidence on survey recruitment using social media with a focus on “hard-to-sample” and “hard-to-reach” groups such as immigrants without a legal immigrant status and the current evidence on measuring legal status. We formulate expectations regarding our study based on previous evidence. Finally, we present our data and methods before concluding with a presentation of our results and their discussion.
Previous Evidence
Survey Recruitment Through Social Media
As a response to declining response rates for traditional, probability population surveys, survey methodologists began exploring the use of online channels for survey recruitment, such as digital messaging Apps through applications like WhatsApp (Fei et al. 2022; Ndashimye, Hebie and Tjaden 2024). Many have used Meta's social media network Facebook, given its large global penetration and coverage (Brickman Bhutta 2012; Rife et al. 2014; Iannelli et al. 2020; Kalimeri et al. 2020; Kühne and Zindel 2020; Zhang et al. 2020; Archer-Kuhn et al. 2021; Schneider and Harknett 2022; Pötzschke et al. 2023; Zindel 2023; Rosenzweig et al. 2025). A key finding emerging from this literature is that non-probability samples collected via Facebook (and Instagram) can produce, in some instances, valid population estimates when compared to probability samples on the same themes and populations. For example, Rosenzweig and colleagues (2025) and Zhang and colleagues (2020) demonstrate that Facebook can be an effective tool for recruiting survey participants, offering a cost-efficient and scalable alternative to traditional sampling methods in certain contexts, particularly when employing strategies like quota sampling and post-stratification weighting. Therefore, digital surveys deserve further research attention. While many case studies show promise (see also Grow et al. 2022), Zindel's systematic review (2023) concludes that social media recruitment methods still require more validation and methodological refinement.
Survey recruitment using Facebook has also been adopted in the study of migration (Pötzschke and Braun 2017; Ryndyk 2021; Pötzschke 2022; Rocheva, Varshaver and Ivanova 2022; Tjaden, Haarmann and Savaskan 2022; Piekut 2024; Soehl, Chen and Erlich 2024; Tjaden, Seuthe and Weinert 2024; van Tubergen et al. 2024; Varona et al. 2024). Immigrants are a hard-to-sample population because they typically make up too small a share of the general population to be efficiently sampled, and because migrant-specific sampling frames are often unavailable. To address these challenges, researchers have developed various specialized approaches including location-based sampling, onomastic sampling, contacts through migrant organizations or social service providers, and respondent-driven sampling (see Reichel and Morales 2017 for a review). Although these data collection methods can be viable, they typically require substantial resources and involve trade-offs regarding probability sampling and coverage, even under ideal conditions.
Social media platforms such as Facebook offer a cost-effective and easy-to-implement approach to recruiting (potential) immigrants online (Pötzschke 2022; Rodríguez-Sánchez and Tjaden 2023). Facebook permits advertisers to target specific populations of interest, including users who previously resided in another country. Although Facebook does not release information on how their algorithm classifies users as “having previously lived in country X,” most researchers agree that various sources of information are used, including the location where users log-on to the platform, the self-reported information in the user profile, the location of the user's contacts network, and the language settings (e.g., Pötzschke 2022).
Previous residence is an imprecise “catch-all” measure for immigration status. In social science research, immigration is commonly measured via nationality or country of birth and duration of residence, none of which are available through Meta's advertisement platform 1 . However, previous research has shown that, for many countries, the size of the migrant population from the origin country x in the destination country y closely correlates with official data on migrant populations collected through traditional means (Zagheni, Weber and Gummadi 2017).
Many immigrants rely on social media networks to stay in touch with family and friends (Dekker and Engbersen 2014), so social media adoption among immigrants is likely higher than among non-migrants in their country of origin or residence. However, various challenges have been highlighted by previous studies when sampling immigrants through Facebook. Soehl, Chen and Erlich (2024) summarize these challenges as pertaining to issues of coverage, misclassification, and selection bias (see also Pötzschke 2022; Rocheva, Varshaver and Ivanova 2022).
Coverage bias refers to situations when certain (sub-) groups of immigrants may not be covered or identified by Facebook. In some groups, this is simply because Facebook does not exist in their destination and/or country of origin. In others, it is because there are so few users from a country that Facebook does not provide a classification for that country. Misclassification bias, in turn, refers to errors in Facebook's classification of migration status and country of origin. Some studies have shown that survey respondents recruited through Facebook reported a country of birth different from the “origin country” assigned by Facebook (see e.g., Grow et al. 2022; Varona et al. 2024). Finally, challenges related to selection bias refer to the unequal probability of using social media between immigrant and non-immigrant populations, across different origin and destination contexts, age groups, gender, and, in our case, between documented and undocumented immigrants. While immigrants may be more likely than non-immigrants to use Facebook to maintain international ties and facilitate integration (Dekker and Engbersen 2014), concerns remain that immigrants—particularly undocumented ones—avoid social media to reduce detection and deportation risks, especially in the current U.S. political climate. To address these concerns, studies often apply weighting, raking, post-stratification, and other methods to correct for known biases in the data (e.g., Schneider and Harknett 2022).
To the best of our knowledge, no previous studies have attempted to recruit undocumented immigrants via social media platforms and elicit their legal status using a battery of questions as we do in our study. Our approach provides a unique opportunity to obtain sizable samples of undocumented immigrants where more traditional approaches would likely fail or become too costly. At the same time, however, concerns regarding selection bias might represent an even stronger challenge in this application, as we will discuss in detail below. We add to the literature by examining potential misclassification and selection issues pertaining to the population of undocumented immigrants living in the United States.
Elicitation of Legal Status Among Immigrants
In the United States, and in many other large destination countries, large-scale, nationally representative surveys used to study the foreign-born population—such as the American Community Survey (ACS)—generally distinguish between foreign-born, naturalized citizens and non-citizens. However, these surveys do not inquire about the specific legal status of these survey participants (Van Hook, Bachmeier and Coffman 2015). Surveys that have included such measures are limited: they are typically relatively small, regionally targeted, and/or focused on a particular subpopulation of immigrants (Bachmeier, Van Hook and Bean 2014).
Among the surveys that have attempted to elicit information about legal status, several approaches have been applied. Direct measures, which consist of survey items or questions about respondents’ official residence, immigration status, or residence permit, have been used in this literature. Bachmeier and colleagues (2014) find that the quality of information gathered from such direct survey questions is promising, and suggest that the addition of such items to questionnaires is unlikely to compromise survey response rates (Bachmeier, Van Hook and Bean 2014). In a review of the measurement of undocumented status in health research, Young and Madrigal (2017) also recommend that researchers collect self-reported (direct) measures of undocumented status whenever possible and limit the use of proxy measures. Others, instead, have warned about the salience of sensitivity bias given that undocumented immigrants face real risks of detention and even deportation when answering such questions entails disclosing their legal status (McKenzie and Sieger 2013; Acostamadiedo 2025).
Alternatively, researchers have used auxiliary information to infer, in an indirect fashion, the legal status of the respondents. Questions related to visa type, work authorization, length of stay, or even access to social security can serve as imperfect proxies for legal status (e.g., Van Hook, Bachmeier and Coffman 2015). For example, some researchers have tried to impute immigrant legal status by coding noncitizens as legally resident if they have occupations or use public programs that require legal status (Borjas and Cassidy 2019). Although this approach is easy to implement, it has been found to generate further biases, such as making undocumented immigrants appear to have lower poverty rates than legal immigrants when the opposite is likely true (Spence et al. 2020).
To address underreporting due to fear or stigma and avoid pitfalls associated with legal status proxies, questionnaire design techniques like list experiments (often called the item count technique) have been applied to increase confidentiality and reduce social desirability bias (e.g., Blair and Imai 2012). List experiments ask sensitive survey questions in a way that protects the anonymity of the respondents. We are aware of only one study that has used a list experiment to measure undocumented immigration, implemented in Ethiopia, Mexico, Morocco, and the Philippines (McKenzie and Siegel 2013). The study is not directly comparable to ours because it asked household heads about past household members who immigrated irregularly, which is less sensitive than questions about one's own immigration status. The authors find underreporting in direct questions in two of the four countries but lack statistical power. Outside of migration studies, research suggests that list experiments perform better at approximating true population rates of behaviors that respondents may be reluctant to disclose, such as illegal drug use, prostitution, and domestic abuse (Ehler, Wolter and Junkermann 2021; Li and Van den Noortgate 2022).
We build on this body of research by offering a comparison of direct questions, stepwise exclusion, and a list experiment to elicit information about legal status among U.S. immigrants from Mexico and Venezuela.
Data and Methods
Data Collection and Sampling
Due to resource constraints, the survey was restricted to four U.S. states (Texas, Florida, Illinois, and California). The survey was implemented in October and November 2024 over a period of 34 days, during the last few months of the Biden administration. The four states were selected because they host the largest number of undocumented immigrants (Migration Policy Institute 2025) and because they represent varying policy stances on undocumented migration. While California and Illinois tend to be more supportive of migration, Florida and Texas are more restrictive (see Urban Institute 2022).
The survey targeted Mexican and Venezuelan immigrant adults aged 18 years and older residing in those four U.S. states, as classified by Meta as having previously lived in those countries. The age limit imposed here was required by Meta advertising policies, though there are users as young as 14 years old. Mexican immigrants represent the largest and longest-settled immigrant group in the United States. Venezuelans in the United States, in turn, represent a more recently arrived and understudied population. At the time of the data collection, many of the undocumented Venezuelans (approximately 70 percent) were eligible for TPS (Immigration Forum 2024). Undocumented Mexicans, on the other hand, do not benefit from TPS, and only about 8 percent were granted DACA (Migration Policy Institute 2025). These two groups, hence, exhibit distinct demographic and settlement patterns, making them compelling case studies to assess the viability of our approach. Because of their legal protections under TPS, undocumented Venezuelans may have felt more secure responding to questions about their immigration status than Mexicans—especially since the survey was conducted before the second Trump administration, prior to threats to their TPS protections.
The study employed quota sampling. The target sample size was 400 responses for each group (Mexican, Venezuelan) and state (TX, FL, IL, CA) for a total target of 3,200 responses. We aimed to continuously recruit study participants until the minimum sample size was reached or until the budget, which was capped at USD 17,500, was exhausted. The campaign managed to spend only USD 15,460 before data collection was halted, as the platform automatically blocked individual ads and eventually suspended the entire campaign. 2
We created a Facebook page from which our campaign was launched and named our survey the “Migrant Community Challenges Survey (MCCS)” (in Spanish: Encuesta sobre los retos de la comunidad inmigrante, ERCI). Advertisements were launched from that Facebook page, further encouraging participation in the survey, and disseminated to Facebook and Instagram platform users (both of which belong to Meta). A link for further information about the survey embedded in the advertisement linked to a project website hosted by one of the participating universities. On this website, we provided information about the project, its objectives, funding, and the involved organizations, and instructions for how to contact the research team via email. Once Facebook/Instagram users clicked on the “learn more” button embedded in the advertisement, they were directly transferred to our survey. The online survey was implemented via Lime Survey. A dedicated Lime server was created at one of the participating universities to ensure compliance with the EU's General Data Protection Regulation (GDPR).
The advertisement campaign was set to optimize link clicks, which means that Facebook/Instagram shows the ad to people who are more likely to click on the “learn more” button. The specific ads that Facebook/Instagram users saw are displayed in Figure 1, showing a Mexican and U.S. flag for the Mexican group, and a Venezuelan and US flag for the group of Venezuelans. The recruitment messages read: “What are the main challenges facing your community? Take part in our 5-minute survey and have a chance to win a USD 50 Amazon voucher.”
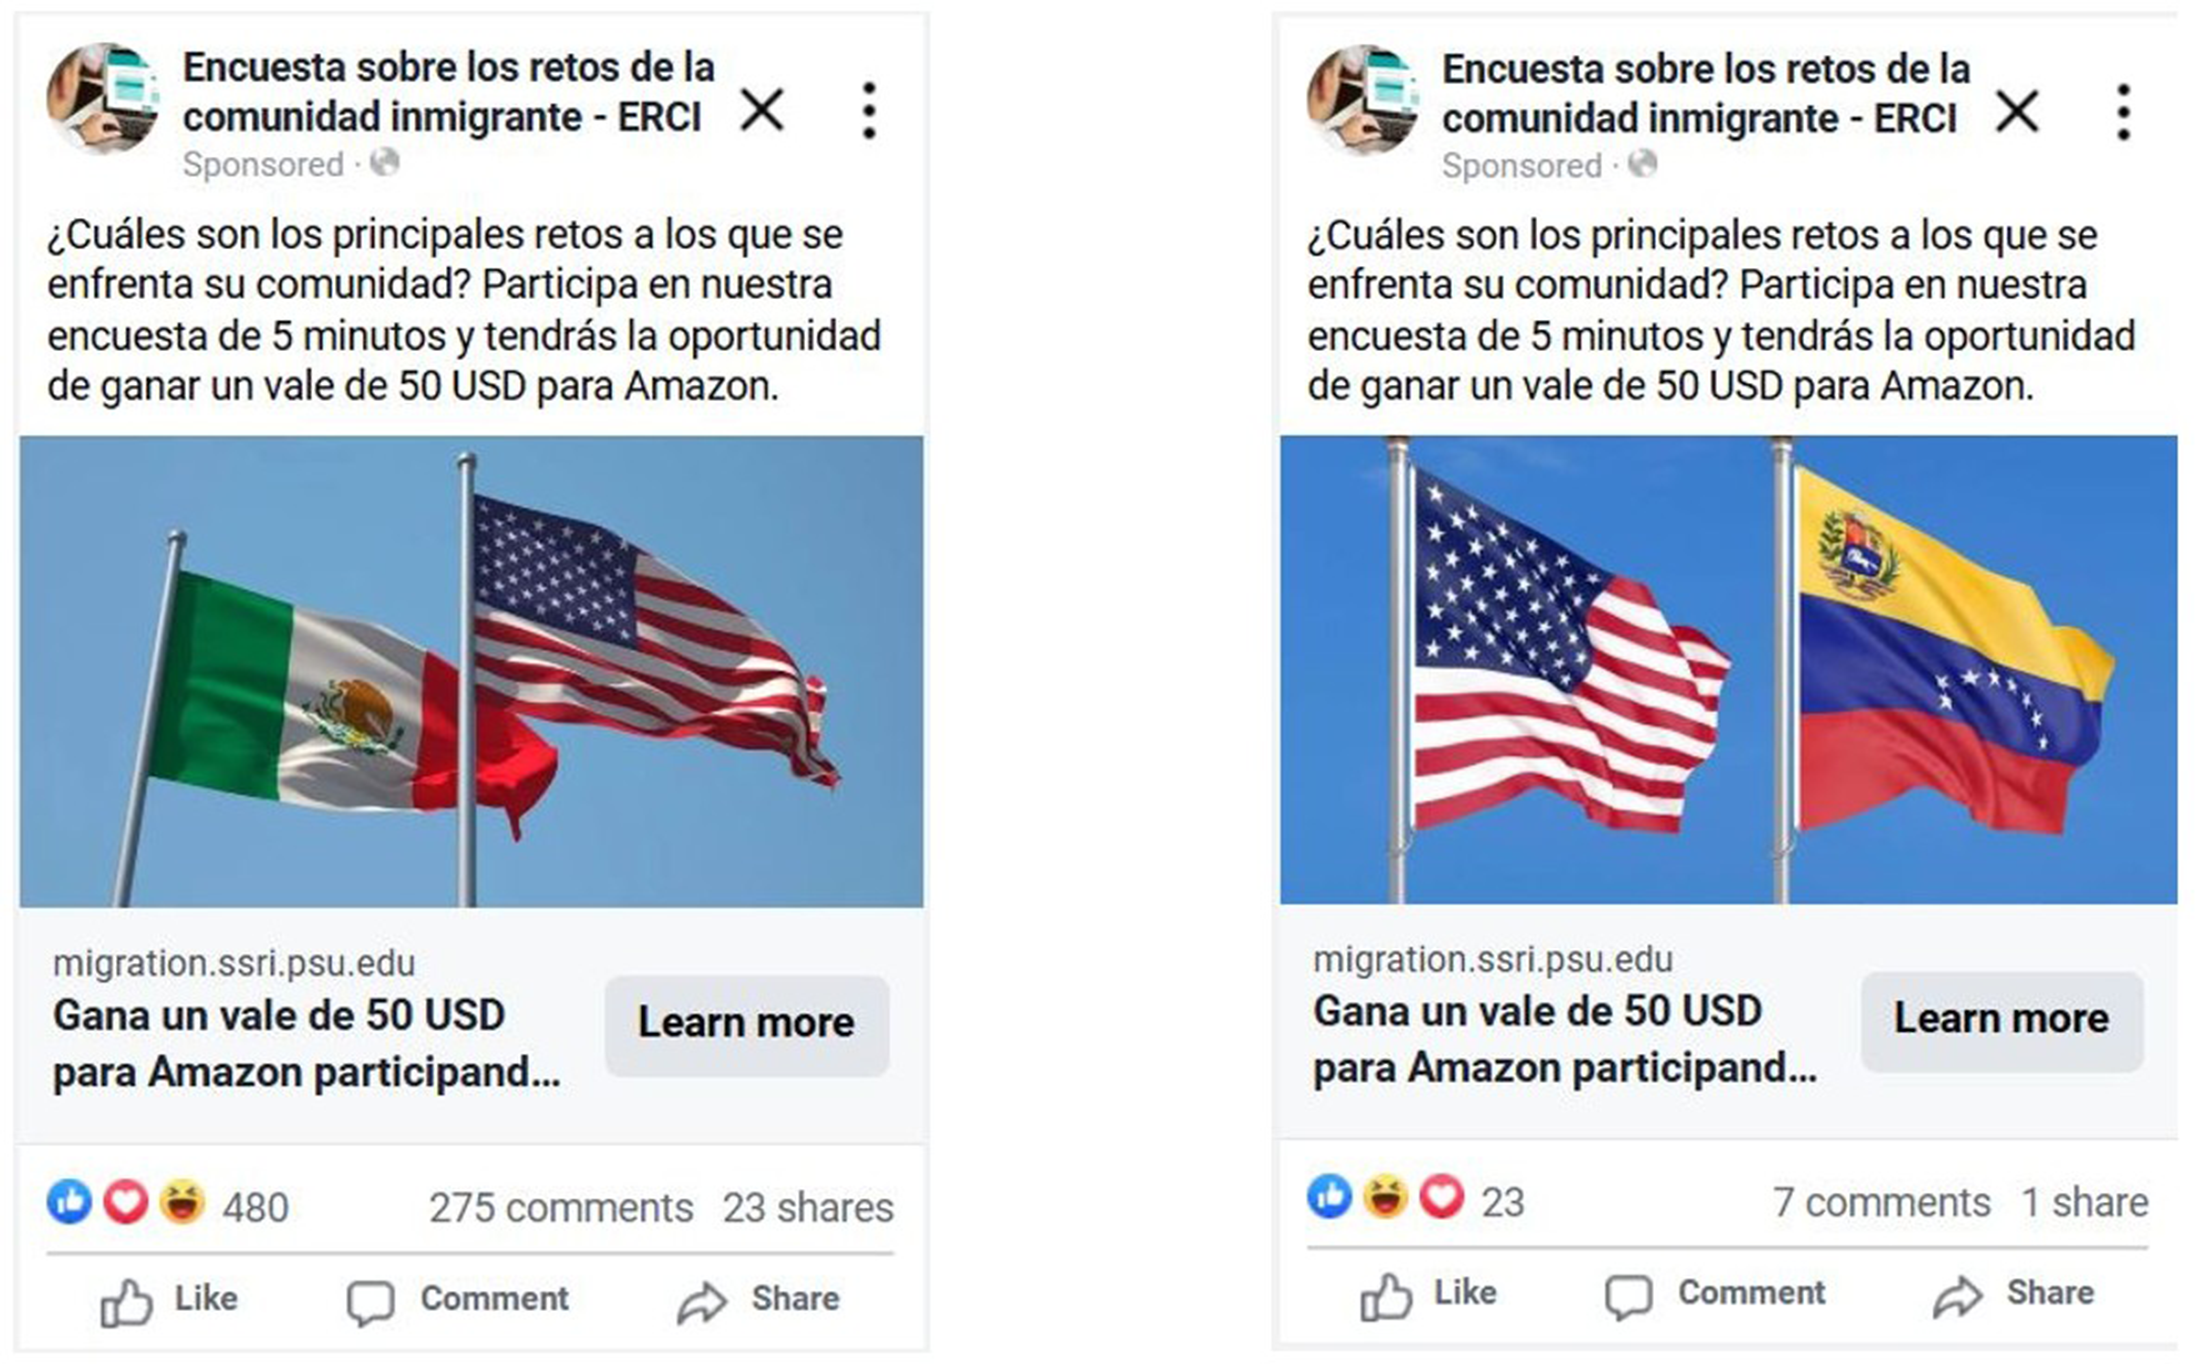
Recruitment ad design.
Advertisements received the same budget allocation by group and state (e.g., Mexicans in California), and a maximum daily budget spending limit was set to 200 USD. Participants who completed the survey were asked whether they would like to participate in a lottery to win a 50 USD Amazon voucher. The lottery ran throughout the study. Winners of the lottery—a random pick of ∼1 percent of participants—were provided with a unique number to collect the prize. The vouchers could be collected by emailing the project team with the winning number. The voucher was then shared via email.
We obtained ethical approval from the ethics commission of one of the participating universities (University of Potsdam, see Annex II in the Online Supplement). Given the sensitivity of migrant irregularity, the survey was entirely anonymous. We did not collect any personal information, such as name or contact details, that could lead to the identification of study participants. For all potential study participants, we explicitly stated the two objectives of our study (i.e., first, understanding the challenges of legal and undocumented immigrants and, second, understanding the size and composition of undocumented immigrant populations). This was done on both the Facebook page and the background website hosting the survey. Data was stored securely on local servers, and it was not shared with third parties. The welcome message, the consent form, and the data protection and privacy declaration are provided in the Online Supplement.
Facebook users were targeted by creating custom audiences on Facebook's ad manager platform. For each advertisement, we specified the location (Texas, Florida, Illinois, and California), the age range (older than 18), and a marker for previous residence (person has previously lived in [Mexico or Venezuela]). To discern the legal status of survey respondents among those migrant groups, we use different questions within our off-platform survey (see the “Selection” section).
Measurement
The questionnaire included a total of 15 questions pertaining to different topics: (1) challenges facing the community; (2) demographics (age, gender, country of birth)—useful to verify that the targeting worked; (3) migration legal status (see the next section); (4) marital status, children, and duration of residence in the United States; (5) employment, work sector, and highest educational attainment; and, lastly, (6) whether they want to be considered for the lottery to win a 50 USD Amazon voucher. We discuss the measurement of central concepts in more detail below.
Cost-effectiveness
One important dimension of assessing the viability of Facebook/Instagram-recruited surveys among undocumented immigrants is cost-effectiveness. We measure cost-effectiveness by calculating unit costs, i.e., the amount spent on advertisements for one valid survey submitted. A valid submission is defined as a unique survey participant who provided information on the question of legal status in our survey. We exclude spending on staff to facilitate comparisons across projects. One full-time staff member is sufficient to administer the campaign using the Facebook Advertisement Manager.
Misclassification
To assess whether Facebook's classification of “immigrants” is valid, we compare the Facebook/Instagram classification with self-reported information on birth countries for participants in our off-platform survey. The classification algorithm remains a black box. Previous IP sign-in locations, language settings, and on-platform networks are commonly mentioned as key information to determine who has previously lived abroad. As a result, it is impossible to explain the source of misclassification issues if they arise.
For example, due to the “Remain in Mexico” policy, implemented from 2019 to 2022, people who asked for asylum at the U.S.–Mexico border were required to remain in Mexico until their U.S. immigration court date. This led people from across Latin America to wait in Mexico for months before eventually migrating to the United States. Such individuals might be classified by Facebook as having immigrated from Mexico even if they were originally from another country. It is also possible that the Facebook/Instagram algorithm classifies U.S. Americans who lived in Mexico for several years and returned to the United States as immigrants of Mexican origin. We report the percentage of matching country information as an indicator of misclassification.
Selection
Several selection processes apply to our recruited sample: Selection into membership on the platform, selection into exposure to our ad, selection into responding to our ad, and selection into completing the online survey. Given that this survey is not based on a probability sample, the probability of inclusion in the survey and the factors driving non-participation are unknown. However, as is commonly done, we compare observable characteristics of our net sample with known distributions of the reference population based on large, traditional survey data. Specifically, we compare sample distributions for age, gender, marital status, education, and duration of residence with 2023 American Community Survey (ACS) estimates for Mexican and Venezuelan adults age 18 + living in the four selected states.
Legal status elicitation
In our survey, we pursued three different ways of eliciting information about migration status: Direct question, stepwise exclusion, and a list experiment.
The direct question was worded as follows: “What is your current residence status?” The answer categories were:
Citizen of the United States. Permanent residence (green card). Temporary residence visa (work, study, tourism). Refugee (approved asylum application). Asylum seeker (awaiting decision). Protection from removal (e.g., DACA or TPS). I don’t have any papers. Don't know, refuse to answer.
Categories one through four were considered as “documented,” i.e., legal immigration statuses, whereas categories five through seven were considered as “undocumented” in accordance with current legislation in the United States (National Academies of Sciences, Engineering and Medicine 2015).
The stepwise exclusion approach involved a series of sequential questions on various residence categories. All were asked the first question. Each subsequent question was asked only if all previous questions were answered with a “no.” The questions were presented as follows:
Are you a U.S. citizen? (Yes/No). Do you currently hold a green card? (Yes/No). Do you have a temporary visa for work or study? (Yes/No). Do you have approved refugee status? (Yes/No). Are you an asylum seeker awaiting a decision? (Yes/No). Are you protected from removal/deportation (for example, “DACA” (deferred action for childhood arrivals) or “TPS” (temporary protected status)? (Yes/No).
The share of respondents who declared not being part of any of the groups was categorized as “undocumented immigrants,” in addition to those who responded positively to items five (i.e., asylum seekers awaiting decision) and six (i.e., protection from removal). The main difference between the direct question and the stepwise exclusion approaches is that the explicit category for “undocumented” (i.e., not having any papers) is not asked in the latter but inferred by ruling out alternatives.
The list experiment is a survey methodology developed to elicit responses to sensitive questions that respondents are unlikely to answer truthfully (Blair and Imai 2012; McKenzie and Siegel 2013). This method has been applied, for example, to elicit true drug use behavior or to better understand the prevalence of sexual diseases, racial prejudice, and criminal offences, among other stigmatized behaviors (Ehler, Wolter and Junkermann 2021; Li and Van den Noortgate 2022). In our context, asking about the legal status of immigrants can be considered one such sensitive topic. Not only because of the potential stigma associated with living in violation of the laws regulating immigration, which might be stigmatized, but also because undocumented immigrants could risk detention and even deportation to their countries of origin or even a third country in case of detection by immigration authorities. Hence, revealing one's status as an undocumented immigrant could incur significant risks to respondents or to their family members.
In a list experiment, survey participants are randomly assigned to be shown one of two given lists of statements (see List A and List B in Table 1). The lists are identical except that List A contains an additional statement (d), “Not having official papers to stay limits my opportunities in society,” which is indicative of the person being undocumented. Respondents to the list experiment are only required to provide information on how many of the items on the list they agree with, not which of the items specifically they agree or disagree with. In this way, their individual status remains hidden from researchers or external observers. However, by comparing the average number of items that respondents agree with between the two groups (or the two lists), researchers can calculate the percentage of respondents who are undocumented.
Statements on Our List Experiments for List A and List B.
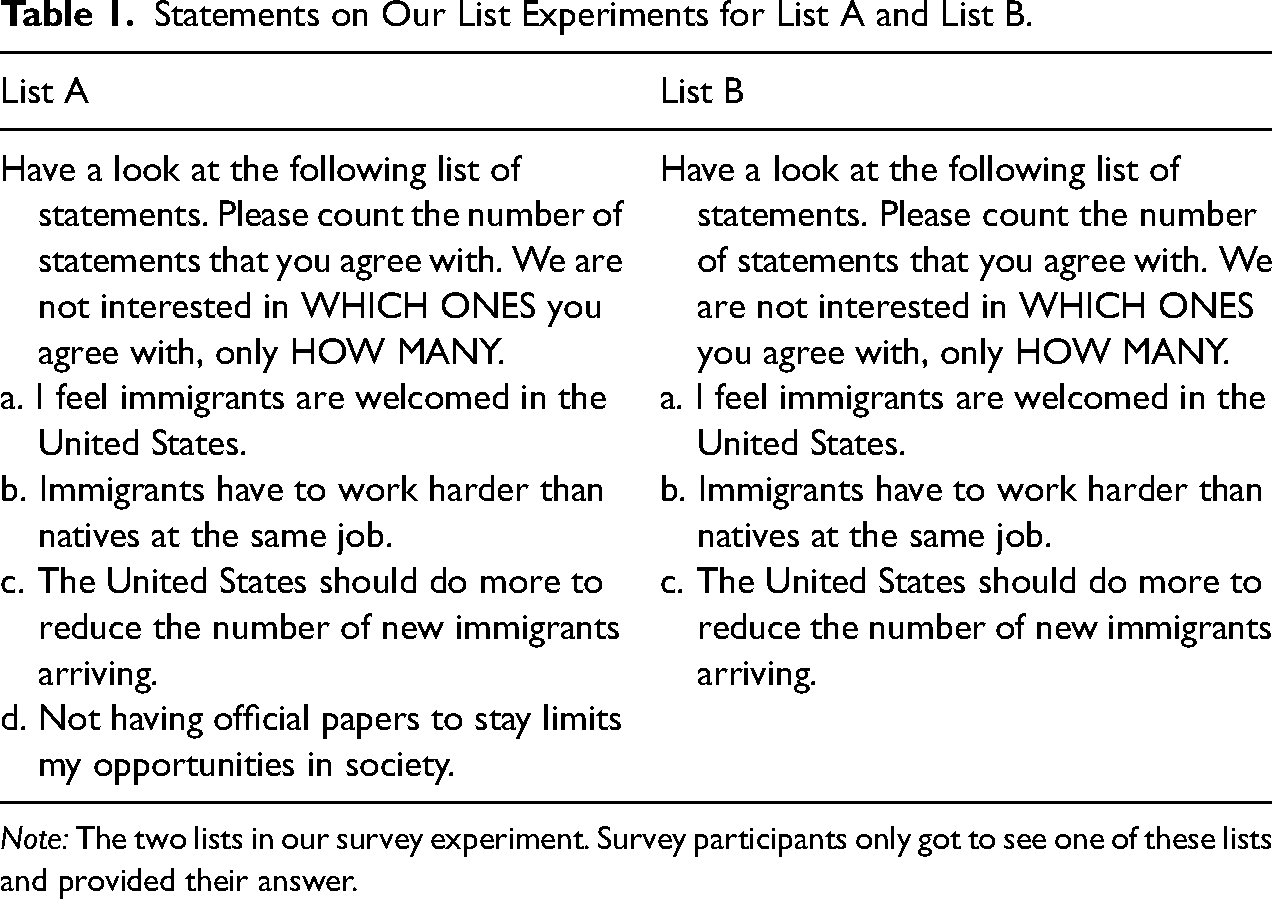
Note: The two lists in our survey experiment. Survey participants only got to see one of these lists and provided their answer.
To answer the list experiment, survey participants selected the number of statements they agreed with from a set of single-choice options (i.e., one, two, three, or four, depending on which list they were randomly assigned).
Finally, and in addition to the conventional list experiment, we also explored the combination of the list experiment and direct questions as developed by Aronow et al. (2015). This estimate is a weighted average of the direct question estimate and the list experiment estimate, but among the respondents who did not indicate a positive reply to the direct question, in our case, the “I don’t have any papers” statement as a response to “What is your current residence status question?” mentioned above. In this approach, the advantages of each elicitation method are combined to attain an estimate that is more precise and less biased (Blair, Coppock and Moor 2020).
Figure 2 presents a flow chart of the survey design regarding the elicitation of legal status, including corresponding sample sizes. In total, 80 percent of respondents were randomly assigned to first respond to the list experiment and then to the direct question in the questionnaire, while the remaining 20 percent of the sample were randomly assigned to respond to a series of sequential questions (stepwise exclusion) without the direct question. Within the list experiment treatment, respondents were assigned randomly to list A or B based on a 50/50 chance. Covariate balance tests showed that all survey randomization was executed correctly.
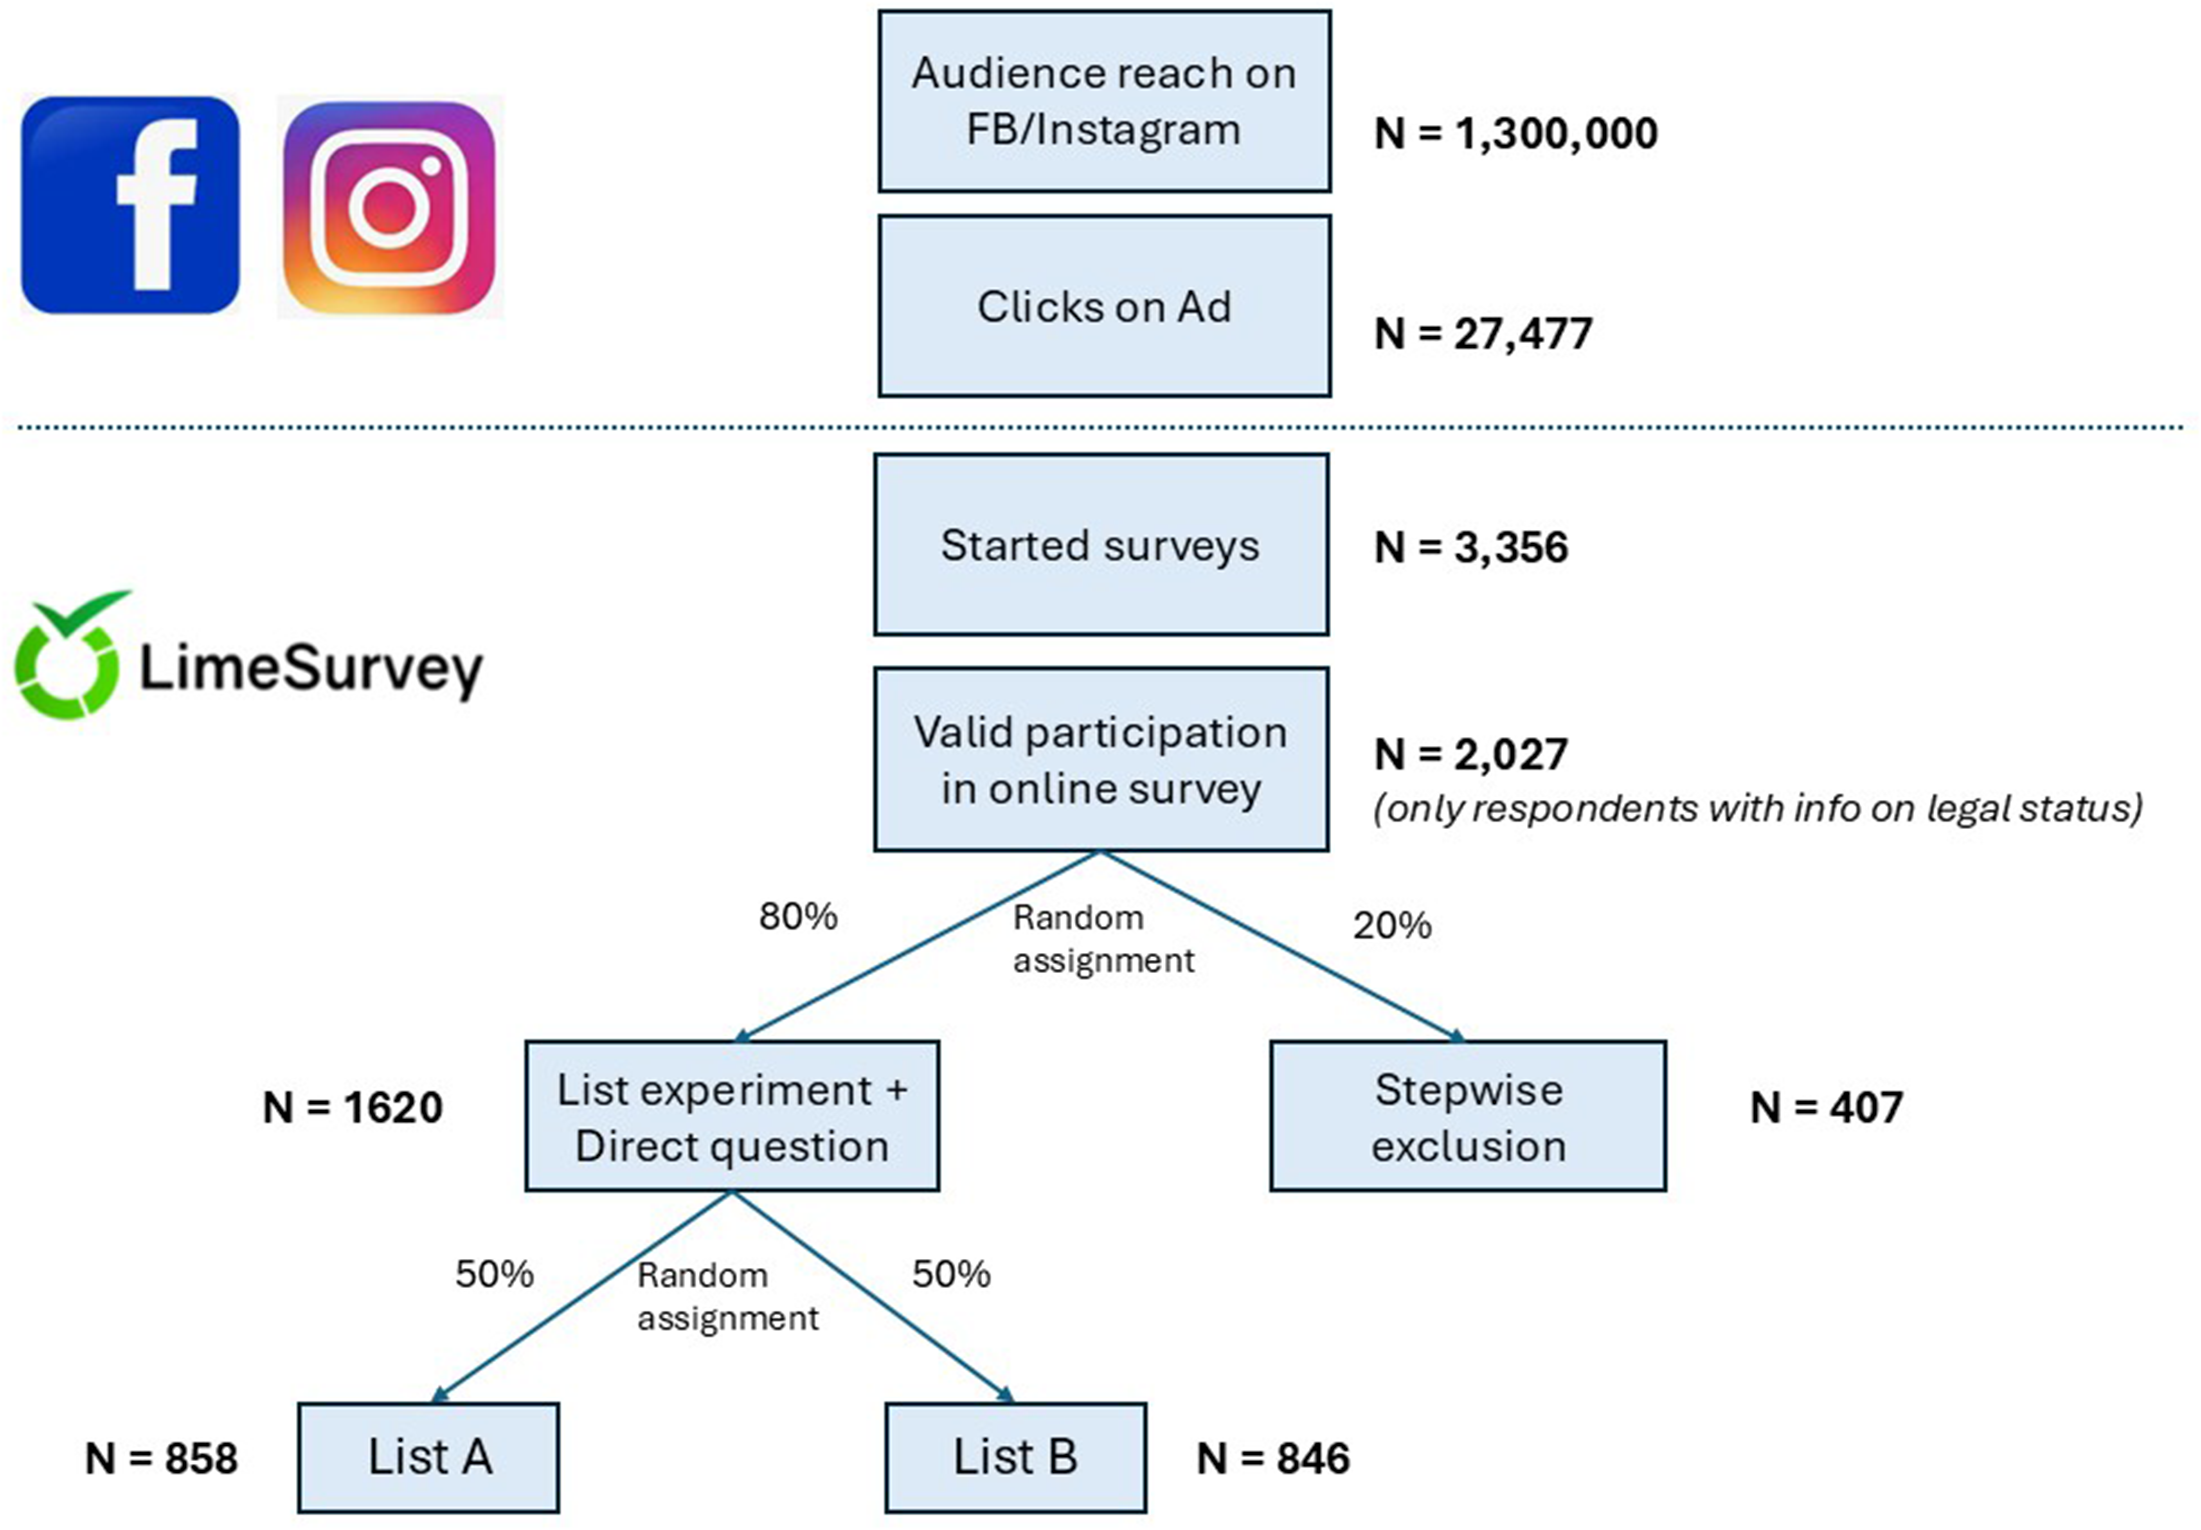
Flow chart illustrating survey recruitment steps, randomization, and net samples.
Further diagnostic tests for the list experiment, including randomization balance, floor and ceiling effects, as well as design effects, confirmed the validity of the list experiment (see Online Supplement B for details).
When comparing our estimates with ACS estimates, we apply weights. We developed two alternative weights. The first, “raking 1,” is a population weight raked to the following ACS population controls: country-of-birth (Mexico, Venezuela) by age group (18–24, 25–39, 40–60, 61+), country-of-birth by sex (male, female), and country-of-birth by education (less than high school, high school degree, college degree+). The second, “raking 2,” is raked to the same control totals as “raking 1” plus country-of-birth by state of residence (California, Texas, Florida, Illinois). Figure A1 in the Online Supplement shows that the results do not change in relation to the type of weight used. Furthermore, we estimated bootstrapped standard errors by sampling with replacement across 1,000 iterations.
Results
The results of our study are grouped into two sections. The first section highlights results relating to survey recruitment, including (1) sample sizes, response rates, and cost-effectiveness (4.1.1.), (2) misclassification of “immigrant status” (4.1.2.), and (3) selection (4.1.3.). The second part focuses on legal status elicitation.
Survey Recruitment
Net sample, response rates, and cost-effectiveness
Overall, the recruitment campaign reached a total of 1.33 million unique Facebook/Instagram users in the four targeted states who, according to Meta, used to reside in Mexico or Venezuela. Out of all users who saw the advertisement, only 27,477 clicked on the link provided in the ad (2 percent). The overwhelming majority (>90 percent) of Facebook/Instagram users who clicked on our Ad did so from a mobile phone. The share of Android users was higher among Facebook users compared to Instagram users. Out of the Facebook/Instagram users who followed the link, 3,356 started the survey, and a final total of 2,027 provided valid responses to the question of legal status. Over 80 percent of respondents who dropped out of the survey did so within the first three questions. The average response rate across the whole sample was 0.15 percent (i.e., 1.5 per 1,000 exposed Facebook/Instagram users completed and submitted the survey). Across all ads, the campaign spent USD 15,376, equivalent to a unit cost of USD 7.6 per valid submission. Unit costs for Facebook/Instagram ad spending are a function of (a) how willing the target audience is to engage with the ad, (b) how large the audience is on the platform, and (c) the number of competing ads running at the same time on the platform.
The unit costs increased to USD 13.8 per valid submission when we excluded respondents who were misclassified according to origin country (see next section). This cost varies substantially by sex, U.S. state, and immigrant group: from over USD 53 for Venezuelans in Illinois and California, USD 13 for Mexican men in California and Florida, and below USD 6 for Mexican women in Florida, California, and Texas. Group differences in cost per valid submission are consistent with group-level differences in link clicks on the Meta platform. This is because Meta increases advertising costs for groups that are less likely to respond. 3
Country of birth misclassification
We interpret differences between survey participants’ answers and Meta's classification as an indication of misclassification, assuming that answers given by respondents are truthful. The study sought to recruit Mexican and Venezuelan immigrants exclusively by targeting ads to those identified by Facebook/Instagram as “users who used to reside” in each country. Figure 3 below shows the univariate distribution of the question “country of birth” by immigrant group. The question was presented in a multiple-choice format, offering “Mexico,” “Venezuela,” “United States,” and “Other” as response options. If respondents selected “Other,” they were prompted to type in their country of birth. We find that only 62 percent of our respondents report having been born in either Mexico or Venezuela. For each target group, about 40 percent of respondents came from other countries, even though Facebook/Instagram labelled them as previously having lived in any of our two target countries. For example, 25 percent of “Mexican immigrants” and 15 percent of “Venezuelan immigrants,” according to Meta, reported Cuba as their country of birth. This is unlikely to be related to response biases (like satisfying) because Cuba was not included in the dropdown menu of possible answers and had to be entered manually by respondents. If respondents entered the wrong country of birth, we would not expect so many to report Cuba. It is not possible to cross-check the actual country of birth, so it is difficult to assess how implausible Cuba is as a response. We consider that at least some Cuban-born individuals may have been classified as having lived in Mexico by Facebook/Instagram's algorithm. From 2017, Cubans have not been granted automatic legal entry to the United States. Therefore, Cubans seeking asylum might have attempted to come to the United States through Mexico and make their request at the U.S.–Mexico border. Because of the “remain in Mexico” policy, Cuban asylum seekers would have had to stay there for months or even years before being allowed into the United States. 4
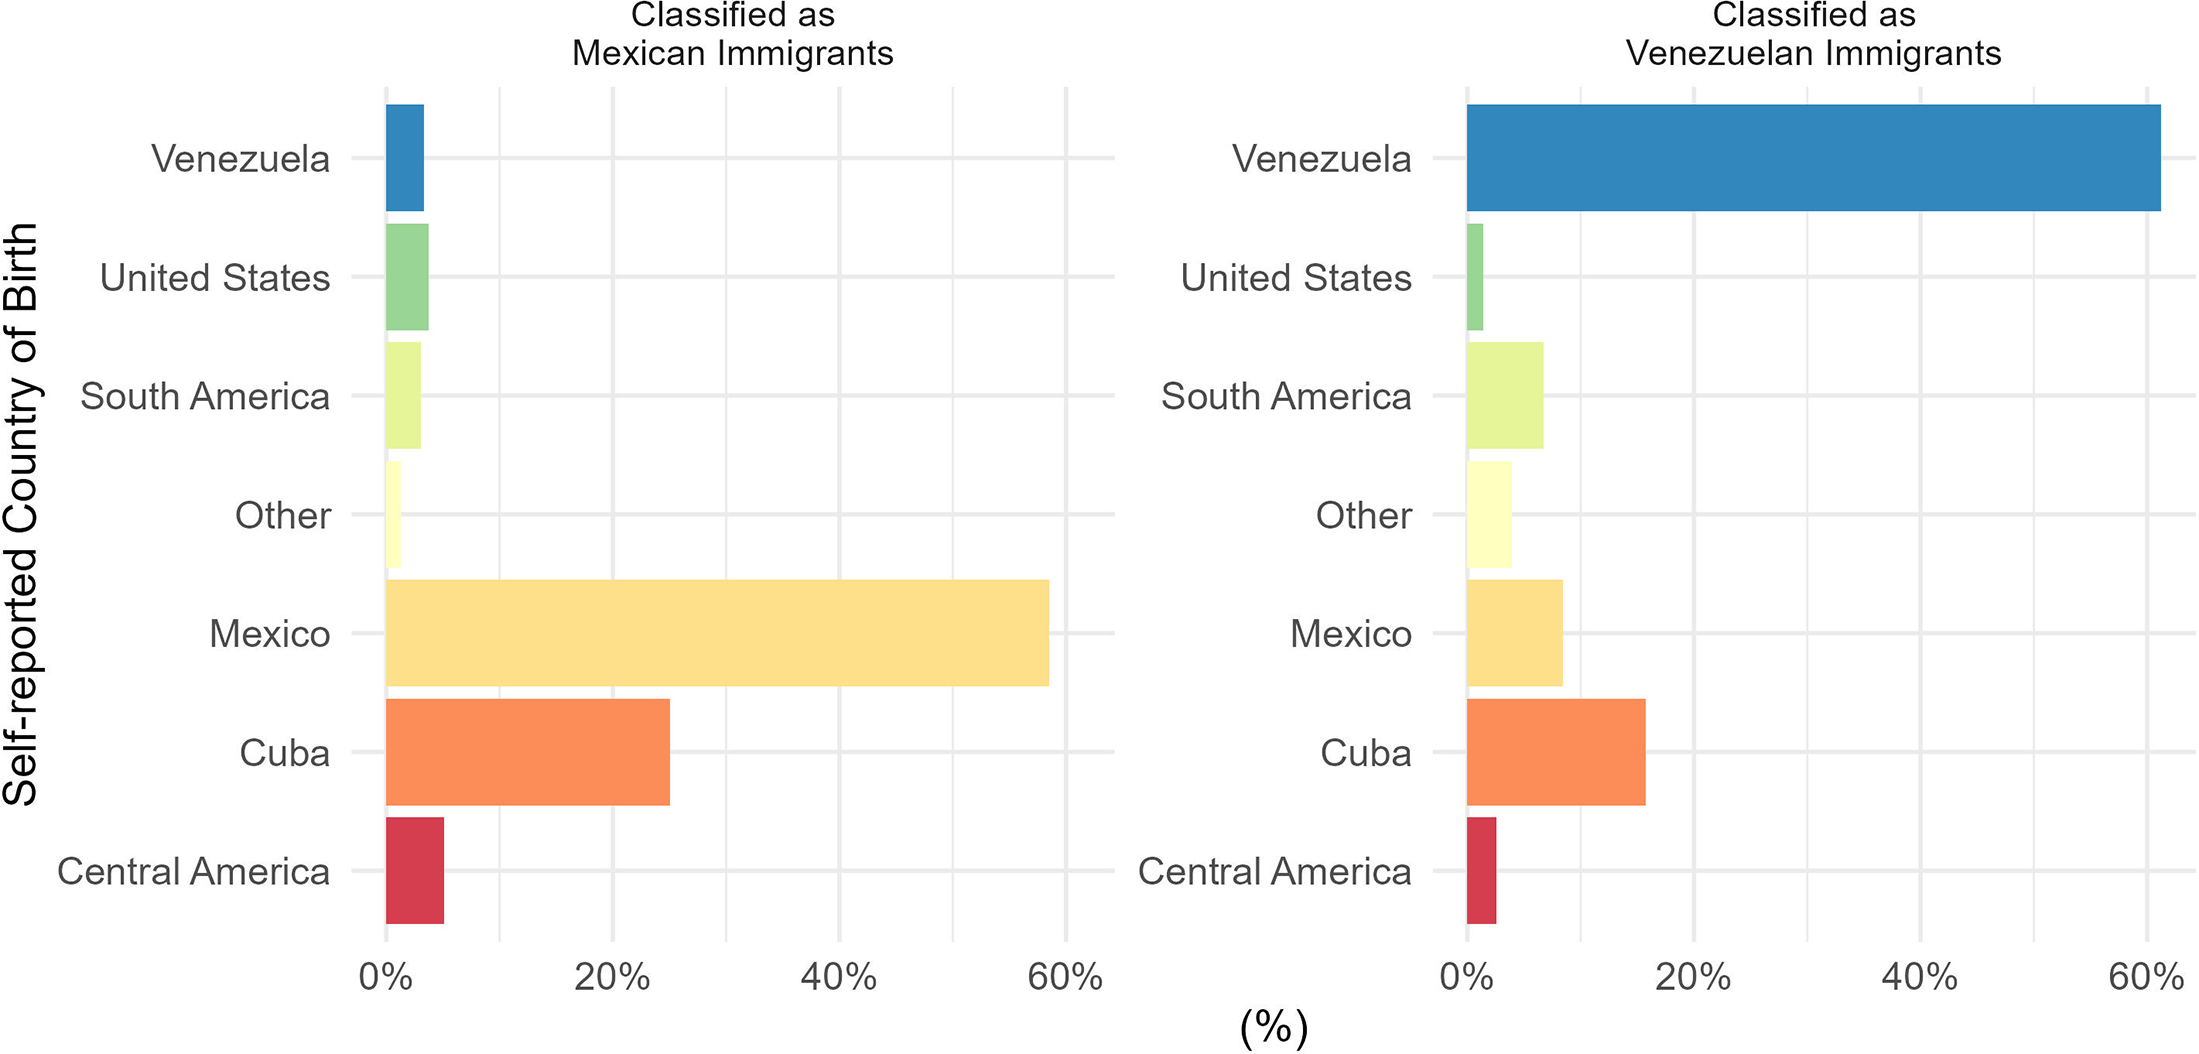
Self-reported country of birth among respondents classified as “having previously lived” in Mexico or Venezuela.
Sample selection
Figure 4 shows the relative distributions of various characteristics (i.e., age, gender, marital status, education, and duration of residence) of our Facebook/Instagram unweighted sample and the ACS reference estimates for Mexican and Venezuelan immigrants.
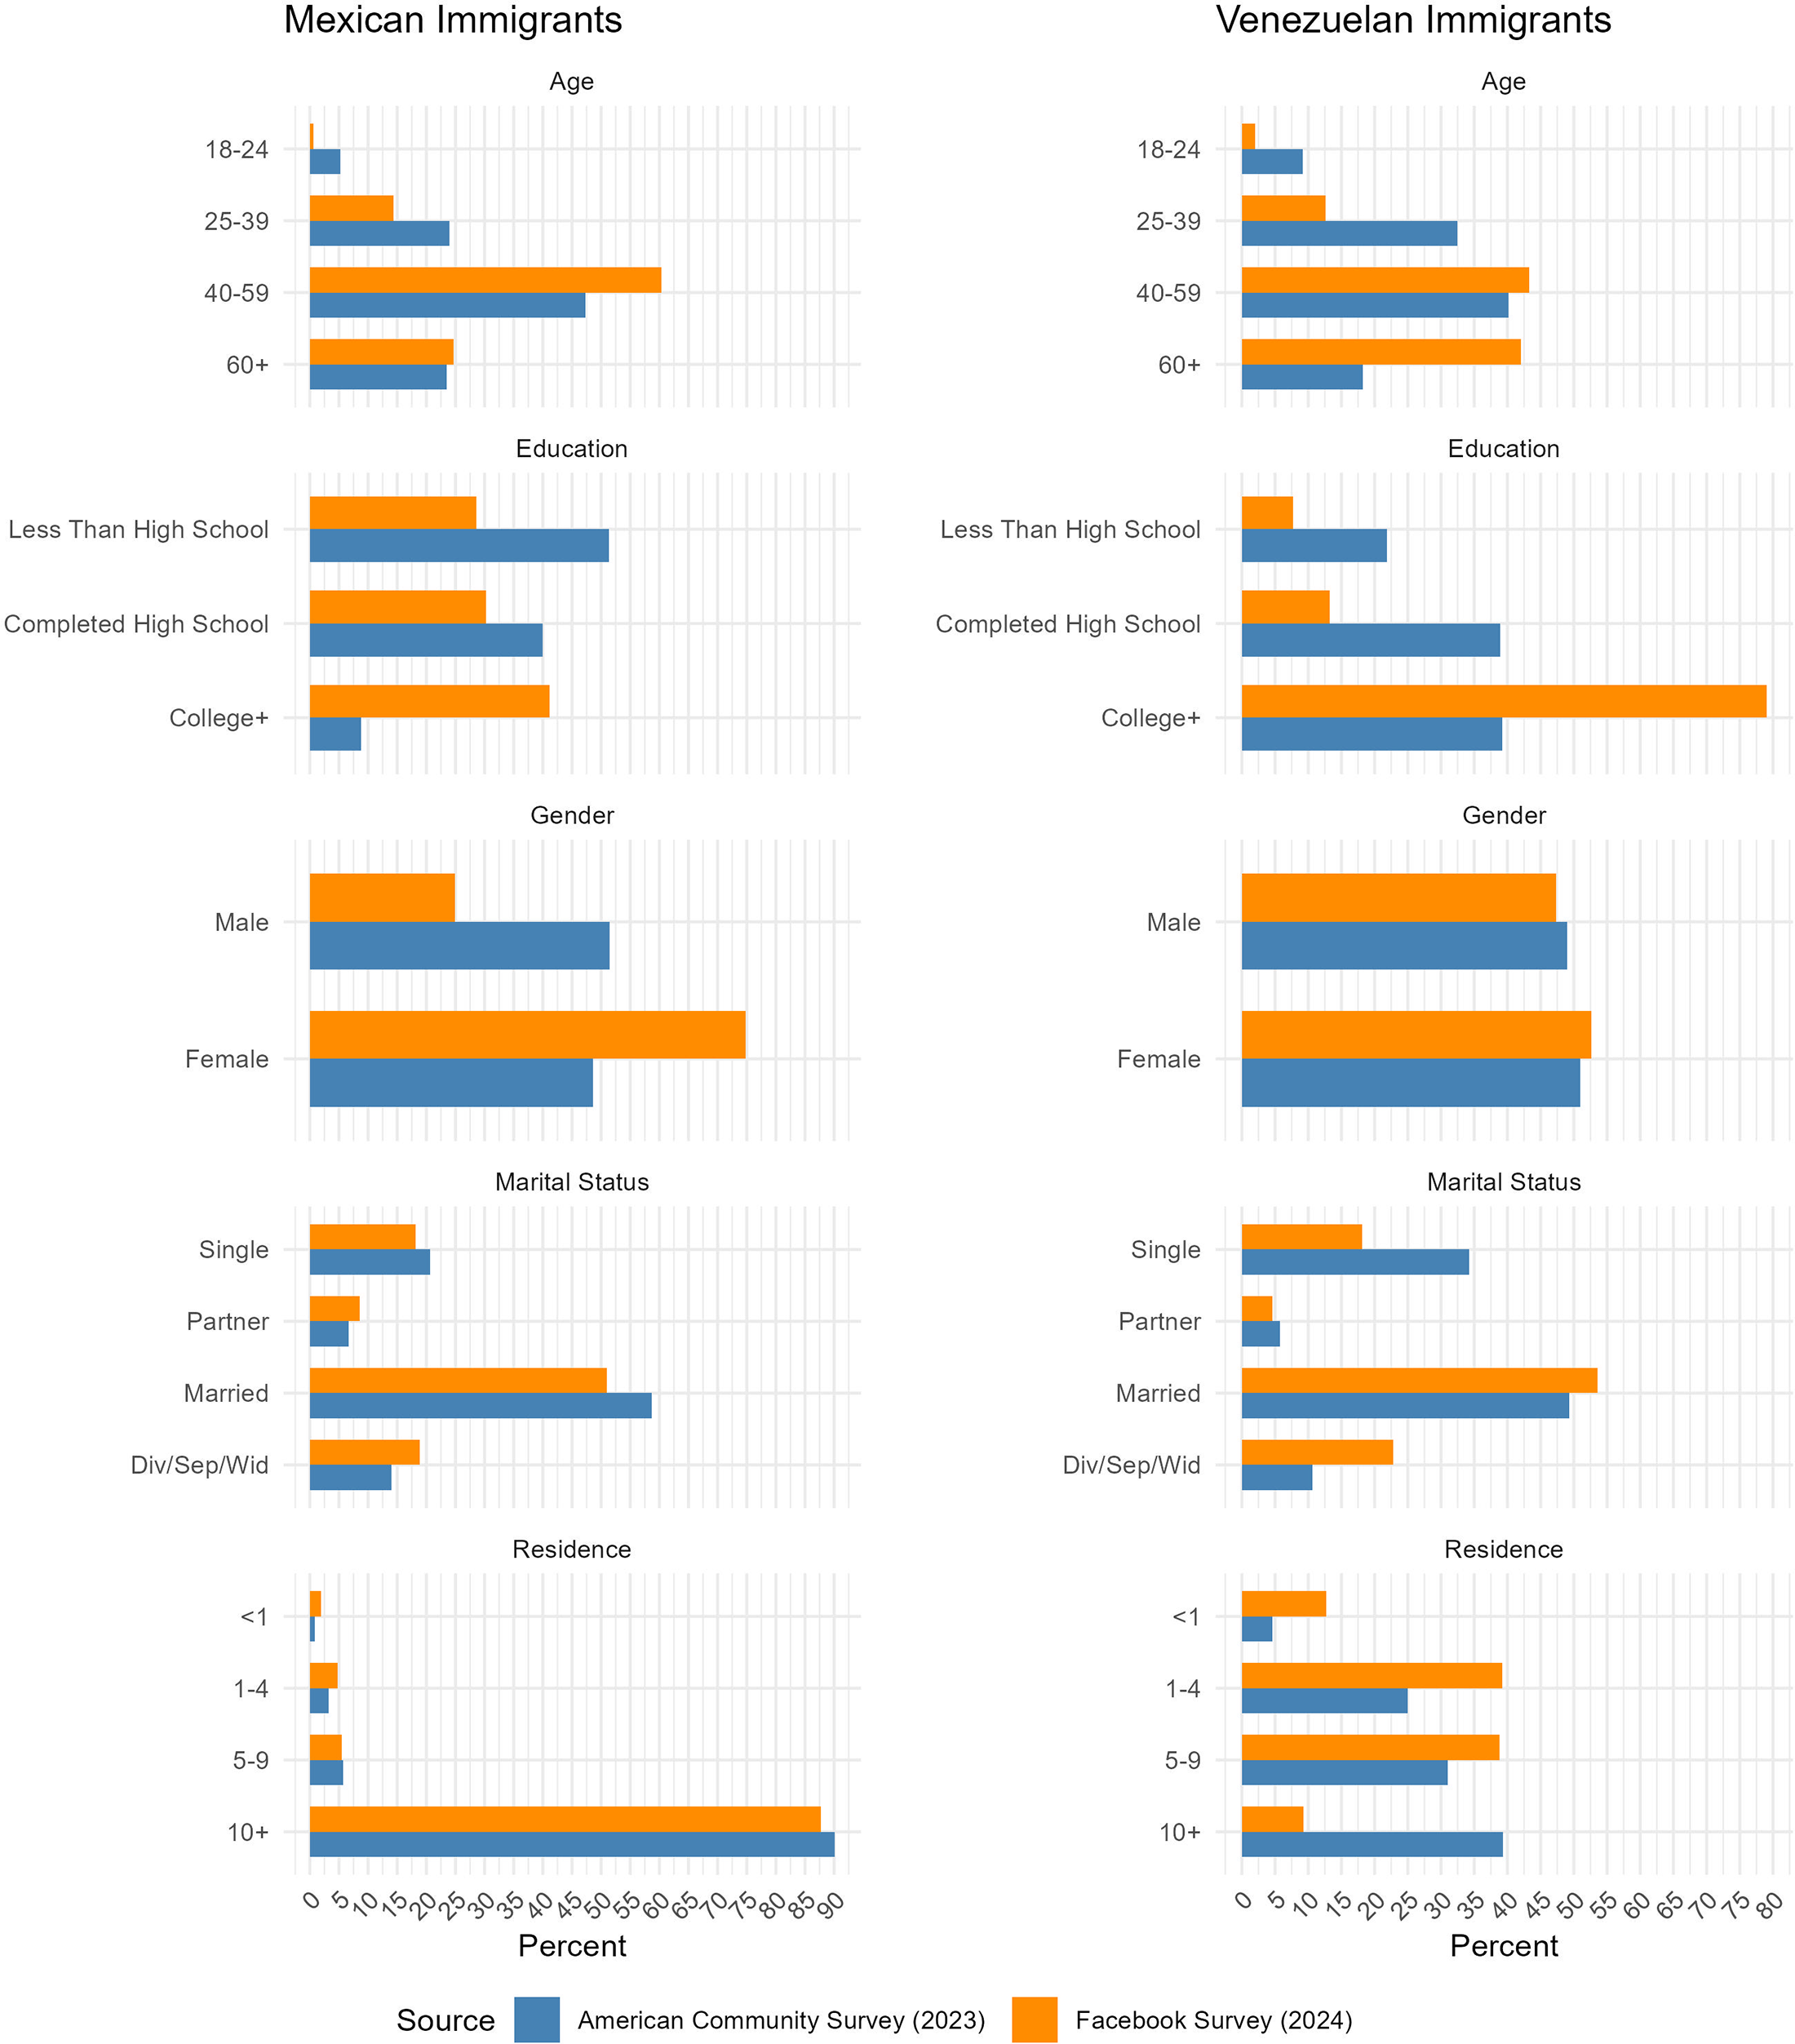
Respondent characteristics compared to ACS estimates.
For Mexican immigrants, we find a strong selection of our sample by age, sex, and education. Our sample is primarily composed of older, majority female, and college-educated individuals. We find strong consistency for the duration of residence. Over 90 percent of Mexican immigrants in both samples have resided in the United States for more than 10 years. For Venezuelans, we find a similar selection of our sample regarding age and education, but not sex. Furthermore, we find that Venezuelan immigrants in our sample are less likely to be single and reside in the United States for less than 10 years, as compared to the ACS.
Table A1 in the Online Supplement provides a full descriptive summary of sample characteristics for Mexican and Venezuelan immigrants.
Legal Status
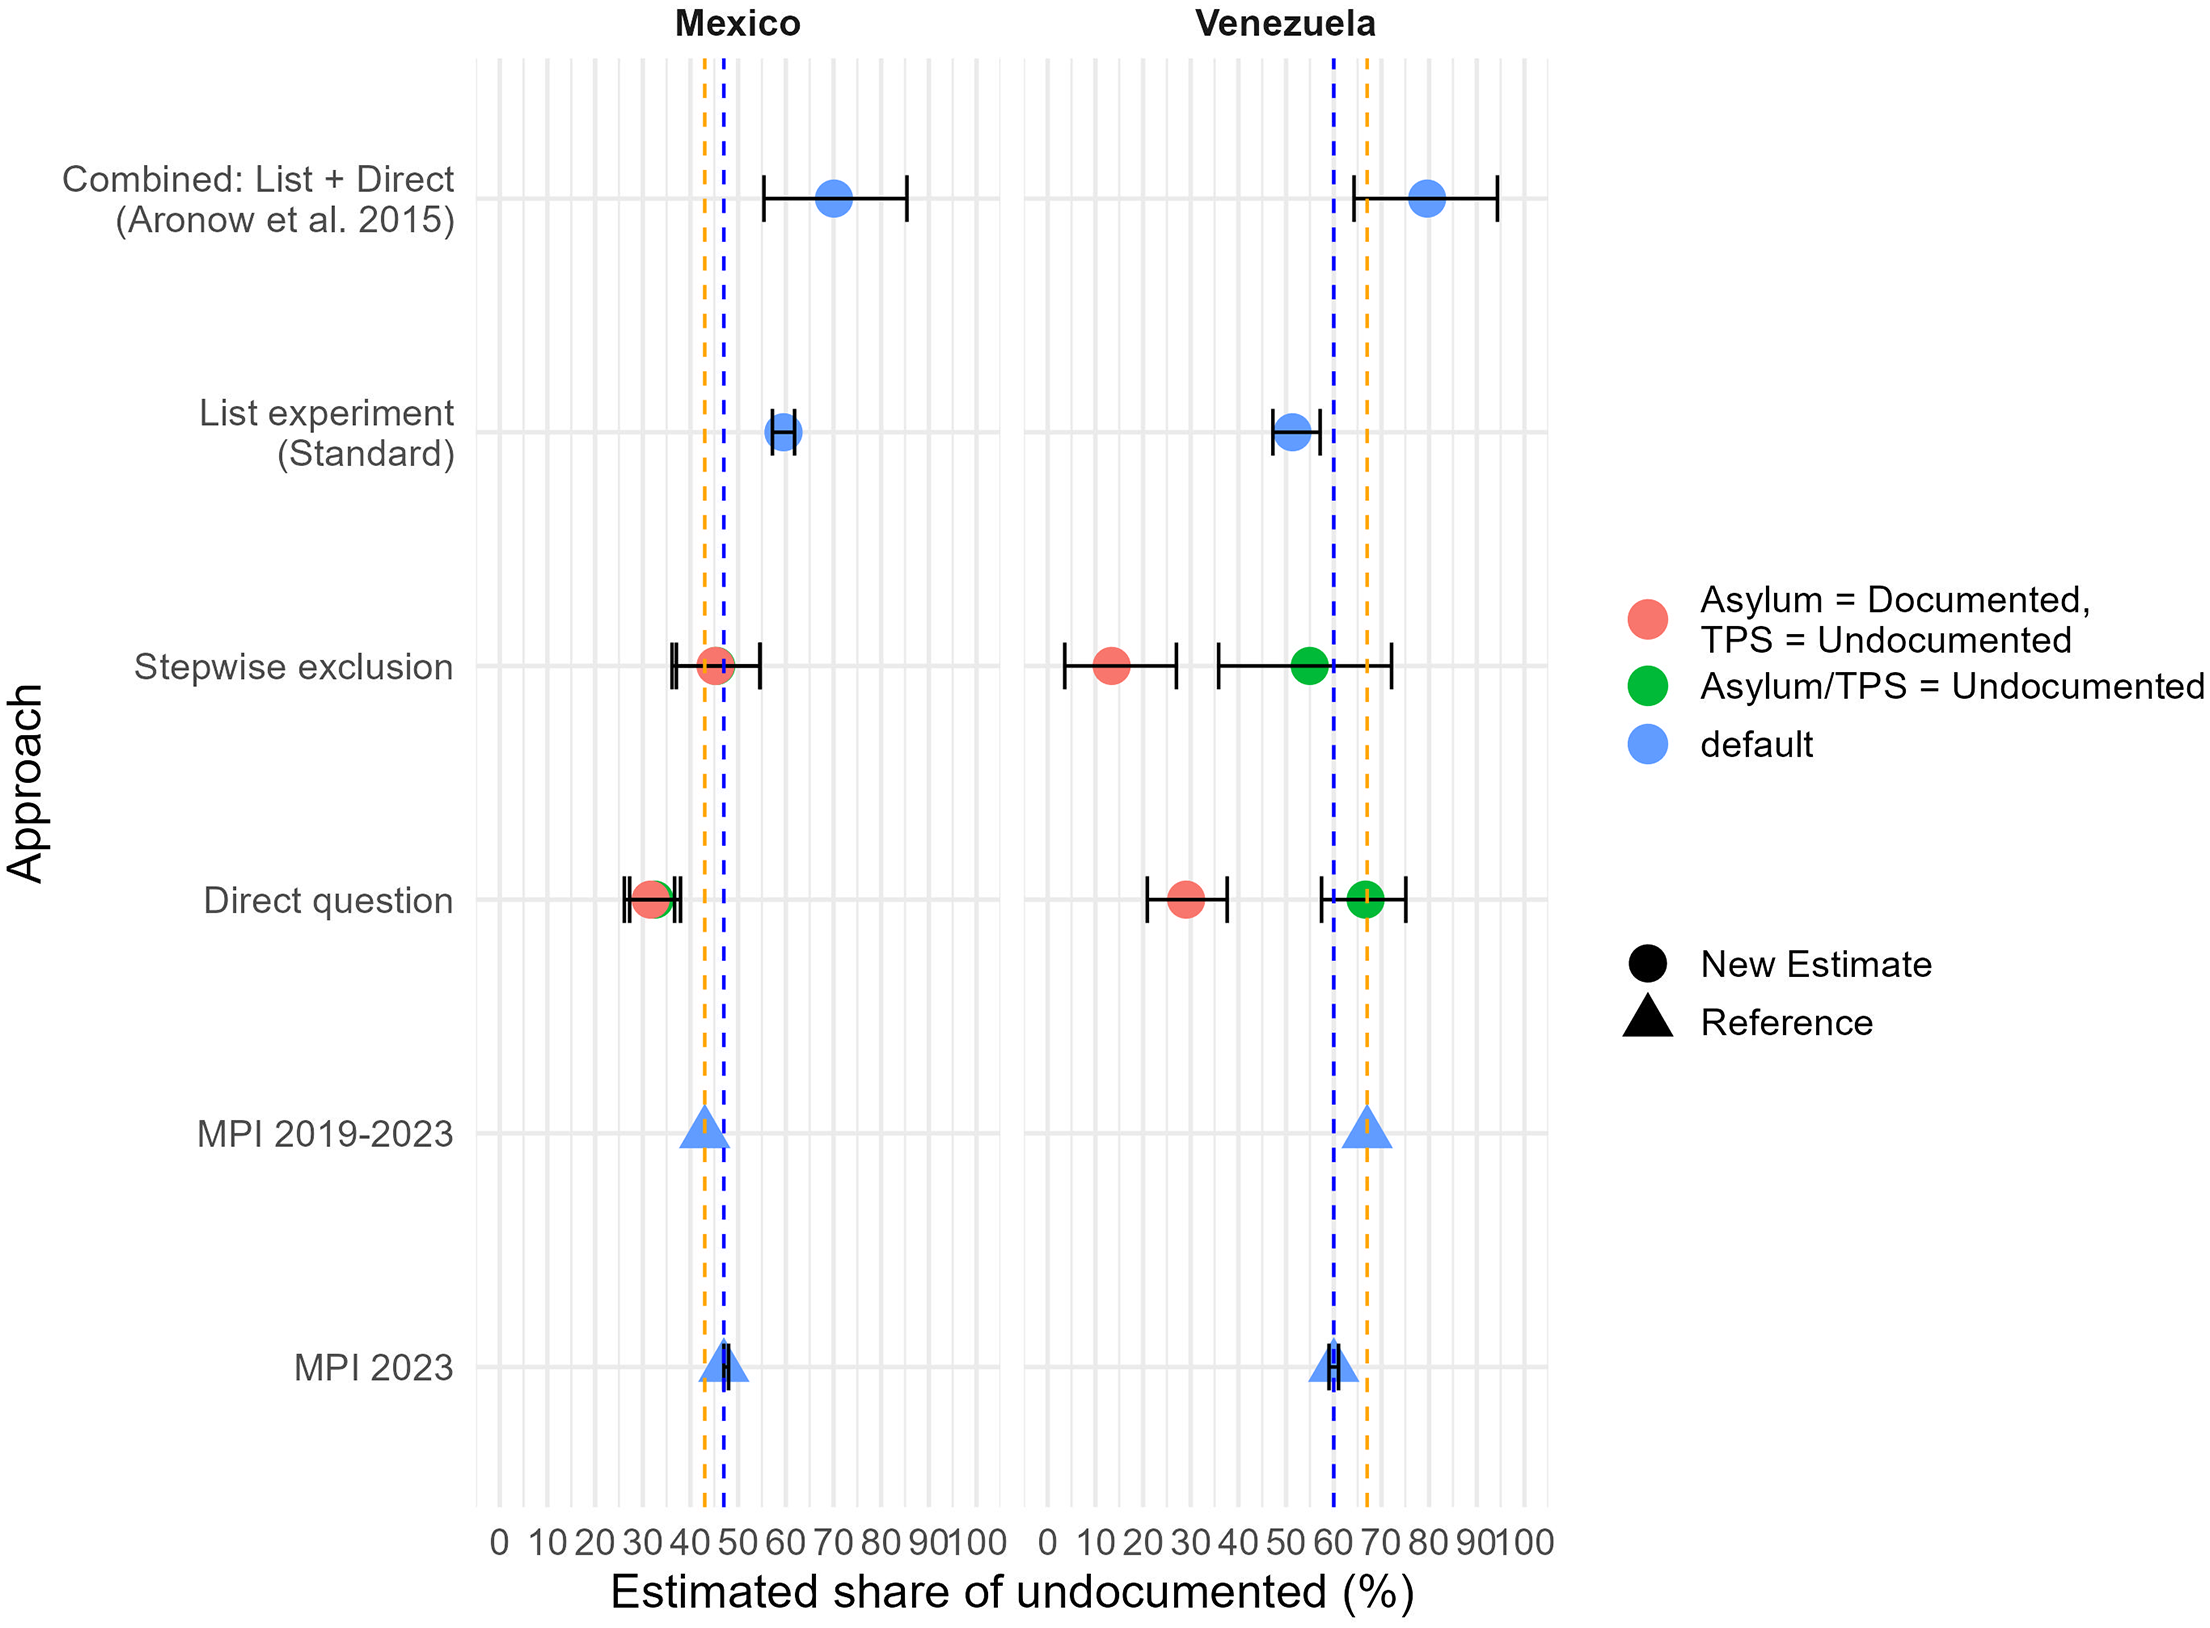
One key objective of our study was to explore whether the undocumented status of immigrants without the required documentation could be elicited using an online Facebook/Instagram survey. Figure 5 reports the estimated percentage of undocumented immigrants out of all immigrants from the respective group. These estimates are based on the pooled responses from all four U.S. states included in our study. The sample sizes were too small to provide comparisons across states as initially envisioned.
Undocumented status estimation by approach.
For comparison, Figure 5 includes two reference estimates for the share of undocumented among Mexican and Venezuelan immigrants produced by the Migration Policy Institute (MPI). One estimate is for the 18+ population in all the United States, the other is for the four states in our sample, but for all ages. The ideal combination of age and geography is currently unavailable. Our Facebook/Instagram sample estimates were weighted (raked to match age, sex, and education control totals). 5 The results do not vary by the type of weighting procedure applied (see Figure A1 in the Online Supplement). Because of the complexity of the legal status list experiment estimates, we calculated bootstrapped standard errors. 6
For Mexicans, the direct question yields 13 percentage points (pp) lower estimates relative to the MPI 2023 reference, and the stepwise exclusion approach yields almost identical estimates. The standard list experiment approach yields a 15 pp higher estimate, whereas the combined estimate (following Aronow et al. 2015) yields a 25 pp higher estimate.
Consistent with expectations, estimates based on the list experiment are higher than the direct measure and the stepwise exclusion approach. This confirms sensitivity bias for the legal status elicitation and suggests that Mexican immigrants in our sample tend to underreport their undocumented status in direct questions. Moreover, the list experiment yields an estimate of the percentage of undocumented that is higher than the established reference estimate.
For Venezuelans, we find a similar pattern, but also we note that the formal inclusion criteria that define undocumented status in the United States have strong implications for this group. When awaiting an asylum claim and DACA/TPS are included as undocumented statuses, the direct question and the stepwise exclusion approach yield estimates close to the MPI 2023 reference (3–8 pp difference). The standard list experiment approach yields an 11 pp lower estimate than the reference. This estimate is also lower than the direct question, which is unintuitive for the list experiment approach. However, when we re-assign TPS as “documented,” the direct question approach yields a substantially lower estimate. This suggests that Venezuelan immigrants may consider TPS as a formal, legal status when responding to the survey given that they receive formal papers. The combined estimate yields a far higher estimate (16 pp), as it was the case for the Mexican immigrants.
Discussion
This article explored the feasibility and effectiveness of using Facebook/Instagram as a tool for surveying immigrants in the United States, including undocumented immigrants, focusing on Mexican and Venezuelan immigrants in Texas, Florida, Illinois, and California. The study aimed to assess the feasibility of using an online survey to estimate the share of undocumented migrants, and to test three different ways of eliciting immigrants’ legal status: direct question, stepwise exclusion, and a list experiment. We reflect on lessons learned in terms of running survey recruitment campaigns aimed at documented and undocumented immigrants, the elicitation of their immigration status, unknown measurement error sources and sampling biases, and other limitations of our approach.
Survey Recruitment
The recruitment costs are a small fraction of the costs associated with in-person surveys (approximately USD 14 per valid response). The speed (approximately 4 weeks) and ease of implementation (one staff member overseeing data collection) are major advantages over traditional offline surveys or local, small-scale projects surveying undocumented immigrants (Larson and Droitcour 2012; Medová and Drbohlav 2013). We conclude that the practical advantages of Facebook/Instagram surveys found in other research (Rife et al. 2014; Pötzschke and Braun 2017; Iannelli et al. 2020; Kalimeri et al. 2020; Zhang et al. 2020; Ryndyk 2021; Pötzschke 2022; Rocheva, Varshaver and Ivanova 2022; Schneider and Harknett 2022; Pötzschke et al. 2023; Zindel 2023; Piekut 2024; Soehl, Chen and Erlich 2024; Varona et al. 2024; Rosenzweig et al. 2025) extend to surveying potential undocumented immigrants despite the sensitive and hard-to-reach nature of this specific sub-population, and could be explored to find out more about their living conditions.
In contrast to these cost advantages, the study revealed a major practical source of uncertainty for survey recruitment employing Facebook/Instagram relating to sensitive topics: the risk of being blocked by the platform. In our study, blocking of specific ads in the campaign occurred twice during the data collection stage. In some instances, the platform's algorithm automatically rejects advertisements before they go live or rejects advertisements after they have been running for several days or weeks. One explanation for blocking could be that users report the ad, triggering the system. Once reports exceed a certain threshold, the ad may be blocked automatically. We found the appeal process to review these automatic decisions by the platform to be rather restricted, lengthy, and arbitrary. Depending on the sensitivity of the survey, this may pose severe risks to researchers during data collection.
Measurement Error
While Meta allows researchers to target immigrants directly, thus overcoming a major difficulty for surveys based on probabilistic samples due to the absence of adequate sampling frames, we show that Facebook/Instagram misclassifies users regarding country of birth information, which is often used to infer immigrant status (Zagheni, Weber and Gummadi 2017). Only 60 percent of users classified as having lived in Mexico or Venezuela reported being from those respective countries. This level of misclassification is much larger than what has been identified by Grow et al. (2022) for self-reported age, gender, and country of residence in multiple countries. As such, migration researchers need to anticipate systematic misclassification and oversample for specific groups of interest.
Selection Bias
Our findings also point to a substantial, albeit expected sample selection. Similar patterns of sex and age selection among Facebook/Instagram users have been reported in other studies in terms of both the composition of the overall user population (Ribeiro, Benevenuto and Zagheni 2020) and participation rates in online surveys employing Meta's advertising campaigns system (Grow et al. 2022). Furthermore, the age selection we find in our study is consistent with Facebook/Instagram user activity, as younger populations have migrated to other platforms such as Instagram and TikTok (Auxier and Anderson 2021).
Facebook/Instagram's ability to capture recently arrived immigrants could serve as an advantage relative to large population surveys (see Varona et al. 2024). We find this to be true for Venezuelans but not Mexicans. New immigrant arrivals from Central and South America, including Venezuela, increased dramatically in 2022 and 2023 under humanitarian measures such as the CHNV (Cuban, Haitian, Nicaraguan, and Venezuelan) parole program. In contrast to Mexicans, 90 percent of whom have lived in the United States for a decade or more, most Venezuelans have lived in the country for a decade or less. However, comparisons of administrative statistics with ACS data suggest that these recently arrived immigrants have not been fully accounted for in the U.S. Census Bureau's population estimates (Gross et al. 2024). Newly-arrived humanitarian immigrants may be missed by the ACS—a household survey—because they do not yet have stable housing but nevertheless may respond to a survey like ours (the MCCS) on their phone. In addition to sex and age, we also find substantial sample selection bias regarding education (more college educated).
Immigrant Legal Status Elicitation and Extrapolation
In terms of legal status elicitation, our findings provide reason for caution. Our estimates based on direct questions deviate from reference estimates attained by the MPI for the year 2023. While these estimates are in the neighborhood of available estimates, the deviations are large enough to warrant caution. However, the accuracy of reference estimates is also difficult to assess given that all estimates can only reflect an approximation to the “true” unobserved value.
There may be a host of explanations for deviations in the estimates. First, our survey was based on a non-probabilistic sample. While we can show and adjust for differences in various observed characteristics, there may be unobserved selection factors affecting responses to legal status. Second, deviations may also be related to the mentioned measurement (misclassification) biases regarding immigrant status. Although having previously lived in another country can serve as a good proxy for immigrant status, it invites imprecision as it is not based on country or birth or citizenship and does not consider duration of residence. Facebook/Instagram's classification algorithm remains a black box, limiting the academic use of these data to study population processes. Third, despite the mitigating use of list experiments, potential response biases to legal status questions can still apply and provide a potential explanation for differences in estimates.
With respect to differences across different approaches for eliciting information on legal status (the direct question, stepwise exclusion, and the list experiment), we can show that estimates vary considerably between approaches for Mexican immigrants. We find higher estimates of undocumented migration based on the list experiment compared to estimates attained by the direct question approach, suggesting the existence of a potential response bias due to the sensitivity of this question. The implications of this finding are far-reaching for surveys using direct questions about legal status, as such methods—consistent with our study—likely underestimate the size of the undocumented migrant population. This finding counters other research, which has argued in favor of direct questions (Bachmeier, Van Hook and Bean 2014; Young and Madrigal 2017).
Our findings also suggest that response bias for Mexican immigrants regarding legal status may be larger in the United States than existing evidence based on low-income countries (see Acostamadiedo 2025; McKenzie and Siegel 2013). We also find that the stepwise exclusion approach produces estimates for the Mexican group that are closer to the reference estimate than the commonly used approach of direct questions. For Venezuelans, we do not detect these patterns.
Differences between estimates for Mexican and Venezuelans showcase the difficulty of finding appropriate elicitation methods for various groups who fall into different legal categories. We expected sensitivity bias to apply to Venezuelans as well, which would have appeared as a higher estimate based on the list experiment than the direct question. Our results, however, did not confirm this intuition. We speculate that this is due to the particularities associated with the legal categories applying specifically to Venezuelans, namely TPS and asylum. These two (including awaiting a decision) correspond to formal statuses that grant a (temporary) right to residence, and could make Venezuelans more readily willing to disclose their legal status in a direct question compared to persons from other origin backgrounds who do not have any documentation (e.g., as is the case for many Mexican undocumented immigrants). The percentage of undocumented among Venezuelan immigrants drops from over 50 percent to 2 percent when TPS and asylum are assigned as “documented,” whereas this change has no effect on Mexican immigrants. These findings show how Facebook/Instagram surveys can be a useful tool to test construct and elicitation validity across sub-groups and anticipate potential measurement issues before scaling up in large population surveys.
Taken together, our results suggest that online surveys recruited through Facebook/Instagram are particularly useful to explore important assumptions required for large-scale data collection through large probability samples, such as testing the construct and measurement validity of certain sensitive questions, assessing potential response biases, or examining group-level differences that may inform questionnaire design and sampling strategies. These digital non-probability samples may also be useful to explore new topics within small, “hard-to-reach” and “hard-to-sample” populations rather than producing generalizable population estimates. The demonstrated approach provides a highly cost-effective way of obtaining samples of undocumented immigrants.
Our study faced several limitations. First, budget constraints and blocking by Facebook/Instagram's Ad platform algorithms and user interactions with our campaign led to a premature end of the data collection stage. As a result, we did not attain sufficient sample sizes to investigate differences across U.S. states as initially intended. The original goal was to explore these differences to find out whether population estimates are consistent with reference data across U.S. states and to examine differences in sensitivity bias related to certain states being more migrant-friendly than others. This remains an open question for future research. Second, we lack detailed reference data on the demographics and social media participation of undocumented immigrants in the United States. Such data would have allowed us to design more accurate weights. This shortcoming is difficult to address unless larger, population-wide surveys are better able to elicit information on the legal status of immigrants.
Despite these limitations, we contribute to recent literature by exploring the use of non-probability samples recruited through Facebook/Instagram in times when in-person surveys suffer from historically low participation rates and when the topic of immigration, especially undocumented immigration, is as sensitive as ever. The political landscape in the United States and many other countries has changed the social science data collection context, especially for migration. Future research should assess the extent to which this new political context makes social media surveys less feasible in the future.
Overall, we recommend taking advantage of low-cost Facebook/Instagram surveys for exploring new themes or testing methodological assumptions rather than using them primarily to provide estimates of population sizes. One advantage of our study, however, is that it could be implemented consistently across countries. This would help to validate the method and provide information in countries where alternative methods are not available. Our approach provides an opportunity to contribute to and advance existing estimation methods.
Supplemental Material
sj-docx-1-smr-10.1177_00491241261444957 - Supplemental material for Eliciting Legal Status Through Social Media Surveys Among Immigrants—Evidence from a List Experiment, Direct Question and Stepwise Exclusion
Supplemental material, sj-docx-1-smr-10.1177_00491241261444957 for Eliciting Legal Status Through Social Media Surveys Among Immigrants—Evidence from a List Experiment, Direct Question and Stepwise Exclusion by Jasper Tjaden, Alejandra Rodríguez-Sánchez, Jennifer Van Hook and Hannah Persaud in Sociological Methods & Research
Footnotes
Acknowledgments
We are grateful to Steffen Pötzschke (Gesis) for feedback on the Meta Ad Manager implementation.
Code,Materials,and Data Availability Statement
Data Availability Statement
Data available as part of the replication materials.
Declaration of Conflicting Interests
The authors declared no potential conflicts of interest with respect to the research, authorship, and/or publication of this article.
Funding
The authors disclosed receipt of the following financial support for the research, authorship, and/or publication of this article: We acknowledge funding from the European Commission's Horizon Europe programme. Grant agreement ID: 101061314. Partial support was provided by an infrastructure grant to the Population Research Institute at Penn State University from the Eunice Kennedy Shriver National Institute of Child Health and Human Development (P2CHD041025).
Institutional Review and Consent
We received ethical approval from the Ethics Review Board of the University of Potsdam (decision 41/2024).
Preregistration Statement
The analyses presented in this study have not been pre-registered
Supplemental Material
Supplemental material for this article is available online.
Notes
References
Supplementary Material
Please find the following supplemental material available below.
For Open Access articles published under a Creative Commons License, all supplemental material carries the same license as the article it is associated with.
For non-Open Access articles published, all supplemental material carries a non-exclusive license, and permission requests for re-use of supplemental material or any part of supplemental material shall be sent directly to the copyright owner as specified in the copyright notice associated with the article.