
Abstract
Spatial and temporal scales are essential components of geological sciences; both are almost always imbricated in complex ways, challenging geoscientific knowledge among nonspecialists and students. The present paper focuses on the efforts made by the French naturalist Simon-Suzanne Nérée Boubée (1806–62) regarding popular education on geology. Though Boubée is poorly known nowadays, he experienced some prestige during his lifetime. He worked as an independent teacher, offering private as well as free public courses. Boubée, as a nineteenth-century science popularizer, repeatedly insisted on his disposition for “spreading science for all.” He extensively published books and journals on geology, all aimed at popularizing geological scientific knowledge, considered to be of paramount relevance. This paper analyzes three visual examples extracted from his works: the Tableau Mnémonique des Terrains Primitifs, destiné au géologue voyageur, avec son explication (1831), the Tableau de l’État du Globe à ses différents âges (1832), and the Tableau figuratif de la structure minérale du globe, ou résumé synoptique du Cours de géognosie de M. N. Boubée (1839), supplemented with images from the travel guide Deux Promenades au Mont Doré (1834). Our goal is to understand Boubée’s efforts to synthesize information, scaling down geologic time and space into foldable materials that made geological knowledge cognitively and materially accessible to laypeople.
Introduction
Spatial and temporal scales are essential components of geological sciences; both are almost always imbricated in complex ways, challenging geoscientific learning among nonspecialists and students as pari passu they enhance their knowledge. The present paper focuses on the efforts of the French naturalist Simon-Suzanne Nérée Boubée (1806–62) to translate these complex relationships visually, especially targeting popular lay education in geology. Despite growth in high-quality literature on the history of the geological sciences over recent decades, geological maps and cartography still hold a privileged position in the analysis of visual materials; for this reason, attention to different forms of visual representation (such as those examined in this paper) is relevant.
1
Three visual examples extracted from Boubée’s works, which fit into the broader category of “representational devices” long ago discussed by Barnes, will be considered here: the Tableau Mnémonique des Terrains Primitifs, destiné au géologue voyageur (1831), the Tableau de l’État du Globe à ses différents âges, ou résumé synoptique du Cours de géologie de M. N. Boubée (1832), and the Tableau figuratif de la structure minérale du globe, ou résumé synoptique du Cours de géognosie de M. N. Boubée (1839), supplemented with one of the first travel guides he produced (Deux Promenades au Mont Doré, 1834).
2
Our objective is to understand Boubée’s efforts to synthesize information, scaling down geologic time and space into foldable materials to make geological knowledge cognitively and materially accessible to laypeople. I concur with Scott Montgomery that: The role of images within geologic science seems not merely crucial, but pivotal . . . Translating concepts of the Earth to paper has involved an impulse to visually represent the seen or imagined, not merely for the sake of codifying perception but also for creating a pictorial rhetoric capable of deep persuasion and of revealing otherwise “unseen” or “hidden” relationships that might lead to the discovery of new understanding.
3
Consequently, making a subject visible and turning it into a “scientific” one is no longer simply a matter of illustration or technology, but rather is making knowledge. 4 Boubée’s visual works were produced during the final decade of the period analyzed by Martin Rudwick in his well-known and comprehensive article on the emergence of visual language in geology, a period know as the “formative years of geology” (1788–1840). 5 As Rudwick stated, “material published in the 1830s show a remarkable change: the texts are now complemented by a wide range of maps, sections, landscapes, and diagrams of other kinds.” 6 The present paper will attempt to establish a dialog with Rudwick’s publication, its insights, and its conclusions. I will also consider the only other articles (to my knowledge) that have mentioned Boubée’s charts as of this writing, authored by Nicolaas Rupke, and Renée Clary and James Wandersee.7,8
In the present analysis, I broaden David Spanagel’s conclusions to assume that not only maps but any visual representation “constitute[s] an important form of ideological and rhetorical expression,” always “seek[ing] to persuade, as well as to represent . . . knowledge.” 9 Or, in Jennifer Tucker’s words, “visual representations help construct social ideas of nature, of scientific truth and falsehood.” 10 I consequently argue that the visual materials developed by Boubée embedded his convictions as well as contemporaneous (geo)scientific concepts and were therefore inextricably mingled with his wide-ranging educational project. Moreover, scaling is not just an increase or reduction in size: “useful scaling trades not just on the obvious resemblances in shape but on distortion, both resemblance and non-resemblance being selective in a way dictated by the purpose at hand . . . Representation useful for particular purposes will involve selective distortion, and representation is closely involved with useful misrepresentation.” 11 As I intend to show in the following sections, the two Tableaux in particular make use of (vertical) distortion to boost the visualization of both the spatial relations between rock masses and the thickening of the Earth’s crust – an issue related to Boubée’s expressed commitment to the central heat theory as endorsed by Louis Cordier (1777–1861). However, as it will be seen, Boubée was influenced by other French scholars, such as Léonce Élie de Beaumont (1798–1874), Alexandre Brongniart (1770–1847), and Henri Marie Ducrotay De Blainville (1777–1850), and positioned himself concerning other relevant authors, whether dead or alive, including Abraham Gottlob Werner (1749–1817), Charles Lyell (1797–1875), and Jean Louis Rodolphe Agassiz (1807–73).
Situating Boubée: A minor character in the history of science? 12
Although he is not currently well known, Nérée Boubée was active and experienced some prestige during his lifetime. He was born in Toulouse, France, on May 12, 1806, and died on August 2, 1862, in Luchon (in the same region). Boubée was one of the group that founded the Société géologique de France (SGF) in 1830, and maintained a regular, active presence in its sessions and debates; he also belonged to various other scientific associations including the Mineralogical Society of America, Société d’Economie Industrielle, Académie des Sciences, Inscriptions et Belles-Lettres de Toulouse, Société Linnéenne de Bordeaux, and various other Sociétés Linnéennes. 13 He also founded and managed journals intended to communicate and popularize science, such as L’Écho du Monde Savant (1834–46) and Réforme Agricole, Scientifique et Industrielle. He published extensively in these periodicals, advocating the pivotal role and comprehensiveness of geology and the paramount value of industry and agriculture.
Even if the focus of the present paper is not Boubée’s activities as a science popularizer, a subject extensively discussed elsewhere, it is relevant to briefly present that facet, as it connects to what I am labeling his “educational project.” 14 Boubée is part of a larger group of nineteenth-century science popularizers, people devoted to increasing readership on scientific topics. 15 The preface to Boubée’s book Géologie élémentaire appliquée à l’agriculture et à l’industrie underpins his willingness to “spread science for all”: “It is not only savants, theologians, physicians, archaeologists, geographers, farmers, industrial men who should learn geology with profit; . . . but especially the workers, whose jobs placed them in the field of geological discoveries, who should not remain alien to the useful essentials of this science [geology].” 16 His journal L’Écho celebrated projects for the popularization of science many times, from the very first issue, when it mentioned that the well-known mineralogist and geologist Karl Caesar von Leonhard (1779–1862) was teaching a successful course of popular geology in Heidelberg, attended by an impressive number of workers. 17 Also, one of the several books he wrote was the Géologie Populaire à la portée de tout le monde (1833), explicitly intended for a nonspecialist public. 18
What was the situation in France, especially in Paris, regarding science popularization at that time? Bensaude-Vincent and Rasmussen singularize the nineteenth-century initiatives as mainly focused on the working classes, stating that “what characterizes the nineteenth century are the repeated, multiple, obstinate attempts to expand the public of science beyond the sphere of educated people.” 19 Several authors place between 1850 and 1890 the major boom of this movement in Europe and other countries. Those “pioneers” aimed “to educate the masses, keep them informed of progress, satisfy their curiosity, amaze them, entertain them and even, in some cases, allow them to judge or sanction science.” 20 In short, that was a political issue that reverberated as a vast project of popular education underway in France since the eighteenth century and that found a privileged medium in the press. 21 From 1830 onward, public discussions concentrated on the advantages of an informed and educated workforce. Furthermore, the solid audience that attended the public and popular lectures proves the growing interest in science and technology of the industrial classes. 22
Sciences played a central role in these debates, which almost paradoxically brought together monarchic philanthropists, Saint-Simonians, and followers of Proudhonian anarchism. 23 Boubée was in tune with that atmosphere; however, his project seems to precede the so-called “major boom” of popularization. As Alex Csiszar demonstrated recently, in France, “a cadre of writers actively took on the title of vulgarisateur (populariser) as a professional identity. Many, like François-Vincent Raspail and Charles-Frédéric Saigey in the 1820s, had come to Paris from the provinces and taken up journalism . . . They were quicker . . . and made vulgarisation into their specialty.” 24 Nérée Boubée, who came from the provinces, must definitely be included in that list. Boubée’s commitments to broader popular education, the valorization of workers’ knowledge, and the praise for women’s education and their scientific activity, all present in the pages of L’Écho, were aligned to contemporary comprehensive political and social movements. As put by Béguet, “the dissemination of scientific knowledge is part of an encyclopedic and emancipatory project for workers . . . Popular encyclopedism is still close to its theoretical sources, whether it is Comtian thought or the diffuse Saint-Simonism which permeated the entire French labor movement before 1848.” 25
Boubée presented himself as “Professeur de Géologie à Paris” on the title pages of his books, but no indications of institutional affiliations with any mainstream educational institutions in France or abroad have been found thus far. Most likely, he worked like many others as an independent teacher, offering private as well as public courses. However, starting from December 16, 1834, Boubée did teach geology twice a week at the Athénée Central, a recently created educational establishment. 26 Despite significant research efforts, it is not yet clear whether Boubée received a formal education; he certainly spent some time working at the Muséum d’Histoire Naturelle (MHN) with De Blainville, the noted zoologist and professor. After this training, Boubée pursued a similar apprenticeship in geology and mineralogy with the renowned Alexandre Brongniart (1770–1847), though unsuccessfully. 27 At the MHN, Boubée may have audited courses at different institutions, such as the Conservatoire National des Arts et Métiers, the Sorbonne, or the Polytechnique (the latter two were geographically very close to the MHN at that time, a fact that might have facilitated his circulation), as an auditeur libre (free listener), which was relatively common for French people as well as foreigners. 28
Nérée Boubée published significantly on geological subjects and was quoted (by contemporary authors and posthumously) in journals such as the Annales des Mines, where he is first mentioned in an 1834 article. Moreover, his links to and active participation in the SGF and other scientific associations were not negligible, placing him within French scientific circles. As stated by Corsi, “the French Geological Society saw amateurs and professionals interact on an equal footing . . . In Paris, merchants of fossils and naturalia were members of the society, and lost no occasion to talk about fossils they had collected or had in their shops, as did Nérée Boubée and Louis Saemann.” 29
Nevertheless, although Nérée Boubée was indeed a “merchant of fossils and naturalia,” this commercial activity was just another facet of his professional existence. He did start a natural history supply house early in his life in the small town of Saint-Bertrand de Comminges; it later moved to Luchon (both near his hometown, Toulouse) and finally Paris in 1845. In Paris, he partnered with his future brother-in-law (the naturalist Arthur Éloffe) in a shop that dealt in rocks, minerals, fossils, plants, and so forth. From his youth, Boubée had accumulated numerous collections, including entomological and mineral specimens, which formed the backbone of the shop’s natural history trade. Éloffe & Cie. also became a publishing house that printed a significant portion of Boubée’s plentiful works, starting in 1845. However, before Éloffe & Cie. began to function as a publishing house, Boubée’s works were published and sold by respected publishers and bookstores such as Levrault, Vieusseux, and Hachette. These establishments also featured works by Alexandre Brongniart, Élie de Beaumont, Georges Cuvier, and other distinguished scientists, suggesting the quality of Boubée’s scientific production.
Seen as a whole, Boubée’s initiatives indicate his endeavors to live a worthy life and carve out his own place in the academic world.
Boubée’s educational project
Boubée’s publications and his own words depict his general, comprehensive, and even ambitious geological education project. Several of his publications contain (in complete or abridged versions) the plan for his Cours Complet D’études Géologiques par ses Leçons Élémentaires et par des Voyages, which encompassed the visual materials that are the focus of the present article, a set of books, and some relatively complete travel guides for fieldwork. An updated version was presented to the SGF in 1833 and was praised by Ami Boué (1794–1881) in his report on progress in geology during that year: This well-executed study plan will have more advantages to offer to each one, at a low price, the parts of geology that please him the most and allow the author to place next to elements of science the most in-depth discussions. As regards the formation of collections of rocks and fossils, to itineraries and the teaching of mineralogy and geology in the open field and on trips, I have already said elsewhere that it is not too much to encourage these modes of instruction; and I am even convinced that the time will come when chairs will be opened in Paris and elsewhere, for people engaged in this kind of teaching. To M. Boubée, we owe its introduction in France, although it had already been employed before him at the old school of Moutiers by M. Brochant [de Villiers] and in Scotland by M. [Robert] Jameson.
30
Amos Eaton (1776–1842), another example of a performer of “these modes of instruction,” was mentioned by Boubée himself: “The example of Mr. Boubée is already followed in America by Professor Eaton, who has just instituted, for his pupils, trips of one to two months; but it costs 35 francs a day for each traveler.” 31 A parallel can also be seen in Henry De La Beche (1796–1855), who authored his first textbook in 1824 and shifted the focus of his publications in the 1830s to “a ‘generalized’ educational approach . . . with these texts utilizing wood engravings for illustrations.” 32
The details of Boubée’s educational plan are worth describing, mainly because the visual materials under scrutiny in this paper had educational goals. The pamphlet announcing the third edition (for the third year of his courses, the calendar year 1832) states that his intention was to “unite and merge in a single course the study of geognosy, mineralogy, conchology and the various branches of paleontology, taking from these sciences only what interests geology, and following no other system, or classification than that of nature and its successive formations.” 33 In 1849, the general project was emphasized, having evolved to “All the works on geology composed by M. Boubée relate to a general plan, and must contribute to forming together his COMPLETE COURSE OF GEOLOGICAL STUDIES BY LESSONS AND BY TRAVEL. This Course will consist of 16 vol. in-8°, 10 vol. in-18, an atlas of 9 large in-fol[io] tables, and a large geological map in 4 sheets” (emphasis in the original).34,35 The predominant size of the materials – mostly small or minimal in the case of the books – indicates, in my opinion, an attempt to make them portable and, therefore, easy to be carried and read with no need of a particular place like a reading room, thus reinforcing Boubée’s popularization strategy.
The teaching methodology combined theory and practice, presenting the content following the geological timeline, from oldest to youngest formations, and was intended to adapt to the requirements of the teaching–learning process: Mr. Boubée proposes to study and recognize, from the many samples he puts in the hands of his students, the various rocks of each of the sites of the geological time scale, starting with the oldest. Then, as soon as a site is known, he has the minerals found there, the shells and other fossils that characterize them, studied in the same way . . . He exposes the principles and generalities of these sciences as the study of the various objects presents their application or makes their importance be recognised.
36
On the other hand, although he defended the importance of facts and field-collected data, he was also critical of the Géologie Positive (Positive Geology), advocated mainly by Constant Prévost (1787–1856), and also well accepted by distinguished members of the SGF.37,38 While reviewing the book Études sur les dépôts metallifères, authored by the metallurgist and geologist Jean-Baptiste Xavier Fournet (1801–69), he made himself clear, though not citing names, on the absolute relevance of the “theory” always going together with “facts”: We could only blame the same thing which should be addressed, in general, to all those works produced by current geologists: lack of order and a clearly defined framework. The first cause of this defect, so general today, is not the essentially false, dominant idea in the practice of physical and natural sciences, that the only observation of new facts is what must become profitable to science, and that the inductions of reasoning cannot have any value or merit any confidence?
39
The various publications indicate that the course structure remained almost unchanged during the time it was offered. The original proposal spanned eight volumes, an atlas with nine visual charts in folio, and four itinerary booklets for the travels and fieldwork. 40 By 1833, the following materials had been published and were available for purchase: the book Géologie Populaire, the Tableau Mnémonique des Terrains Primitifs, destiné au géologue voyageur, avec son explication, the Tableau de l’État du Globe à ses différents âges, the collection Recueil d’Itinéraires en France, and Promenades aux environs de Paris, celles d’Auvergne et celles des Pyrénées. Another book was also in press at that time, the Cours abrégé de géologie destiné aux gens du monde. The complete printed course was available for an annual subscription of thirty francs. However, one could also subscribe to only selected parts: “everyone [can] choose the section of science that they especially want to study, without spending a lot of money on parts of books that could be useless for them.” 41 Customers could also choose the printing paper (ordinary or vellum) and picture type (black and white or color). However, color images were encouraged because, in geology, “the colors designate the different terrains.” 42
Boubée himself admitted that such a heavy courseload would not be easy to follow, and “customized” it by splitting it into several parts, Boubée stated: [Mr. Boubée] will bring together in a first section all that relates to the technological study of geological sciences; that is, the special study of rocks, of minerals, of various characteristic fossils; in short, anything that serves as a basis or evidence for positive geology or “geognosy.” The second section will bring together all that relates to the philosophical study of science, or “geology,” that is, the discussion of the major theoretical ideas and their consequences, which flow from these bases and from the more meticulous examination of the most important facts.
The two branches of the course were housed in different locations even though they were taught in parallel in two-hour sessions twice weekly, plus two extra classes on Sundays. The geognosy section was held at Boubée’s home in the Quartier des Écoles (at Rue Guénégaud 17), where the Sorbonne, École de Médicine, and Polytéchnique were located, since it was specifically directed at “those who want to study science.” The geology portion was taught downtown (no specified location) and, among other topics, discussed whether the Bible was in accord with geological facts. Boubée clearly favored the harmony thesis, 43 although he strongly criticized “mosaic geology.” He admitted a long geological time span in all of his works, about 300,000 years, taking the seven days of Creation metaphorically. Indeed, he states that “the five days before the creation of man, of which Moses spoke must be considered five major epochs, each one longer than ours.” 44 He continues, affirming that this equivalence does not contradict religious beliefs because theologians approve it, having in mind that in Hebrew the word for “day” also means any duration of time. 45 Such a conception was common to the group of Christian scientists who intended to harmonize Genesis and geology, such as James Parkinson (1755–1824), John Kidd (1775–1851), and Gideon Mantell (1790–1852) in Victorian Britain, and Edward Hitchcock (1793–1864), Amos Eaton (1776–1842), Benjamin Silliman (1816–85), and James Dana (1813–95) in the United States. 46 In short, Boubée differentiated the biblical flood from the geologists’ deluge. Therefore, he was in the group of naturalists who saw no conflict between a long-lasting history of the Earth and the creation stories in Genesis. 47
Each branch of the course was subdivided into two additional parts, a “winter course” and a “summer course,” the contents of which varied according to the feasibility of fieldwork on the different formations. During summer, students focused on the oldest formations (“terrains primitifs”) because the autumn was considered better suited for outings to mountains like the Pyrenees to see rocks in situ: “practical knowledge can only be obtained in natural history by freely seeing and touching objects.” 48 Meanwhile, winter fieldwork was to be done in the vicinity of Paris, “naturally” stimulating the study of Cretaceous, Tertiary, diluvium (Pleistocene), post-diluvium (Quaternary), and volcanic formations – all of which constituted the area. 49
At the same time, Boubée emphasized practice and direct contact with nature. He nevertheless conceived practice and theory as being intertwined and interdependent, praising the generalization of observation aimed at establishing large groups and systems. While reporting the course on “Geology” taught by Élie de Beaumont at the Collège de France, Boubée wrote: We see that the description of the earth’s crust, which is the task of the geologist, consists much less in describing the rocks which occur in a country than in bringing together these rocks by groups, by terrains, in order to make known the mutual relations which take place between them in each locality, and the general relations of the groups which they form with the systems of analogous rocks observed and described in other places.
50
In short, Boubée was offering à la carte geoscientific education to anyone who was interested, tailoring the layout and price to the audience’s schedule and economic means. Each course cost sixty francs, or thirty-five francs if paid per month, but those purchasing both courses got a discounted price of 100 francs. The complete course, including a field trip to the Pyrenees (but excluding lodging, food, and personal expenses), amounted to 600 francs.
The materials and their visual contents
The pamphlets and inserts advertising Boubée’s courses presented the routes for each expedition, detailing the towns, villages, and dates of arrival and departure. They ranged from the Calvados and Bretagne areas to eastern France and the Midi, but one destination remained constant: every year, Boubée offered a trip to the Pyrenees, each time following different itineraries. The purpose of these trips was twofold: to conduct the fieldwork for his research while simultaneously teaching his lay geology students. The Auvergne, more precisely the Mont Doré, was the first stop, to investigate whether this geological/geographical feature was a crater of elevation. This interpretation had been defended by Léonce Élie de Beaumont and challenged by Louis Cordier during a controversy held at the SGF. The booklet that served as a field guide contains four watercolor pictures intended to clearly portray the main aspects of the landscape and assist in identification during fieldwork. Such an option adopted by Boubée is an excellent example that, “with effective illustrations, the author can present absent scenes or objects that allow the viewer to perceive the original object or data.”
51
The other function of these images was to explain, through visual schemes, how such craters formed and compare them to Mont Doré. As Fraassen reminds us, Use enters the very concept of representation: to be a representation is to be something used or taken to represent something. But in addition, “representations have their uses”. They are typically produced for a certain use, with a certain purpose or goal . . . The activity of representation is successful in that case only if recipients are able to receive that information through their “viewing” of the representation.
52
Hence, the use of these images was twofold: they primarily aimed at depicting the landscape and the geological feature allegedly considered to be a crater of elevation; secondly, in so doing, they required the readers to position themselves regarding the controversy. The first image (Figure 1) contains a double cross-section depicting a theoretical example of a crater of elevation at the top, with a theoretical section of Mont Doré below. For readers unfamiliar with geoscientific knowledge and practices, a clarification is needed: a “geological section is a highly theoretical construct. It is a kind of thought-experiment, in which a tract of country is imagined as it would appear as if it were sliced vertically along some particular traverse of the topography and opened along that slice . . . However plentiful the evidence, the section inevitably embodies extrapolations derived from theory-based expectations.” 53 As a pedagogical strategy, Boubée first showed the ideal example, immediately followed by his “thought experiment” – his own interpretation of the structure of Mont Doré as a crater of elevation. This illustration may be categorized as an “inferred representation,” in other words an image that shows aspects that are not directly observable. 54
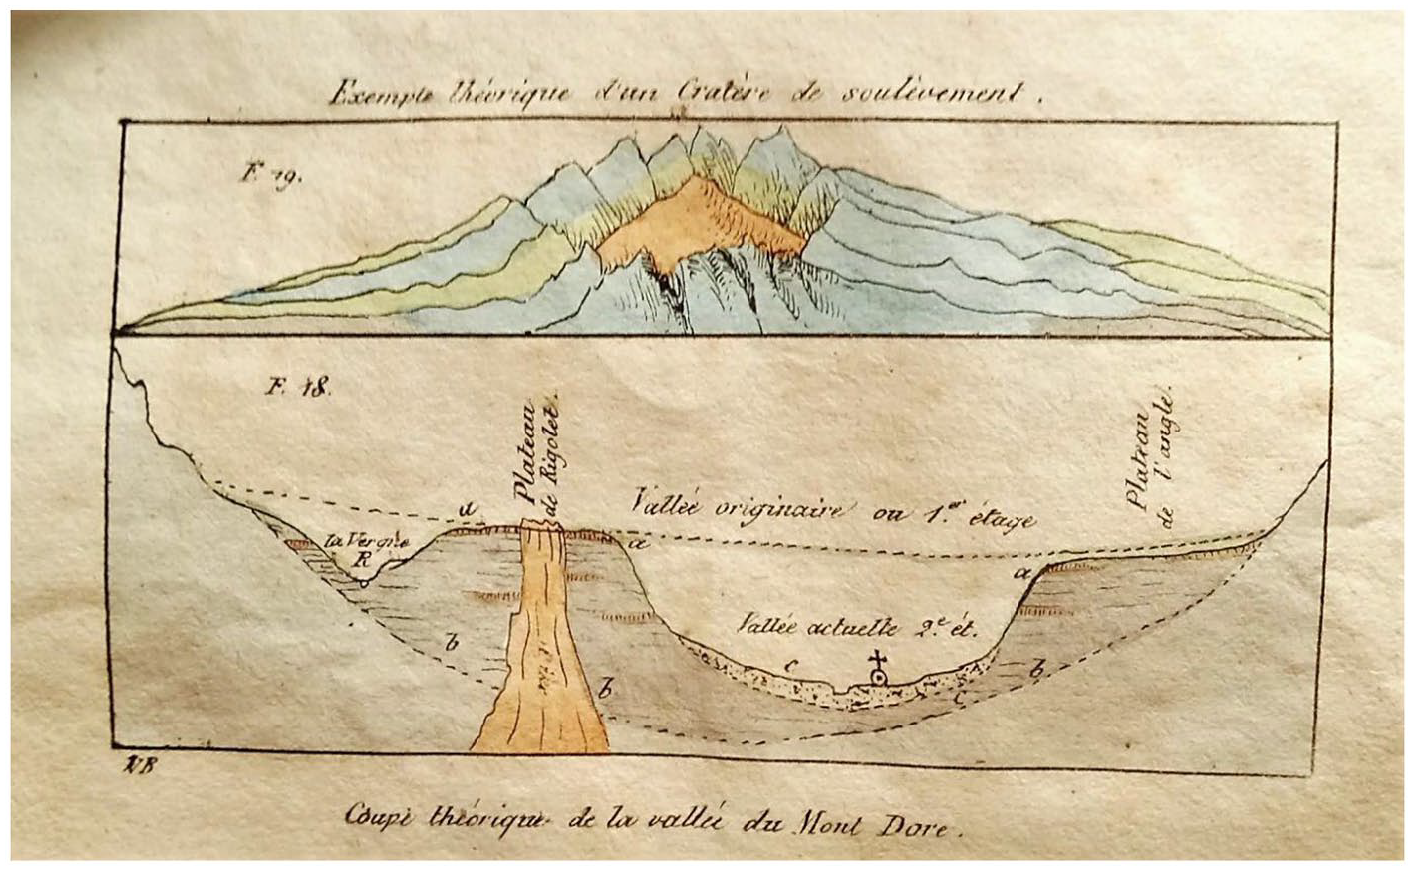
Theoretical example of a crater of elevation and theoretical section of Mont Doré (Boubée, 1833, s/n).
The three other illustrations are pictorial representations of the landscape and specific features Boubée considered worthy of emphasis. Figure 2 depicts the Mont Doré Valley, with a color key and a few superimposed words that may be classified as a “labeled proxy,” meaning a pictorial representation with superimposed information. 55 A sense of scale is provided by the addition of a village in the bottom left corner.
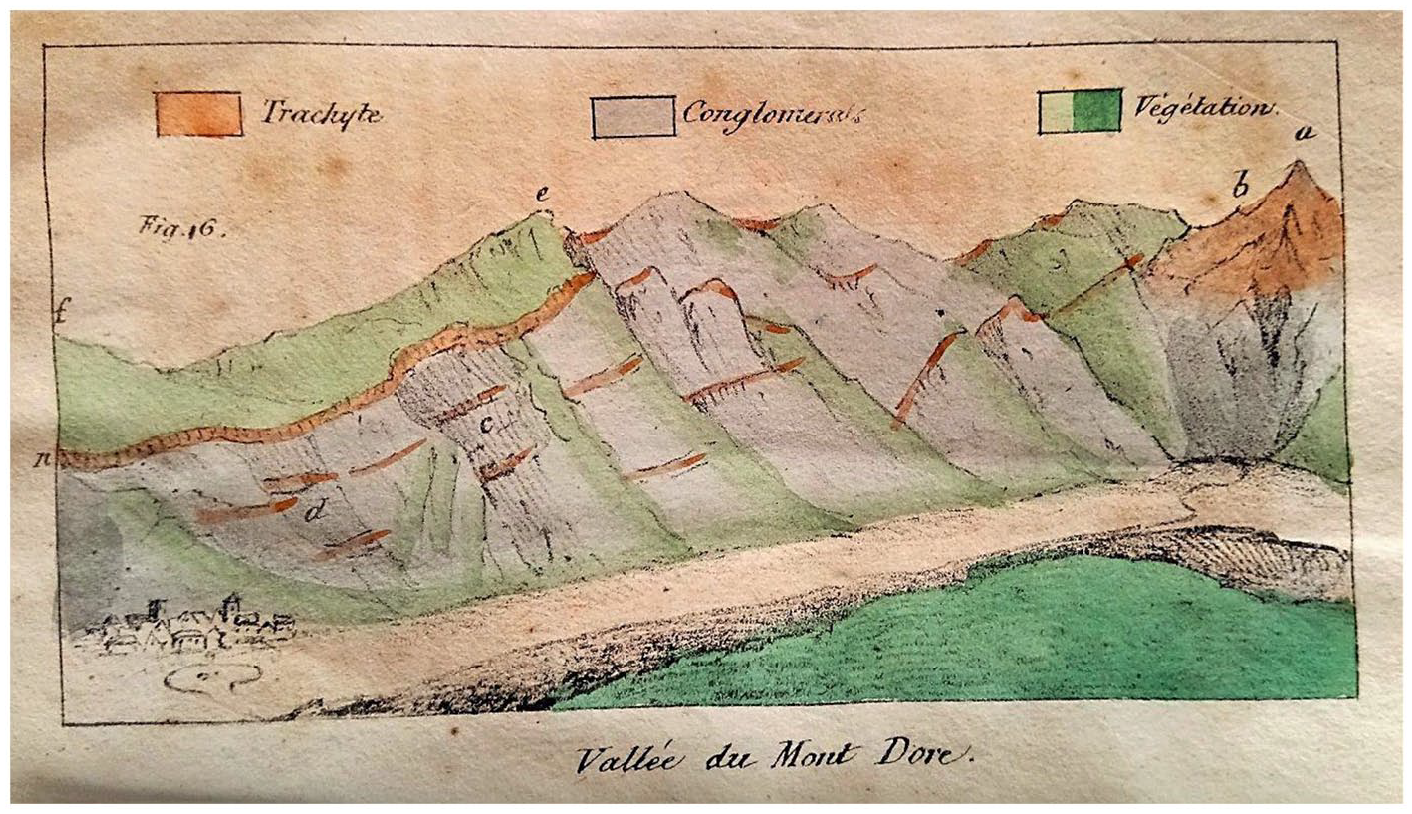
Valley of Mont Doré (Boubée, 1833, s/n).
Figures 3 and 4 (below) portray a trachyte dike and vein, both “proxy” images; in other words, they are pictorial representations, similar to a photographic snapshot. 56 Again, a visual scale reference is provided in Figure 4 by natural elements, in this case, pine trees.
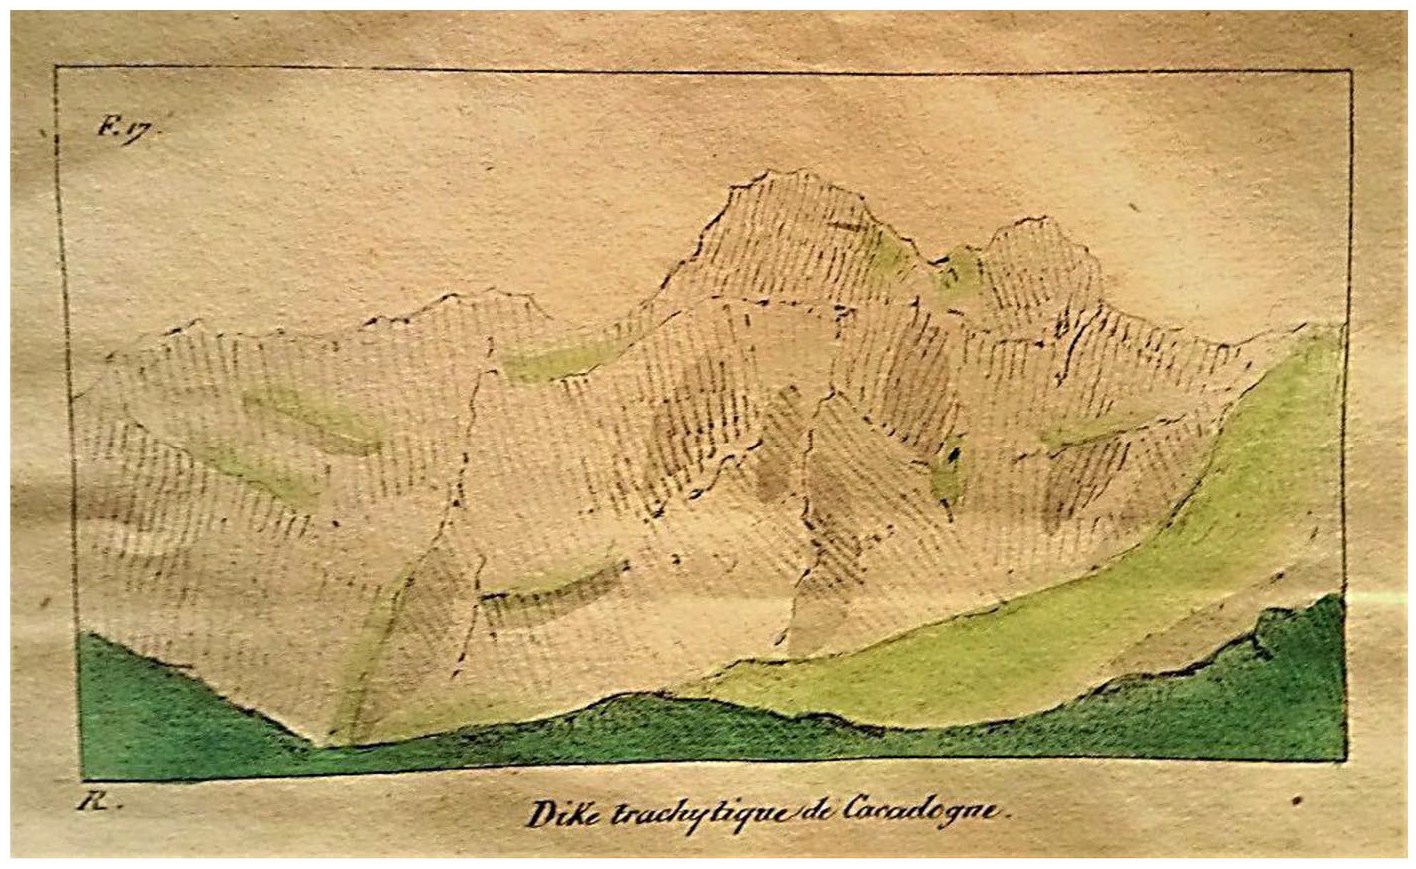
Trachyte dike at Carcadogne (Boubée, 1833, s/n).
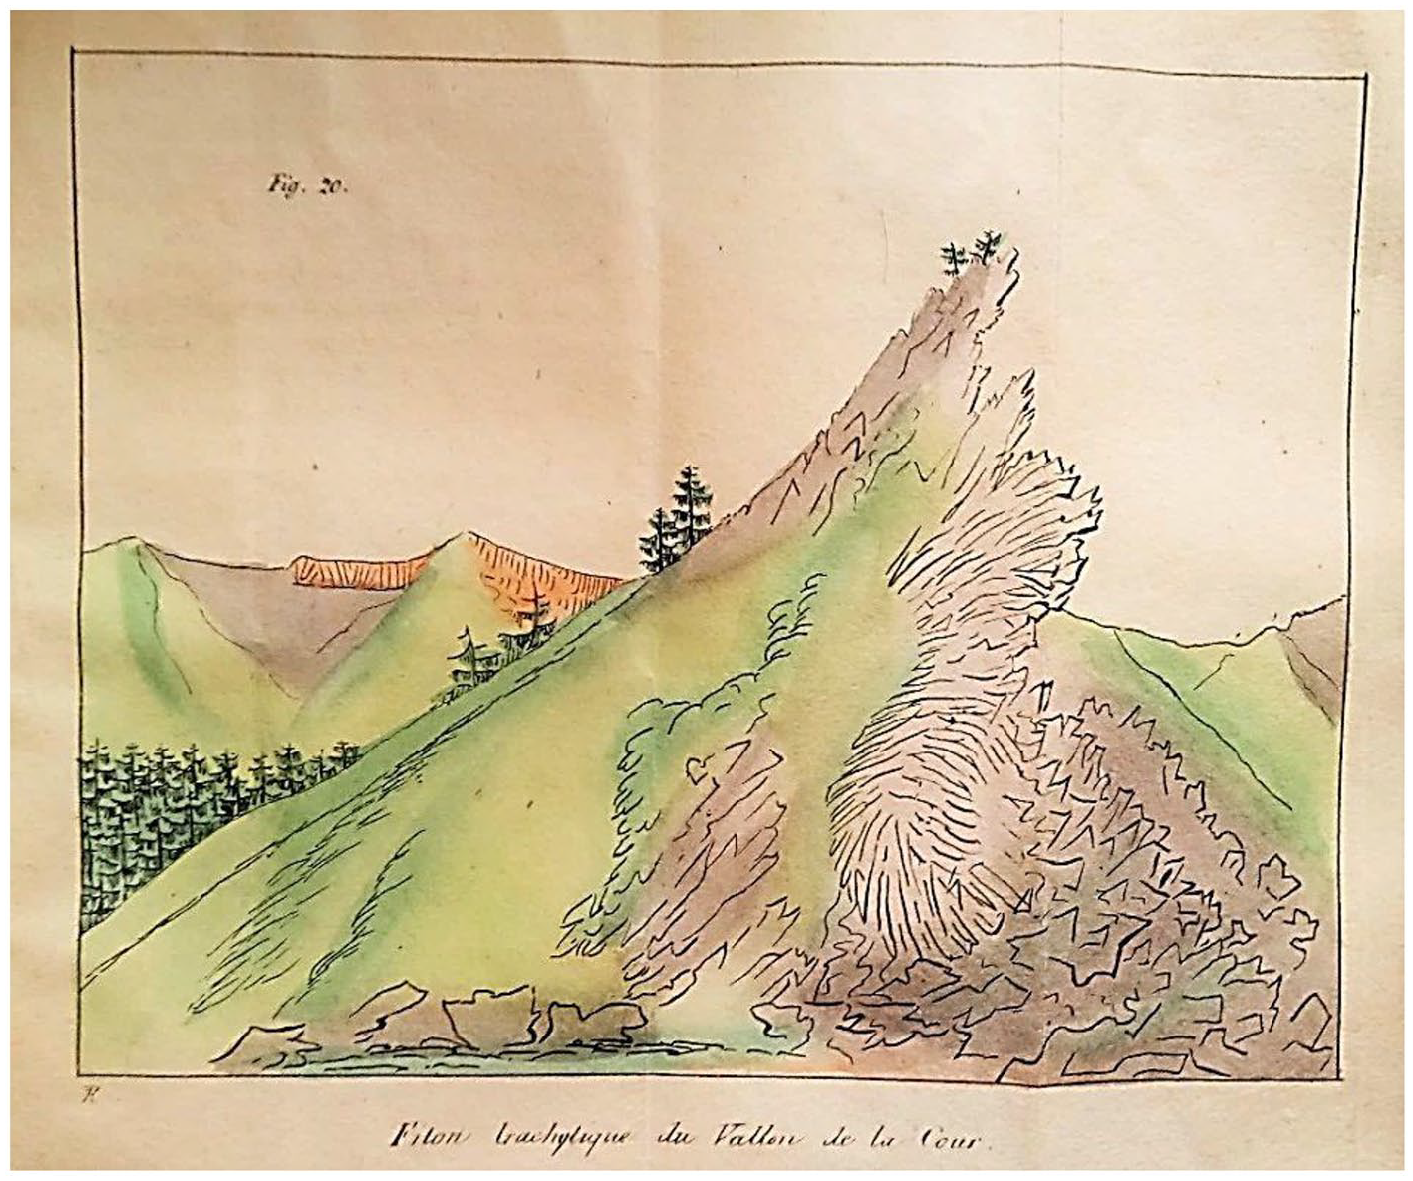
Trachyte vein at the valley of La Cour (Boubée, 1833, s/n).
Of these three images, Figures 2 and 4 are particularly good examples of the process identified by Montgomery in the mid-1820s, when “the conventions of landscape and those of the geologic map and section have been completely merged, with the naturalism of lithologic reality taking center stage . . . The function of [the] illustrations is to create true geologic ‘specimens,’ to persuade readers of observational accuracy and comprehension.” 57 Considering that these images were included in a travel guide containing an itinerary that specifically addressed a controversial issue (whether Mont Doré was a crater of elevation), I assume they were explicitly selected and inserted to clarify the point for travelers and students, thus operating as an element of persuasion to them.
The Tableau Mnémonique des terrains primitifs
The booklet entitled Tableau Mnémonique des terrains primitifs, destiné au géologue voyageur, avec son explication meant to explicitly support fieldwork and education. It appeared as early as 1831 and was orally presented at the SGF meeting of May 16, 1831. It was comprised of a one-page diagram (Figure 5) followed by eight pages of explanation, with examples from different French regions where “primitive terrains” were found. The diagram was intended to summarize the history and theory of these formations, scaling them down into a visual, portable, and workable format in a handy version that could be quickly consulted by students as well as traveling geologists or naturalists. A short explanation on the front page described its usefulness: “Fewer than thirty words recall, by their simple arrangement, the whole history of the primitive lands, and present the various systems and natural cuts observed in this great formation.”
58
Emphasis was added to the text by Boubée to highlight that the visual display was not haphazard but rather a vital part of the conceptual framework. The practicality of the visual device was reinforced in the conclusion of the explanatory text, perhaps based on Boubée’s own experience conducting fieldwork in an area as complex as the Pyrenees: If I desire such an assemblage, it is not to make a new system; it is only to diminish and even destroy, since it is possible, the darkness and the confusion which reign about the primitive terrains; obscurity which results from the fact that there is nothing decided, nothing decisive, and that the young geologist always sees the same thing in seven to eight formations where he is forced to find differences.
59
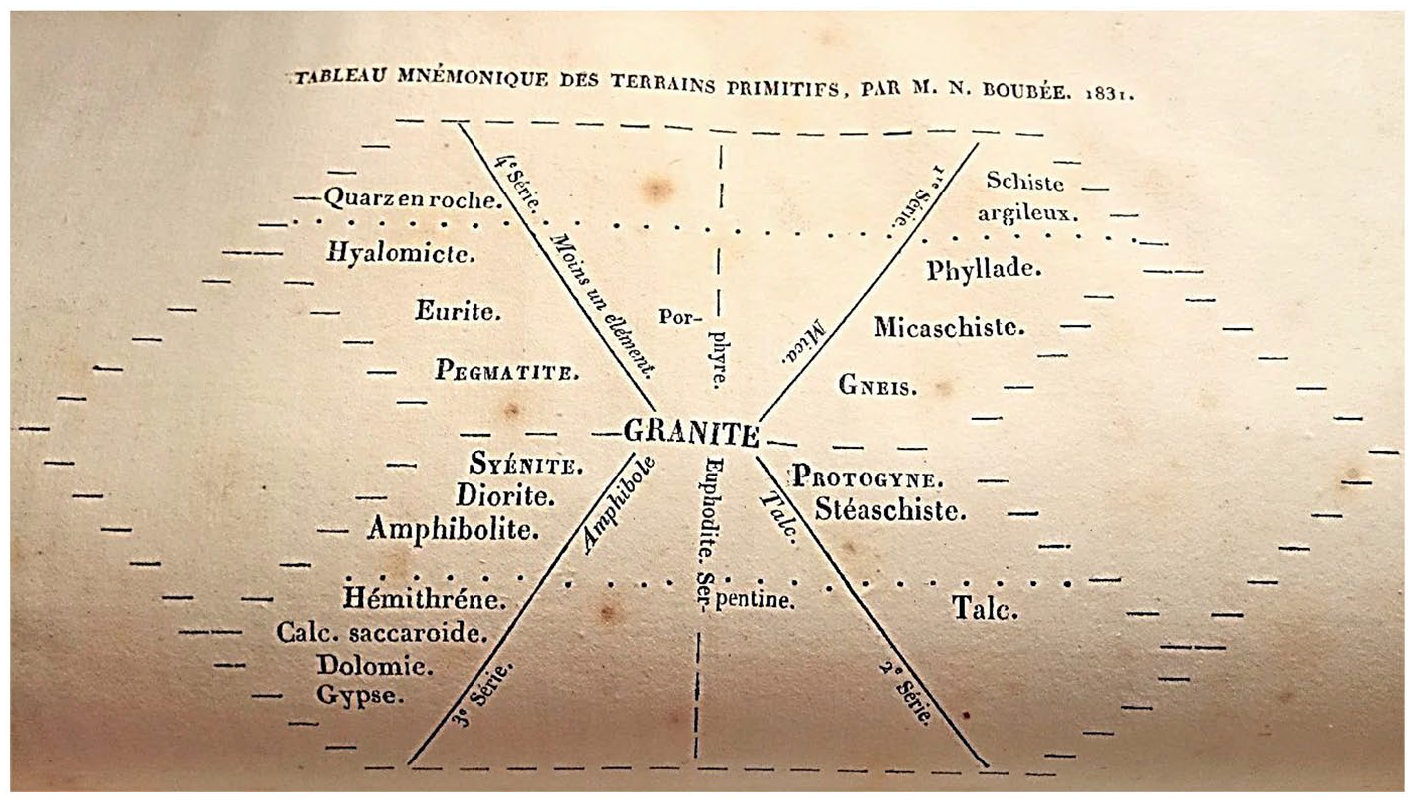
Tableau Mnémonique des terrains primitifs (Boubée, 1831).
Behind its apparent simplicity, the image is a sophisticated, nontrivial representation of an embedded theory, supported by his field-based evidence and a bibliographical record, as shown in the explanatory text: “These groups of rocks thus formed may at first seem very artificial, but it is during travels that we shall recognize how much they represent nature . . . Thus, to cite examples only among those that I have seen. . ..” 60 Here, again, it is clear Boubée emphasized fieldwork and direct contact with nature, as well as his own knowledge and practical experience.
The graphical arrangement of the rock types and their corresponding minerals is derived from and enhances the centrality of granite as the most relevant rock comprising the basis of primitive formations, in accordance with the widely accepted theories of the time.
61
At the same time, the diagram utilizes an idea of mineral paragenesis by arranging the rocks and minerals along four axes that each represent a distinctive series of rocks based on the presence or predominance of a specific mineral (namely, mica, talc, amphibole, and single-mineral rocks). The spatial sequence moving from the center (granite) to the extremities of each diagonal line represents each mineral’s decreasing compositional affinity with granite, as well as shorter or longer proximity of occurrence in the field. However, the fact that all four are shown on the same page surrounding granite implies a synchronic temporal scale, meaning they all could occur together, distancing Boubée from strict Wernerian stratigraphy. “Wernerian stratigraphy” was the spatial-temporal sequencing of rocks based on Neptunism, developed by Abraham Gottlob Werner, professor at the Bergakademie Freiberg, which proposed a fixed ordering of rocks deposited during the Earth’s history, namely: granite (the oldest), gneiss, micaceous schist, argillaceous schist, primitive limestone, trap, porphyry, syenite, serpentine, topaz rock, quartz rock, siliceous schist, floetz rocks, transition rocks, volcanic rocks, and alluvial rocks.
62
Although granite was at the basis for Boubée, it was not formed before the other “primitive” rocks, as it was for Werner. Moreover, the sequence of rocks he proposed did not follow the Wernerian one. As he explained, The purpose of this Table . . . is to express that the “granite” forms the basis of the primitive grounds, that the four rocks which surround it, and which are only the most immediate modifications, are found with it subordinate in the masses, and that there is no reason to place one of them the first or the second, but that they can be all four contemporaries, and of the same formation; in short, that they are parallel in nature.
63
Moreover, the dotted line implies another spatial scale, indicating that the rocks listed above it should occur in the upper levels of the formation: “the rocks which come after (up to the dotted lines) although they can also be found subordinate in the granite, they nevertheless considerably move away from it, and shall, therefore, be more frequently found in the upper part of the ground.” 64 Unlike stratigraphic columns or sections (even if they represent “average” or “generalized” areas), Boubée’s Tableau Mnémonique des terrains primitifs is not a circumscribed, specific illustration of a geological setting, but instead is presented as a far-reaching, “universal” geological representation of a certain type of formation. Through the generalization of the phenomena, a pedagogical approach then adopted by Boubée and still familiar today, the “use” of this visual device could, therefore, be highly valuable for learners.
When SGF Secretary-General Jules Desnoyers (1800–87) read the report on the Tableau Mnémonique, he raised some critiques but recognized its practical utility: With the current tendency of geology to consider, as porphyries, granites and other so-called primordial crystalline rocks as being both effusion rocks and igneous origin, and as having arisen at several times even from secondary terrains, it seems not easy to fix yet a proper grouping of these rocks which is of a practical application; M. Boubée’s graphic summary may, however, have the advantage of helping memory and showing the most usual relationships of these crystalline deposits.
65
Furthermore, one also knows that, as early as 1831, Boubée intended to publish other Tableaux Mnémoniques in order to “reduce pretty much all geology into little tables . . . to serve as a summary.” 66 His scientific production was in tune with Humboldtian science, a significant component of the study of nature in the nineteenth century, which “was characterized by a preoccupation with the spatial distribution of natural phenomena . . . The interest in spatial relations went hand in hand with their visual representation.” 67 However, this project, sadly, was never completed.
The Tableau de l’État du Globe à ses différents âges
The complete title of this visual device is practically self-explanatory: Tableau de l’État du Globe à ses différents âges, ou résumé synoptique du Cours de géologie de M. N. Boubée. In other words, it was envisioned to depict the state of the Earth along with its history, thus initially embedding a temporal scale. It also was a graphical synopsis of one of Boubée’s courses, the already mentioned branch dedicated to geology, as well as an educational support device. Its publication was announced for the period of March 12–15, 1832, 68 and must have occurred because three subsequent editions were published that same year with some improvements as a result of “the progress of science having demanded many additions and important changes in the Table.” 69 Another indication of its success is the fact that a simplified and smaller version illustrated all the editions of his book, the bestseller Géologie élémentaire appliquée à l’agriculture et à l’industrie, starting from the first in 1833, as well as its translations. 70
The Tableau was lithograph printed on vellum or woven paper measuring 67.5 cm long and 51 cm high (roughly 26.6 × 20 inches), more or less the size of a writing desk, which made it large enough to show details while keeping its size manageable. 71 About half of the space was filled with text, a summary of the critical points intended to answer what Boubée considered the two “big questions” at the heart of his courses and the Tableau: 1. When and how was the world created? 2. What has happened to the Earth from its creation to the present day? He was clearly interested both in natural philosophy and natural history issues. The Tableau was a foldable and portable course with a powerful visual representation of the changing Earth that could be accessed whenever required. The fact that the Tableau was published two years before the book that was written to develop its rationale reinforces that it was conceived as educational material, a practical summary that was easy to carry and cheap to buy (prices ranged from 1.5 to 7 francs, depending on the paper quality and support utilized). Also, as Boubée himself stated, the Tableau was very suitable to “decorate a working office; its frequent view fixes all science clearly in mind” (emphasis added). 72 Besides esthetics, this statement reveals the importance Boubée attached to images and visualization, which are at the core of geological sciences, in the process of learning this content, even (or especially) by nonspecialists. It also allows us to infer a tiny part of his pedagogical views – that is, the “fixation” of contents as a way of learning.
The Tableau de l’État du Globe portrayed a colored, theoretical, and in-depth cross-section of the Earth’s crust, the material underneath it (currently known as the asthenosphere/upper mantle), and the atmosphere above, illustrating how they changed over 300,000 years of geological time, which in turn was subdivided into four epochs (Figure 6).
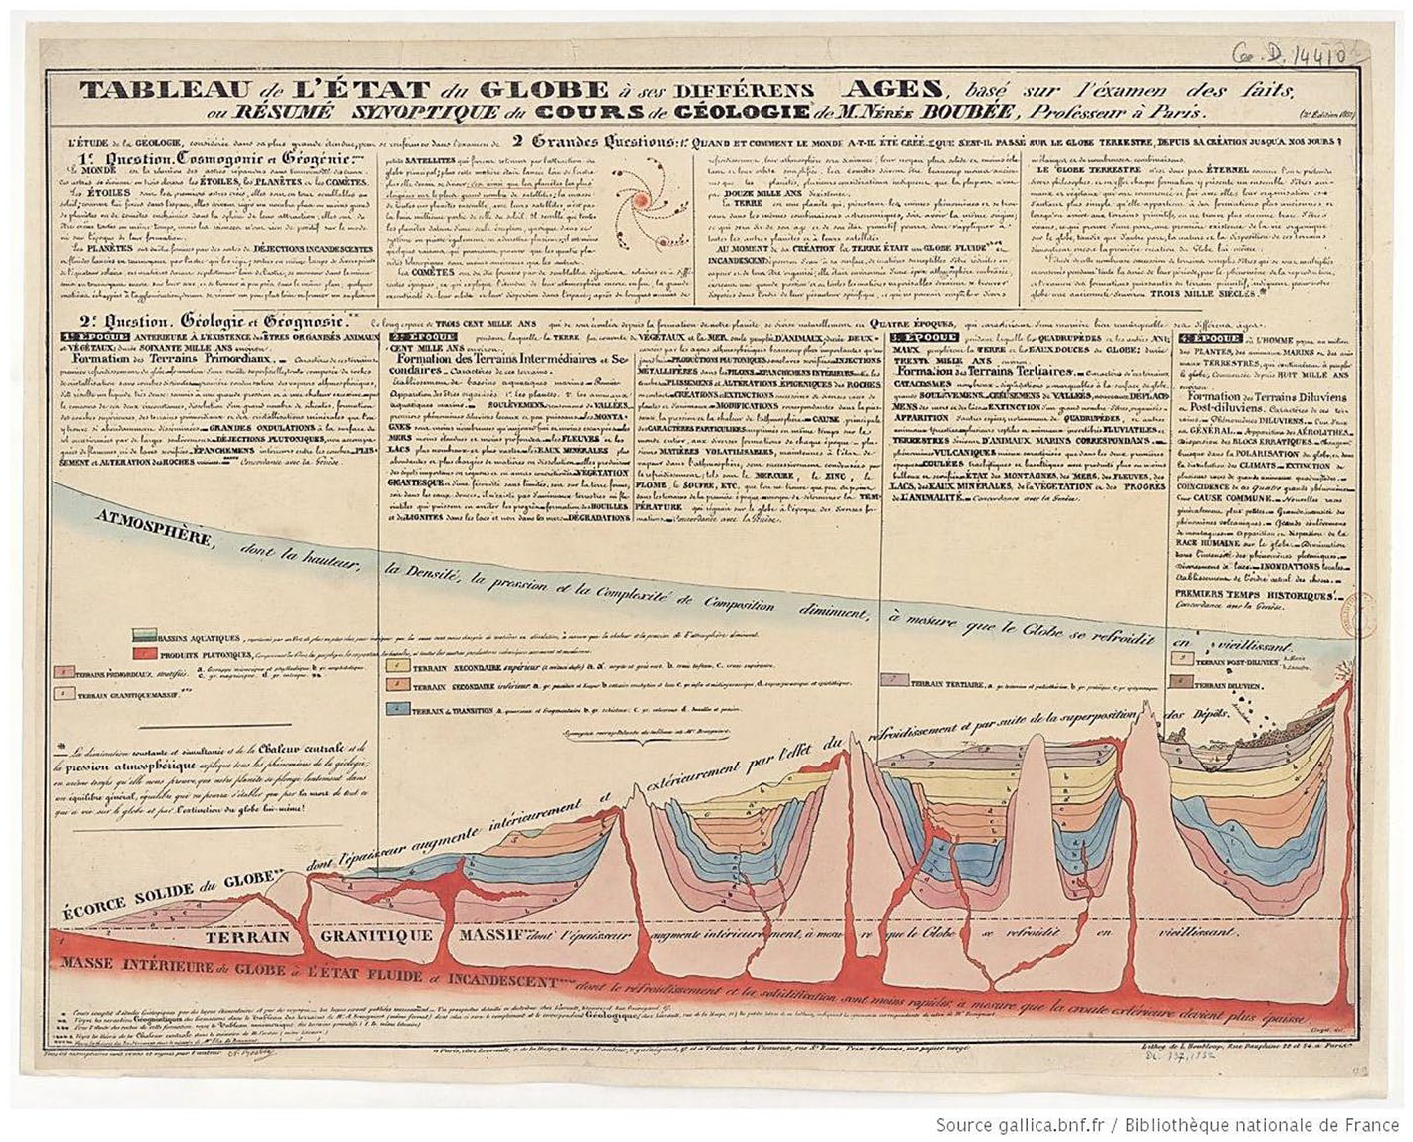
Tableau de L’État du Globe à ses differents ages (Boubée, 1832).
The horizontal axis represents the temporal scale, expressing a directional view of the Earth’s history. For Boubée, “geology is the science of the history of the terrestrial globe; of what was, of what is, of what shall be.”
73
For him, the Earth had a “future life,” expectable through the natural laws of geology. However, he did not share the rigid Lyellian uniformitarian view, as for him, there was no possibility of return to a previous situation: the directionality entrenched in the Tableau is evident. Instead, he aligned himself with the French methodological notion of causes actuelles. The French scientists who founded the SGF did not support the strictest uniformitarian deductions and conclusions advanced by Lyell on the intensity of the geological phenomena since the start of the Earth.
74
Even if he admitted cataclysms and catastrophes, Boubée was not a “catastrophist”; I affirm that his uniformitarianism had a more methodological nature, similar to several of his contemporaries. Explaining the above statement in the book that accompanied and enlarged the Tableau, Boubée affirmed: The knowledge of the current state, the observation of the progress of the phenomena, and the precise notions of the physical laws which govern the globe, allow us well to predict, as a rigorous conclusion, what it will have to be; but if unforeseen cataclysms occur, if the problem becomes complicated by new and unexpected data, our forecasts, although regular, could be inaccurate; this is why we cannot say that geology teaches what the globe will be after us, but what it should be, assuming that the general laws of the world will remain as we know them today.
75
The vertical axis of the Tableau combines both temporal and spatial scales as the images showed the stratigraphic sequence of rock strata infilling the basins, together with igneous intrusions. The vertical distortion is evident, projected to make more explicit the thickening process, besides keeping the image within acceptable dimensions. Boubée’s task was made easier because he took advantage of the fact that, by the early 1830s: The conventions of traverse sections had become a well-established part of the visual language of geology everywhere. They could be used without special explanation to illustrate a wide variety of structural phenomena . . .; [even] to illustrate popular books on geology; and they had become a powerful visual means of summarizing and synthesizing geological work on a very broad scale.
76
Clary and Wandersee classified this image as a “graphic with inferred information with direct and alphabetic labels”; that is, the Tableau represented the inaccessible parts of the Earth’s interior (inferred information) using graphic legends to make the image readable.
77
However, I think the Tableau did more than “reveal” a non-directly observable part of the planet, as it embedded a temporal scale in both directions (vertical and horizontal) intentionally aimed at depicting the growing thickening of the Earth’s crust – in its turn, a consequence of the intense internal igneous activity, corollary of the theory of central heat. Indeed, the Tableau was built upon the theory of central heat as espoused at that time by Pierre Louis Antoine Cordier. Boubée heartily dedicated to him his 1834 Cours abrégé de Géologie, which he published to explain the Développement du Tableau de l’État du Globe à ses different ages. It illustrated this theory by depicting the increasing thickness of the Earth’s solid crust over time due to its cooling and overlapping of strata, a process to which the contribution of plutonic and volcanic material, originated in the fluid and incandescent interior, was non-negligible. At the same time, the thickness, density, pressure, and complexity of the atmospheric composition decreased as the Earth cooled and aged. The Tableau also assumed, in line with the cooling theory, that the Earth would reach a state of equilibrium in the distant future and extinguish itself: The constant and simultaneous decrease in central heat and atmospheric pressure explains all the phenomena of geology, at the same time as it shows us that our planet is slowly plunging into a general equilibrium, an equilibrium which can only be established by the death of all that is alive on the globe and by the extinction of the globe itself!
78
The main details of each epoch were presented in the Tableau, such as the primary rock formations originating at each time (the Classification et caractères minéralogiques des roches homogènes et hétérogènes, published by Alexandre Brongniart in 1827, was recommended as a reference to identify rocks and minerals); the foremost dynamic and mechanical (in present terms, structural and tectonic) processes (such as folding and craters of elevation); plutonic and volcanic events; and the formation of mineral deposits. The “Cuvier-inspired” epochs were as follows:
First epoch: (the oldest, lasting around 60,000 years), before the existence of organized beings (plants and animals);
Second epoch: the age of marine animals and terrestrial plants (starting around 200,000 years ago);
Third epoch: the age of quadrupeds and terrestrial and fluvial animals (starting around 30,000 years ago);
Fourth epoch: the time when humankind emerged (starting around 8,000 years ago).
The sequence of the epochs and their respective idealized and simplified configuration along the horizontal axis emulates a “movie” as a sort of storyboard that expresses a visual narrative. Prints, as means of communication and representation, “required new modes of perception by those who looked at them,” and vice-versa. 79 I can add: this new perception also shaped new modes of representation. New modes of seeing become new modes of knowing, embedding social, epistemological, and ethical values because “making a scientific image is part of making a scientific self.”80, 81 Both are acquired through the continuous practicing of the nature representation techniques, simultaneously to the shaping of the self: “to learn to observe and depict in a science is to acquire at once an ethos and a way of seeing. The same cultivated patterns of attention that single out certain objects in a certain way . . . also pattern a self.” 82 As regards geology, without its new visual language, the layers of the Earth would remain obscured, cognitively unattainable, although many times physically reachable. In the case of Boubée’s Tableau de L’État du Globe, the nonspecialist audience he wanted to reach demanded a particular type of visual representation: condensed, relatively simple to understand and apprehend, general, and usable. In response, he condensed (and interpenetrated) space and time, presenting the evolution of the planet (mainly its most superficial and partially accessible part) in a narrative-type visual sequence that followed the time arrow according to Western reading conventions (from left to right). That a mixture of text and image aids communication is a well-established fact that deeply reverberates through educational practices. Boubée was already valuing and adopting such a combination in his educational visual devices. The Tableau can consequently be considered a “highly abstract theoretical statement[s] in a visual language,” presenting a significant volume of relatively complex data within a reduced space. 83
Although the Tableau de l’État du Globe can be considered original and unique compared to other contemporaneous representations, whether Boubée was inspired by a pre-existing representation is still a valid question. And, in our opinion, the answer is yes: the Tableau shows sound similarity to Élie de Beaumont’s depiction of his theory of revolutions of mountain building, published in 1829–30. This illustration expresses the same concepts as Boubée’s Tableau (it is possible to see in the reproduction printed in Rudwick’s article). 84 I believe that Boubée, who praised Beaumont and was relatively close to him, almost certainly attended his courses as a free listener and adopted this (excellent) idea.
Boubée’s Tableau de l’État du Globe reached Great Britain almost as soon as it was published, which is clear from the copy that he himself presented to the Geological Society of London (GSL). 85 In addition, copies of his journal L’Écho du Monde Savant were also provided to the GSL as part of his strategy to broaden his domestic and international contacts and, in turn, his scientific influence. A proof of this strategy is the presence of one copy of the Tableau de l’État du Globe in the collection of the famous Christian theologian and geology professor at Oxford, William Buckland (1784–1856), held at the University Museum, Oxford. 86 Based on that fact, Nicolaas Rupke concluded that Boubée’s Tableau was another version, or even an imitation, of the Webster-Buckland Ideal Section of a Portion of the Earth’s Crust (published in Buckland’s Bridgewater Treatise [1836]) combined with Brongniart’s Tableau théorétique de la succession et de la disposition des terrains et roches qui composent l’écorce de la Terre (1829). 87 However, Rupke’s conclusion could hardly be the case; first, Boubée’s Tableau was published earlier than Buckland’s chart, but principally because its design is very different. On the other hand, a claim of influence or imitation could certainly be the case for Boubée’s Tableau figuratif de la structure minérale du globe, ou résumé synoptique du Cours de géognosie de M. N. Boubée, issued in 1839, which is the next and final visual device I shall examine.
The Tableau figuratif de la structure minérale du globe
This chart was intended to serve as a summary of one of Boubée’s courses, too: that on geognosy, as is clear from the subtitle (Résumé synoptique du Cours de géognosie de M. N. Boubée) (Figure 7). It was also planned to complement the Tableau de l’État du Globe.
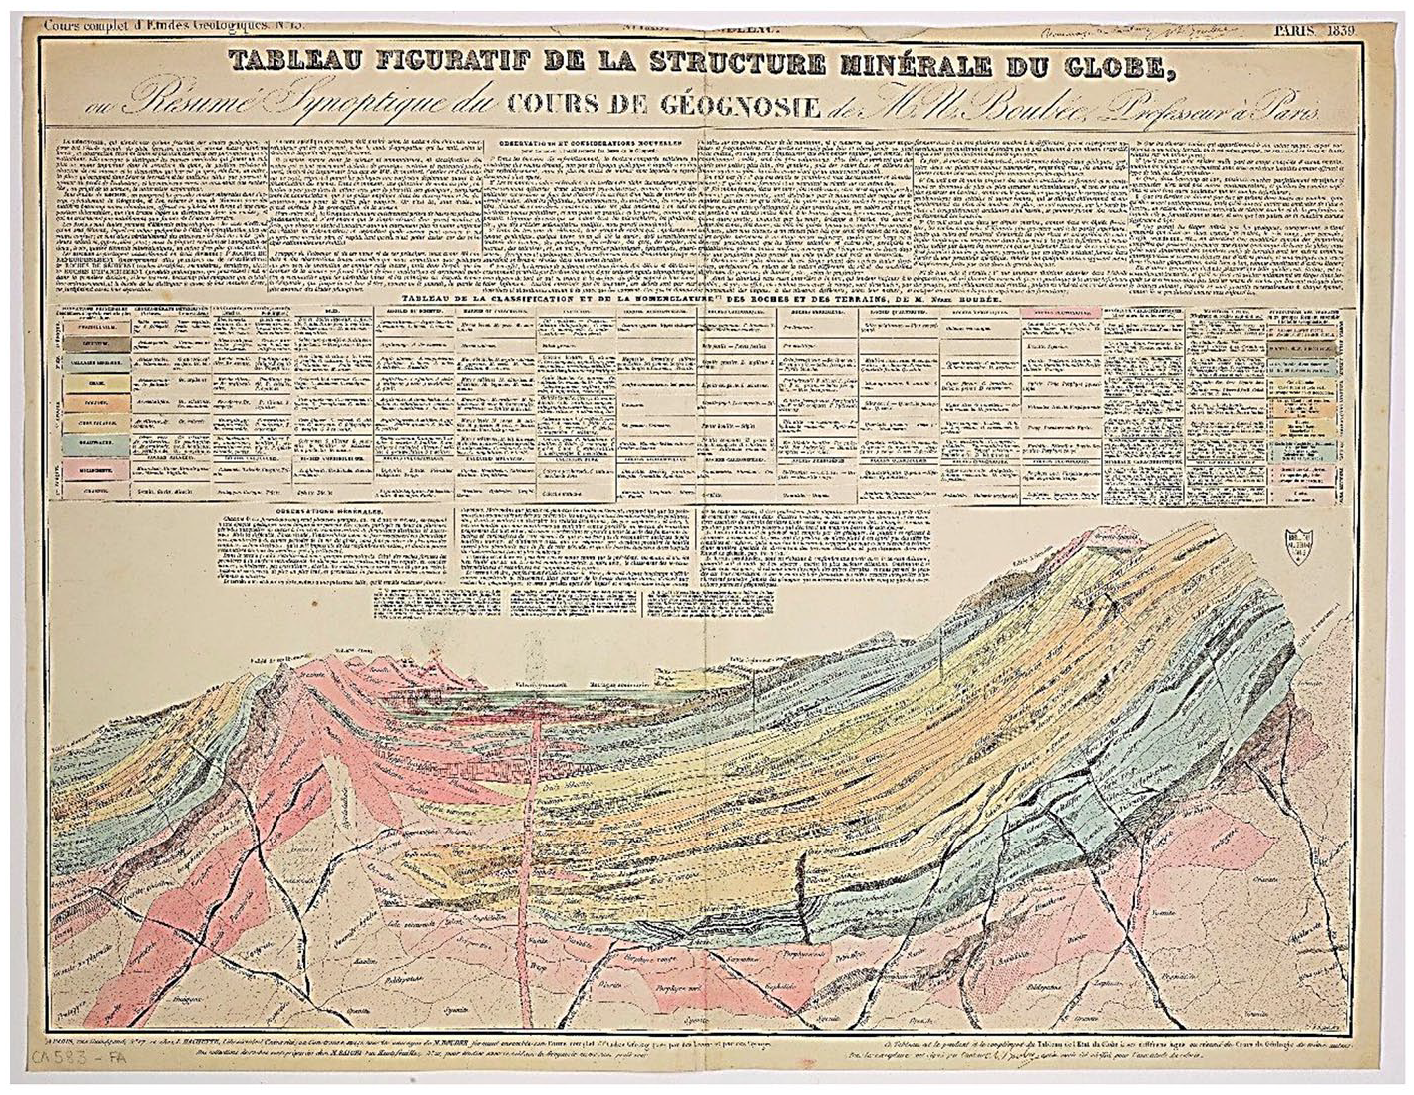
Tableau figuratif de la structure minérale du globe (Boubée, 1839).
The 1839 diagram shares the same design as the first Tableau, with text covering roughly half the space; it also contains a tabular arrangement of the names of the geological periods (epochs), their formations, different rock types, and respective minerals, as well as what Boubée called matières utiles – valuable materials that could be exploited. Although slightly larger, its dimensions were also manageable: 72 cm long and 53 cm high (roughly 28.3 × 20.8 inches). The nontextual portion was visually quite similar to Webster-Buckland’s Ideal Section of a Portion of the Earth’s Crust and Brongniart’s Tableau théorétique de la succession et de la disposition des terrains et roches qui composent l’écorce de la Terre previously referred to, which Boubée certainly was familiar with. Still, the rock classification in the Tableau figuratif had some degree of originality, with Boubée claiming intellectual authorship stimulated by his strong attachment to theoretical principles: “Geognosy remains entirely deprived of any fundamentals or fundamental principles and is still only the simple summary of a considerable amount of facts . . . Nevertheless, that science can assure its progress, a sure and rapid development, as long as it is not seated on rationally established principles!” 88 This statement is followed by a list of his observations and new considerations offered to establish the foundations of geognosy.
The classification contains columns entitled (in sequence) Formations principales, Conglomerats determinés, Conglomerats indéterminés, Grès, Argiles ou Schistes, Marnes ou Claschistes, Calcaires, Roches Accidentelles, Roches Carboniques, Roches Ferrigènes, Roches Quartzeuses, Roches Épigéniques, Roches Plutoniques, Minéraux Caractéristiques, Matières Utiles, and Subdivision des Terrains en 27 groupes formant ensemble l’Échelle Géognostique. As in the Tableau Mnémonique, an intention of “universalization” is also found here, through an ideal juxtaposition of different kinds of rocks and their modes of occurrence, constituting a “visual summary” of easy and rapid access for readers. The pictorial portion in the bottom half of the Tableau figuratif, like the previous material it resembled, was a detailed, complex, and ideal theoretical cross-section showing not only the different types of strata but also the spatial relationships between them, specifically temporal, structural, and causal aspects such as inclination of strata, or volcanic action, for instance. Again, a useful vertical distortion is present, for similar purposes as in the previous Tableau. This vertical exaggeration can be clearly seen in the detail reproduced above (Figure 8), demonstrating its “cognitive aims” targeted at his broad audience of nonspecialists. 89
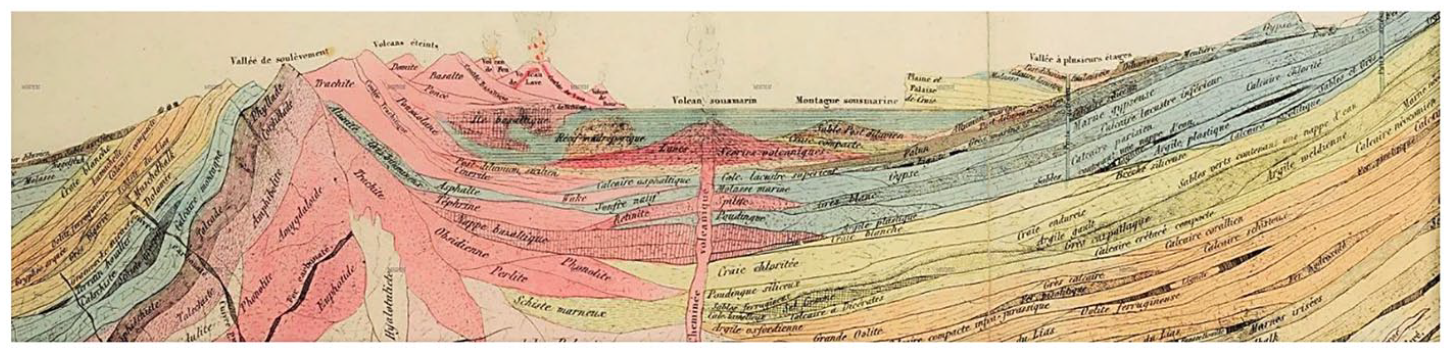
Detail of the special relations between rock formations in the Tableau figuratif (Boubée, 1839).
Three editions of the Tableau figuratif were published: the first in 1839, and subsequent ones in 1846 and 1852. Another final proof of the unequivocally educational purpose of that chart is a kind of advertisement written in the bottom margin, in which Boubée provides an address where students could purchase rock collections to study the Tableau, even without a teacher.
The success of Boubée’s charts led him to produce yet another, the Tableau entitled Ensemble des matériaux dont le Globe Terrestre est formé, which received positive comments when presented at the London Great Exhibition of 1851 and was further reprinted. Unfortunately, I have not yet found a copy of this resource that could permit analysis and comparison.
The general classification Martin Rudwick proposed in his paper on visual language in geology contains four levels of cognitive zones, in increasing order of complexity: topographical, distributional, structural, and causal. Along these lines, Boubée’s materials analyzed in this paper can be classified among the structural and causal levels, as “theoretical sections” that embodied the increasing “development of successive sets of cognitive goals.” 90 In social terms, they also represented the “development of an increasingly esoteric language, which had to be learned by recruits,” to which Nérée Boubée offered his significant contribution. 91
Final remarks
Nérée Boubée was concerned with geological education for nonspecialists from the very beginning of his career as an independent teacher in Paris. Boubée produced visual syntheses that scaled down the Earth for better and more efficient learning among people who were not familiar with complex geological sciences, as well as to simplify fieldwork for both novices and intermediate students of geological field practices. When one bears in mind the intrinsic properties of “paperwork vinscriptions” – that is, mobility, immutability, flatness, scaling, reproducibility, superimposition, and being part of a written text – we realize that Boubée stressed several of these characteristics in his visual representations. 92 Mobility, flatness, scaling, reproducibility, and the connection to written texts were all mobilized to benefit the use of the materials by his students and the readers of his books. His sophisticated visual devices resulted from the growing process of visualization seen in geology. They were made possible by (and also contributed to) the emergence of “ever more abstract, formalized and theory-laden modes of representation. By about 1840, these forms of visual communication in geology no longer functioned as supplements to verbal description and verbal concepts . . . They had become an essential part of an integrated visual-and-verbal mode of communication.” 93 In short, the visual charts created by Nérée Boubée were expressions of a “materialized epistemology,” which embedded the constitutive and rhetorical work of the nineteenth-century (geo)sciences. 94 Extensively relying on visual inscriptions articulated to written sources – which were mainly his educational and popularization science books – Nérée Boubée vigorously aimed at contributing to the improvement of geology during its so-called “golden age.”
Supplemental Material
sj-docx-1-hos-10.1177_00732753221089812 – Supplemental material for Scaling down the Earth’s history: Visual materials for popular education by Nérée Boubée (1806–1862)
Supplemental material, sj-docx-1-hos-10.1177_00732753221089812 for Scaling down the Earth’s history: Visual materials for popular education by Nérée Boubée (1806–1862) by Silvia F de M Figueirôa in History of Science
Footnotes
Acknowledgements
The author wishes to thank Claudine Cohen and the École des Hautes Études en Sciences Sociales (EHESS) for the opportunity to spend a month in Paris consulting the Archives Nationales, Archives du Muséum National d’Histoire Naturelle, and the Library of the Société géologique de France. The assistants of all these institutions were very helpful and are also thanked. The two anonymous referees warrant thanks for their careful, generous reading and criticism and their relevant suggestions, which were essential to improving this article. Any mistakes and misinterpretations are the author’s alone.
Declaration of conflicting interests
The author declared no potential conflicts of interest with respect to the research, authorship, and/or publication of this article.
Funding
The author acknowledges sponsorship from the Conselho Nacional do Desenvolvimento Científico e Tecnológico (CNPq, grant 307002/2017-9).
Notes
Supplementary Material
Please find the following supplemental material available below.
For Open Access articles published under a Creative Commons License, all supplemental material carries the same license as the article it is associated with.
For non-Open Access articles published, all supplemental material carries a non-exclusive license, and permission requests for re-use of supplemental material or any part of supplemental material shall be sent directly to the copyright owner as specified in the copyright notice associated with the article.