
Abstract
This article reports an evaluation of a set of eight spreadsheet-based tutorials developed for the statistics portion of an undergraduate psychology research methods course. The evaluation involved a quasi-experimental comparison of spreadsheet-based and traditional classroom teaching methods in a course that gave equal teaching time to both solutions, and took the unique approach of investigating both outcomes-based and attitudinal measures in the same study. Compared to traditional pen-and-paper-based tutorials, the spreadsheet-based tutorials improved student outcomes-based performance on an end-of-semester test. After using the spreadsheet-based tutorials, student attitudes towards the course material were found to have improved on some, but not all, of the measures used. Taken together, these results indicate that spreadsheet-based tutorials may be advantageous in the teaching of statistics, although effect sizes were small to moderate.
The advantages of using spreadsheets as a tool in teaching statistics have been expounded for more than 25 years (e.g., Soper & Lee, 1985). Although many authors have advocated the use of spreadsheet-based teaching (e.g., Beare, 1993; Crowe & Zand, 2000, 2001; Drier, 2001; Frith, Jaftha, & Prince, 2004), opinion is divided on whether spreadsheet programs are a useful tool to perform and teach statistics. Many authors favour spreadsheet programs due to the numerous advantages they afford when used in statistics teaching (e.g., Beare, 1993; Drier, 2001; Hall, 1995; Hunt, 1995; Warner & Meehan, 2001), although other authors are more critical, primarily due to the weaknesses of Excel in performing certain statistical functions (e.g., Dell’Omodarme & Valle, 2006; McCullough & Wilson, 1999; Nash, 2008; Teixeira, Rosa, & Calapez, 2009; Yalta, 2008).
In general, positive results in favour of spreadsheet-based teaching have been found by previous empirical studies using outcomes-based measures. Flynn, Concannon, and Campbell (2006) examined the impact of spreadsheet-based assessments on undergraduate students, and discovered that the more spreadsheet-based assessments that were completed, the greater the impact on the course outcome. The study suffered from confounding students’ motivation with students’ use of technology, however, as participation in the assessments was voluntary.
A study that used interactive spreadsheet-based instruction as an adjunct to classroom teaching (Frith et al., 2004) found that such instruction could achieve some impact on the teaching of fundamental mathematical and statistical concepts. The authors concluded, ‘It appears that while the lecture room tutorial taught the students how to calculate the various statistics, the computer tutorial was more effective in giving them an understanding of the concepts and they retained better what they had learned’ (p. 163). Despite being one of the few studies to involve a direct comparison of classroom- and spreadsheet-based teaching, the scope was limited (N = 67), and a pre/post-test method with no proper within-subjects control was employed.
Positive results from spreadsheet-based teaching have not always been achieved. Calder, Brown, Handley, and Darby (2005) found that although a spreadsheet-based teaching approach led more directly to an algebraic thinking process, a classroom-based approach elicited more rigorous descriptions of the processes involved in mathematical problem-solving and thinking. Mills (2002) has also noted that even though software may enable students to master the mechanics of data analysis, they may still find abstract statistical concepts difficult to understand.
Despite the repeated emphasis on the importance of attitudes towards statistics in the statistics teaching literature (Garfield & Ben-Zvi, 2007), there are few studies of spreadsheet-based teaching that have included attitudinal measures. Most studies are based on other types of technologies, such as those of Meletiou, Myers, and Lee (1999), and Meletiou-Mavrotheris, Lee, and Fouladis (2007). Both these studies found that students taught with technologically based activities experienced increased enjoyment and appreciation of statistics, despite negative attitudes at the beginning of the course, compared to students taught using traditional teaching methods.
Ware and Chastain (1989), in a study concerning the Statistical Package for the Social Sciences (SPSS; a software program for quantitative data analysis), discovered that students in the computer-assisted group had more favourable attitudes towards statistics than those who did not use the computer. A more recent study (Schuyten & Dekeyser, 1996) noted a minimal impact of using SPSS on students’ attitudes towards statistics, demonstrating that more positive attitudes are not always obtained.
We could find only one study that dealt with spreadsheet-based statistics teaching, and that also used attitudinal measures. This study was by Warner and Meehan (2001), who obtained favourable student ratings for a set of Excel-based homework assignments, although no comparison with traditional pen-and-paper-based (PAP) assignments was done. The lack of focus on attitudinal outcomes in the literature is surprising given that such outcomes may be more diagnostic than performance measures of the value of computer technology in introductory courses, where a major task of the educator is to overcome anxiety about performance in an unfamiliar field (Crowe & Zand, 2000).
No study has yet, to the best of our knowledge, investigated both outcomes-based and attitudinal measures in a comparison of spreadsheet-based and traditional PAP statistics teaching methods, in a course that gave equal teaching time to both solutions. This would allow all students in the course to gain any potential benefits from either method of instruction, while equally shielding them from any potential detriments. The aims of this study were therefore twofold: First, to determine whether any differences resulted from using spreadsheet as opposed to PAP tutorials, as measured by standard course outcome measures; and second, to determine whether any differences between these two teaching methods were evident, as measured by attitudinal measures. Due to the often-conflicting results obtained in previous studies, for both outcomes-based and attitudinal measures, no specific hypotheses regarding the superiority of one form of teaching over the other were made.
Method
Participants
Participants were a class (N = 169) of the second-year research methods course in the Department of Psychology at the University of Cape Town (UCT). The average age was 19 years, with 73% of students being female and 27% male. The class was not demographically different from other cohorts in the recent past. Most students were familiar with the use of Excel as this is part of the first-year psychology curriculum. Students were not aware that they were participating in the experiment, and were debriefed at the end of the semester.
Informed consent was not sought, but this is in line with American Psychological Association (APA) ethical guidelines, which state that informed consent may be dispensed with where research involves the study of normal educational practices and curricula, and is unlikely to cause harm to participants (APA, 2010). As the course was compulsory for a major in psychology, students had to complete the course in any case.
Materials
Spreadsheet-based tutorials (SBTs)
One spreadsheet-based tutorial was developed for each of the eight topics taught: central tendency and variability; probability; the normal distribution; regression; correlation; the sampling distribution; hypothesis testing; and t tests. Examples of sheets from the tutorials on t tests and the normal distribution are depicted in Figures 1 and 2, respectively. One senior tutor was available during tutorials to deal with questions related to the course material. Two junior tutors were available to deal with software-related issues.
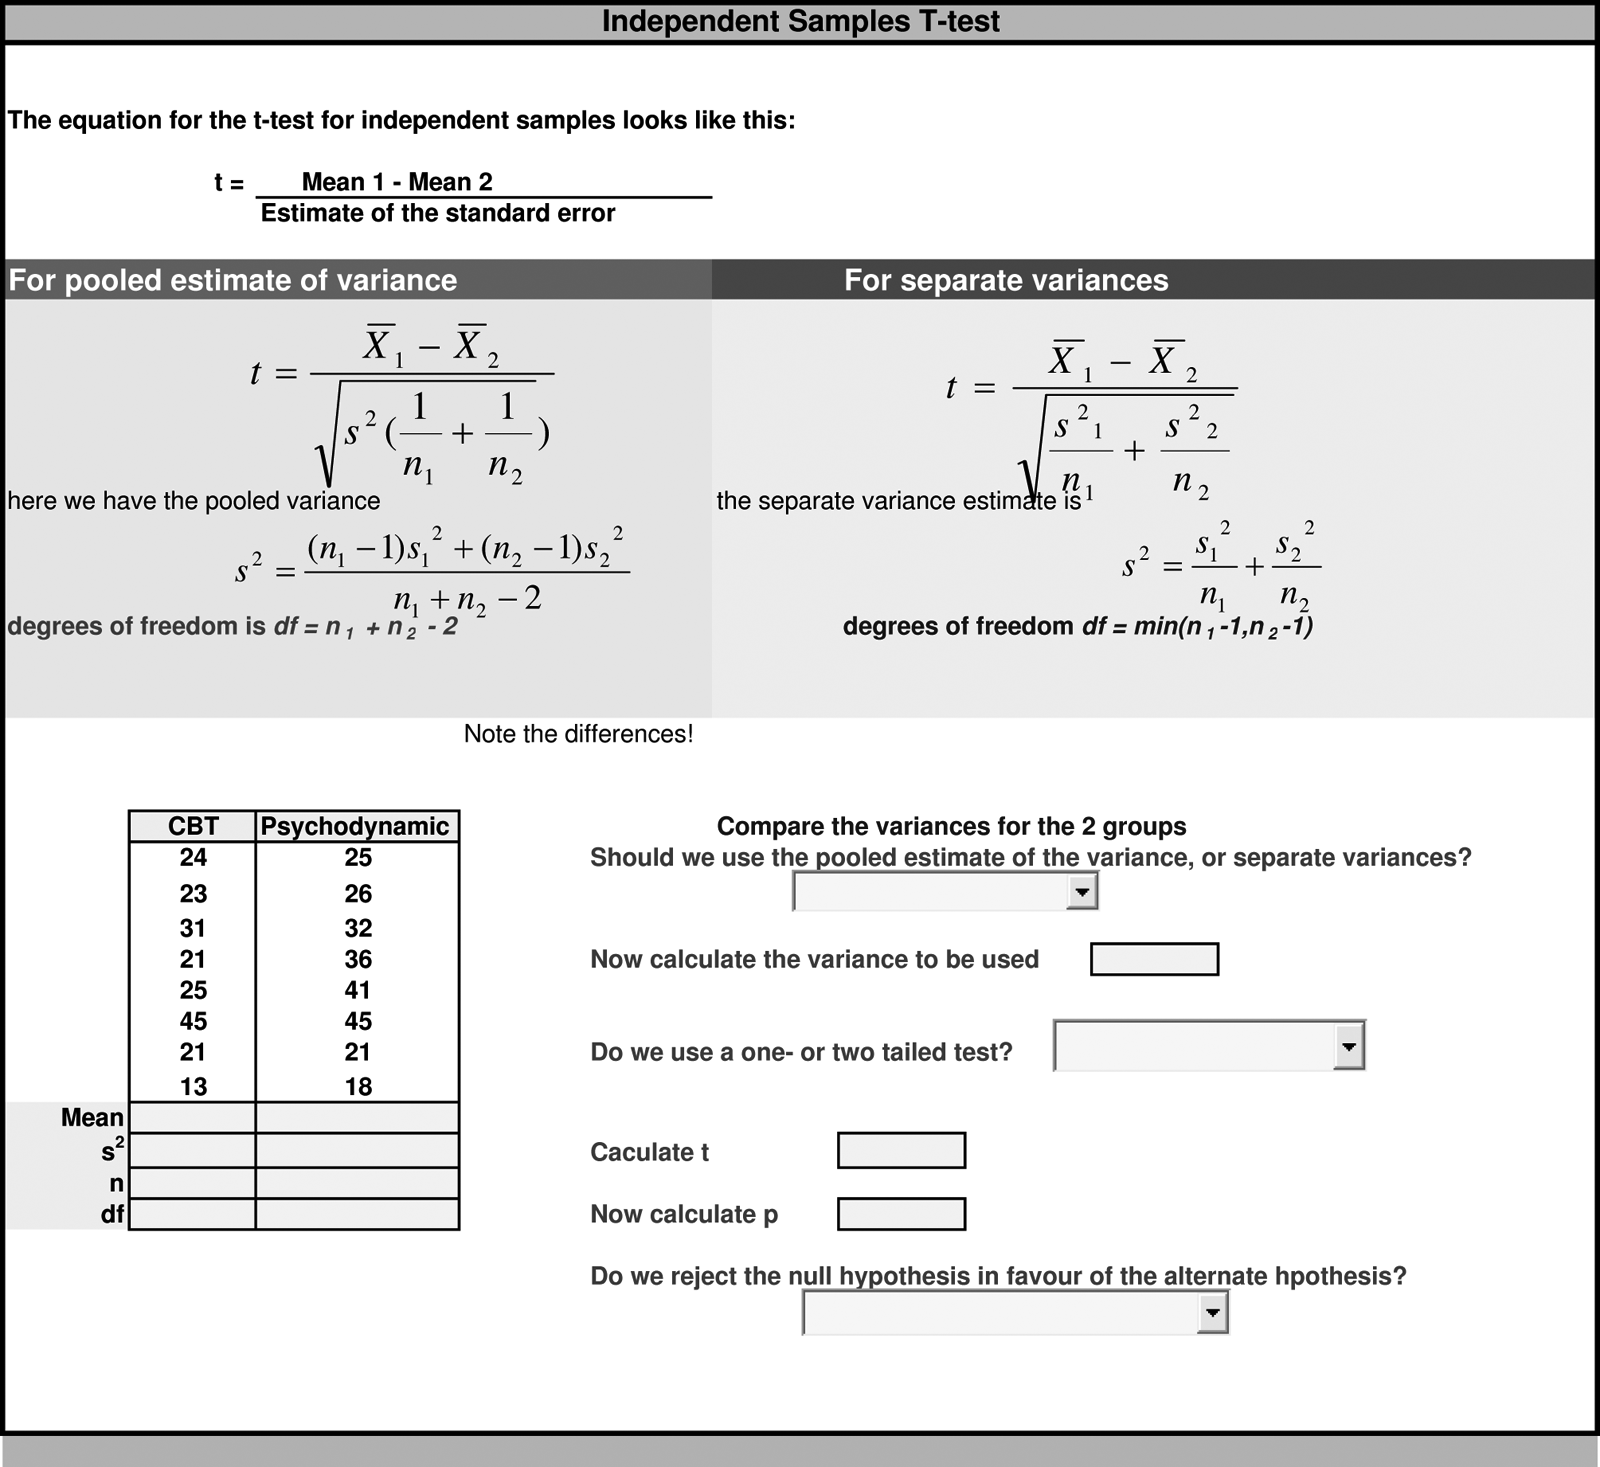
Example of a sheet from the Excel tutorial on t tests.
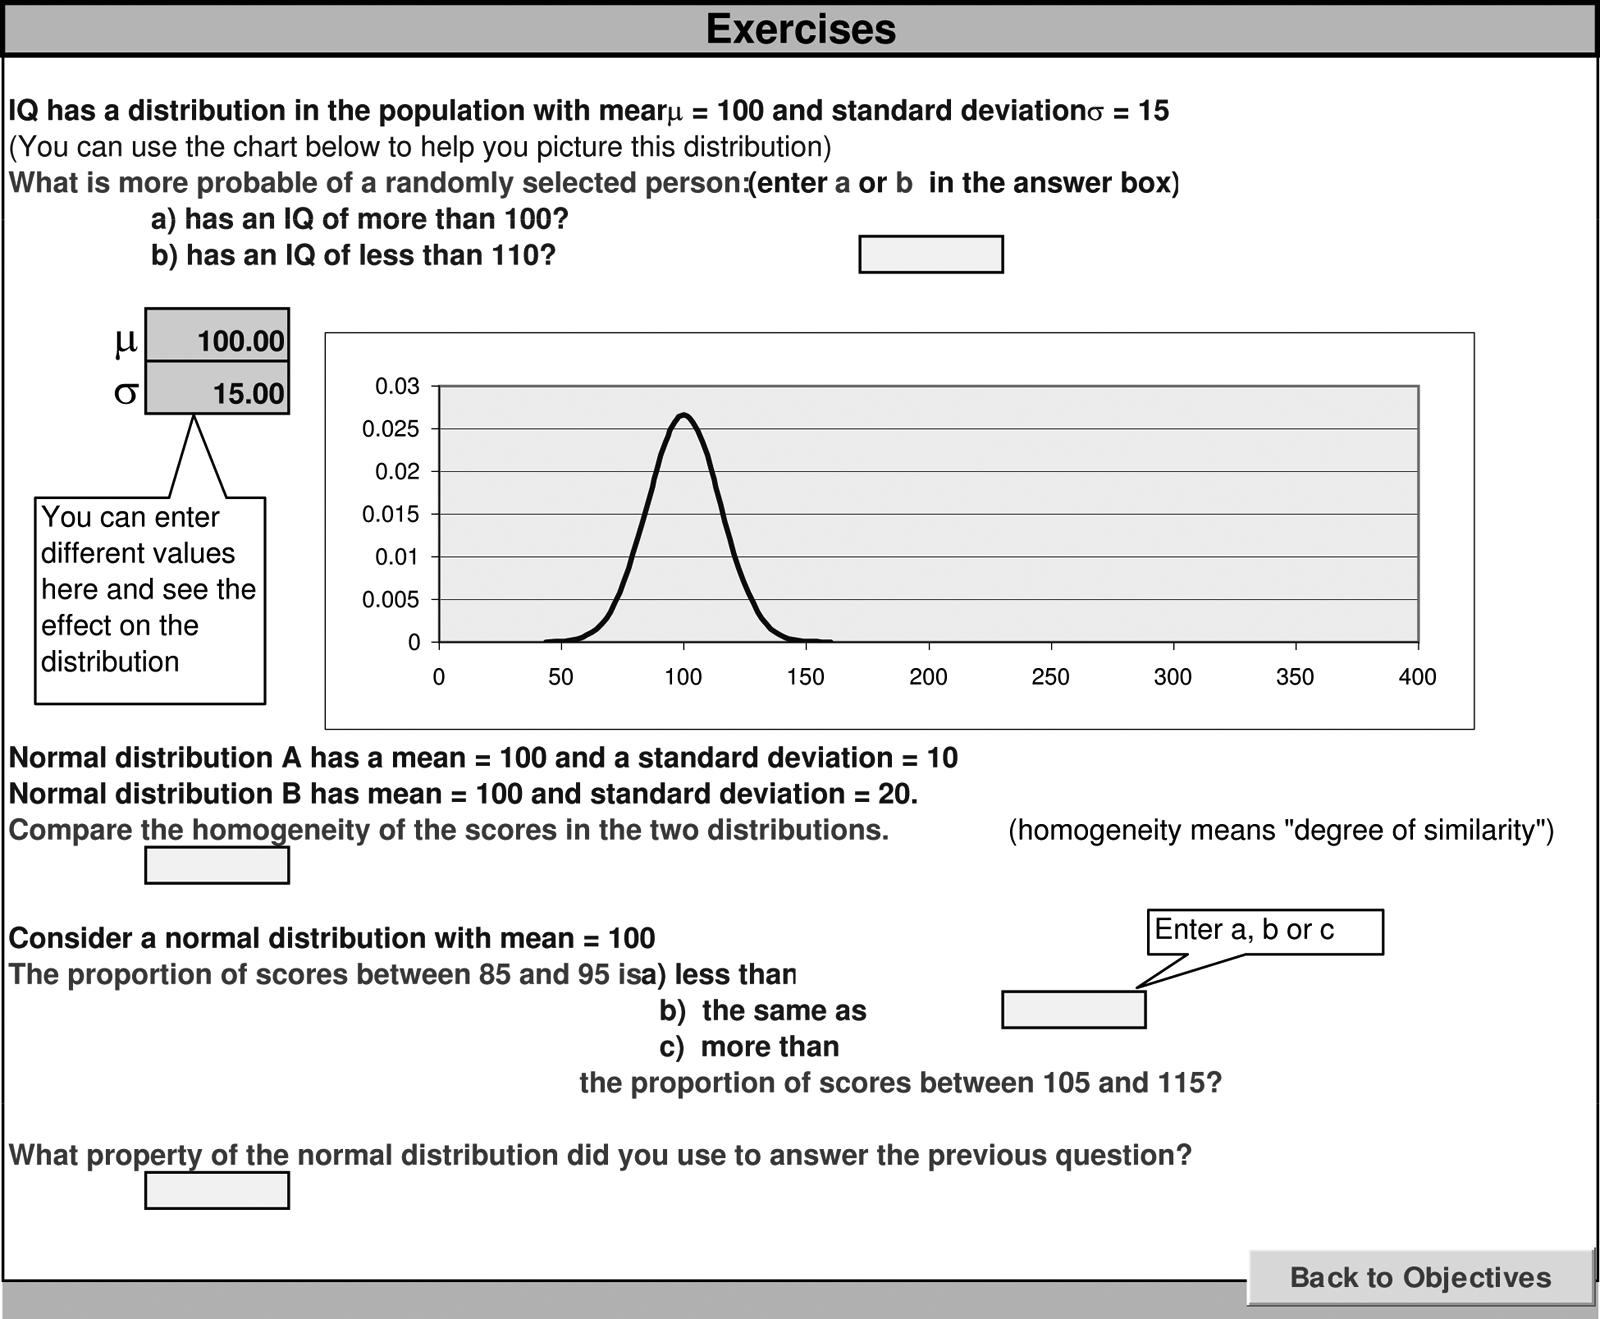
Example of a sheet from the Excel tutorial on the normal distribution.
The tutorials included extensive explanations of the relevant concepts, demonstrations of the computations required, and, in most cases, interactive demonstrations of the concepts in the form of animations and simulations. Students interacted with the tutorials by performing actions such as typing in answers to theoretical and practical questions, selecting among multiple choice response options from drop-down boxes, and performing calculations using the built-in statistical functions of Excel. A basic knowledge of Excel is required to use the tutorials, and all knowledge of statistical and other Excel functions is explained in the SBTs themselves.
The SBTs were developed with Microsoft Visual Basic for Applications (VBA) using the Microsoft Object Model; thus, developing a set of SBTs requires the appropriate programming knowledge in VBA. Although the average academic is unlikely to have such knowledge, it should be available in most computer science departments.
Pen-and-paper-based (PAP) tutorials
These were taken from the supplementary materials provided with the course textbook (Tredoux & Durrheim, 2002). These are a set of worksheet problems that were provided to students ahead of the tutorial, where a senior tutor worked with the students as they solved the problems using pen and paper.
Design
Students signed up to a tutorial group in one of two streams, with each tutorial group randomly assigned to either stream. Stream A received tutorial 1 in spreadsheet form, tutorial 2 in pen-and- paper form, and continued alternating forms in this order (i.e. S-P-S-P-S-P-S-P; S = SBT, P = PAP tutorial). Stream B received the tutorials in the opposite order (i.e. P-S-P-S-P-S-P-S). Students signed up to tutorial groups based on their scheduling needs, blind to their assigned stream. The study design was therefore quasi-experimental.
Procedure
Ethical clearance was obtained from the departmental ethics committee prior to commencement of the study, which ran for the entire first teaching semester. To prevent students in either stream from being advantaged or disadvantaged in terms of their learning, each stream received instruction in both SBT and PAP form, with a new tutorial occurring every week. All tutorial sessions ran for 120 min, with both types typically taking 150–180 min to complete. The same senior tutors presented both tutorial types. Students were expected to complete any worksheets they could not finish in their own time, and to submit them for course credit.
Measures
Attitudinal measures
Seven items were included in an end-of-semester test. Item 1 was used to determine which method of instruction was found to be more helpful in general, and Item 2 was used to determine whether students felt that some material was better suited to one tutorial type over the other. Item 3 was used to establish whether students used both tutorial types to study for all sections of the course, for some sections, or only for the context in which they learned each section. This item measured preferences for using the material to study from, as well as potential contamination across streams and conditions. Contamination was possible as both tutorial types were made available online, as it was regarded as unethical to withhold any form of the tutorials from students. The next four items were Likert-type (1 = strongly disagree to 4 = strongly agree), and determined how strongly students felt the laboratory (Item 4) and classroom tutors to be prepared and helpful (Item 5), as well as how strongly they felt the laboratory (Item 6) and classroom tutorials (Item 7) provided instruction and preparation for the test.
After each individual tutorial, students completed five Likert-type items (also with 1 = strongly disagree to 4 = strongly agree) measuring attitudes towards the course material, the relative perceived difficulty of the material, and the perceived usefulness of the tutorial. Continuous assessment was preferred in order to overcome attitudes towards the final tutorial dominating an end-of-course survey.
Outcomes-based measure
This was total scores on an end-of-semester test, which covered all topic areas taught and was for 100 marks. Students completed each section in the respective format in which it was taught to them (i.e. sections taught using SBTs were completed using Excel, and sections taught in the classroom were completed on pen-and-paper). Half the questions were therefore completed using Excel, and half using pen-and-paper. As the test counted significantly towards their overall mark, students were motivated to prepare thoroughly. The test contained a combination of theoretical and practical questions, with part marks being awarded for various steps in completing calculations, even if the final answer was not correct. The test was written in a university computer laboratory under examination conditions, with students allotted 2 h for its completion.
Results
Attitudes
An alpha level of .05 was used for all analyses. Responses for Items 1–3 of the survey in the end-of-semester test (see the ‘Measures’ sub-section earlier in the article) were analysed using chi-squared goodness-of-fit tests. The sample size for each analysis differs slightly due to missing data from students who did not answer certain items. Expected frequencies were derived assuming equal proportions of students would fall into each of three categories, as there was no a priori reason to expect any particular percentage of students to favour one response category over another.
For Item 1, 33.14% (56) of the students indicated that they found the SBTs more helpful in general, 30.18% (51) found the PAP tutorials more helpful, and 28.40% (48) found both tutorial types helpful. Differences between these and expected frequencies were not statistically significant, χ2(2, N = 155) = 0.63, p = .729, Cramer’s φ = 0.04.
The preferences for each type of tutorial (as measured by Item 2) were as follows: A preference for having only SBTs was expressed by 32.54% (55) of the students, a preference for only PAP tutorials was expressed by the least number of students – 22.49% (38), and the most popular preference was for particular spreadsheet and particular PAP tutorials, which was expressed by 36.09% (61) of students. Differences between these and expected frequencies approached statistical significance, χ2(2, N = 154) = 5.55, p = .062, Cramer’s φ = 0.13.
Responses to Item 3 indicated that the materials were used only in context by 33.27% (57) of the students, with 33.14% (56) using both materials for some sections. The least number of students, 23.08% (39), used both materials for all sections. Differences between the observed and expected frequencies were not statistically significant, χ2(2, N = 152) = 4.04, p = .133, Cramer’s φ = 0.12.
Wilcoxon tests were used to evaluate responses on the Likert-type items in the end-of-semester test. Students perceived the laboratory tutors as more prepared and helpful than the classroom tutors (z = 3.83, p < .001; mean rank in favour of laboratory tutors = 48.58; mean rank in favour of classroom tutors = 39.02), but did not feel that the SBTs provided better instruction and preparation for the test than the PAP tutorials (z = 0.18, p = .856; mean rank in favour of SBTs = 57.73; mean rank in favour of PAP tutorials = 62.55).
For the items completed after each individual tutorial, Cronbach’s α ranged from .77 (administration after the seventh tutorial) to .99 (administration after the first tutorial), indicating a moderate to high degree of reliability. The results from the five items were summed and averaged. A two-tailed dependent samples t test indicated that students had a more positive attitude towards the material when tutorials were conducted using SBTs (M = 25.59, standard deviation [SD] = 7.49) compared to PAP tutorials (M = 22.75, SD = 10.42), t(168) = 4.08, p < .01, d = 0.31, r = .53. Effect size was calculated using Equation 3 in Dunlap, Cortina, Vaslow, and Burke (1996).
Outcomes-based performance
An alpha level of .05 was used for all analyses. A mixed-designs analysis of variance (ANOVA) with type of tutorial as the within-subjects variable and stream (A or B) as the between-subjects variable was run to examine scores on the end-of-semester test. Skewness values indicated the data to be reasonably normally distributed for both the computer-based (−0.022) and PAP (0.316) sections of the test. Since the sample sizes were considerably different across streams (120 and 49, respectively), a combination of the complex sampling algorithm in SPSS, and the general linear model (GLM) was used, dropping 71 cases from the larger group, and running the GLM 1000 times with the bootstrap sample. The average F-ratio estimate for stream was not statistically significant, F(1, 96) = 1.86, p = .267, ηp2 = 0.02, as was the estimate for the interaction between stream and type of tutorial, F(1, 96) = 2.46, p = .210, ηp2 = 0.03. The average F-ratio estimate for type of tutorial was statistically significant, F(1, 96) = 13.96, p < .001, ηp2 = 0.13, with students performing better on the computer-based compared to the PAP section of the test (see Table 1). Increased pass rates were also evident for the computer-based section (with a pass mark being ≥25/50). Specifically, 59.80% of students passed this section, whereas 39.60% of students passed the PAP section.
Descriptive statistics for end-of-semester test results for the total sample.
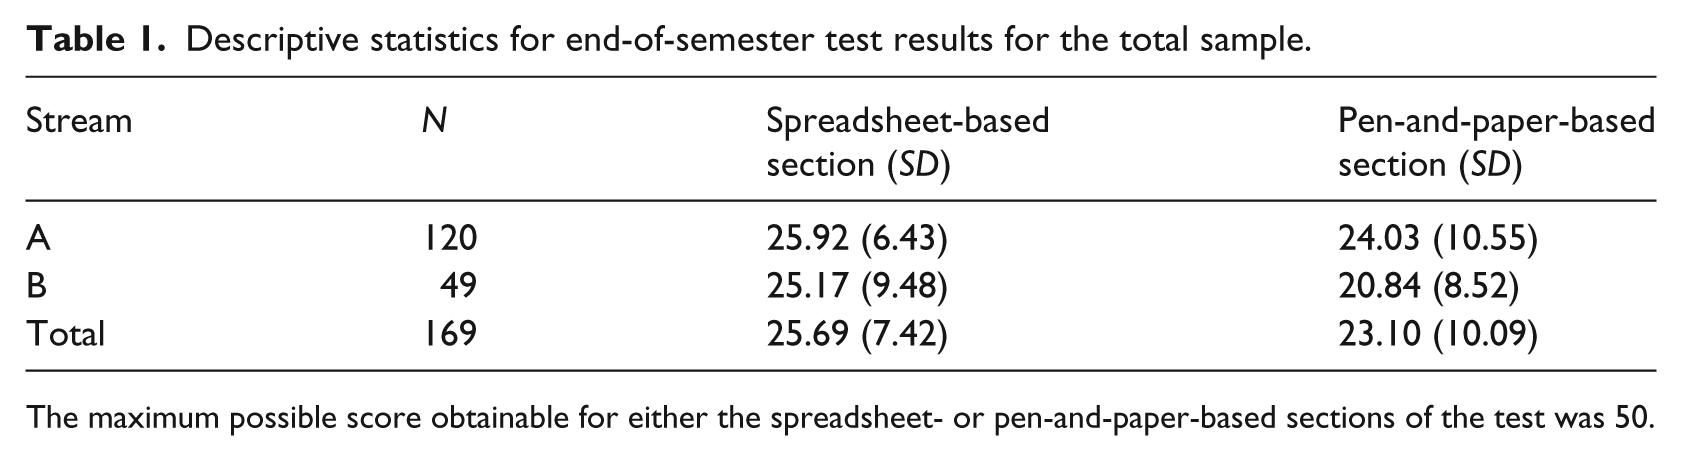
The maximum possible score obtainable for either the spreadsheet- or pen-and-paper-based sections of the test was 50.
A mixed-designs ANOVA was also run using only students who used the materials in context, to examine whether contamination of experimental conditions had any effect on the results. Six extreme outliers were detected and subsequently removed. Skewness values after deletion of the outliers indicated the data to be reasonably normally distributed for both the computer-based (−0.295) and PAP (0.460) sections of the test. A similar bootstrapping procedure as described above was used, again due to disparity in sample size (n = 34 for stream A; n = 17 for stream B), but now with 17 cases from stream A removed each time. The same pattern of results was evident as for the total sample: The average F-ratio estimate for stream was not statistically significant, F(1, 32) = 3.08, p = .151, ηp2 = 0.09, as was the estimate for the interaction between stream and type of tutorial, F(1, 32) = 0.45, p = .593, ηp2 = 0.01, while the average F-ratio estimate for type of tutorial was statistically significant, F(1, 32) = 6.48, p = .025, ηp2 = 0.16. Students again performed better on the computer-based section, compared to the PAP section of the test (see Table 2). Increased pass rates were again evident for the computer-based section, with 54.90% of students passing this section, whereas 25.50% of students passed the PAP section.
Descriptive statistics for end-of-semester test results for students using the materials only in context.
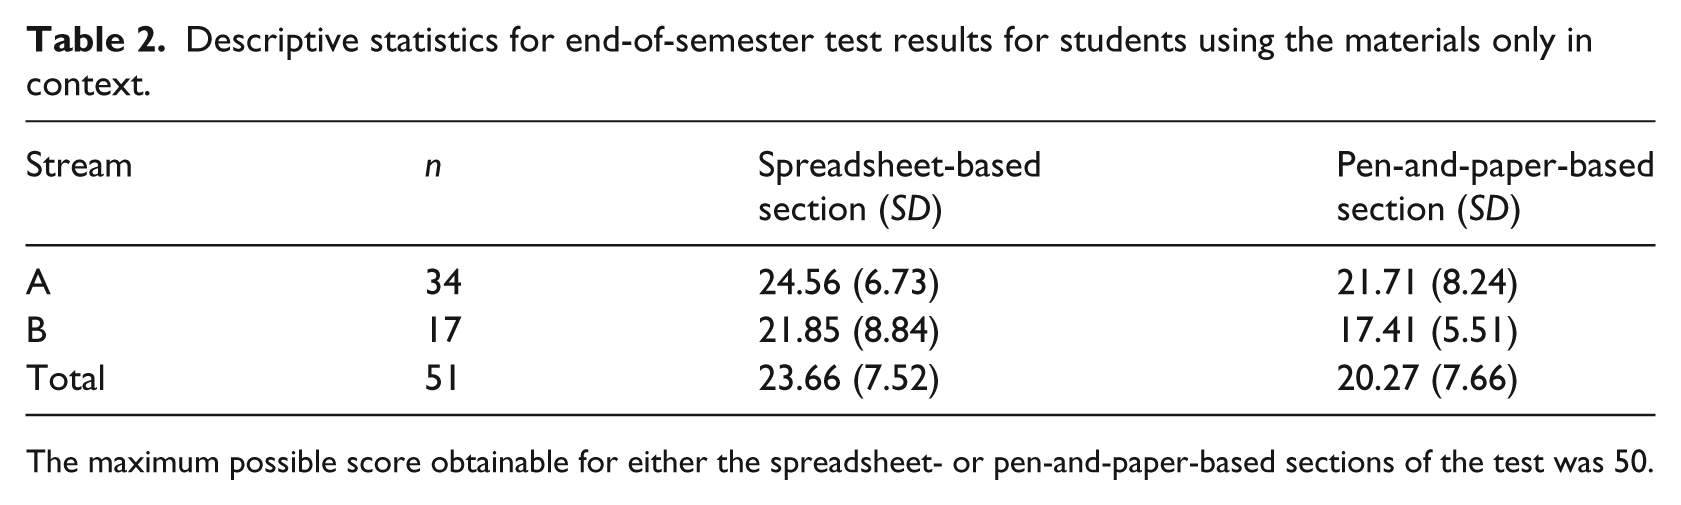
The maximum possible score obtainable for either the spreadsheet- or pen-and-paper-based sections of the test was 50.
Discussion
The finding that the SBTs resulted in better outcomes-based performance is consistent with the results of previous similar studies (e.g. Flynn et al., 2006; Frith et al., 2004), with the use of an actual course test in this study increasing the validity of the findings. Although the percentage increase in marks for the computer-based section compared to the PAP section of the test was small, a greater percentage of students in this study passed the former section compared to the latter, indicating that increased pass rates may potentially be achieved by using SBTs.
Although the outcomes-based results are in favour of the SBTs, two caveats should be noted. First, although many authors (e.g. Beare, 1993; Drier, 2001; Flynn et al., 2006; Frith et al., 2004; Hall, 1995) have proffered processes that may explain improved outcomes-based performance when using spreadsheet programs to teach statistics (e.g. more realistic and interactive examples, simulation-based activities improving understanding, etc.), these processes were not directly investigated in this study. The precise reasons for the better test performance of students therefore remain unknown. Future research could focus more directly on the processes and/or mechanisms leading to improved outcomes-based performance when using SBTs.
Second, given the small effect sizes in this study, the improved test scores may be due to simple factors such as fewer errors in calculations when tests are done on computer (Moore, 1997; Schuyten & Dekeyser, 1996). Another possible explanation is that more questions could be completed in the test due to the faster calculation speed provided by computers (Crowe & Zand, 2000). Future studies that examine factors such as number of calculation errors made, time taken to complete calculations, and the like would be enlightening. A study using purely theoretical questions on a test would control for these factors; however, this would neglect the important practical component of statistics. Another factor contributing to improved performance may be that as the test was written in the computer laboratory, the performance on the computer-based section was enhanced as the conditions of the test matched more closely with the conditions of the learning environment in which the SBTs were done.
For the attitudinal data, mixed results were obtained. The two positive findings were as follows: (a) The laboratory tutors were perceived as being more prepared and helpful than the classroom tutors; and (b) students had a more positive attitude towards the course material when it was taught using SBTs. With regards to the first finding, this result is unlikely to be attributable to shortcomings of the classroom tutors, as those same senior tutors presented both tutorial types. As the SBTs were designed to incorporate some of the explanation of concepts traditionally given in the classroom setting, it may be that the laboratory tutors were perceived as more prepared and helpful as some of the burden of teaching, and hence preparation, is reduced when using SBTs. Given that one reason for developing our SBTs was to counter the large student-to-tutor ratio, it may also be that tutors in the laboratory tutorials are able to engage with students in more interactions of greater quality than in the classroom, whereas in the latter environment, the tutor is more limited in the amount of time he or she can spend with any one student.
It is possible that this result could be because there were three tutors in the laboratory sessions and only one in the classroom sessions. Although the two junior tutors in the laboratory sessions were supposed to answer only software-related questions, we could not explicitly control the possibility that they might answer questions on the course material. The tutors are unlikely to have answered a large number of these questions, however, as their knowledge of the material was limited. The second finding, of a more positive attitude towards the course material, is consistent with previous studies on computer-assisted statistics instruction in general, such as those of Meletiou et al. (1999), Meletiou-Mavrotheris et al. (2007), and Ware and Chastain (1989), as well as the study by Warner and Meehan (2001) on SBTs, in particular.
The three results from this study that indicated no difference in attitude were as follows: (a) No preference for either type of tutorial on the helpfulness of the tutorial material in general; (b) no preference for either type of tutorial regarding the suitability of some of the course material to a particular method of instruction; and (c) a large number of students using both tutorial types for at least some sections of the course. This set of findings may indicate a lack of preference and are similar to those of Schuyten and Dekeyser (1996), who noted a minimal impact of computer-assisted instruction on attitudes.
In terms of the finding of students using both tutorial types to prepare for the test, another explanation besides lack of preference is that those students using both materials may be attempting to prepare as thoroughly as possible. When both types of materials are available, students may be motivated to use both from fear that they are being deprived of information by only using one tutorial type. As anxiety often surrounds statistics courses (Crowe & Zand, 2001), this explanation should not be discounted, although in the absence of qualitative explanations from the students, it is not possible to say for certain which possibility is correct, or whether there are any other reasons for students using both materials. A study comparing a group receiving only SBT instruction with a group receiving only traditional classes, where attendance is voluntary and outcomes are not directly linked to formal marks, may help prevent cross-contamination between conditions in future.
Taken together with the two aforementioned positive findings, the attitudinal results as a whole indicate that although attitudinal differences did not always emerge, the two differences that did emerge were both in favour of the SBTs. Engendering better student attitudes towards even a few aspects of statistics may be a major advantage of SBTs, since the goal of improving attitudes is often seen as an implicit objective of introductory statistics courses (Schau, 2003).
With regard to the limitations of the study, the study did not have a random assignment of students to each of the two teaching streams. Although a design employing true random assignment would have been preferable, within the confines of a semester-long course within a university where students take many different course combinations, it was neither practical nor possible to assign students randomly to streams, as this would have led to lecture and tutorial clashes for students.
As the same senior tutors taught both streams, the only difference between streams was the order in which students did the two types of tutorial, with this order being counterbalanced. It is therefore unlikely that the lack of random assignment of students to a stream compromised the results, as both main effects for stream and both interaction effects between stream and type of tutorial failed to reach statistical significance. A direct comparison between a stream taught exclusively using SBTs and a stream taught exclusively using PAP tutorials was not ethically possible, given the use of an actual course test as the outcomes-based measure. This view is in accordance with certain previous studies (e.g. Frith et al., 2004) that have found an advantage of spreadsheet-based teaching over traditional teaching methods. Such a comparison could therefore have led, potentially, to one group of students being disadvantaged in terms of their preparation for the test. Potential selection bias is also possible when comparing two groups that receive different treatments (Basturk, 2005).
Finally, the results of this study are limited in generalisability to other contexts where different applications may be used. However, a set of SBTs similar to the ones used in this study have been used for the UCT Mathematics curriculum and have also been shown to be more effective empirically than classroom-based tutorials alone (see Frith et al., 2004).
Conclusion
Overall, the results of this study concur with most previous research on the efficacy of using SBTs to teach statistics. Compared to traditional PAP methods, SBTs may improve students’ marks, pass rates, and their attitude towards aspects of the course material. A word of caution is in order though, bearing in mind the small effect sizes in this study as well as positive findings on only some of the attitudinal measures; thus, the utility of SBTs may have been overstated in previous research. Moreover, spreadsheet-based applications that are too difficult or frustrating for students to interact with may lead to less encouraging results.
It was also not possible to determine whether any differences occurred due to the particular content of the SBTs and PAP tutorials, which cannot be compared for equivalency, or whether differences arose because one type of tutorial is presented in a high-technology medium and the other is not. Despite these limitations, the present set of results indicates that using SBTs to teach statistics may have positive, although modest, effects on both test scores and attitudes towards statistics, especially since the PAP tutorials did not emerge more favourably in any comparison.
Footnotes
Acknowledgements
Thank you to Vera Frith who assisted in the development of some of the spreadsheet-based tutorials.
Declaration of conflicting interests
The authors declare that they do not have any conflict of interest.
Funding
This work was made possible by generous funding from the Andrew W. Mellon Foundation. The Foundation had no involvement in the study design, data collection, and decision to submit for publication.