
Abstract
Measurement invariance of the Beck Depression Inventory-Second Edition across race (Blacks and Whites) was examined in a sample of university students, from two universities from diverse geographical areas of South Africa (N = 870). Multigroup confirmatory factor analysis (i.e., means and covariance structures) was used to test the factorial invariance of the hierarchical four-factor structure, composed of three first-order factors (i.e., Negative Attitude, Performance Difficulty, and Somatic Complaints) and one second-order general factor (Depression) found with South African students. Evidence of measurement invariance was established at the level of configural, metric, and scalar invariance. However, there were some evidence of differential additive response style across race—with two non-invariant intercepts (Item 5 and 14) being identified. Results also revealed significant latent mean differences favoring Black students on the Performance Difficulty and Somatic Complaints factors but not on the Negative Attitude factor. Findings suggest that the Beck Depression Inventory-Second Edition provides an assessment of the severity of depressive symptoms that is equivalent across race in university students.
The Beck Depression Inventory-Second Edition (BDI-II) is a commonly used measure of depressive mood by both clinicians and researchers in South Africa (see Kagee, Nel, & Saal, 2014; Pillay & Sargent, 1999; Steele & Edwards, 2008; Stellenberg & Abrahams, 2015; Vawda, 2014; Westaway & Wolmarans, 1992). In research, the instrument is mostly used in studies on inter-group variances in the processes and levels of depression or exploring variables associated with depressive symptoms (e.g., Hambrick et al., 2010). While research on comparative processes relates to differences in intra-group predictors of depression, studies of comparative levels focus on variances in between-group means. Inherent in both types of studies is the assumption that the BDI-II measures equivalent constructs in exactly the same manner across the concerned groups, that is, the scale is measurement invariant. If the instrument does not operate invariantly across groups, any conclusions on between-group differences may be artifactual and misleading (Byrne, Stewart, Kennard, & Lee, 2007; Cheung & Rensvold, 2002).
While there is some literature on the reliability and validity of the BDI-II in South Africa (e.g., Kagee et al., 2014; Steele & Edwards, 2008), little is known about its measurement invariance (MI). MI (i.e., the degree to which items or subtests have equivalent meaning across groups of examinees) is one method used to gather score validity evidence and to appraise construct-irrelevant variance (e.g., group affiliation). The testee’s score should not depend on construct-irrelevant variance. The likelihood of consequential mistakes is high, if conclusions are made for individuals on a test in the absence of MI (Cheung & Rensvold, 2002). Observed score differences can either represent true group mean differences or variances in the relation between the construct and the observed score that is not equivalent across groups (Cheung & Rensvold, 2002).
The few studies that have evaluated MI of the BDI-II across race or ethnicity have mainly displayed/found two patterns of results (i.e., full invariance and partial invariance). For example, Byrne et al. (2007) tested factorial invariance of the BDI-II across Hong Kong and American adolescents and found evidence of MI across the two cultures. Similar results were also reported with Chinese and European North American university students (Byrne & Stewart, 2006; Dere et al., 2015; Whisman, Judd, Whiteford, & Gelhorn, 2013). Whisman et al. (2013) found evidence for MI in the context of the hierarchical four-factor structure of the BDI-II between Whites and racial (Blacks and Asians) or ethnic (Latinos) minority groups. Hambrick et al. (2010) found little evidence for differential item functioning on BDI-II items between White and African American undergraduate students using item response theory (IRT). Lin (2012) also confirmed factorial invariance of the BDI among three racial/ethnic groups (i.e., non-Hispanic Blacks, non-Hispanic Whites, and Hispanic cardiac patients) of post-myocardial infarction patients.
Azocar, Arean, Miranda, and Munoz (2001) analyzed the BDI items for bias between Spanish and English speaking patients and their results supported MI of the BDI model, although with evidence of differential additive response style (ARS). Another study on the BDI in a sample of low-income non-Hispanic Blacks supported MI of their model (Grothe et al., 2005). Their findings also showed that non-Hispanic Blacks were less likely to endorse the item reflecting suicidal thoughts than non-Hispanic Whites. Similarly, there is some inconsistent evidence of mean differences on the BDI-II across groups defined by race or ethnicity (e.g., Hambrick et al., 2010). However, Carmody (2005) investigated item bias in the endorsement of symptoms on the BDI-II among White, Asian, and Latino Americans. In his study, White American students scored higher on three items (BDI-II Items 11, 14, and 17) than did Hispanic and Asian American students.
Hooper, Qu, Crusto, and Huffman (2012) using IRT and confirmatory factor analysis (CFA) examined scalar invariance with a sample of college students in the United States. Results from the analyses indicated that the items endorsed by Black American and White American college students were slightly different. In total, 23% of the items on the BDI-II functioned differently based on at least one comparison method (i.e., CFA or IRT). More specifically, for these race-related comparisons, symptom endorsement varied on five BDI-II items: Items 7, 8, 14, 15, and 21. Therefore, 5 items functioned differently, and 16 of the items functioned similarly in these racial group comparisons.
Given the limited research on the MI of the BDI-II, more studies are necessary to explore this issue further, particularly in the African context. Accordingly, the purpose of the current study was to examine the MI (i.e., configural, metric, and scalar invariance) and latent mean differences of the BDI-II across race in a South African university sample.
Method
Participants
A purposive sample of 870 students (Mage = 21.70 years, standard deviation [SD] = 13.51, 70% female) was selected from both the University of Limpopo (46%) and the University of Pretoria (54%). The inclusion criteria were as follows: (1) undergraduate university students, (2) command of English, and (3) predominantly White university and predominantly Black university (4) race. Besides accessibility, sampling from the institutions ensured that we had a heterogeneous sample (i.e., race and socio-economic status [SES]) which also approximated the ones used in previous studies on the BDI-II (Beck, Steer, & Brown, 1996; Byrne, Stewart, & Lee, 2004). The overwhelmingly female (72%) sample, while a concern, is not surprising given the sampling strategy used and the undergraduate enrollment rates of the two South African universities. For instance, the Department of Higher Education and Training’s (2011) Statistics on Post-School Education and Training in South Africa reports that female students comprise 54% of all students enrolled in contact programs at the University of Limpopo and 60% of all students enrolled in contact programs at the University of Pretoria. This part of the sample characteristics is given a detailed treatment in the Methodology section. The data consisted of undergraduate students from faculties of Humanities, Natural Sciences, Statistics, Law, and Management Sciences. In total, 67% of the participants identified themselves as ‘Black’, while 33% said they were ‘White’. The mean score (11.45; SD = 7.74) of the sample on the total BDI-II is outside the symptomatic range of the BDI-II suggested by Beck et al. (1996).
Instruments
BDI-II
The BDI-II is a 21-item self-report questionnaire (Beck et al., 1996) used to measure the severity of depressive symptoms in adolescents and adults. The respondent receives a score of 0–3 for each item; the total raw score is the sum of the 21 items, with the highest possible score of 63. The Cronbach’s alpha of the measure was .84 in this current study. Its correlations with clinical scales of depressive symptoms from measures such as the Minnesota Multiphasic Personality Inventory (MMPI) are normally in the range of r = .60 to .76 (Conoley, 1992).
Procedure
Participants were recruited from undergraduate classes at both the University of Limpopo and the University of Pretoria. The aim of the research was explained and instructions on completing the questionnaire were also given. After obtaining written consent from the students, the instrument was administered to them in English and in group format outside of their normal university hours. The instrument was self-administered, while seating arrangements ensured that confidentiality was preserved. The students were not compensated for taking part in the study, and they were debriefed at the end of the data collection session.
Ethical considerations
Ethical approval for the study was granted by the research and ethics committees of the University of Limpopo and University of Pretoria, respectively. All students consented (orally and in written form) to participation in the research. Taking part in the study was voluntary, while confidentiality and anonymity were assured.
Data analysis
The structural equation modeling (SEM) analysis was divided into two stages using the EQS 6.1 program (Bentler, 2007). Factorial invariance was based on multigroup confirmatory factor analysis (MCFA) (i.e., means and covariance structures [MACSs]) (Whisman et al., 2013; Wu, 2009, 2010). The robust maximum likelihood estimation method (Yuan–Bentler scaled method; Yuan & Bentler, 2000) was justified and employed since the BDI-II data represented a non-normal distribution (i.e., item-level skewness > 1.5 and item-level kurtosis > 2.5; Mardia multivariate kurtosis = 184.21; c.r. = 89.69). Given that the data comprise of responses from university students (i.e., a non-clinical population), evidence of both skewness and kurtosis is indeed not unexpected and is consistent with other BDI studies of community samples in general and adolescents in particular (e.g., Byrne, Baron, Larsson, & Melin, 1995; Byrne et al., 2004; Koenig, Isaacs, & Schwartz, 1994; Roberts, Lewinsohn, & Seeley, 1991). Hence, this aspect of the data should be of little concern.
However, given these distributional characteristics, what is imperative is that analyses be based on the correct statistics, that is, they should be based on algorithms designed to take this non-normality into account. The scaled chi-square and “robust” standard errors using maximum likelihood (ML) estimation is a method suggested by Satorra and Bentler (1988, 1994). This method has proven to be a good general approach for addressing nonnormality (Curran, West, & Finch, 1996; Hu, Bentler, & Kano, 1992), as opposed to the alternative of bootstrapping (for correcting standard errors), which is still indeterminate as to how well it performs under various conditions (e.g., specific bootstrapping approach and sample sizes) (Nevitt & Hancock, 2001). Adjustments to the chi-square, relative fit indices, and standard errors are based on weight matrix derived from an estimate of multivariate kurtosis. EQS 6.1 provides the option of using robust statistics, instead of the regular statistics for addressing this multivariate non-normality problem. Moreover, the robust maximum likelihood estimation method is a common method for addressing non-normal distribution in the BDI-II literature (see Byrne et al., 2007; Whisman et al., 2013; Wu, 2010; Wu & Huang, 2014 for examples).
The hypothesized hierarchical four-factor structure of the BDI-II composed of three first-order factors (i.e., Negative Attitude [NA], Performance Difficulty [PD], and Somatic Complaints [S]) and one second-order general factor (Depression), established in university students is presented in Figure 1. This CFA model follows from a rigorous validation of the BDI-II across Black and White South African non-clinical students (see Makhubela & Mashegoane, 2015) and is consistent with past research on obtained factor structures in American and Chinese college student samples (e.g., Byrne et al., 2007). The model was used to determine the baseline model (i.e., separately for the race groups and the total sample). This second-order model is supported by theory and evidence of substantial mean correlations (NA, PD = .76; NA, S = .78; PD, S = .83) across groups (Makhubela & Mashegoane, 2015). As such, this model serves as a more parsimonious structure of the BDI-II for non-clinical students. Preliminary models (across race groups) converged on the same hierarchical factor structure obtained in previous studies (e.g., Byrne et al., 2007; Makhubela & Mashegoane, 2015; Whisman et al., 2013). After this baseline model was shown to be consistent with the data, the analyses then proceeded to test the equivalence of this model across race groups, using a series of ordered steps (see Byrne, 2006; Chen, Sousa, & West, 2005). Results of MI and MACS analysis were reported based on the following multiple criteria: the Yuan–Bentler scaled Chi-square test (Y–Bχ2) < 1.5 (χ2/degrees of freedom [df]) < 1.5 (Yuan & Bentler, 2000), comparative fit index (CFI) ⩾ .95, standardized root mean-square residual (SRMR) ⩽ .05, and root mean-square error of approximation (RMSEA) ⩽ .06 and its 90% confidence interval (CI) (Hu & Bentler, 1999).
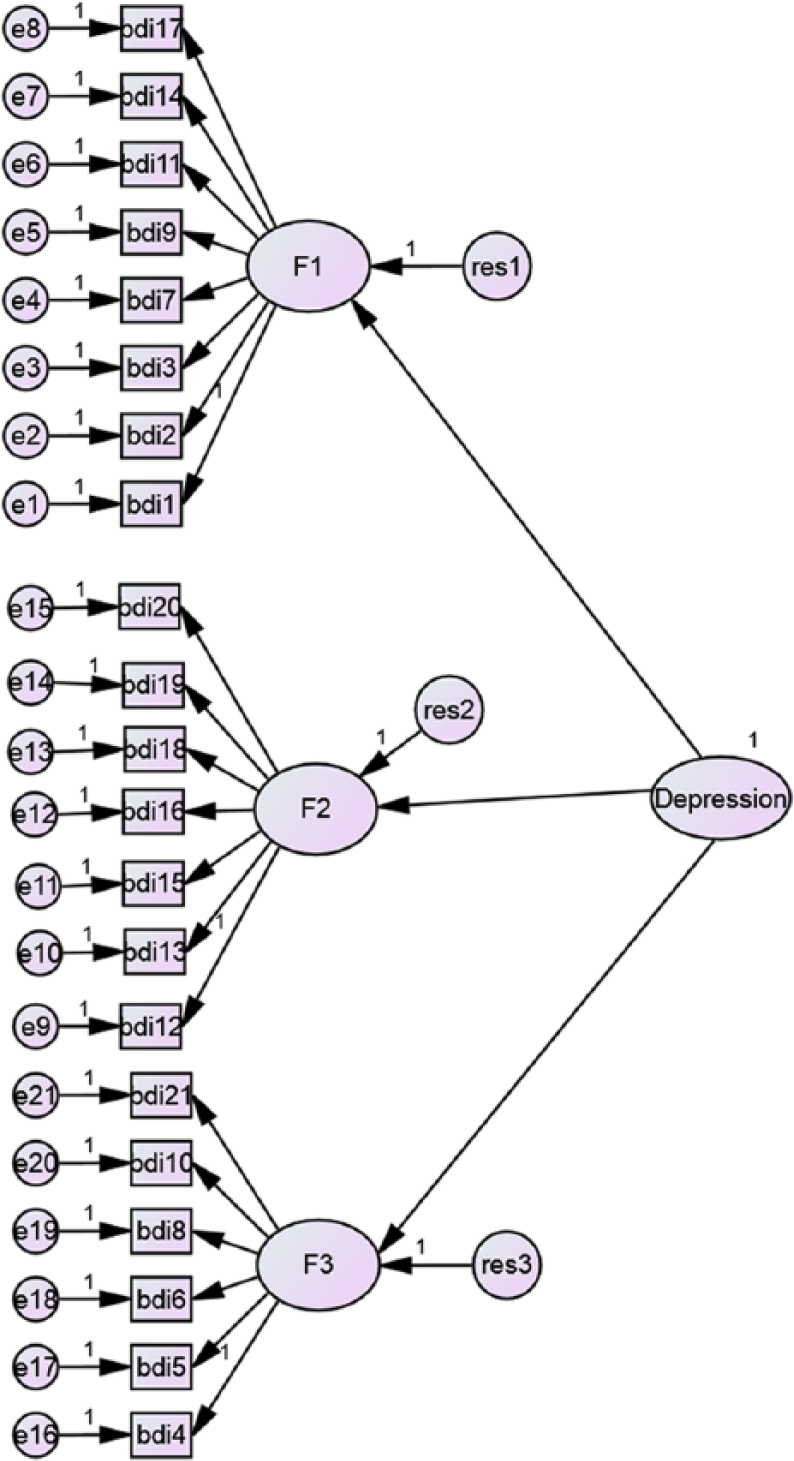
Hypothesized hierarchical second-order model.
Given this baseline model, the tenability of invariance across race groups was examined by fitting a series of increasingly restrictive models. The tenability of each restriction was evaluated based on the differences in fits between the restricted model and the less-restricted model (Δ*CFI & Δ*RMSEA) (Chen, 2007; Cheung & Rensvold, 2002). Given the support for MI, the MACSs were separately estimated to test latent mean differences for each latent construct by means of setting the latent mean value to zero for Blacks and freely estimating for Whites. The differences between the latent means were evaluated on the basis of the z statistic (Wald’s significance test) (Aiken, Stein, & Bentler, 1994; Hancock, 2001). Latent mean differences are preferable than observed mean scores when evaluating race differences on depression. The latter confounds factor and indicator variance, while the former is calculated by controlling for measurement error (Cheung & Rensvold, 2000). The extent of confounding may have significant effects on observed mean differences.
Results
Measurement invariance
In Table 1, tests of the hypothesized BDI-II structure, the configural model, revealed a good fit to the data for both Blacks and Whites (Y–Bχ2[369] = 448.66; *CFI = .96; SRMR = .04; *RMSEA = .02, with 90% CI = .01–.02). All factor loadings were viable and statistically significant. This indicates that Blacks and Whites have an equivalent basic conceptualization of depression. This model serves as the baseline against which all remaining models are compared in the process of determining evidence of invariance. Furthermore, all MCFA results for MI across race, show that all the four nested models represented a good fit to the data (*CFIs = .95–.96, SRMRs = .04–.06, *RMSEAs = .02–.04). Model 2 (metric invariance), in which all lower-order factor loadings were equally constrained, also represented a good fit to the data with a resulting Δ*CFI and Δ*RMSEA values of 0. The satisfaction of metric invariance implies that all items of BDI-II have equal salience for Blacks and Whites.
Goodness-of-fit statistics for tests for invariance of BDI-II hierarchical structure for Blacks and Whites.
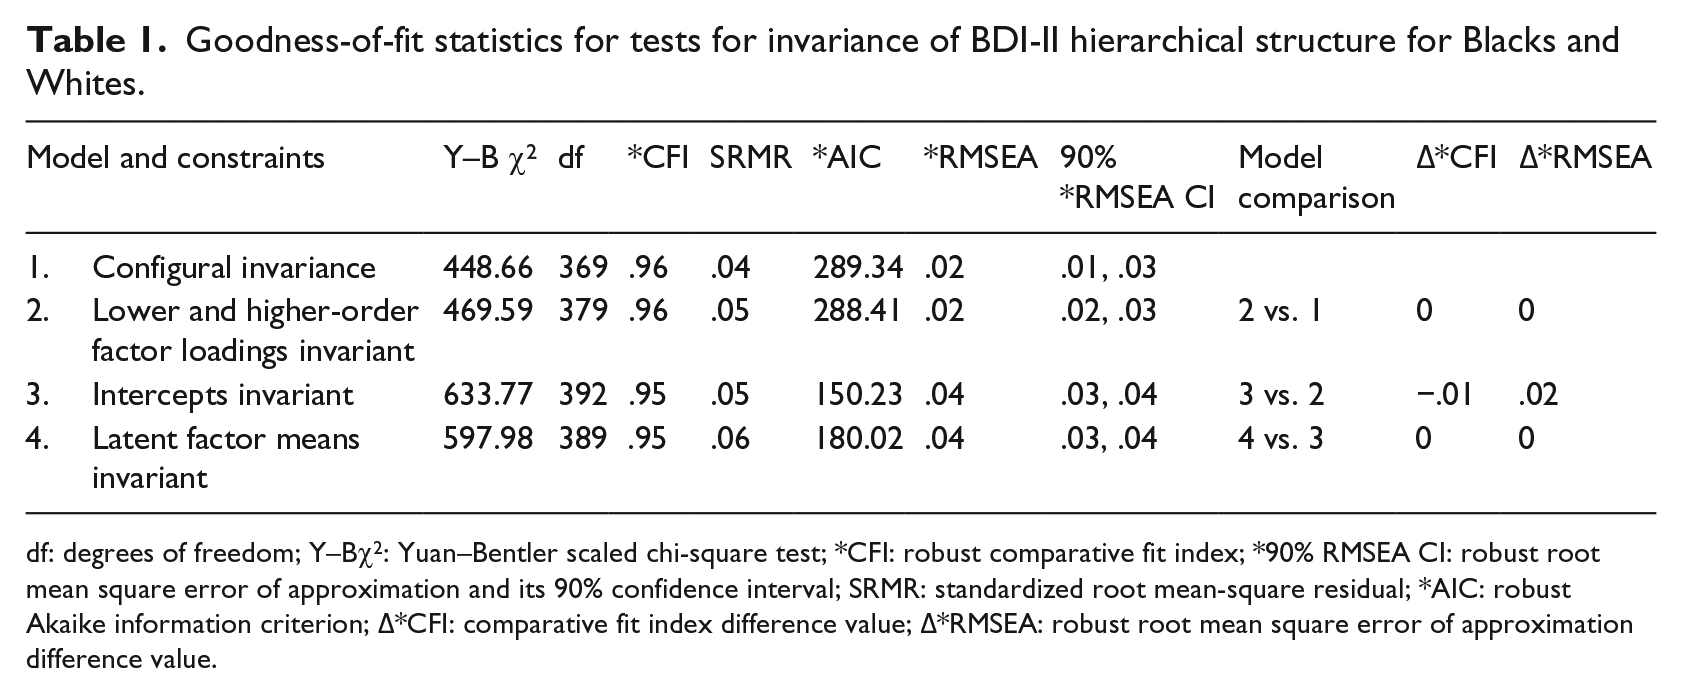
df: degrees of freedom; Y–Bχ2: Yuan–Bentler scaled chi-square test; *CFI: robust comparative fit index; *90% RMSEA CI: robust root mean square error of approximation and its 90% confidence interval; SRMR: standardized root mean-square residual; *AIC: robust Akaike information criterion; Δ*CFI: comparative fit index difference value; Δ*RMSEA: robust root mean square error of approximation difference value.
Model 3 (scalar invariance) additionally constrains the intercepts to be equal between groups, thus forcing equality of the variances/covariance matrices between the races. Once again, results yielded a good fit and Δ*CFI value of .01. Likewise, for the final remaining model tested, the multigroup model retains the same good fit and the Δ*CFI value never exceeds .01. However, scalar invariance was achieved by removing two constraints of intercepts (Item 5 and 14) (see Table 2). The findings of two non-invariant intercepts implied that there is differential ARS bias (Cheung & Rensvold, 2000) for the BDI-II across race groups. That is, Whites systematically endorse higher item responses in Item 14, while Blacks do the same for Item 5. Nonetheless, consistent with Cheung and Rensvold’s (2002) and Chen’s (2007) recommendations, we consider this model to exhibit evidence of invariance across the two race groups.
The intercepts of non-invariant items in Model 3 across race.
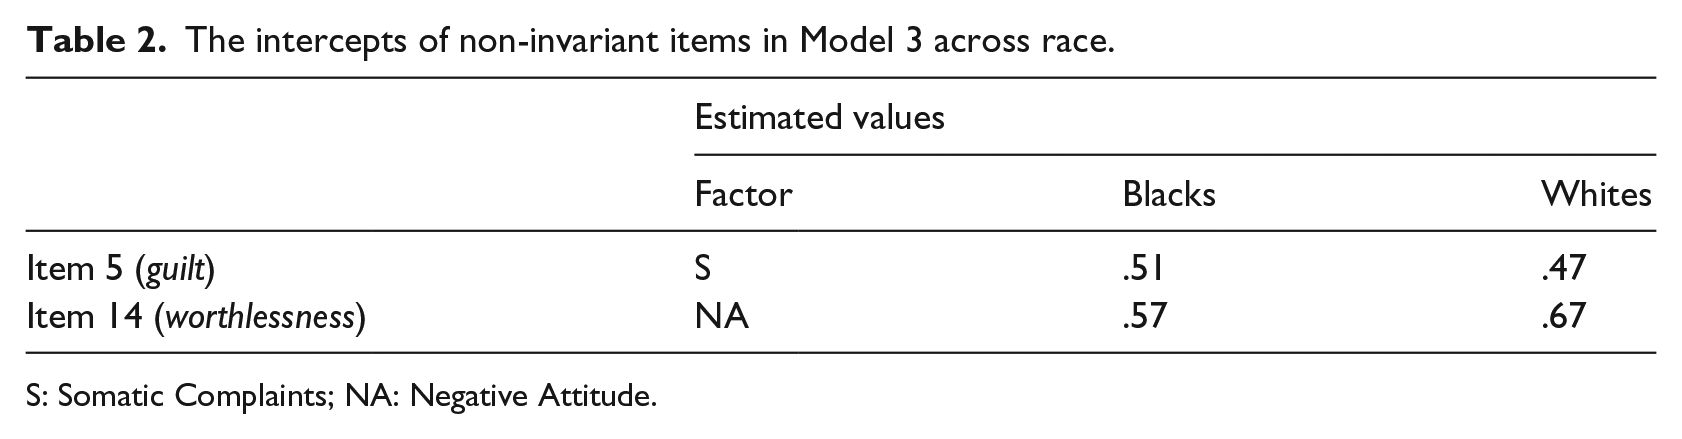
S: Somatic Complaints; NA: Negative Attitude.
Latent mean difference
As seen in Table 3, there were no significant latent mean differences on the NA factor (z = −.23, p > .05, d = .06) between the race groups. However, latent mean differences on the PD factor (z = 4.16, p < .05, d = .41) and the S factor (z = 3.74, p < .05, d = .66) were significant, with Blacks endorsing higher scores (see Cohen, 1988).
Differences between Blacks and Whites on latent constructs.
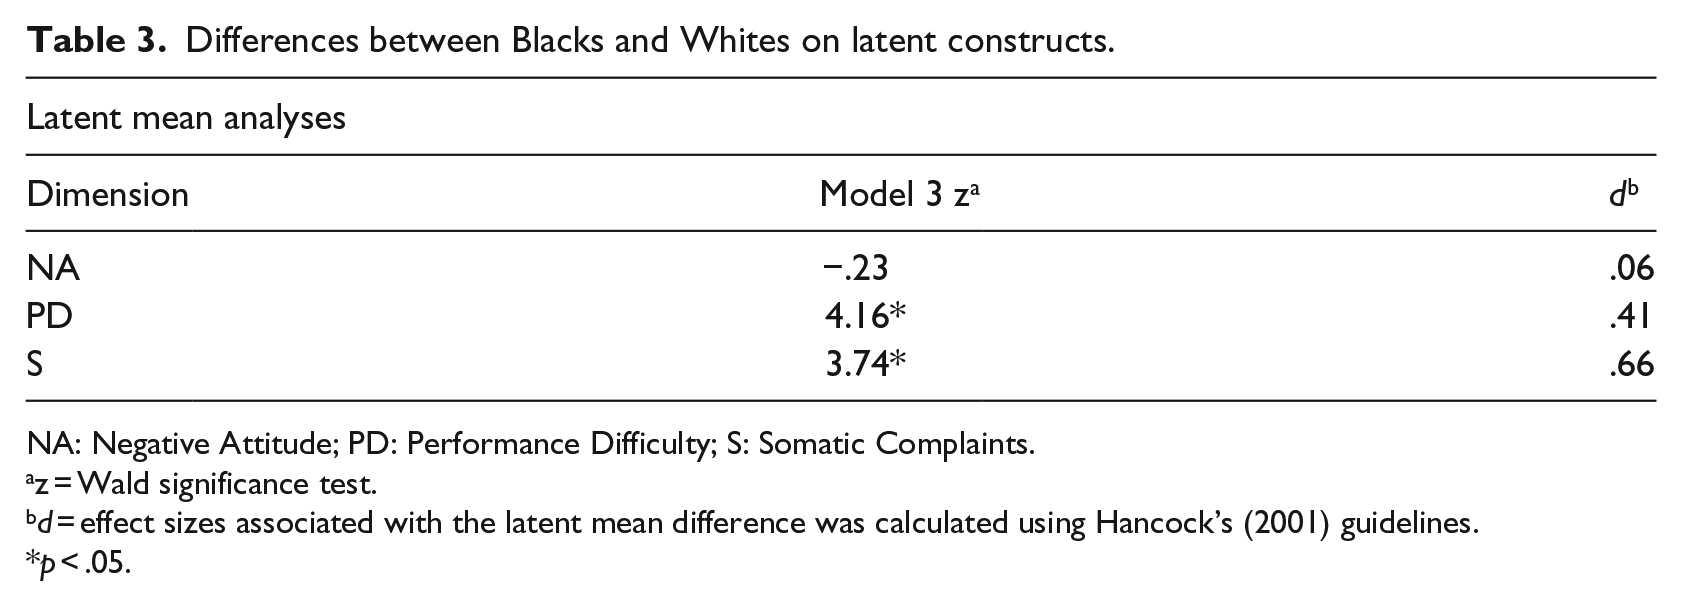
NA: Negative Attitude; PD: Performance Difficulty; S: Somatic Complaints.
z = Wald significance test.
d = effect sizes associated with the latent mean difference was calculated using Hancock’s (2001) guidelines.
p < .05.
Discussion
As far as the researcher is aware, this study is the first to establish MI of the BDI-II across race groups in South Africa. Evidence of MI in the context of the hierarchical four-factor structure of the BDI-II across race was found. MI was established at the level of configural, metric, and scalar invariance. Specifically, across models in which there was increasingly restricted parameterization on the variance/covariance matrices of the indicators, there was consistent evidence that the hierarchical four-factor structure provided robust fit with the data. Furthermore, the Δ*CFI and Δ*RMSEA values for comparisons between models 1 (configural model), 2, 3, and 4 were all negligible.
Scalar invariance was established with two non-invariant item intercepts for race (Items 5: guilt and 14: worthlessness), providing empirical evidence of construct validity for the BDI-II for purposes of making race latent mean comparisons. These findings of two non-invariant intercepts across race implied that there is differential ARS bias (Cheung & Rensvold, 2000) for the BDI-II across these groups. That is, Blacks systematically endorse a relatively higher item response in Item 5, whereas Whites systematically endorse a higher item response in Item 14. The presence of differential ARS of the BDI-II in the current study confirms Wu’s (2010) findings. Moreover, these findings are consistent with the established empirical evidence in South Africa, which shows that, while certain core symptoms of depression are encountered across the different cultures, it is also true that depressive symptomatology often has unique manifestations in some of these cultures as a result of social and cultural differences (Mosotho, Louw, Calitz, & Esterhuyse, 2008). According to Hassim and Wagner (2013) culture exerts pathogenic, psychoselective, psychoplastic, patho-elaborating, psychofacilitating, and psychoreactive effects to the experience of psychopathology. As such, culture modifies and modulates the expression and the structured manifestation of depressive symptoms in South African race groups (see Schlebusch, 2005).
This pattern of results is corroborated by the majority of sub-Saharan African studies that have established that depression in Blacks is predominantly characterized by feelings of guilt and somatic presentations (Bhuti & Mohamud, 2003; Hollifield, Katon, Spain, & Pule, 1990; Patel, Abas, Broadhead, Todd, & Reeler, 2001; Reynolds & Swartz, 1993; Rogers, 1992; Swartz, 1998; Tomlinson, Swartz, Kruger, & Gureje, 2007). Steele and Edwards (2008) report that in South Africa, Xhosa-speaking respondents are more troubled by guilt than any other symptom of depression. Similarly, four studies conducted among Sesotho-speaking depression patients in the Free State province also reported that participants expressed feelings of guilt more than any other depressive symptoms (Jordaan & Joubert, 1994; Mosotho et al., 2008; Rossouw, 1998). In their interpretative review of selected literature, Tomlinson et al. (2007) reported that guilt as a symptom of depression has been a source of cultural variation in Africa.
Although the presence of racial differences in depressive symptoms is well-known, the direction and explanations for the differences are complex and at times unclear (Nolen-Hoeksema, Larson, & Grayson, 1999). An array of social, cultural, and personality reasons for greater vulnerability of certain races to specific depressive symptoms have been offered. For instance, the level of Westernization has often been associated with variations in the manifestation of depression. People from Western cultures are said to psychologize their depression (i.e., emotional and cognitive report of distress), whereas people from non-Western cultures are said to somatize their depression (i.e., report distress in the form of bodily complaints and physiological symptoms) (Canino, Rubio-Stipec, Canino, & Escobar, 1992).
A more psychological report of depression has also been found among more Westernized groups of non-Western societies (Kwang-Iel, Dongen, & Dae-Ho, 1999). Somatization of depressive symptoms has been observed in various non-Western cultures, such as in South Africa (Ngcobo & Pillay, 2008), Nigeria (Abiodun, 1995), China (Kwang-Iel et al., 1999), and United Arab Emirates (Hamdi, Amin, & Abou-Saleh, 1997). Therefore, that the endorsement of guilt (Item 5) should be higher for Blacks than Whites in the current study is inconsistent with other depression research (i.e., socialization literature) in reporting the tendency of Blacks to somatize than psychologize. However, this finding is consistent with research reporting no significant demographic differences between people who tend to somatize and those who psychologize (Blazer, Landerman, Hays, Simonsick, & Saunders, 1998; Razali & Hasanah, 1999).
A possible explanation for this direction in difference can be the fact that South Africa is more Westernized/acculturated, and therefore, we expected that evaluations of self by Blacks, as measured by the BDI-II, would necessarily reflect the worldview espoused by the society. This finding, of higher guilt in Blacks, is also contradictory to the implication of external locus-of-control beliefs in Blacks in the explanation of depression symptoms across cultures (see April, Dharani, & Peters, 2012; Lambert, Herman, Bynum, & Ialongo, 2009; Sanchez, Lambert, & Ialongo, 2011). An external locus-of-control in Blacks is attributed to the fact that Blacks have limited opportunities as an economic minority group in South Africa (Hamad, Fernald, Karlan, & Zinman, 2008). So, theoretically, Blacks are expected to report more feelings of being punished and less self-blame (Bhagwanjee, Parekh, Paruk, Petersen, & Subedar, 1998; Hamad et al., 2008; Pillay & Sargent, 2003; Rumble, Swartz, Parry, & Zwarenstein, 1996; Strebel, Msomi, & Stacey, 1999).
However, the stronger endorsement of Item 14 (worthlessness) by Whites than by Blacks is consonant with the literature, in that Whites typically psychologize their depression. This may also be attributed to the fact that people in individualistic cultures may be more in tune with their private emotional states, while those socialized in collectivistic cultures are more responsive to the promotion of the well-being of their in-group and thus emotions are used more discreetly (Canino et al., 1992). Accordingly, emotional states are a more immediate and significant source for the self-efficacy appraisals of individuals raised in idiocentric systems than in allocentric cultures.
The evidence of scalar invariance also implies that clinicians and researchers can use the BDI-II with greater confidence given the generalizability of the instrument’s properties between Black and White university students in South Africa. Contrary to most previous studies investigating race differences on overall depression (e.g., Hankin et al., 1998; Schuch, Roest, Nolen, Penninx, & de Jonge, 2014), the present study examined group differences at specific factor levels. Results revealed significant latent mean differences that favored Blacks in terms of PD and S factors. The results on differential race endorsements of items are explainable if we consider that people from non-Western cultures, especially Black South Africans, tend to somatize their depression (i.e., report affect in the form of bodily complaints and physiological symptoms) (Canino et al., 1992; Halbreich et al., 2007; Reynolds & Swartz, 1993; Rochat, Tomlinson, Barnighausen, Newell, & Stein, 2011; Rogers, 1992; Swartz, 1998; Tomlinson et al., 2007).
The present study found two non-invariant intercepts across race (Item 5 and 14) in the BDI-II with negligible effects on latent mean differences. Although scalar invariance properties of the BDI-II across race groups are established, practitioners are urged to interpret race differences corresponding to these non-invariant item intercepts with restraint. These intercepts failed to display equivalent measurement across race groups, suggesting that these items overestimated the corresponding factor for one group. In that regard, the item depicting guilt overestimated its respective factors for Blacks, whereas that depicting worthlessness overestimated its factor for Whites.
Conclusion
Since factorial invariance was obtained for analyses constraining factor structure and loadings, these results suggest that it is also appropriate to compare correlates of depressive symptoms across groups (Whisman et al., 2013). These findings corroborate past research on the MI of the BDI-II within student populations across race (Byrne, Baron, Larsson, & Melin, 1996; Byrne et al., 2007; Campbell, Roberti, Maynard, & Emmanuel, 2009; Hooper et al., 2012; Whisman et al., 2013; Wu, 2010; Wu & Huang, 2014). It can therefore be concluded that the BDI-II appears to measure depressive mood equivalently across Black and White student respondents in South Africa. However, the reported findings are not without limitations. Given that the sample was overwhelmingly female (72%) and also restricted to university students, this precludes the possibility to generalize the results to other populations.
Footnotes
Funding
The author(s) received no financial support for the research, authorship, and/or publication of this article.