
Abstract
During the 2015 Canadian federal election, political parties were polarized over the issue of job satisfaction in the public service. Critics and public service unions argued that there was a toxic environment under the leadership of Prime Minister Stephen Harper, and Liberal leader Justin Trudeau promised, if elected, to remedy this toxicity. Therefore, the job satisfaction of federal employees was a campaign promise of the now elected Liberals. Improving job satisfaction is not simple, as there are many competing factors impacting it. This study measures job satisfaction of Canadian public servants in 2014 and concludes that job satisfaction remained fairly high across the board, even under Stephen Harper, and that by far the strongest predictor of job satisfaction is how well employees’ interests match their job, followed by the relationship with their immediate supervisor, relationships with colleagues, and skills. Thus, human resource management policies are essential in improving job satisfaction.
Introduction
Over the past 5 years in the Canadian political landscape, there have been numerous calls for rejuvenating the federal public service due to toxic work cultures and a general disrespect for public servants (Fekete, 2014; Jeffrey, 2015; May, 2016). Much of this was directed at the Conservative government under Stephen Harper, so much so that prior to the 2015 election, Canada’s largest public service union engaged in an extensive anti-Harper, anti-Conservative Party ad campaign. While the ads did not advocate voting for any particular party or candidate, they were distinctly against Stephen Harper and the Conservative Party, and included online and radio commercials, billboards, posters, as well as interviews from PSAC (Public Service Alliance of Canada) representatives (Woods, 2015). Furthermore, knowledge of this poor working environment spurred Liberal leader Justin Trudeau to pen an open letter to all public servants promising a change to improve levels of respect and morale if elected (Trudeau, 2015).
With the election of Trudeau and his Liberal party in 2015, and these accusations of excessively low morale in the public service under the Conservative government of Stephen Harper (2006-2015), improving morale and the overall job satisfaction of employees is certainly relevant to policy makers. According to the literature, an increased focus on job satisfaction can yield both utilitarian and humanitarian benefits (Ellickson, 2002; Spector, 1997; Westover & Taylor, 2010; Yang & Lee, 2009). From a purely utilitarian perspective, lower levels of job satisfaction have impacted organizations negatively through increased absenteeism (Johns, 1987) and turnover (Hur, 2013; Locke, 1976; Pitts, Marvel, & Fernandez, 2011; Yang & Lee, 2009). From a more humanitarian perspective, concern with job satisfaction involves the belief that employees deserve to be treated well and with respect. This in turn can lead to better levels of physical and emotional well-being for employees (Spector, 1997). In other words, improving job satisfaction can lead to higher levels of organizational performance and lower costs, something public sectors around the world are actively seeking to achieve. These reasons ring particularly true in the Canadian federal public service, which has made job satisfaction a focal point in the past to improve morale and performance, as seen with La Relève in the 1990s. Briefly, La Relève was a package of public sector rejuvenation policies under the direction of Clerk of the Privy Council Jocelyne Bourgon and Prime Minister Jean Chrétien designed to reduce public sector employees’ discontent, frustration, and even crisis of identity after years of cuts and downsizing (Johnson & Molloy, 2009).
Job satisfaction has been studied extensively across the world. Generally, the seminal text on job satisfaction is traced back to Happock in 1935 (Reiner & Zhao, 1999; Schyns & Croon, 2006; Taylor & Westover, 2011), with an increase in studies over the last 40 years (Ellickson, 2002; Westover & Taylor, 2010). Similarly, job satisfaction has been examined at length in Canada, but primarily in the health field, with a focus on nurses (see Barrett & Myrick, 1998; Best & Thurston, 2006; Cummings et al., 2008; Graham, Davies, Woodend, Simpson, & Mantha, 2011) physicians (see Lloyd, Streiner, & Shannon, 1994; Richardsen & Burke, 1991), and care professionals (see Grunfeld et al., 2000; Krueger et al., 2002). Other studies in the Canadian context focused on the role of union membership and job satisfaction (Renaud, 2002); the relationship between job satisfaction and high-involvement work design across Canadian industries (Mohr & Zoghi, 2008); the relationship between various immigrant groups and job satisfaction (Magee & Umamaheswar, 2011); as well as the differences in job satisfaction factors between senior level managers in public and private sectors (Jabes & Zussman, 1988). At least one study has been published using earlier versions of the Public Service Employee Surveys (PSES), and although it includes satisfaction in its description, it operationalizes satisfaction through career satisfaction, workplace pride, and organizational commitment, which are all distinct from job satisfaction as operationalized here (Hickey & Bennett, 2012).
While these studies have undoubtedly provided valuable information on job satisfaction in these fields, one must be careful in generalizing these to other positions and organizations, as studies have shown that organizational environment is important in determining the antecedents of job satisfaction (Spector, 1997; Taylor & Westover, 2011; Westover & Taylor, 2010). Therefore, this study seeks to expand the understanding of job satisfaction in the Canadian context by focusing on the Canadian federal public service as a whole. As such, this article will seek to answer the following questions using the 2008-2014 PSES: Under Prime Minister Stephen Harper, how satisfied are Canadian federal public servants in general with their jobs? Has the level of job satisfaction changed over time from 2008 to 2014? Which characteristics are the most likely to impact levels of job satisfaction? Upon answering these questions, this article will then explore some potential policy implications for Canadian policy makers.
Job Satisfaction and Hypotheses
A widely accepted definition of job satisfaction in academic literature is the “pleasurable or positive emotional state resulting from the appraisal of one’s job or job experience” (Locke 1976, p. 1300; see also Glisson & Durick, 1988; Westover & Taylor, 2010; Wright & Kim, 2004). Furthermore, “[j]ob satisfaction is commonly defined as the extent to which employees like their work. It is an attitude based on employee perceptions (negative or positive) of their jobs or work environments” (Ellickson, 2002, p. 344). This definition will be used for the purposes of this article, as it clearly reflects a measurement of employees’ own personal perceptions of their job, measured in terms of how much they like their job. This is clearly reflected in the dependent variable here (job satisfaction), measured by the question “Overall, I like my job.”
In the academic literature, variables affecting job satisfaction have been divided into two categories, one based on personal demographic characteristics, and the other on work environment characteristics (Ellickson, 2002; Reiner & Zhao, 1999). Work environment has been further divided into two groups: job characteristics and organizational characteristics (Glisson & Durick, 1988; Silver, Poulin, & Manning, 1997; Ting, 1997). Based on this previous research in the field, this study will test a series of independent variables that examine all three aforementioned groups: personal characteristics, job characteristics, and organizational characteristics.
Personal Characteristics
It has been noted in the literature that job and organizational characteristics generally have stronger impacts on job satisfaction than personal characteristics (Ellickson, 2002; Glisson & Durick, 1988; Reiner & Zhao, 1999; Steijn, 2012; Taylor & Westover, 2011) and that many personal characteristics such as age, gender, visible minority status, and education level have conflicting effects on job satisfaction, with some studies reporting positive effects, some showing negative effects, and others demonstrating no statistically significant effects of these variables on job satisfaction. That said, these personal characteristics have been found significant in certain work environments and therefore they will be investigated here, as there is limited work completed like this in the Canadian context. Thus it is necessary to examine them as predictors of levels of job satisfaction.
The first characteristic to be investigated is gender. As noted above, researchers have reported mixed findings on the link between gender and job satisfaction. For instance, some studies report no effect of gender on job satisfaction (Ellickson, 2002; Glisson & Durick, 1988; Silver et al., 1997; Ting, 1997), others report men are more satisfied than women (Chiu, 1998), and still others have found women more satisfied than men (Armentor & Forsyth, 1995; Bae & Yang, 2017; Bender, Donohue, & Heywood, 2005; Carleton & Clain, 2012; Clark, 1997; Kim, 2005; Pitts, 2009). Some of these differences have been attributed to organizational environment, where country, sector, and organization may have an impact. For instance, Sousa-Poza and Sousa-Poza (2000) found that men in most countries were more satisfied than women with their jobs, but this was reversed in a few countries, with the greatest differentials being Great Britain, the United States, Hungary, and New Zealand (Canada was not examined). Varying explanations have been provided for this. Some have posed the notion that perhaps women in Anglo-Saxon countries are more satisfied with their jobs than other countries (Kim, 2005); others have argued that women are more satisfied with their jobs due to their relative expectations of the labor force (Clark, 1997). A further explanation is that marriage can mediate satisfaction—Married women are more satisfied because they have more choice in whether or not to work for pay (Carleton & Clain, 2012). Based on the work of Kim (2005) and the increasing number of studies that are showing women with higher levels of job satisfaction than men (Bae & Yang, 2017; Carleton & Clain, 2012), it is hypothesized as follows:
A second personal characteristic to be investigated is age. Again, the literature is somewhat inconclusive on this matter, with some studies reporting age as insignificant in relation to job satisfaction (Ellickson, 2002; Glisson & Durick, 1988; Silver et al., 1997), while others have found age to be a significant predictor of job satisfaction, generally with older employees being more satisfied than younger employees (Glenn, Taylor, & Weaver, 1977; Lee & Wilbur, 1985; Ting, 1997), (but only for lower level employees; Bae & Yang, 2017; Westover & Taylor, 2010). The reasoning behind older employees being more satisfied with their jobs than their younger counterparts has generally been linked to a better person–organization fit (Lewis, 1991), or more traditional work-oriented values (Wright & Hamilton, 1978), as well as longer tenure in the public service, which can come with benefits such as higher levels of job security, respect, pay, and autonomy (White & Spector, 1987; Wright & Hamilton 1978). A lot of these reasons are explained by socioemotional selectivity theory, which argues that individuals will seek to maximize their gains and minimize losses in terms of social and emotional aspects (Carstensen, 1992; Ng & Feldman, 2010). Over time, older employees will make decisions that lead them to jobs which better fulfill their social and emotional needs and therefore will be more satisfied with those jobs than their younger counterparts (Carstensen, 1992; Ng & Feldman, 2010). Given this, it is hypothesized as follows:
The third personal characteristic investigated here is level of education. Again, this variable has received mixed results in relation to job satisfaction, sometimes being found insignificant (Glisson & Durick, 1988; Reiner & Zhao, 1999; Silver et al., 1997; Steijn, 2012; Ting, 1997), sometimes with a positive relationship (Bae & Yang, 2017; Glenn & Weaver, 1982; Hsieh, 2016), and others with a negative relationship (Lok & Crawford, 2004; Naff & Crum, 1999). The positive relationship between education level and job satisfaction is argued to be due to the fact that higher education often leads to extrinsic benefits such as higher incomes as well as higher prestige, in addition to intrinsic benefits such as more personally rewarding jobs, and thus leads to an overall higher level of job satisfaction (Glenn & Weaver, 1982; Hsieh, 2016). Alternatively, the negative relationship between level of education and job satisfaction has been linked to heightened levels of job criticism by employees, and thus lower levels of job satisfaction (Glenn & Weaver, 1982). Based on the assumption that higher levels of education will lead to higher intrinsic benefits, it is proposed as follows:
The final personal characteristic to be tested here is visible minority status. Although this has been tested in numerous ways, most often as “race,” this characteristic tends to have more of a consensus as a predictor of job satisfaction, with many studies reporting nonminorities having higher levels of job satisfaction than racial minorities (Naff & Crum, 1999; Pitts, 2009; Silver et al., 1997; Ugorji, 1997). That said, this relationship is not cut and dry, as a study of the link between various immigrant groups and job satisfaction in Canada found that visible minority status was not a consistent predictor of lower job satisfaction, but rather that country of origin had more of an impact (Magee & Umamaheswar, 2011). The potential explanations for the relationship between these two variables are that minorities share different beliefs than their nonminority counterparts (Magee & Umamaheswar, 2011), that minorities are treated differently than nonminorities (Ugorji, 1997), or that minorities experience more feelings of deprivation or discrimination than nonminorities (Moch, 1980; Ugorji, 1997). For instance, in one U.S. study, African Americans reported significantly higher levels of career impeding behaviors such as being steered away from applying for promotions, penalized for disagreeing with supervisors, given unfavorable references, and stronger feelings of inadequacy (among others) than their white counterparts (Ugorji, 1997). This uneven treatment of minorities then led to lower levels of job satisfaction. In a study of U.S. federal employees, Pitts (2009) found racial minorities to be less satisfied than their white counterparts. However, once diversity management was controlled for, racial minorities actually became more satisfied than white employees where strong diversity management was perceived. Given Canada’s limited approach to diversity management (Canada focuses more on passive equal employment opportunity diversity policies), it is hypothesized as follows:
Job Characteristics
There are two general types of job characteristics according to the literature: intrinsic, which commonly are related to job content and task, such as skills, training, and interests; and extrinsic, which are related to tangible benefits like pay and promotion (Herzberg, 1966; Taylor & Westover, 2011). More specifically, intrinsic characteristics are feelings of rewards based on competence and responsibility derived from job tasks (Jabes & Zussman, 1988; Westover & Taylor, 2010). On the contrary, extrinsic benefits can be described as investments used by employers to bolster connections between employees and their organizations (Ellickson, 2002; Westover & Taylor, 2010). Characteristics of both will be discussed below.
The first intrinsic characteristic to be tested is skill utilization, or skill fit. “Skill utilization refers to the degree to which jobs allow individuals to utilize their skills and abilities” (Ting, 1997, p. 314). It is argued that skill utilization is a powerful predictor of job satisfaction because skills are a component of self-identity, which in turn impacts how capable an individual views themselves to be (O’Brien, 1982). In essence, if an employee feels that their skills fit with their job, then their overall level of job satisfaction will increase because their feelings about their own competencies are assured (O’Brien, 1982). In various studies on federal public service employees across the world, but particularly in Canada and the United States, skill utilization has been found to have a strong, positive impact on job satisfaction (Jabes & Zussman, 1988; Ting, 1997). In fact, in Ting’s, 1997 study of U.S. federal governmental employees, skill utilization was actually the most important factor in determining an employee’s job satisfaction. Therefore, it is hypothesized as follows:
A second job characteristic predictor of job satisfaction is somewhat related to skill utilization: job training. Job training “is systematic development of the knowledge, skills, and expertise required by a person to effectively perform a given task or job” (Schmidt, 2007, p. 483). While training can lead to skills, it is distinct in that it provides other elements and distinguishes between innate or previously acquired skills, and skills learned on the job. Job training here pertains explicitly to training within the workplace related specifically to one’s job. For instance, in addition to giving new, job-specific skills, training can also provide knowledge as well as shifts in attitudes to better understand organizational goals and missions (Jones, Jones, Latreille, & Sloane, 2009; Schmidt, 2007). It is argued that such on-the-job training can lead to increased job satisfaction because it increases employees’ perceived job security and autonomy, as well as making the employee feel valued (Jones et al., 2009). Conversely, it is argued that organizations with a lack of training or tools will lead to organizational obstacles and/or constraints to doing one’s job adequately, and thus will be associated with lower levels of job satisfaction (Ellickson, 2002). This can be referred to as human resource development, which focuses on reducing dissatisfaction with one’s job by “reducing skill-related impediments to job performance” (Wright & Davis, 2003, p. 74). Therefore, it is hypothesized as follows:
Another stream of job satisfaction literature focuses on interests. This line of argument is based on the notion that “the better aligned a job is with a post holder’s attitudes, values, and preferences, the higher job satisfaction is likely to be” (Homberg, McCarthy, & Tabvuma, 2015, p. 712). Interests, it has been argued, when aligned with one’s job, also referred to as interest–occupation congruence, can positively impact job satisfaction based on the rather commonsense argument that interests impact vocation choice, and when one has a position in their desired vocation, they are more likely to be satisfied with that position (Swaney & Prediger, 1985; Wiener & Klein, 1978). Hence, it is hypothesized as follows:
This study will directly test one extrinsic characteristic: opportunities for promotion. Ting (1997) found that a lack of opportunity for promotion was linked to lower job satisfaction. Similarly, Ellickson (2002) and Taylor and Westover (2011) reported that more promotional opportunities positively affected job satisfaction. A justification for this is that employees who are content with extrinsic factors such as pay and promotional opportunities will realize that the cost of leaving their job is higher than those who are not as satisfied with these factors, which thus reinforces the notion that they will develop positive feelings and satisfaction toward their jobs (Ting, 1997).
Pay has been noted to have a positive relationship with job satisfaction in the public sector (Armentor & Forsyth, 1995; Ellickson, 2002), although this relationship is generally stronger in the private sector (Armentor & Forsyth, 1995). The PSES does not have a variable for pay, salary, or income; therefore no hypotheses will be made regarding this variable. However, given the potential effects of omitted variable bias, a proxy variable for pay using occupational level will be used to account for potential overestimation. Given that the Canadian federal public service has fairly regimented pay scales for various positions, it is possible to make assumptions about occupational status and pay. For instance, it is clear that an administrator will make less than an employee in the executive level (rates of pay for various positions can be obtained through various pages on the Treasury Board of Canada Secretariat website). Thus, in this case, it is believed that including a proxy variable is better for the overall results because it is a sufficiently close, albeit crude measurement of the unmeasurable variable (pay), and therefore the overall bias will be smaller than if the variable was excluded entirely (see Frost, 1975; Gujarati, 2004).
Organizational Characteristics
Aside from characteristics specifically related to one’s job, characteristics attributable to the broader organizational environment have also been found to impact an employee’s level of job satisfaction (Ellickson, 2002; Glisson & Durick, 1988; Reiner & Zhao, 1999; Taylor & Westover, 2011). While these can vary, two characteristics will be examined here—an employee’s relationship with their coworkers, and an employee’s relationship with their supervisor. The relationship between an employee and their immediate supervisor has been examined in a number of different ways, from a broader working relationship between the two (Ting, 1997; Westover & Taylor, 2010), to the competence of a supervisor (DeSantis & Durst, 1996), managerial competence (Ko & Hur, 2014), as well as effective communication between the two (Kim, 2002), among others. All of the aforementioned studies found a positive relationship between employee/supervisor relationship and job satisfaction. The importance of supervisor/employee relations on job satisfaction was further echoed by Taylor and Westover (2011) who found that this relationship, along with intrinsic workplace attributes, was the most prominent predictor of job satisfaction. Thus, it is hypothesized as follows:
Similarly, work environments where one has positive relationships with coworkers have also been found to have a positive impact on job satisfaction (DeSantis & Durst 1996; Taylor & Westover, 2011; Ting, 1997; Westover & Taylor, 2010). While the reasoning and mechanisms for this can vary, it is suggested that friendlier workplace relationships can increase personal satisfaction as well as an employee’s attitude toward their job (Mao, Hsieh, & Chen, 2012). Therefore, it is hypothesized as follows:
Method
This study uses data from the three most recent cycles (2008, 2011, and 2014) of Public Service Employee Survey administered by the Office of the Chief Human Resources Officer of the Treasury Board of Canada Secretariat. The survey has been disseminated every three years since 1999 to federal public servants to measure their opinions on employee engagement, leadership, the workforce, and the workplace. The primary focus of this study is the 2014 Survey, principally due to its relevance to the current political climate. That said, some information from both the 2008 and 2011 surveys was utilized to provide a discussion of the level of job satisfaction over time, as well as to test the validity of the 2014 findings. Both frequency distributions and ordinary least squares (OLS) regression will be employed to answer the research questions. Both of these aspects, obtaining data through surveys and analyzing it using descriptive statistics and OLS regression, are commonplace in job satisfaction studies, thus justifying their usage here (see Ellickson, 2002; Kim, 2005; Reiner & Zhao, 1999; Ting, 1997; Westover & Taylor, 2010). Furthermore, OLS regression has been justified in the past for a Likert-type scale, based on the assumption that respondents are usually capable of understanding that the difference between Strongly Disagree and Somewhat Disagree are roughly the same as the difference between Somewhat Agree and Strongly Agree (Westover & Taylor, 2010).
All variables and their indicators are listed in Appendix C. As noted above, the dependent variable being tested here is job satisfaction measured on 5-point Likert-type scale response to the question “Overall, I like my job.” All variables, including independent and dependent, are reported on a 0-1 scale. The 2014 survey was a voluntary census sent to all active employees, with a response rate of 71.4%, and an N of 182,165. Active employees is a very comprehensive list, including permanent, indeterminate, seasonal, and student employees. Those who are not considered eligible are those on unpaid leave, those who have been contracted out, as well as some Ministerial staff. As the survey responses are not random, a survey weight was used for frequency distributions, with a normalized weight employed for regression modeling. As per Statistics Canada (2015), the “weight for the Public Service Employee Survey is calculated so that the respondent and population distributions have the same overall distribution with respect to the department/agency and the aggregate occupational group.”
Results
First, in comparing the level of job satisfaction across the three surveys, there is an observed decrease in mean satisfaction over time. Although this decrease is rather small over time, it shows a downward trend during Stephen Harper’s tenure in office. That said, satisfaction, even at its lowest point in 2014, still remains relatively high, with a mean of 4.05 on a 5-point scale, with 5 being strongly agree.
Moving away from a comparison of satisfaction over time, this will now turn exclusively to the most recent 2014 survey to discuss the explanatory variables impacting job satisfaction in the Canadian public service. The following descriptive statistics mirror in order the above mentioned hypotheses. This allows for a cursory understanding of the relationship between the explanatory variables related to personal characteristics and the expected outcomes prior to formal hypothesis testing. Only personal characteristics are presented here both for expediency and also because the literature remains quite inconclusive as to these relationships.
Concerning the first hypothesis (women will report higher levels of job satisfaction than men), Table 2 demonstrates such a pattern. Here, 8.6% either “strongly” or “somewhat” disagree that their job brings them satisfaction compared with 10.1% of men. Moreover, 80.9% of women “somewhat” or “strongly” agree that their job brings them satisfaction compared with 77.6% of men. While not a large difference, it is nevertheless clear that there are a higher proportion of women who agree that their job brings them satisfaction compared with their male counterparts. This is an encouraging first step toward confirming the first hypothesis.
Table 3 demonstrates how much those in each age group are satisfied with their jobs. Table 3 shows that there exists a confirmatory pattern concerning the second hypothesis, that older employees are more likely to report higher levels of job satisfaction than younger employees. However, this should be interpreted with caution, as the relationship is not entirely linear. Among those below 29 years of age, 79.7% “somewhat” and “strongly” agreed that they were satisfied with their jobs, compared with 77.3% for their 30- to 39-year-old counterparts, 78.5% for those 40 to 49 years old, 81% for 50 to 59 years old, 85.4% for those over 60 years old. Like Table 1 demonstrates, the overall level of job satisfaction is quite high, and it does appear that satisfaction does increases with age.
Overall, I Like My Job.
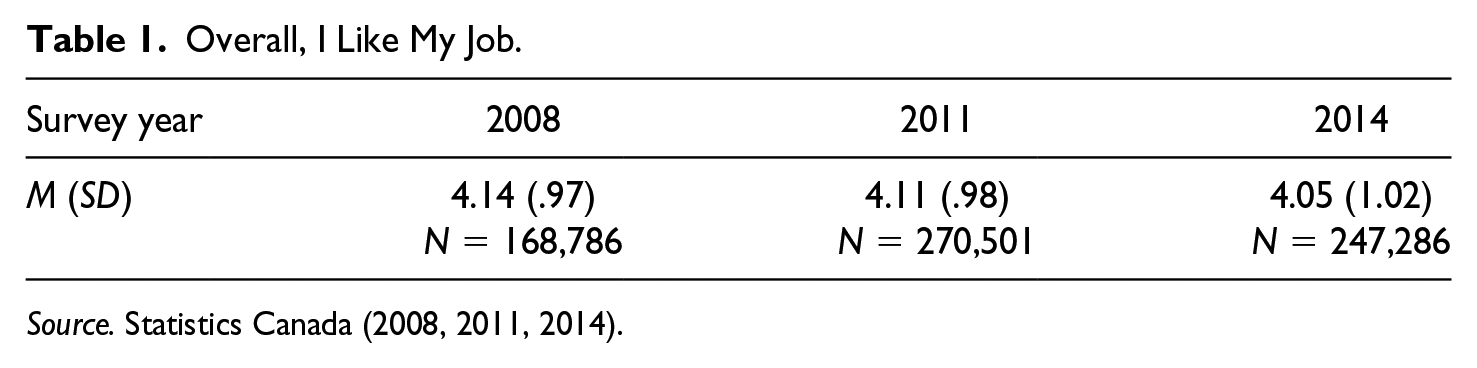
Source. Statistics Canada (2008, 2011, 2014).
Table 4 demonstrates more mixed results than do Tables 2 and 3. Table 4 demonstrates job satisfaction by educational attainment. While this article initially hypothesized that higher levels of education will lead to higher levels of job satisfaction; Table 4 shows that the highest level of satisfaction is concentrated among those with “high school or less” followed by “diploma/CEGEP” education. Moreover, rightward shifts in education see a lesser amount of satisfaction than those with less educational attainment, until the most educated category, those with more than a bachelor’s degree, which is slightly higher than their university certificate and bachelor’s degree counterparts. This thus casts doubt on the third hypothesis.
Job Satisfaction by Gender.
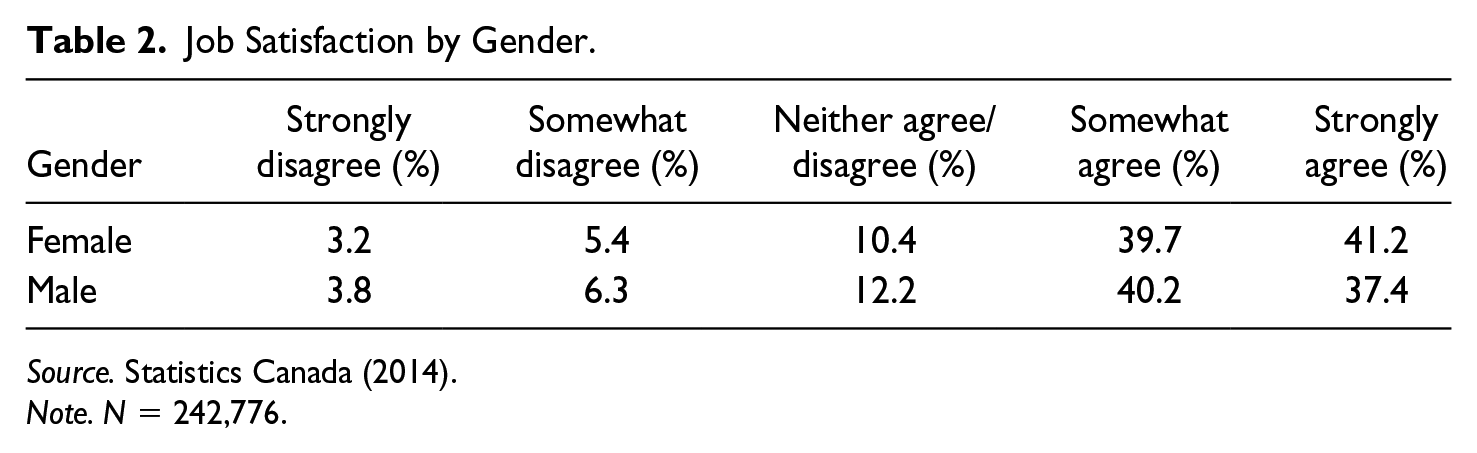
Source. Statistics Canada (2014).
Note. N = 242,776.
Job Satisfaction by Age Group.
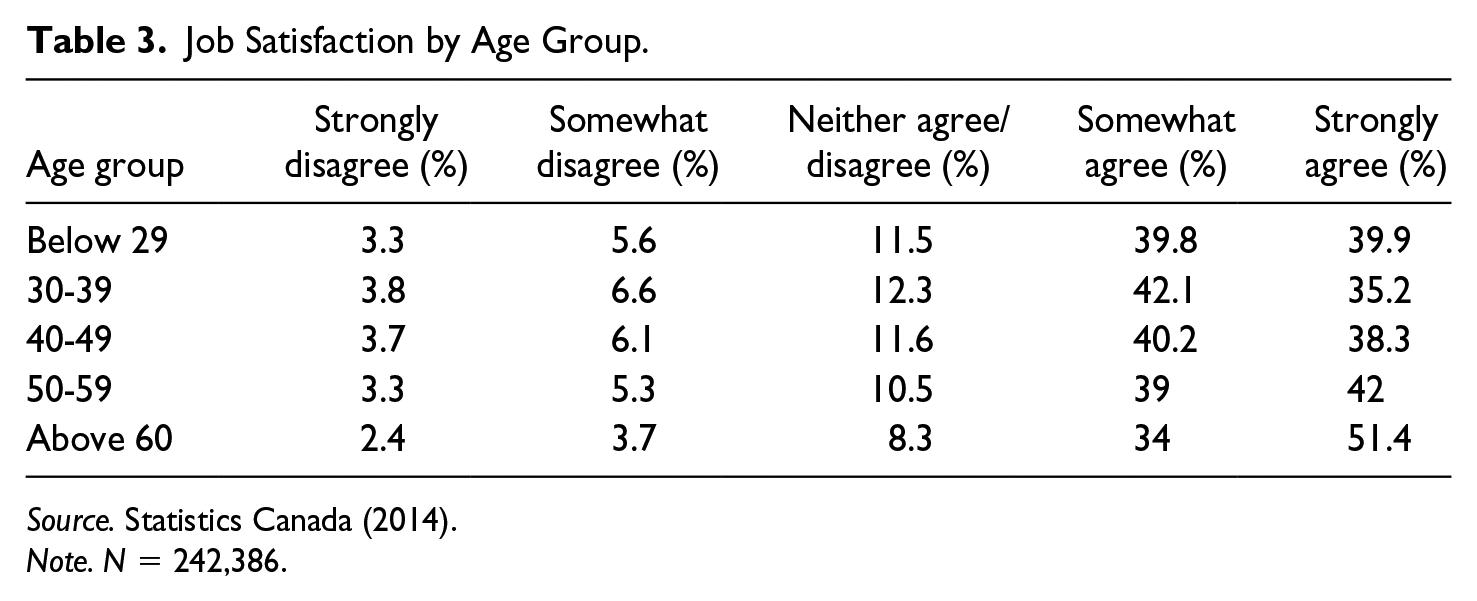
Source. Statistics Canada (2014).
Note. N = 242,386.
Job Satisfaction by Educational Attainment.
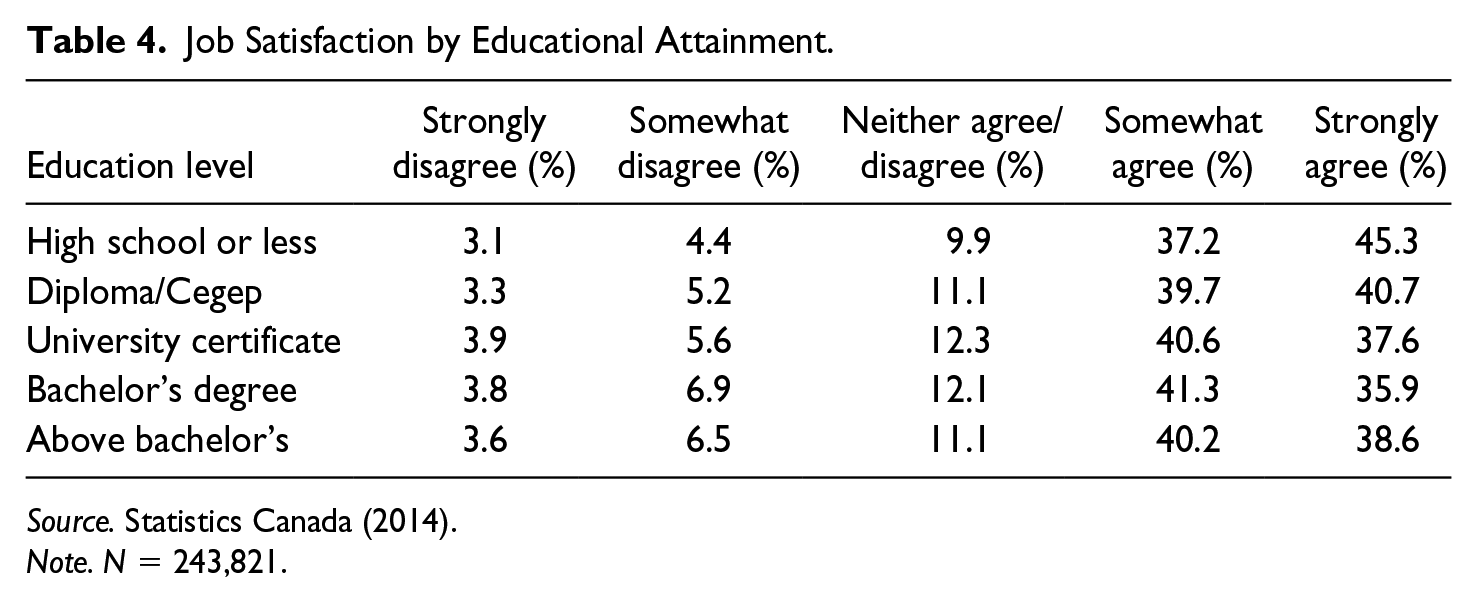
Source. Statistics Canada (2014).
Note. N = 243,821.
Table 5 demonstrates job satisfaction by visible minority status. There is little difference between visible and nonvisible minorities concerning overall job satisfaction. Roughly 79% of both groups “somewhat” or “strongly” agree that their jobs give them satisfaction. This thus casts doubt on the hypothesis that those not identifying as visible minorities will be more satisfied with their jobs.
Job Satisfaction by Visible Minority Status.
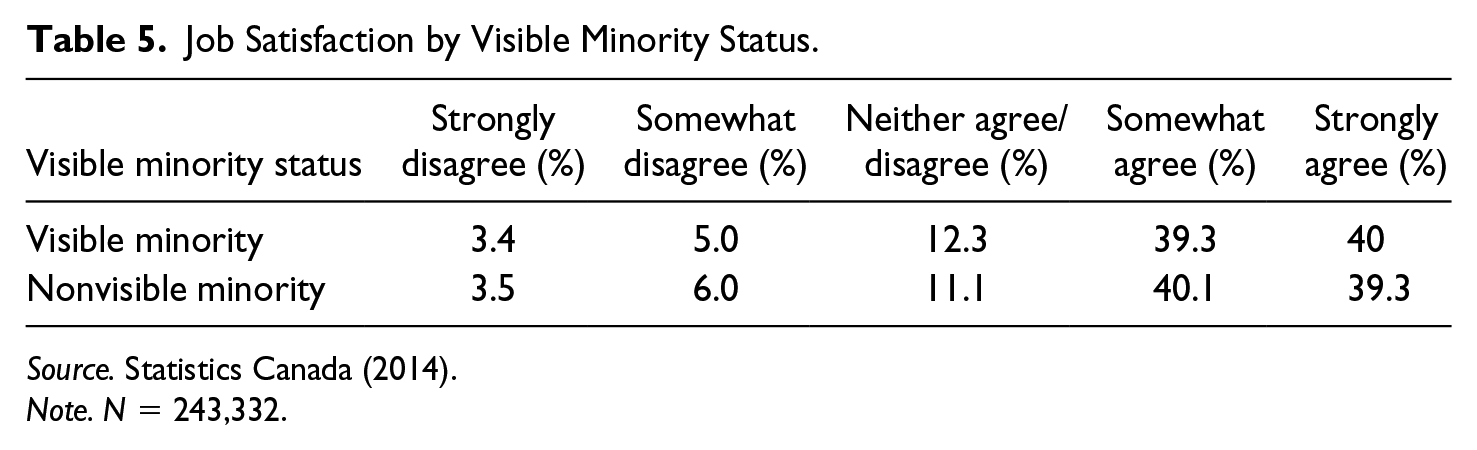
Source. Statistics Canada (2014).
Note. N = 243,332.
Overall, we have confirmatory evidence for two of four hypotheses on the relationship between personal characteristics. Furthermore, across all categories, job satisfaction remains quite high, which seems to indicate that most Canadian public servants, even under Prime Minister Stephen Harper, generally enjoy their job. The next step, however, is entering the covariates in a regression model to determine both significance and strength of the relationships.
Table 6 demonstrates the OLS regression where the standardized job satisfaction variable serves as the dependent variable. Job satisfaction was regressed on age, gender, education, a dummy variable for visible minorities, interests, skills, training, promotion opportunities, supervisor relationship, and coworker relationship. Because salary has been linked to job satisfaction, a control for salary is included. However, because the PSES does not report respondent salary, the model uses an employment scale as a proxy variable for salary.
OLS Regression (Dependent Variable: “Overall, I Like My Job”).
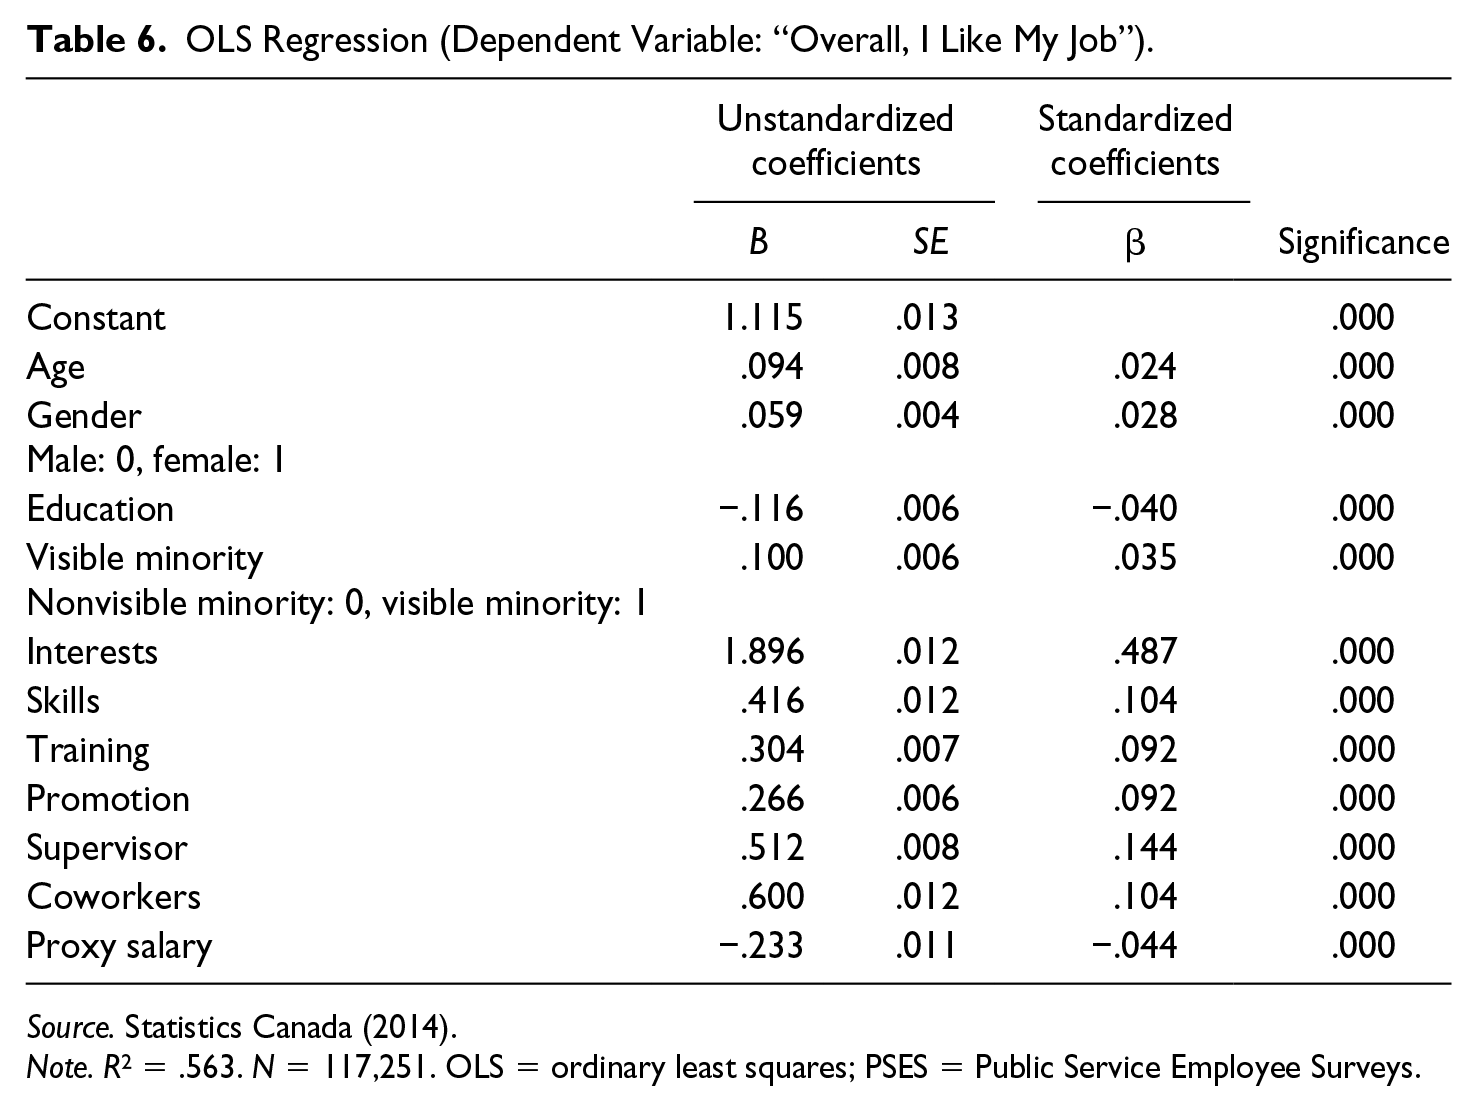
Source. Statistics Canada (2014).
Note. R2 = .563. N = 117,251. OLS = ordinary least squares; PSES = Public Service Employee Surveys.
All of the covariates are statistically significant allowing us to reject the null for all hypotheses. The largest predictor of job satisfaction is the “interest” variable with a corresponding standardized beta coefficient of 0.487. Here, nominally shifting one’s interest from one point on the Likert-type scale to the next, such as from strongly disagree to somewhat disagree is associated with roughly a full point increase on the same scale in job satisfaction. Per Table 6, interests are the strongest determinants of job satisfaction and is in line with H7. The seventh hypothesis is therefore accepted.
Views on the respondents’ relationship with their supervisor have the second largest coefficient. Table 6 demonstrates a positive relationship between relationship with supervisors and job satisfaction. H9 is therefore accepted. Both skills and relationships with coworkers maintain the same direction and coefficient strength. Positive views toward one’s skills and coworkers are associated with increased job satisfaction. Thus, H5 and H10 are accepted.
Similarly, both training and promotion variables, like skills and coworkers, maintain the same direction and coefficient strength. Here, one unit changes in attitudes toward being well trained and having promotional opportunities are associated with increased job satisfaction. Therefore, H6 and H8 are accepted.
The remaining coefficients present mixed results for the hypotheses. The standardized beta coefficients concerning age, gender, and visible minorities are relatively small. While we can say that these relationships are positive, meaning that job satisfaction increases with age, that women are more satisfied than men, and visible minorities are more satisfied than their nonvisible minority counterparts, the differences appear to be existent but minimal. Thus, in line with the descriptive tables above, H1 and H2 still hold true, while H4 does not. While we can accept the associated hypotheses with these covariates, it is worth qualifying the findings by demonstrating that the strength of the relationships are minimal.
The third hypothesis—that those with higher levels of education will be more satisfied with their jobs—is not accepted. Although the standardized beta coefficient is quite small, the direction of the coefficient is negative indicating that as educational attainment increases, job satisfaction in fact decreases. In sum, all variables measuring personal characteristics maintained their significance, thus indicating that personal characteristics do affect job satisfaction in the Canadian federal public service, albeit with weak relationships.
Overall, even when controlling for salary, we can accept eight of the 10 hypotheses (H3 and H4 are rejected). The salary control variable maintains significance and represents a negative relationship with job satisfaction. That is, increased pay is associated with a decrease in overall job satisfaction. This is not unsurprising for a public sector study: Pay in the public sector has often been noted to lack the same kind of importance and impact as in the private sector (Armentor & Forsyth, 1995; Houston, 2000; Rainey, 1982). Again, no inferences will be made about this relationship provided that it is a proxy and not a direct measurement of pay or salary. It is believed that withholding salary from the model would have resulted in larger beta coefficients and would bias the results, and, given its significance, the choice to include the salary control is reaffirmed. Furthermore, multicollinearity diagnostics were performed, with all variance inflation factors below 2.5, thus providing further confidence in findings. See Appendix B.
Discussion
This analysis can have implications for policy and decision makers in the Canadian federal context. First, the overall job satisfaction level across all three survey years was quite high, with the mean response being just above 4 on a 5-point Likert-type scale. Thus, some of the claims of a significantly unsatisfied workforce are unfounded and should not invoke the rhetoric of crisis as occurred under La Relève. However, the results do indicate that job satisfaction can be improved, given that job satisfaction has decreased under Prime Minister Stephen Harper, from a mean of 4.14 in 2008 to 4.05 in 2014. Unfortunately, the 2005 PSES did not ask this question, so a pre-Harper measure is not available. In addition to indicating that job satisfaction may have decreased slightly under Harper, these results also narrow down the variables that are most likely to have the biggest impact on job satisfaction in the Canadian federal public service.
The variable with the strongest relationship to job satisfaction is interests. This fits with the general trend in the literature that for public sector employees, intrinsic benefits tend to be more important than extrinsic ones (Taylor & Westover, 2011). In fact, all three intrinsic variables had stronger explanatory power than the highest ranking extrinsic factor, promotional opportunities.
The fact that all job and workplace characteristics are significantly related to job satisfaction and that all are stronger predictors of job satisfaction than personal characteristics implies that human resource policies are, and will continue to be, important in maintaining and improving the level of job satisfaction in the Canadian public service. Simply chalking up job satisfaction variations to gender, age, race, or education level is unwarranted. This is important information for managers throughout the public service in organizations looking to improve job satisfaction: A multifaceted approach is needed. That is, when hiring new employees, the focus should not only be on matching a potential hire’s skills with their position (which is important) but also ensuring that their interests align with the job they are applying for. The same is true for promotions within the public service—A combination of matching skills as well as interests to jobs could increase overall job satisfaction. Furthermore, the work environment itself must be made sufficiently hospitable by fostering positive relationships between employees and their immediate supervisors and across coworkers in work units, providing sufficient levels of training, and indicating that promotional opportunities are available to employees.
Furthermore, this is an indication that other organizations perhaps should focus more on these intrinsic benefits and fitting jobs to interests of new employees. While Canada does have some unique aspects to its public service, like using abilities in Canada’s official languages (English and French) as a point of merit when hiring (Kübler, Kobelt, & Andrey, 2011; Turgeon & Gagnon, 2013a, 2013b), as well as having a unique four characteristic focus on hiring (Aboriginals, women, people with disabilities, and visible minorities are prioritized in hiring), Canada is not unlike many other public sectors around the world. Therefore these lessons may very well be extrapolated to other organizations.
In terms of personal characteristics, the fact that women are slightly more satisfied than men is interesting and fits with a growing trend in the literature, known as the “paradox” of gender and job satisfaction (Kim, 2005; Sousa-Poza & Sousa-Poza, 2000). It is widely established that although the gap has been closing over the past few decades, women still tend to be in jobs with less pay, autonomy, and promotional opportunities than men, which should lead to women being less satisfied (Chiu, 1998; Kim, 2005; Sousa-Poza and Sousa-Poza, 2000). Yet, as noted above, numerous studies have recently found contexts where women are more satisfied than men. According to Kim (2005, p. 673), women tend to place more value on “facets as working conditions, work itself, supervision, coworkers, personal growth, job security, and worth of providing public service,” whereas men tend to be more focused on extrinsic factors.
Another key finding in this article is that visible minorities reported slightly higher levels of job satisfaction than nonminorities, which runs counter to much of the literature. This is not anomalous to the 2014 study—this same relationship was found in the 2011 PSES survey (see Appendix A) as well, although the difference between the two was weaker than 2014. It is possible that this is due to the efforts of the federal government to create a more inclusive workplace, which has increased the percentage of visible minorities both in the public service as a whole, as well as in executive positions from 2012 to 2015 (Treasury Board of Canada Secretariat, 2015). Indeed, in a similar study in the United States of federal public service employees, racial minorities reported higher levels of job satisfaction than their white counterparts when in the presence of strong diversity management policies (Pitts, 2009). Examining the link between diversity policies and job satisfaction in the Canadian public service could shed further light on this issue.
Limitations
This study has a few limitations. The first is that all survey respondents self-reported their levels of job satisfaction. While this may be a practical way to measure one’s perception of job satisfaction, it could be an inaccurate interpretation of the actual objective working conditions (Schyns & Croon, 2006; Taylor & Westover, 2011). That said, given than job satisfaction is related to how employees feel, perception can be argued to be more important than objective conditions (Schyns & Croon, 2006).
Another limitation of this study is related to the variables that were excluded from the study. For instance, as noted above, other variables such as pay have been found to have significant effects on job satisfaction (Armentor & Forsyth, 1995; Ellickson, 2002; Taylor & Westover, 2011; Ting, 1997), yet a question measuring this was not included in the PSES. While this study used a proxy for income, it certainly is not ideal nor as clearly delineated as a salary variable could be. Had such a question been available in the PSES, it would have been examined here, but because it was not, it is possible that there is some omitted variable bias in the results. Similarly, public service motivation was not tested, again due to the availability of the questions that were asked by the PSES. Traditionally, public service motivation is comprised of some or all of the following variables: attraction to public policy-making, commitment to the public interest, civic duty, social justice, compassion, and self-sacrifice, and these motivations can then impact performance (Naff & Crum, 1999; Perry, 1996, 1997). Thus it would be interesting to do a follow-up study with specific questions testing the elements of motivation, to have a more complete picture of how to improve performance.
Finally, while this study focused on the 2014 PSES, the 2011 results corroborated these findings. That said, the results and claims made here would be much stronger if it was possible to combine these datasets into a longitudinal panel data set, to better understand the causal mechanisms (Schyns & Croon, 2006; Taylor & Westover, 2011).
Conclusion and Further Research
Recent reports from the media and from public sector unions have indicated that conditions under the Harper government resulted in a toxic work environment with very stressed and dissatisfied employees (Fekete, 2014; May, 2016). It appears as though some of this rhetoric resembled that of the 1990s, when the Clerk of the Privy Council encouraged then Prime Minister, Jean Chrétien, to introduce policies to rejuvenate the public sector. Hence, this article sought to analyze the overall levels of job satisfaction, as well as the explanatory variables of job satisfaction in the Canadian federal public service to better understand the current job climate. What this study indicates is that a crisis is not likely, as the overall satisfaction level of the public service remains quite high, with a mean of 4.05 out of 5 on a Likert-type scale. As a result, much of the lack of satisfaction seems to be mostly political rhetoric, although there was indeed a slight decrease during Harper’s tenure. This is useful for other organizations outside of Canada as well—the public sector may well be used as a political tool or pawn during elections; therefore, it is important to get the actual perceptions of public servants in terms of their working conditions. Thus, these employee surveys, which exist in many public sectors in the world like the United States, Australia, and most Canadian provinces, can be used to measure how public servants actually feel, not how they are told they should feel during the course of an election.
In terms of the variables most likely to impact job satisfaction, the strongest predictor by far is that of interests. This indicates that for future improvements in job satisfaction in the Canadian public sector, taking into account person-job fit could be quite beneficial. In addition to these findings, this study also has indicated that further study is needed to truly understand the deeper causal mechanisms behind job satisfaction in the Canadian federal public service. For instance, this study focuses on the two most recent years that the Public Service Employee Survey was conducted in Canada, 2011 and 2014, both of which were conducted under a Conservative federal government with Stephen Harper as Prime Minister. Newer research has indicated that political change, of parties and leaders, can impact job satisfaction of public sector employees (Tabvuma, Bui, & Homberg, 2014). Therefore, it will be interesting, and important, to examine these results with those of the next survey (to be released later in 2018), which will occur under a federal Liberal government and Prime Minister Justin Trudeau.
The relationship between visible minority status and job satisfaction in the Canadian context does require further investigation, given that the findings here run counter to much of the established literature. Future research must examine this relationship more closely to parcel out the causal mechanisms, and determine why visible minorities tend to be slightly more satisfied with their jobs than their nonminority counterparts. It is possible that this could be the result of other effects, such as through a strong diversity management policy (see Pitts, 2009), a trend which is emerging in the United States. This could be a demonstration of a work environment that is hospitable to visible minorities, and thus lessons could be learned from the Canadian context to other contexts seeking to improve job satisfaction among visible minorities.
Another further avenue of research is into the link between employee satisfaction and customer satisfaction in the Canadian public service context. In the private sector, the link between these two variables is quite significant in numerous studies (Heskett et al., 1997), but there is more to be done in terms of public sector research (Heintzman & Marson, 2005). For policy makers, increasing job satisfaction could be a clear method to improve services to citizens and increase Canadians’ satisfaction with certain democratic institutions. As such, more work should be done to further investigate these linkages.
In conclusion, it is quite likely that job satisfaction could become more important in the coming months and years for policy makers, as it has been linked to organizational performance which can lead to decreased costs as well as increased citizen satisfaction. It is also linked to the broader goals of public sector rejuvenation put forth by the current federal Liberal Government under Justin Trudeau (May, 2016; Trudeau, 2015). Therefore, should the federal government seek to improve overall job satisfaction, this study has indicated some variables which are most likely to have the strongest positive effects, namely matching employee interests to jobs, as well as improving working relationships both between employees and their immediate supervisors as well as their coworkers.
Beyond recommendations for the Canadian case, this study could have further implications for public sectors around the world. First, the indication that nonminorities and women can be more satisfied with their jobs fits with an emerging trend in the literature that organizational work environments can be improved for previously underrepresented groups. Furthermore, the fact that the strongest predictors of job satisfaction are interests, skills, and relationships with colleagues rather than personal characteristics places emphasis on the need for human resource management policies focused on person–job fit as well as hospitable work environments. Numerous countries around the world have engaged in forms of practices aimed at hiring minority candidates (including Canada), but this study indicates that if the goal is to improve job satisfaction, and likely performance through improved satisfaction, the hiring of minorities needs to be coupled with characteristics related to person–job fit. Similar studies elsewhere have had similar results, thus indicating a more global trend in organizational characteristics impacting job satisfaction (see Steijn, 2012).
Footnotes
Appendix
Definitions of Variables.
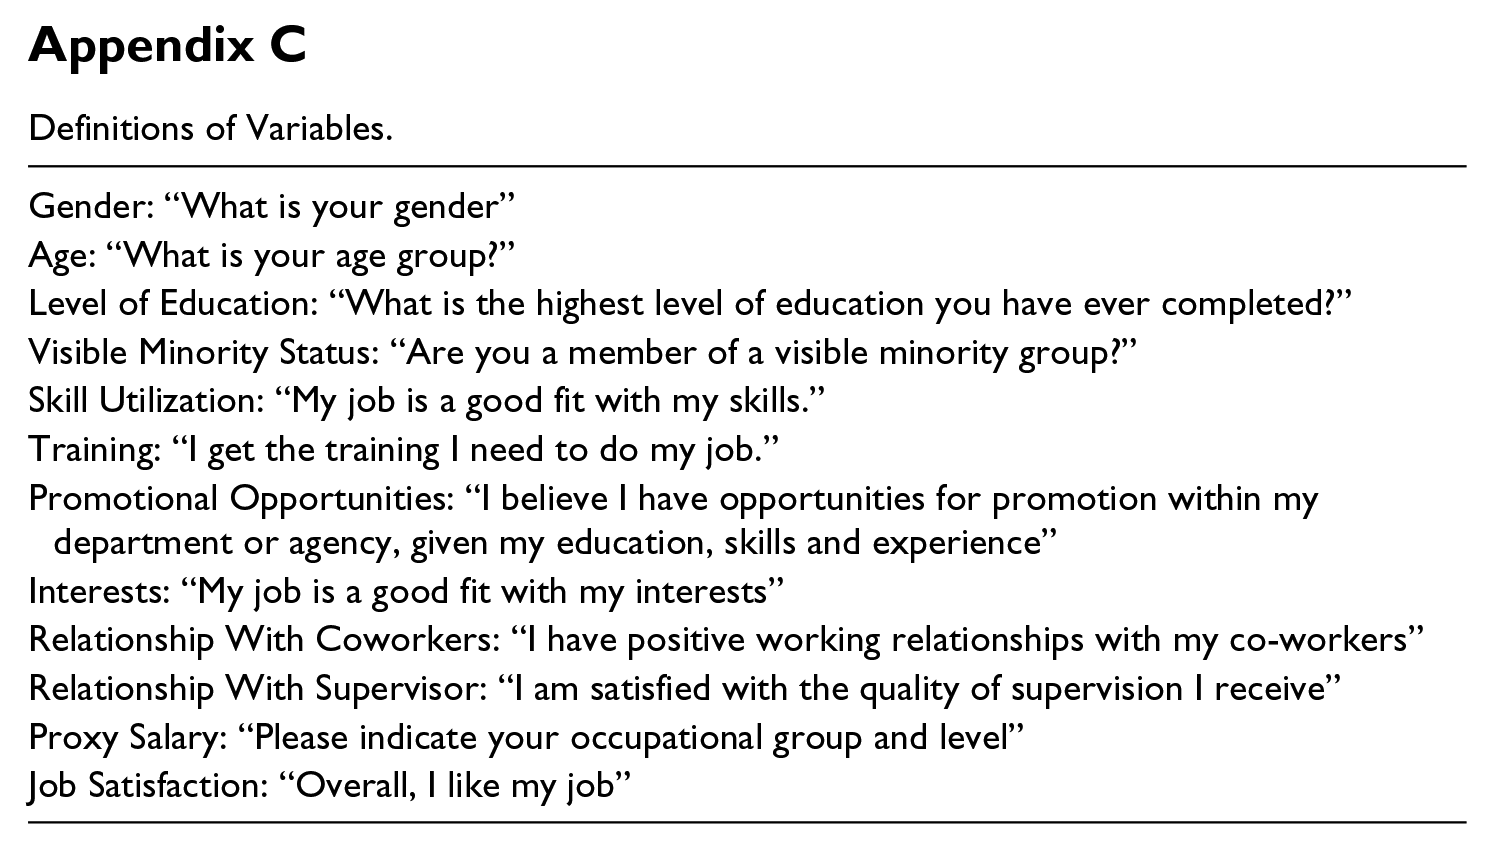
| Gender: “What is your gender” |
| Age: “What is your age group?” |
| Level of Education: “What is the highest level of education you have ever completed?” |
| Visible Minority Status: “Are you a member of a visible minority group?” |
| Skill Utilization: “My job is a good fit with my skills.” |
| Training: “I get the training I need to do my job.” |
| Promotional Opportunities: “I believe I have opportunities for promotion within my department or agency, given my education, skills and experience” |
| Interests: “My job is a good fit with my interests” |
| Relationship With Coworkers: “I have positive working relationships with my co-workers” |
| Relationship With Supervisor: “I am satisfied with the quality of supervision I receive” |
| Proxy Salary: “Please indicate your occupational group and level” |
| Job Satisfaction: “Overall, I like my job” |
Declaration of Conflicting Interests
The author(s) declared no potential conflicts of interest with respect to the research, authorship, and/or publication of this article.
Funding
The author(s) disclosed receipt of the following financial support for the research, authorship, and/ or publication of this article: The analysis presented in this paper was conducted at the QICSS McGill-Concordia Research Data Centre and the British Columbia Interuniversity Research Data Centre, which are part of the Canadian Research Data Centre Network (CRDCN). The services and activities provided by the McGill-Concordia and British Columbia Interuniversity research data centres are made possible by the financial or in-kind support of the SSHRC, the CIHR, the CFI, Statistics Canada, FRQSC and the following universities: McGill, Concordia and UBC. The views expressed in this paper do not necessarily represent the CRDCN’s or that of its partners.