
Abstract
Objective
The purpose of this study was to investigate the correlation between lipid accumulation products (LAP) and depression among adults in the United States.
Methods
We analyzed data from 13,051 persons participating in the NHANES 2005-2018 cycle. The LAP index was calculated using the waist circumference (WC) and serum triglyceride (TG) levels, which reflect lipid toxicity. Participants who scored ≥10 on the Patient Health Questionnaire-9 (PHQ-9) were considered depressed. Multivariate logistic regression analyses were conducted to explore the association between the LAP index and depression. Subgroup analysis was also conducted to identify sensitive populations. Smoothed curve fitting and generalized additive model (GAM) regression were performed to verify the association between the LAP index and depression.
Results
After adjusting for all potential confounders, the risk of depression increased with increasing LAP index (odds ratio [OR]=1.0011, 95% confidence interval [CI]= 1.0001-1.0021). Compared to participants in LAP quartile 1, participants in LAP quartile 3 exhibited the highest risk for depression (OR=1.43, 95% CI: 1.03-1.99). Subgroup analysis demonstrated a stronger association between the LAP index and depression in men (OR= 1.002, 95% CI= 1.001-1.004) and in those with hypertension (OR=1.002, 95% CI=1.000-1.003). Additionally, smoothed curve fitting and GAM regression demonstrated a positive linear correlation between the LAP index and depression.
Conclusions
These findings suggest that individuals with a higher LAP index may be at greater risk for depression, particularly among men and those with hypertension. Further studies are required to confirm these findings.
Keywords
Introduction
Depression is one of the major emerging mood disorders worldwide. 1 According to an epidemiological study, depression affects approximately 3.8% of the global population, meaning that approximately 280 million people have depression. Patients with depression often encounter physical and mental harm, and these adverse results cause enormous social and economic burdens on families, communities, and countries. 2 However, these harmful effects have been significantly underrecognized by society. 3
The prevalence of depression has grown rapidly worldwide, and although its pathogenesis is complex and multifactorial, the current understanding includes several psychological and biological models.4,5 Additionally, risk factors such as hypertension, cardiovascular disease, and metabolic syndrome, particularly insulin resistance, obesity, and diabetes, have been implicated in the development and maintenance of depression.6-9 Growing biological and observational evidence has linked insulin resistance to the onset of depression.10-12 Numerous studies have shown that adipose tissue accumulation, particularly in the abdominal area, is associated with depression.13,14 Various biomarkers, including the visceral adiposity index (VAI), triglyceride/high-density lipoprotein cholesterol ratio (TG/HDL-C), triglycerides/glucose index (TyG index), and homeostatic model assessment for insulin resistance (HOMA-IR), have been suggested to predict depression owing to their ability to predict insulin resistance.15-17 However, these indices are not widely used in clinical practice owing to their clinical complexity, high equipment cost, and ethical considerations. 18 Consequently, there is an urgent need to identify simple, reliable, and cost-effective biomarkers that can evaluate insulin resistance (IR) and adipose tissue accumulation to predict depression.
The LAP index, a sex-specific index calculated as (WC (cm)−65) × TG (mmol/L) (WC (cm)−65) × TG (mmol/L) for men and (WC (cm)−58) × TG (mmol/L) (WC (cm)−58) × TG (mmol/L) for women (where WC is waist circumference and TG is triglyceride level), is an effective tool for evaluating insulin resistance and abdominal fat, and is strongly associated with increased risks of diabetes, hypertension, and metabolic syndrome.19-23 Few studies have examined the association between the LAP index and depression. Therefore, the objective of this study was to investigate the relationship between the LAP index and depression in a large, nationally representative sample of adults residing in the United States. Data from the National Health and Nutrition Examination Survey (NHANES) from 2005 to 2018 were used.
Materials and methods
Study population
The NHANES is a cross-sectional nationwide survey conducted by the National Center for Health Statistics (NCHS), which is part of the Centers for Disease Control and Prevention (CDC). This survey was designed to gather information on the health and nutrition of the U.S. population. The NHANES collects data through interviews and examinations conducted by highly trained medical personnel. The interviews covered demographic, socioeconomic, dietary, and health-related questions, whereas the examinations included laboratory tests and medical, dental, and physiological measurements. To ensure that the survey accurately represented the nutritional and health status of the U.S. civilian population, each participant was assigned a multistage sample weight. The NHANES protocol has been approved by the NHANES Institutional Review Board (IRB), and all adult participants sign written informed consent forms. Parental or guardian consent was required for minors. For more detailed information on NHANES data, please visit https://www.cdc.gov/nchs/nhanes/index.htm.
The NHANES data were collected over a 2-year period. This study combined data from the 2005-2006 to 2017-2018 cycles. The methodology for combining data across cycles followed NHANES guidelines to ensure consistency and comparability.
A population-based sample of participants surveyed in annual cross-sectional studies of the US national population conducted between 2005 and 2018 was analyzed. Participants without data from the PHQ-9 questionnaire (n = 33,793) were excluded. Next, all participants aged <20 years (n = 2133) were excluded. Participants without data on lipid accumulation products or other covariates (n = 21,213) were also excluded. The total sample size for the final analysis was 13,051. The detailed population selection process is illustrated in Figure 1. Flow chart of the population selection process.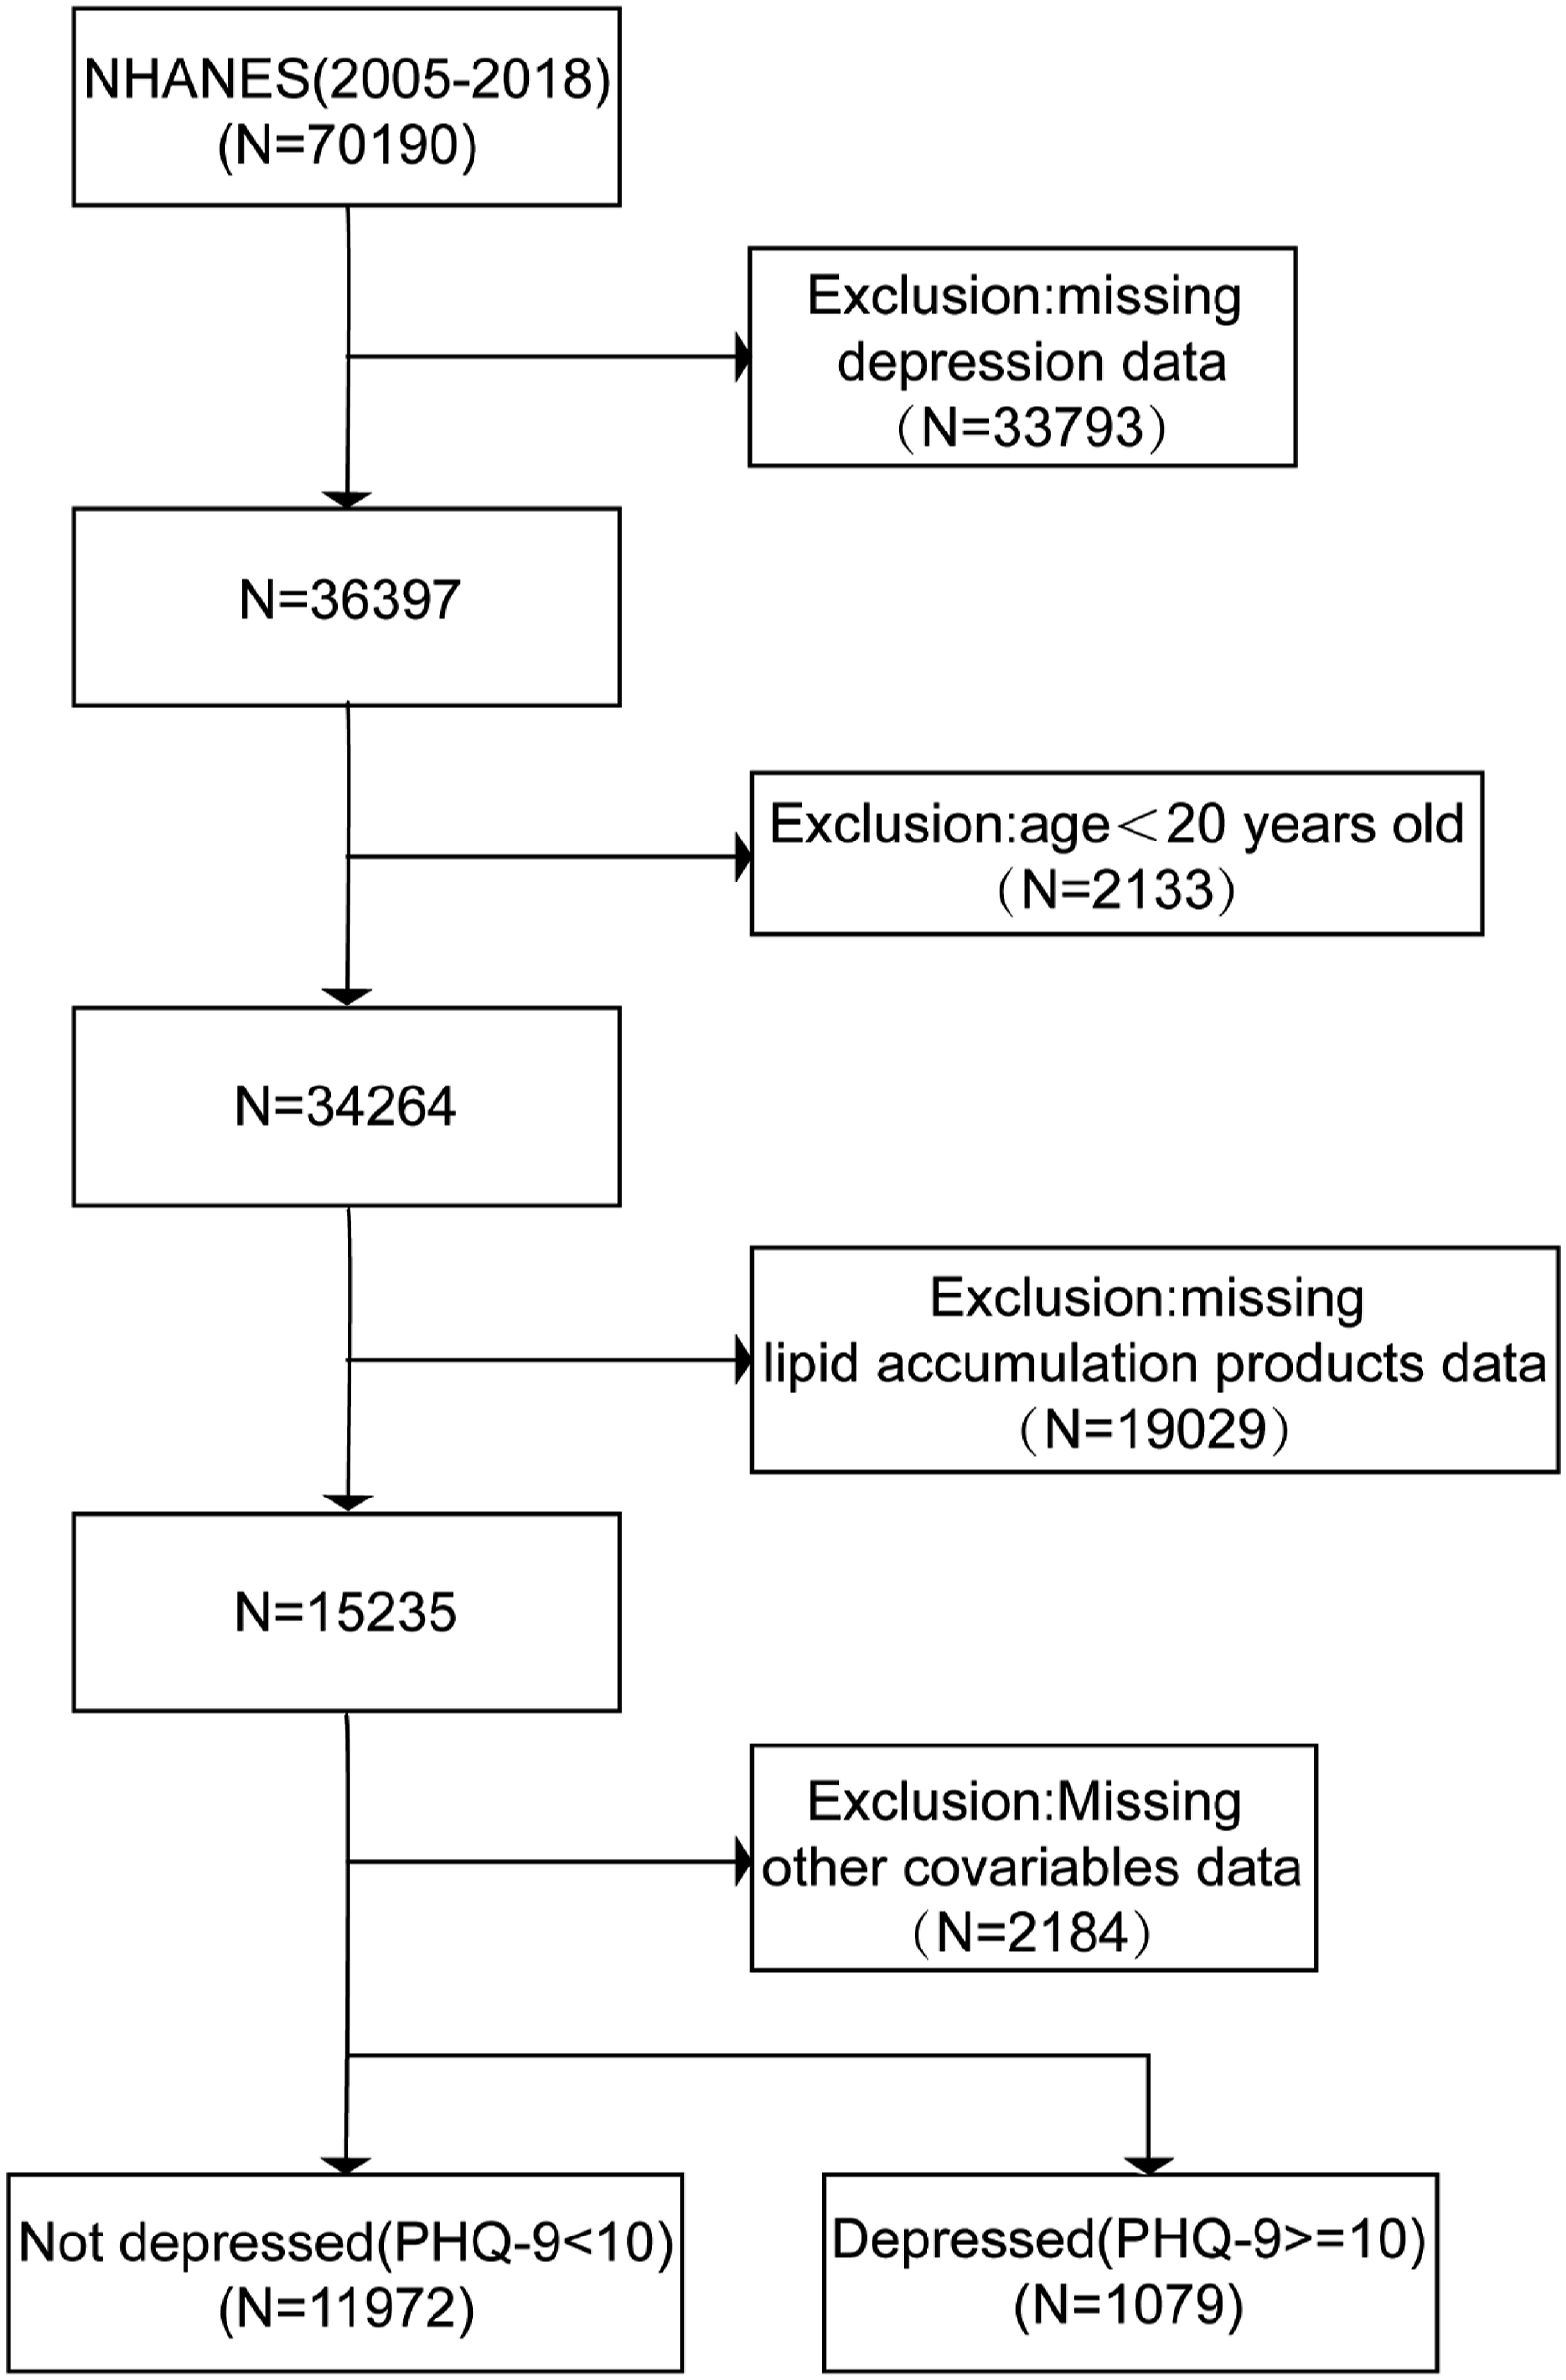
Exposure and outcome definitions
The LAP was used as the exposure variable and was calculated using sex-specific equations: LAP = [WC (cm) −65] × (TG (mmol/L) [male], LAP = [WC (cm)−58] × (TG (mmol/L) [female]. 23 The presence of depression was assessed using PHQ-9 in NHANES, and participants who scored 10 or higher were considered to have depression. 24
To measure waist circumference (WC), the participants were instructed to stand naturally with their legs open approximately 25-30 cm apart. Measurements were taken at the end of normal exhalation using an inelastic ruler with a minimum scale of 1 mm. The ruler was positioned at the midpoint of the connecting line between the upper edge of the iliac crest and the lower edge of the 12th rib, often the naturally narrowest part of the waist, and then encircled horizontally around the abdomen. The results were rounded off to the nearest 0.1 cm. 25
This method to measure triglycerides is based on the work by Wahlefeld using a lipoprotein lipase from microorganisms to rapidly and completely hydrolyze triglycerides to glycerol. This was followed by oxidation to dihydroxyacetone phosphate and hydrogen peroxide. The produced hydrogen peroxide then reacts with 4-aminophenazone and 4-chlorophenol under the catalytic action of peroxidase, forming a red dyestuff (the Trinder endpoint reaction). The intensity of the red dyestuff is directly proportional to the triglyceride concentration and can be measured photometrically. All the detailed information about the methods is available on the NHANES website in a document titled “Laboratory Procedures.”
Covariates
To control for potential confounding variables in the association between the LAP index and depression, several covariates were included, such as demographic characteristics (i.e., age, race, educational level, and family-to-poverty ratio (PIR:<1, ≥1)). Additionally, body mass index (BMI) was also included and categorized into three groups: normal (BMI < 25 kg/m2), overweight (25 ≤ BMI ≤ 30 kg/m2), and obese (BMI > 30 kg/m2). 26 Based on a self-administered survey, smoking status was divided into three categories: never, former, and current. Alcohol consumption was classified as yes or no. Diabetes was diagnosed if the participant had a self-reported diabetes diagnosis, a plasma glucose level of ≥200 mg/dL at 2 hours after an oral glucose tolerance test, an HbA1c level of ≥6.5%, a fasting glucose level of ≥126 mg/dL, or if they were using oral hypoglycemic agents. Borderline diabetes was diagnosed if participants had abnormal results on these glucose-related tests but did not meet the standard criteria for diabetes. Hypertension was defined as a diastolic blood pressure of ≥90 mmHg, a systolic blood pressure of ≥140 mmHg, or a self-reported diagnosis of hypertension. Participants with a previous diagnosis of angina, heart attack, or coronary heart disease were considered as having cardiovascular disease (CVD). Stroke was assessed by asking the participants, “Have you ever been told by a doctor or health professional that you have a stroke?”.
Statistical analysis
All statistical analyses were performed according to the NHANES statistical analysis guidelines provided by the CDC. Appropriate sample weights for each participant were applied, considering the complex multi-stage cluster survey design of the NHANES. 27 Percentages and standard errors (SE) were used to describe the categorical and continuous variables. Chi-square test and analysis of variance (ANOVA) were used to compare differences in categorical and continuous variables across the different LAP index tertiles.
Logistic regression was used to examine the association between the LAP index and depression, and the results are reported as odds ratios (OR) and 95% confidence intervals (CI). Three different models were used to explore the potential covariate effects on these associations. The crude model did not adjust for any covariates, while age, race, and educational level were adjusted in Model 1. All potential covariates were adjusted for in Model 2. Subgroup analyses were performed according to age, sex, education level, BMI, PIR, smoking status, alcohol consumption status, diabetes status, hypertension status, and stroke status.
The relationship between the LAP index and depression was further evaluated using smoothed curve fitting (penalized spline approach) and generalized additive model regression (GAM). Statistical significance was defined as P < 0.05, and all analyses were conducted using R version 4.0.5 and Empower Stats software (https://www.empowerstats.com/; X & Y Solutions, Inc., Boston, MA).
Results
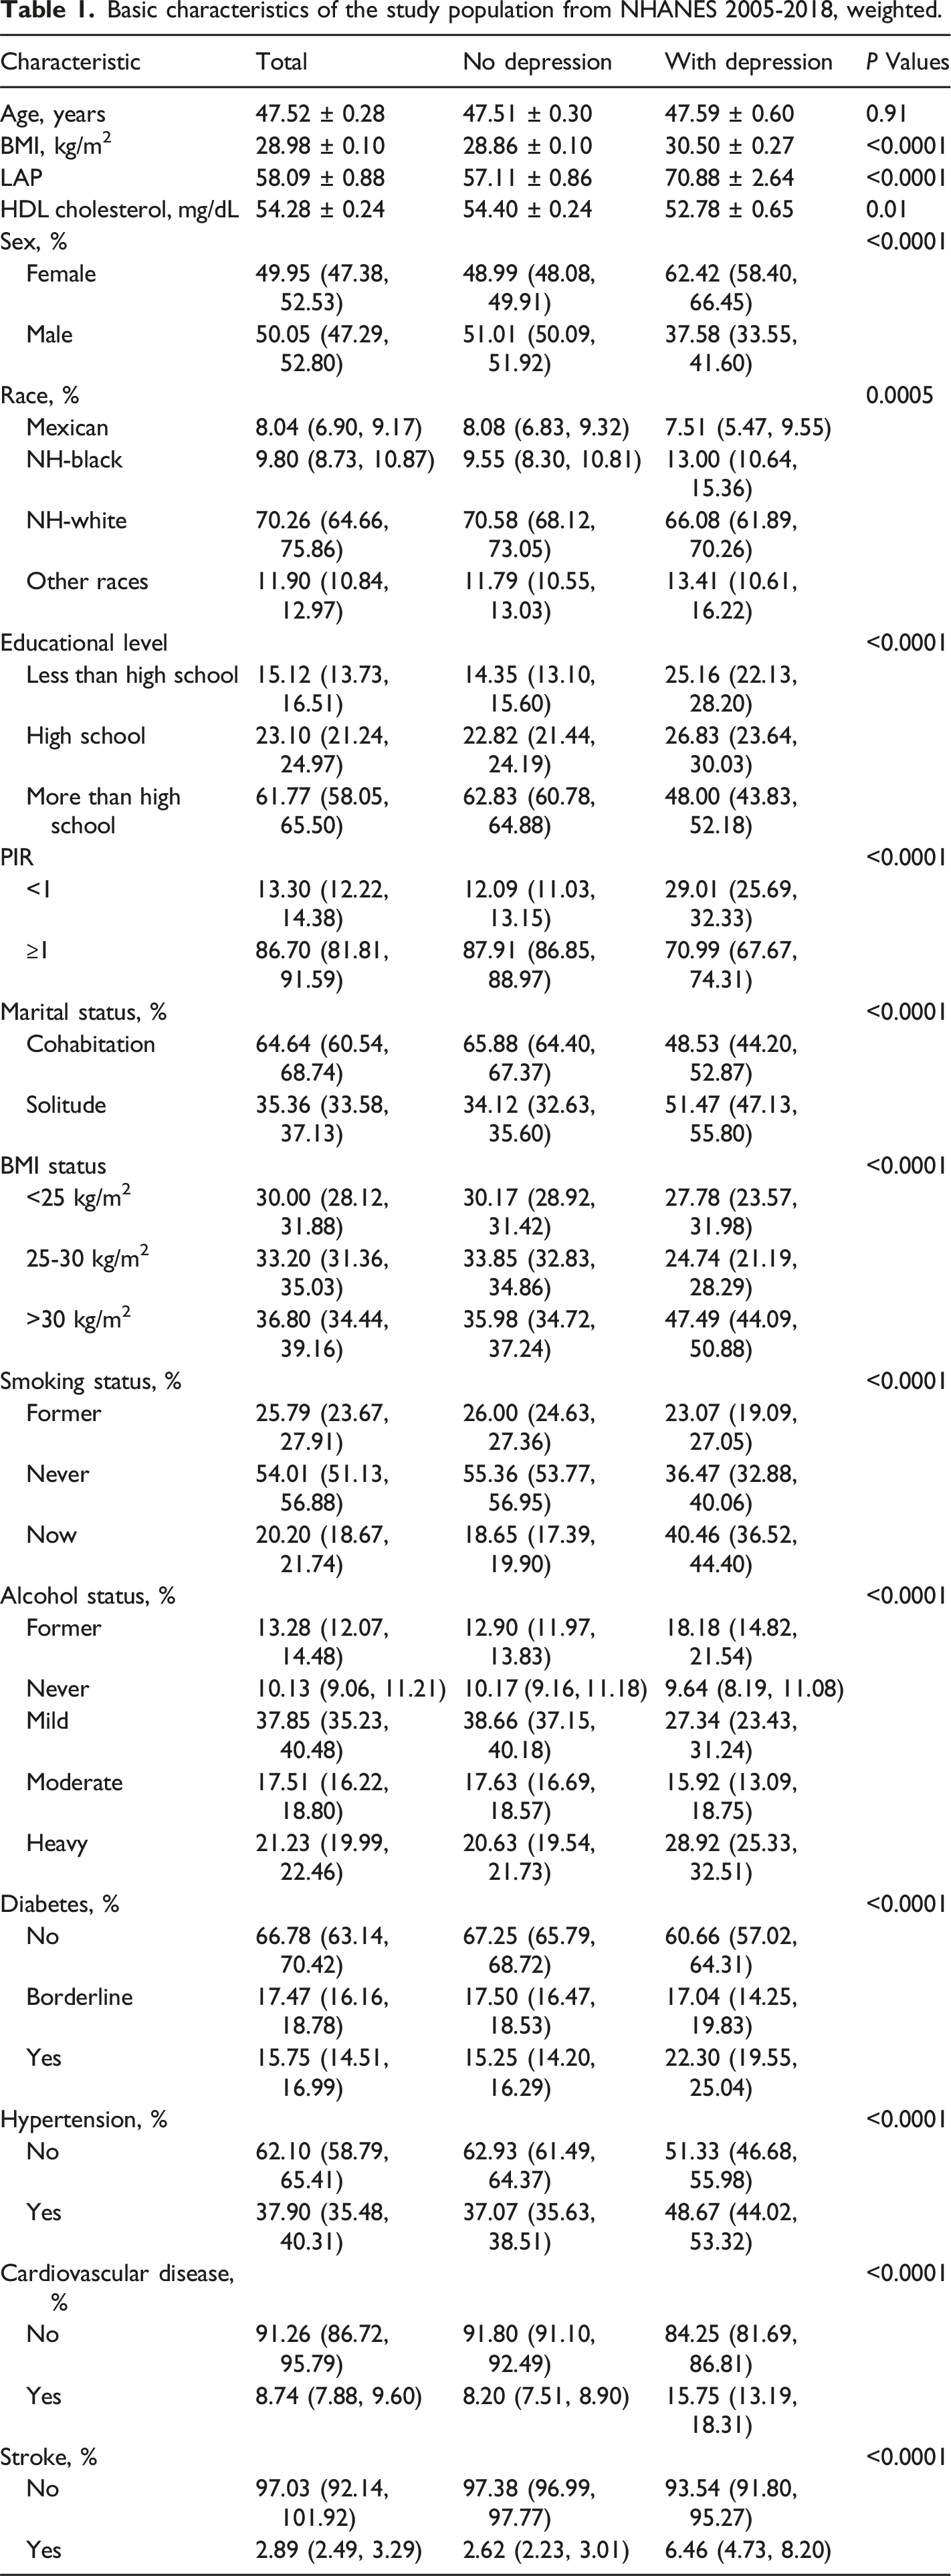
Basic characteristics of the study population from NHANES 2005-2018, weighted.
Association between the LAP and depression, weighted.
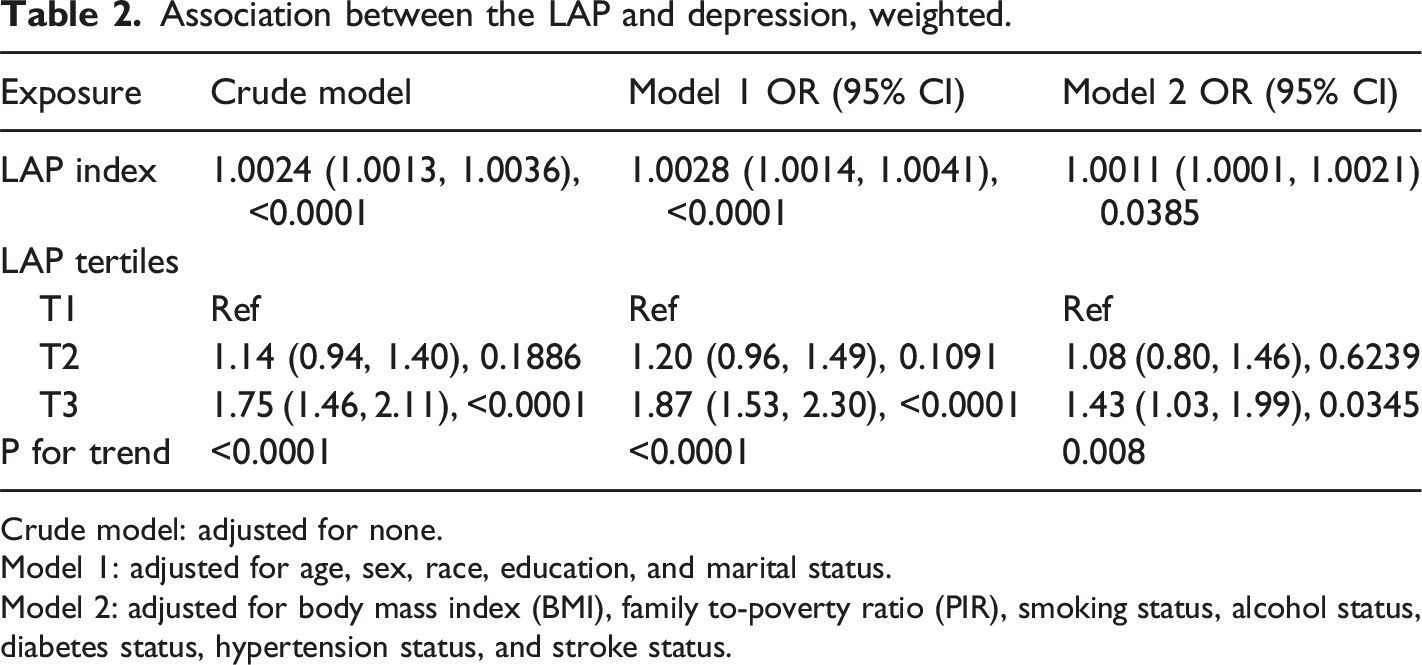
Crude model: adjusted for none.
Model 1: adjusted for age, sex, race, education, and marital status.
Model 2: adjusted for body mass index (BMI), family to-poverty ratio (PIR), smoking status, alcohol status, diabetes status, hypertension status, and stroke status.
Moreover, an additive generalized model and smoothed curve fitting were used to further investigate the relationship between the LAP index and depression, as illustrated in Figure 2. The results indicated a positive linear correlation between LAP index and depression. The relationship between the LAP index and depression was further analyzed across different age groups; sex; educational level; BMI category; PIR level; smoking status; alcohol consumption status; and the presence of diabetes mellitus, hypertension, and stroke The relationship between LAP index and depression prevalence. The area between the upper and lower lines is represented as 95% CI. Each point shows the magnitude of the LAP index and is connected to form a continuous line. Adjusted for all covariates except effect modifier. Subgroup analysis for the association between LAP index and depression in model 2. BMI*: body mass index. PIR**: family-to-poverty ratio.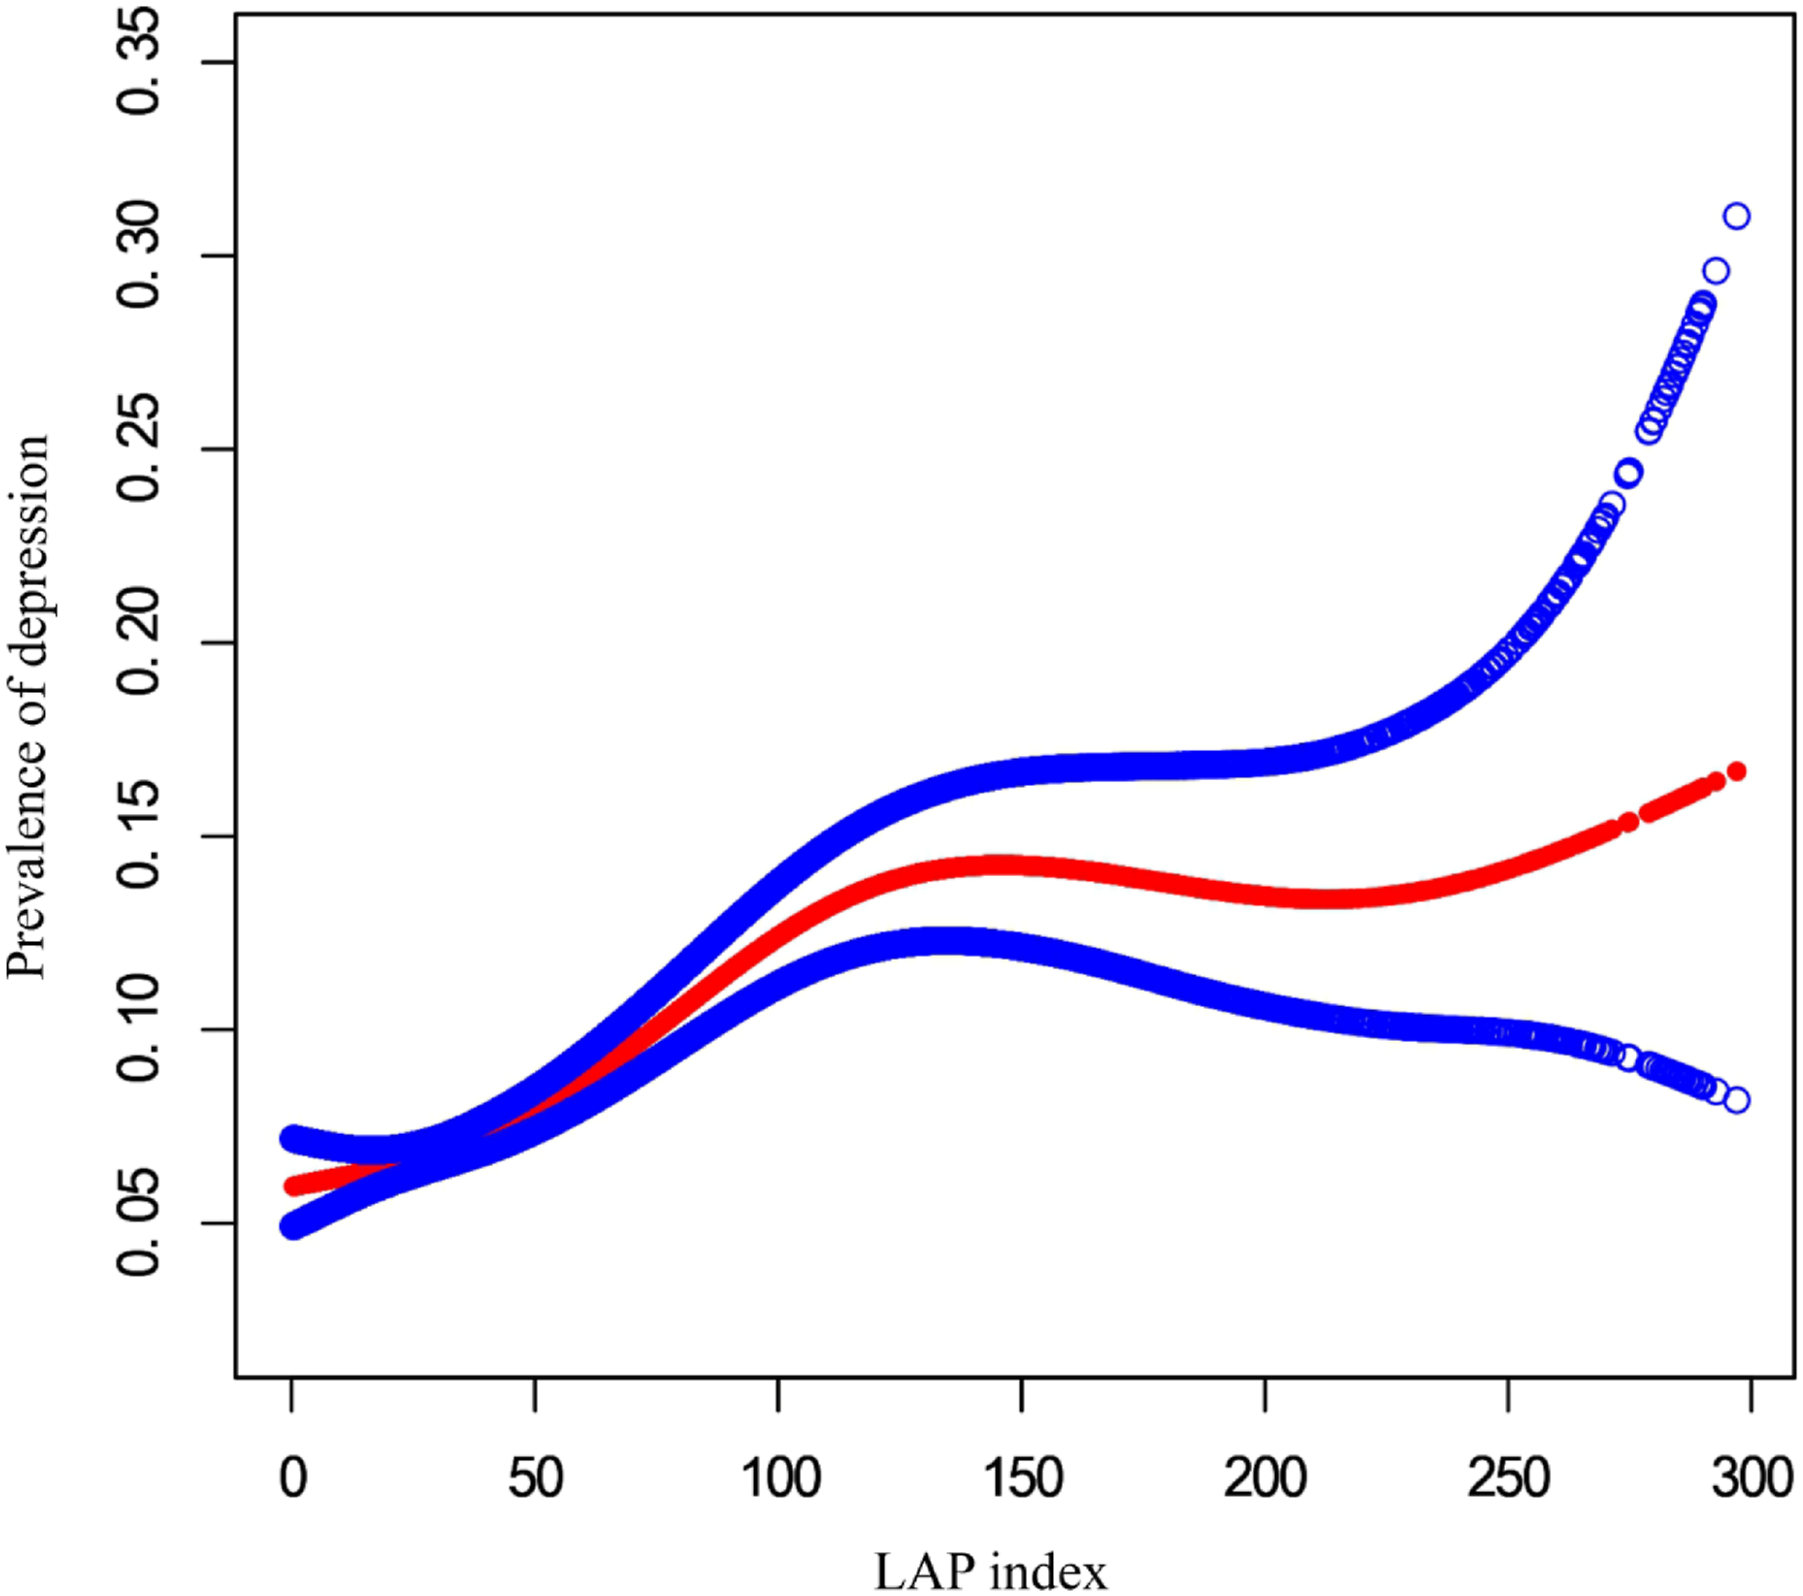

Discussion
To our knowledge, this is the first nationally representative study to investigate the association between LAP index and depression in adults. Our study demonstrated that high LAP levels were significantly associated with a higher risk of depression in the U.S. adult population. Particularly, men or those with hypertension and a higher LAP index may be at a higher risk of depression.
Several potential mechanisms link LAP index to depression. First, insulin resistance may play an important role in the relationship between the LAP index and depression. Accumulating evidence suggests that LAP can be used to assess insulin resistance, which is thought to be associated with the development of depressive disorders. 28 Cross-sectional data collected from 1732 participants have shown a positive association between depressive disorders and insulin resistance. 29 Animal models of insulin resistance have also demonstrated an increased risk of depression-like behaviors. In the CNS, IR manifests as impairment in neuroplasticity, regulation of receptor trafficking, and neurotransmitter release. This demonstrated greater dACC dysconnectivity to front-limbic reward networks.30,31 ACC volumetric reductions have also been reported in MDD, malfunctioning of the IR and depression. 32 Furthermore, studies have shown that dysfunctional insulin receptors and receptor pathways affect the transport of glucose across the blood-brain barrier, subsequently reducing glucose uptake into neurons and neuroglia. As a result, functional deficits in brain glucose caused by insulin resistance can induce changes in the affective mental state due to loss of glycemic control. All these factors have led to the hypothesis that insulin resistance is relevant to depression.33,34 In contrast to previous insulin measurements, such as the homeostatic model assessment of insulin resistance (HOMA-IR) index, TyG, TG/HDL-C, and VAI, studies have shown that the LAP index is a simpler, more robust, and cost-effective biomarker for predicting insulin resistance.22,35
Second, a higher LAP index has been associated with accumulation of white adipose tissue, particularly in the abdominal region. This type of tissue is an active endocrine organ that produces inflammatory cytokines and hormones such as leptin, which can contribute significantly to pathogenic immune and metabolic responses in the central nervous system and other parts of the body. 36 Cytokines can cross the blood-brain barrier through saturable active transport systems or indirectly via microglial activation, resulting in reduced neurogenesis in the brain structures responsible for regulating emotions. 13 Cytokines catalyze the synthesis of kynurenine from tryptophan. This, in turn, can lead to decreased serotonin synthesis and increased tryptophan catabolite levels, which disrupt neurotransmission and may result in the neuronal damage associated with depression. 37
Third, inflammation may play an important role in the association between the LAP index and depression. In recent years, there has been a shift away from monoamines as the primary cause of affective disorders towards a more holistic view that considers changes in the endocrine and immune systems as significant causal factors in the pathophysiology of these disorders. Evidence suggests that chronic low-grade inflammation is a vital contributor to the pathophysiology of depression. 38 Proinflammatory cytokines, prostaglandin E2 (PGE2), reactive oxygen species, and lipid peroxidation can increase depression in response to stress. 39 Previous observational studies have shown positive associations between the LAP index and inflammatory indicators such as white blood cells and C-reactive protein levels. A high LAP index is associated with endothelial dysfunction, inflammatory response, and oxidative stress. 40 Furthermore, inflammation has emerged as a significant pathophysiological link between major depression and metabolic syndrome. 13 The LAP index has a strong and reliable diagnostic accuracy for metabolic syndrome. 41
It is noteworthy that the positive correlation between the LAP index and depression was significant only in men (OR: 1.002, 95% CI: 1.001-1.004). Milaneschi et al. also found that abdominal obesity was associated with depression only in men. 42 This sex disparity may be attributed to differences in adipose tissue distribution, as men tend to accumulate more visceral fat, resulting in an android body shape. 43 As they have a higher LAP index, men are more likely to accumulate excessive abdominal and visceral fat, which is strongly linked to an increased risk of depression. 44 Therefore, it is reasonable to assume that the statistical results are more significant for men. Interestingly, another subgroup analysis revealed that only individuals with hypertension exhibited a positive correlation between the LAP index and depression when compared to individuals without hypertension (OR: 1.002, 95% CI: 1.000-1.003). Hypertension, cardiovascular disease, and cerebrovascular disease are closely associated with an elevated risk of depression. 45 Visceral fat distribution can lead to hormonal, inflammatory, and endothelial changes that contribute to hypertensive stat. 46 Therefore, we speculated that individuals with hypertension may be more sensitive to visceral adipose tissue, resulting in depression.
Despite the statistically significant association between the LAP index and depression, the effect size was small. It is essential to consider that even small associations can be meaningful for public health because of the high prevalence of depression and metabolic syndromes. Small effect sizes in large populations can translate to a substantial number of affected individuals, highlighting the public health relevance of our findings. Furthermore, identifying LAP as a potential biomarker of depression risk could facilitate early intervention and targeted prevention strategies, particularly in populations with high LAP indices.
Study limitations
This study had several limitations that should be noted when interpreting the results. First, we could not conclude a causal association between the LAP index and depression because of the cross-sectional design of NHANES. Second, we excluded participants without a LAP index, which may have resulted in selection bias. Third, the diagnoses of depression were confirmed only via the self-reported questionnaires, which may have limited specificity. Additionally, although our statistical models were adjusted for a wide range of potential confounders, unmeasured confounding variables still influenced the observed associations. Future longitudinal studies are required to validate these findings and explore the underlying mechanisms.
Conclusion
The current study found a positive association between the LAP index and depression in adults in the United States. People with a higher LAP index, especially men or people with hypertension, are at a higher risk of depression. In the future, more well-designed clinical studies should be performed to validate this association and basic studies should be conducted to explore the underlying mechanisms. The findings of this study have significant clinical implications for primary care physicians. Recognizing the LAP index as a potential marker for insulin resistance and depression can facilitate early identification and intervention, particularly in high-risk groups, such as men and individuals with hypertension. By incorporating the LAP index into routine assessments, primary care physicians can more effectively stratify patient risks and tailor preventive and therapeutic strategies accordingly. This proactive approach may lead to improved mental health outcomes and overall quality of life in patients with elevated LAP indices.
Footnotes
Acknowledgements
We express our gratitude to all the individuals at the National Center for Health Statistics of the Centers for Disease Control and Prevention who were involved in the planning and administration of the National Health and Nutrition Examination Survey (NHANES) and who made the NHANES datasets available on their website.
Author contributions
Mengyao dai, Yuyang Zhang, Yanghua Tian provided the conception of research design; Mengyao Dai, Yuyang Zhang, Yang Chen and long Wang conducted the formal analysis and writing original draft; Mengyao Dai, Yuyang Zhang, Yang Chen, long Wang and Yanghua Tian participated writing-review and editing process; All authors read and approved the final manuscript.
Declaration of conflicting interests
The author(s) declared no potential conflicts of interest with respect to the research, authorship, and/or publication of this article.
Funding
The author(s) disclosed receipt of the following financial support for the research, authorship, and/or publication of this article: This work was supported by the National Natural Science Foundation of China (No. 32071054) and Anhui Provincial Science Fund for Distinguished Young Scholars (1808085J23).