
Abstract
There are multiple trajectories to death amongst aging men. The most common trajectory is a gradual decline. This pattern was predicted by a higher number of chronic illnesses and a lower baseline functional status. The WHO domains of quality of life were not strongly associated with each other, and social well-being was often maintained.
Introduction
The world's population is aging, with a concomitant increase in chronic illness. In 2021, Statistics Canada reported 45% of Canadians live with one or more major chronic disease, and by age 80, the majority have more than one chronic disease (StatisticsCanada, 2025). Yet, chronic illness accumulates at different rates in different individuals (Mitnitski & Rockwood, 2016), and the effect of chronic illness on functional status may differ from person to person – and within the same person over time. The experience of older adults can therefore differ dramatically in terms of length of time enjoying good health, length of time in disability, and length of time dying.
The compression of morbidity hypothesis postulates that life span is relatively fixed, but the time spent with disability is modifiable. The burden of lifetime illness may be compressed into a shorter period before the time of death if the age of onset of disability can be postponed (Crimmins, 2015; Fries, 1980, 2003). In psychology, the concepts of terminal decline (a period of gradual decline) (Palmore & Cleveland, 1976) and terminal drop (a period of accelerated decline) (Riegel & Riegel, 1972; Siegler, 1975) have also been used to describe the theoretical trajectories of mental health (e.g. cognition and mood) in the period prior to death.
There have been attempts to reconstruct functional trajectories through late life from analyses of cross-sectional data (Lunney et al., 2003), and data on short-term trajectories of function in the year prior to death (Gill et al., 2010). Lunney et al. (2003) identified four functional trajectories over the year prior to death, building on longstanding theoretical trajectories (Glaser & Strauss, 1968): sudden death, terminal illness, organ failure and frailty. Using latent class analysis on longitudinal data, Gill et al. (2010) identified five disability trajectories leading up to death: no disability (17.0%), catastrophic disability (19.8%), accelerated disability (17.5%), progressive disability (23.8%), and persistently severe disability (21.9%). Both of these studies used the year prior death, rather than a longer time frame. There are also short-term prospective studies showing a strong relationship between physical health and mental health (Soysal et al., 2017), as well as between social vulnerability and physical frailty (Hanlon et al., 2024). However, many older adults maintain high levels of mental well-being in spite of physical limitations (St John et al., 2013, 2018). Relatively little has been reported in published literature describing terminal decline and terminal drop since there are few large prospective cohort studies with frequent measures of both mental health and physical health and mortality over a long time frame. We therefore have analysed a prospective cohort study with a long follow-up time. The objectives are to identify end of life trajectories of well-being. Further, we assess whether the presence of chronic diseases, mental and physical functioning, and previous patterns of functioning can distinguish distinct categories of end of life trajectories.
Specifically, we have three objectives:
To determine the patterns of decline for men over a window of 11 years, from 2006 to 2017, from a mean age of 85 years, to end of life. To determine if chronic disease diagnosed before July 1, 2006 and functional status measured by mental component score (MCS) and physical component score (PCS) from the SF-36, limitations in basic activities of daily living (BADL) and instrumental ADLs (IADL), Self-Rated Health and Life Satisfaction assessed by July 1, 2006 are related to end of the life patterns for these men. To describe the relationship of the functional trajectories of MCS and PCS between 1996 and 2006 to subsequent patterns of decline to end of life by 2017 for these men.
Setting and Sample
The Manitoba Follow-up Study (MFUS), now in its 78th year of continuous operation, has followed a cohort of 3,983 men with routine medical examinations and periodic surveys since 1948. Details of the conduct of MFUS have been previously reported (Tate et al., 2015). In brief, the men of this study, primarily air crew recruits to the Royal Canadian Air Force (RCAF) during the Second World War, were at a mean age of 31 years at entry. Ninety percent were between age 20 and 39 years. There is almost complete ascertainment of vital status to the end of life with less than one percent of the original cohort lost to follow-up. Today, there are fewer than 30 members of the original cohort still being followed, with contact up to three times each year. These men are primarily living in the community, and well into the later half of their tenth decade of life.
The date of death for 3030 men of the MFUS cohort had been reported by July 1, 2006. This analysis is based on the 953 men who responded to the questionnaire on July 1, 2006. They had previously contributed a series of questionnaires from 1996 to 2006 to assess physical and mental functioning. Data from clinical examinations and medical records are available since 1948 to document disease diagnoses. Data collection of both these sources of information as well as circumstances to death has continued since 2006. Between 2006 and 2017, 823 of the 953 men (86%) died.
Materials and Methods
MFUS gathers clinical data, with medical records being retrieved throughout the course of the study. In addition, there has been an annual Successful Aging Questionnaire (SAQ) since 1996 which measures health related quality of life. This includes measures of activities of daily living, and the Short Form 36 (SF-36) (Ware & Sherbourne, 1992). There are also questions about what is important to the participants, and questions on successful aging. When notified of the death of a study member, in the vast majority of cases, the data assembled to code the cause and circumstances at the man's terminal event will come from many sources. These might include one or multiple family members, a physician, hospital, long-term care staff, or a coroner. The richness of the information available in MFUS files, both electronic and on paper, is quite complete and unique among longitudinal studies on aging. In most cases, it is readily apparent how the man lived his final years.
There are clear examples of gradual decline, where a man has left his home of many years following a diagnosis of dementia, spent the next years in long-term care, and experienced ongoing challenges, hospitalizations, and ultimate demise. Other reports clearly describe a life of high functioning, with a sharp terminal drop. Two examples are: “My Dad was talking on the phone, and died (age 93)” and, “Mr x passed away August 25, 2013. Despite hardships he endured during WWII and the adjustment period when he returned to Canada following 3½ years as a Japanese POW, he overcame these physical and emotional barriers and enjoyed life to the fullest in his retirement years (age 94)”.
Categorization of each man's experience from 2006 through to 2017 was determined through a combination of his functioning in 2006, whether he is alive in 2017 or has died between 2006 and 2017, whether he has maintained his level of functioning, or whether he has experienced decline.
Determination of the Independent Variables for This Analysis
Routine clinical examinations received from physician reports, and hospital discharge summaries collected since 1948, as previously described (Tate et al., 2015), were reviewed for diagnosis of six common chronic diseases: ischemic heart disease, stroke, peripheral arterial disease, chronic obstructive pulmonary disease, diabetes, and non-skin cancers at any site. Detailed definition of the diagnostic criteria for these diseases has been previously published (Tate et al., 2013). Self-assessment of health and life satisfaction has been recorded on our questionnaires (Tate et al., 2003), and the most recent self-assessment by 2006 was used in this analysis.
The functional trajectories during the 10 years 1996 through 2006 for the 953 men who survived to July 1, 2006 were classified in two ways. A latent class analysis of the physical and mental component scores of the SF-36 (Ware & Sherbourne, 1992) for the 734 men surviving the interval from 1996 to 2006 and having completed and returned sufficient questionnaires to characterize his functional trajectory was previously published (St John et al., 2018). Trajectories were described for a high (H), moderate (M), declining (D) or low (L) path for PCS and MCS. A chart review was undertaken by the authors to classify the functional trajectories of the other 219 men, most of whom had only one observation point on the SF-36. This involved a manual assessment of clinical and questionnaire data to assign a physical and mental functional trajectory between 1996 and 2006 for each man.
Determination and Classification of End of Life Patterns
Six categories describing each man's late-life experience between 2006 and 2017 were pre-defined. Two categories for men alive at 2017 were “alive and well” or “alive and declining.” Four categories for men who had died by 2017 were “died early after 2006 with little or no information to classify his trajectory from July 2006 to his death,” “death following a gradual decline of lasting more than 2 years,” “death following a steep decline of 6 months to 2 years duration,” “death following a terminal drop of less than 6 months.”
The World Health Organization Quality of Life (WHOQOL) Domains and Facets of the WHOQOLGroup (1998a, 1998b) is the framework that guided our classification, as were previous descriptions of terminal decline and terminal drop of survivors and decedents. Trajectories such as those reported by Gill et al. (2010) and Lunney et al. (2003) were also considered in our categorization, incorporating descriptors such as “catastrophic,” “progressive,” and “persistent.” However, these previous studies were limited to the final year of life whereas we considered a much longer time frame.
To classify each man into one of the six categories of end of life pattern the medical records, questionnaires, and correspondence for the 953 men were drawn and reviewed. There are seven domains in the WHO criteria: physical, psychological, independence, social relationships, environment, spirituality, and overall Quality of Life. Each man's chart was independently reviewed by two students, and a summary coding sheet describing the presence of evidence (yes or no), the direction over time (decline, up-and-down, or stable) and duration of pattern of each WHO domain was assigned. The authors completed the review process by considering the congruence of the summary assessments, and conducting a further in-depth review as necessary.
Statistical Methodology
The six mutually exclusive categories describing each man's course of living or dying between 2006 and 2017 is a nominal dependent variable that was modeled using multinomial logistic regression models. The two categories of men alive in 2017, those remaining in good health as well as those in declining health, were combined to form the reference category for each multinomial model. Thus, four coefficients were estimated for the four end of life trajectories leading to death, and odds ratios with 95% confidence intervals were calculated for the effect of the independent variable on each of the four categories relative to “alive in 2017.” Four statistics are presented for each variable and model: the AIC, a chi-square statistic assessing the significance of the variable in the regression model, a chi-square statistic assessing the equality of a significant effect across the four end of life trajectories relative to the “alive in 2017” category, and the Hosmer-Lemeshow statistic to assess the overall fit of the model to properly predict the trajectory outcome category.
The key independent variables for these models is information known at July 1, 2006. This includes binary indicators for previously diagnosed chronic disease, mental and physical functioning and self-assessed health and life satisfaction from the SF-36 in 2006, and functional trajectory group memberships determined between 1996 and 2006. Age in 2006 is a covariate in all models.
Results
From the cohort of 953 men alive on July 1, 2006, 823 men had died and 130 were alive by 2017. Evidence available in each man's file to define the assignment of an end of life trajectory is described in Table 1. Some evidence from the seven WHO domains was available for all but eight men. These eight were among the 45 men (5%) who died soon after July 1, 2006, with no information from that short period available to assess a trajectory to death. The most common trajectory was that of a gradual decline, lasting at least 2 years, experienced by 45% of the men. A steeper decline (6‒24 months) or a terminal drop (decline of <6 months) was experienced by approximately equal numbers (169 and 179) of men, accounting for 18% and 19% of end of life patterns respectively. The WHO criteria of spirituality or personal beliefs was rarely mentioned and hence found infrequently in the review process. However, when found in a man's file, it was almost always mentioned in a positive light. The WHO criteria for all of the other six domains was found in more ninety percent of all charts reviewed. The detail available in charts supported a classification of each domain as positive, negative and mixed experiences.
Frequency of Evidence from WHO Quality of Life Framework and Classification of End of Life Trajectories of 953 Men.
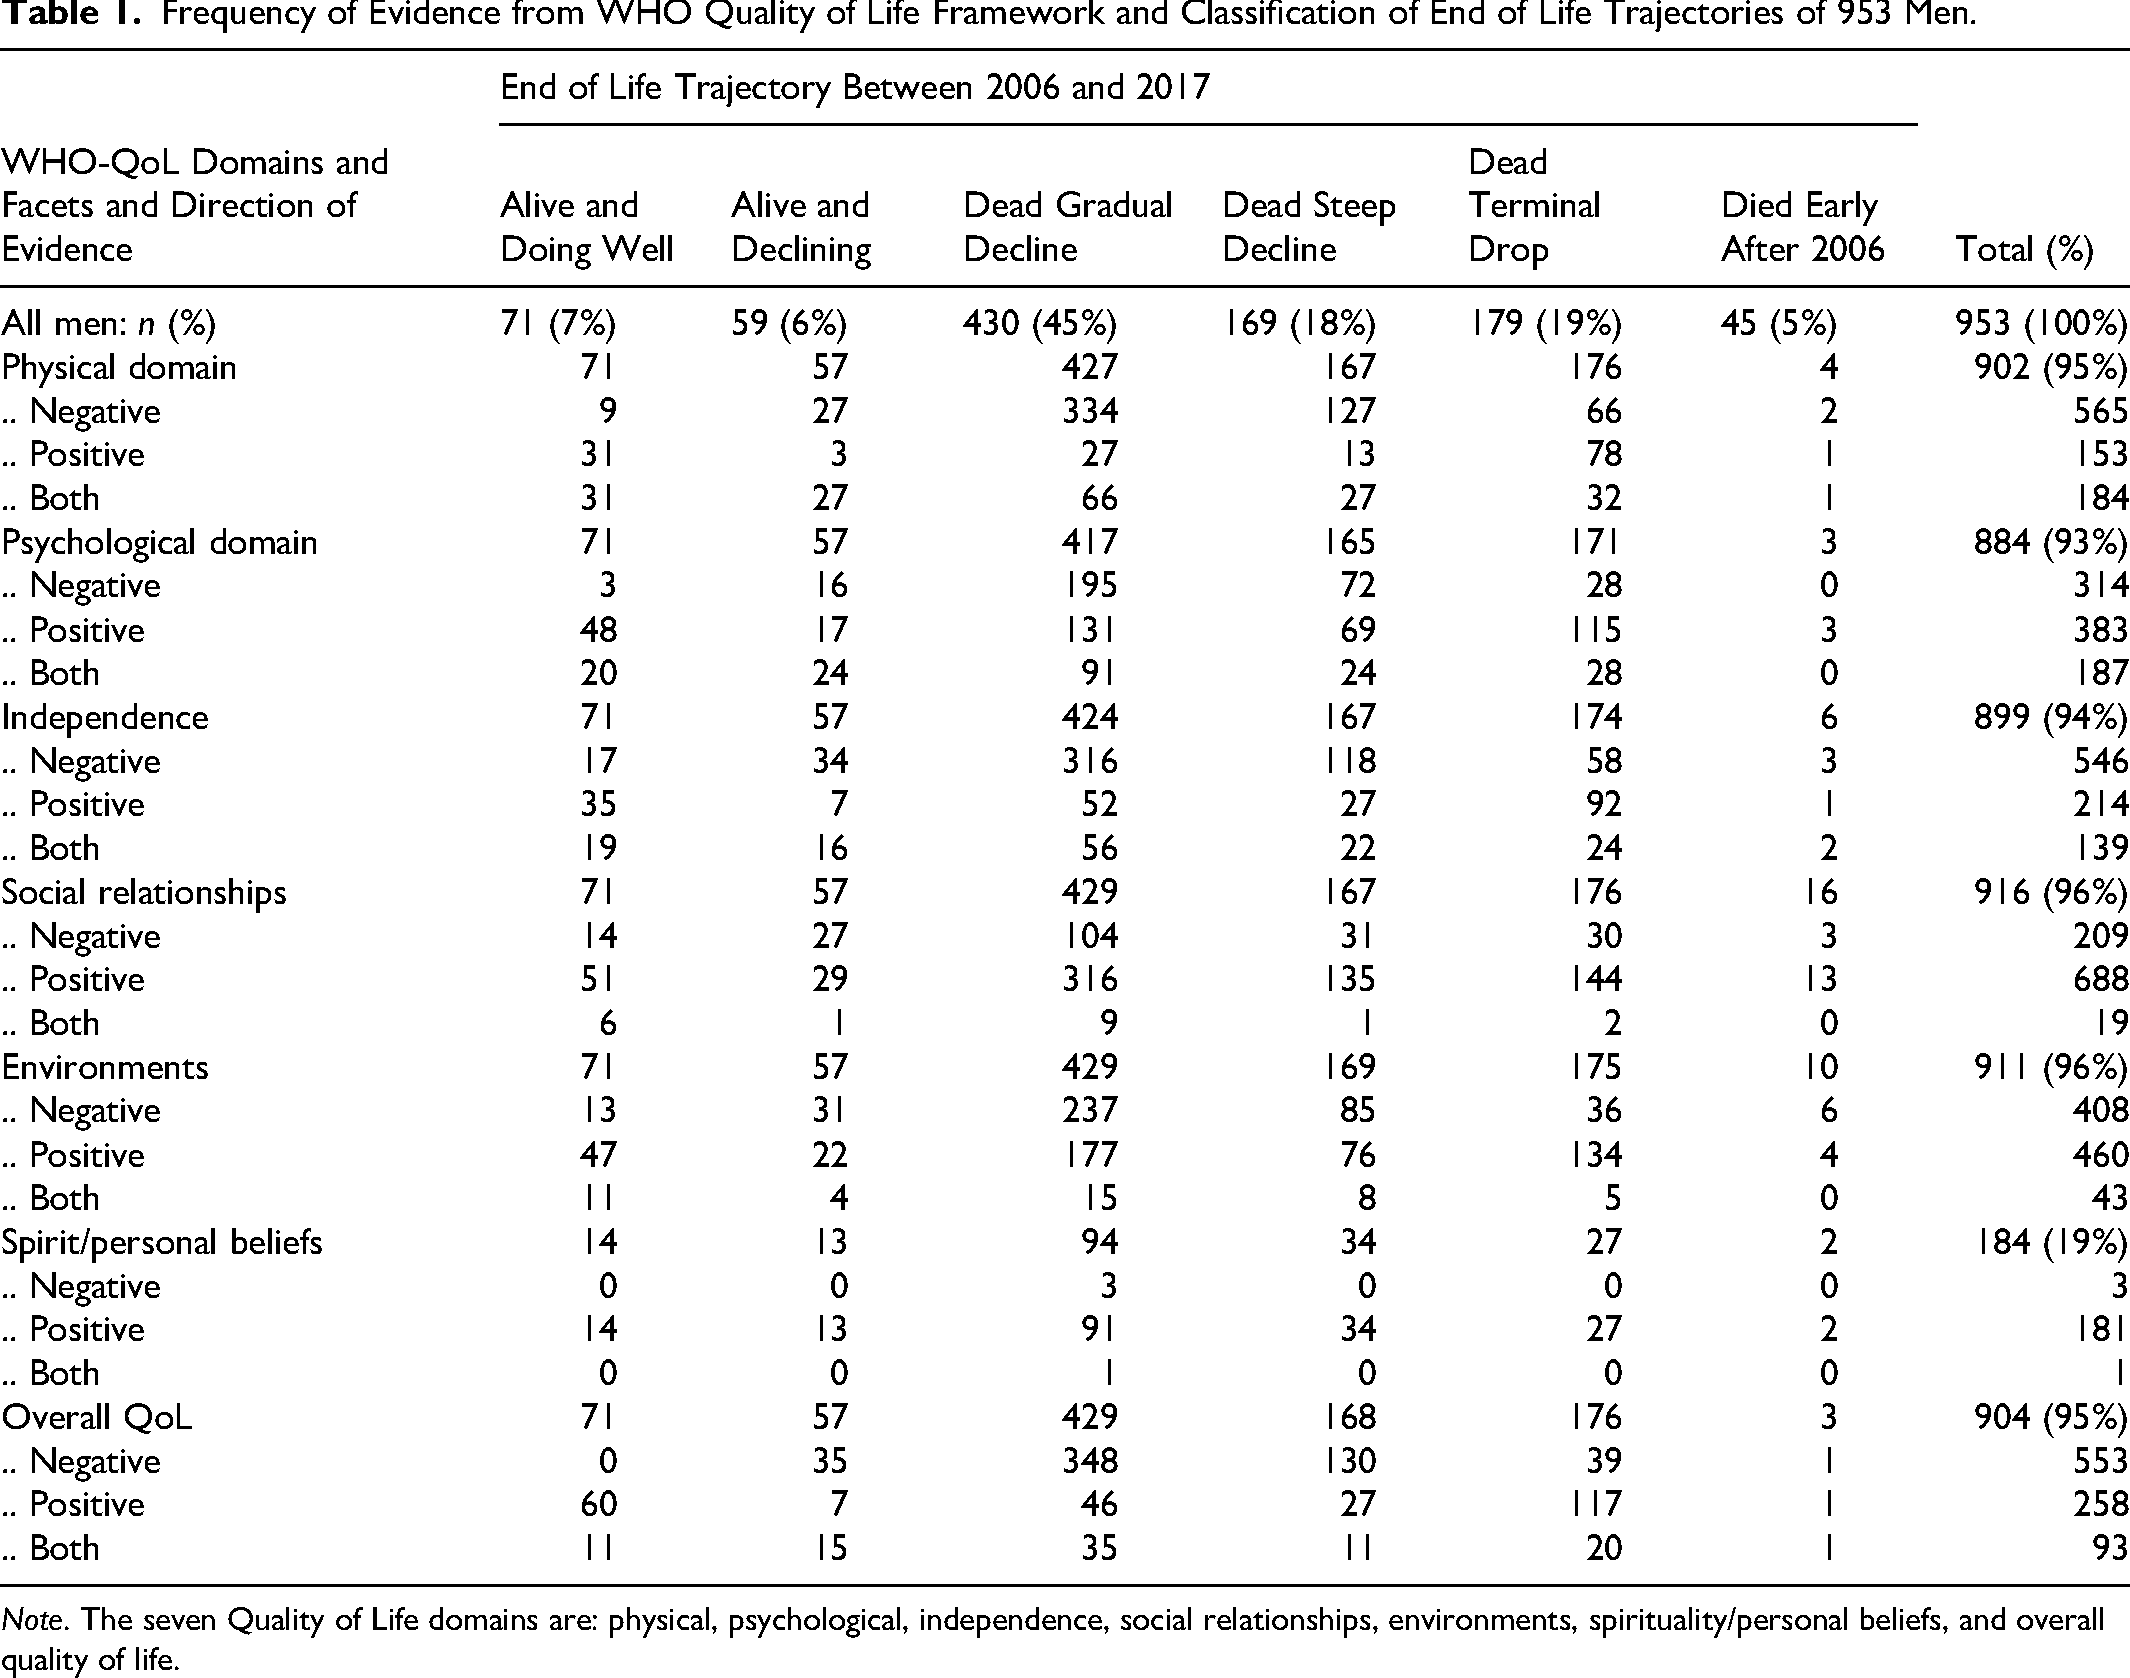
Note. The seven Quality of Life domains are: physical, psychological, independence, social relationships, environments, spirituality/personal beliefs, and overall quality of life.
The characteristics of men known alive at July 1, 2006 are described in Table 2. The 953 men were on average 85.5 years, with a standard deviation of 3.1 years. The nature of the MFUS cohort of young men at entry, leads to a very narrow range of ages of survivors (25th percentile = 83.1 years and 75th percentile = 86.8 years) by 2006. Tabulated by end of life trajectory, those surviving the next 11 years had higher physical functioning in 2006, fewer limitations in both basic and instrumental activities, and more frequently reported excellent or very good self-rated health and life satisfaction. The functional trajectory of MCS and PCS were classified into categories as remaining High, Moderate, Low, or Dropping to Low. The combined MCS and PCS trajectory from 1996 to 2006 was tabulated by end of life trajectory from 2006 to 2017. Two-thirds (67%) of men maintained a high MCS over the 10 years, 43% maintained a high PCS, with an overlap of 329 men (34%) maintaining both high MCS and high PCS. Another third of the men, would maintain a high MCS with declining or low PCS over the 11 years. One quarter (24%) of men had a 10-year trajectory of both MCS and PCS declining or remaining low.
Descriptive Statistics of 953 Men in 2006 by End of Life Trajectories.
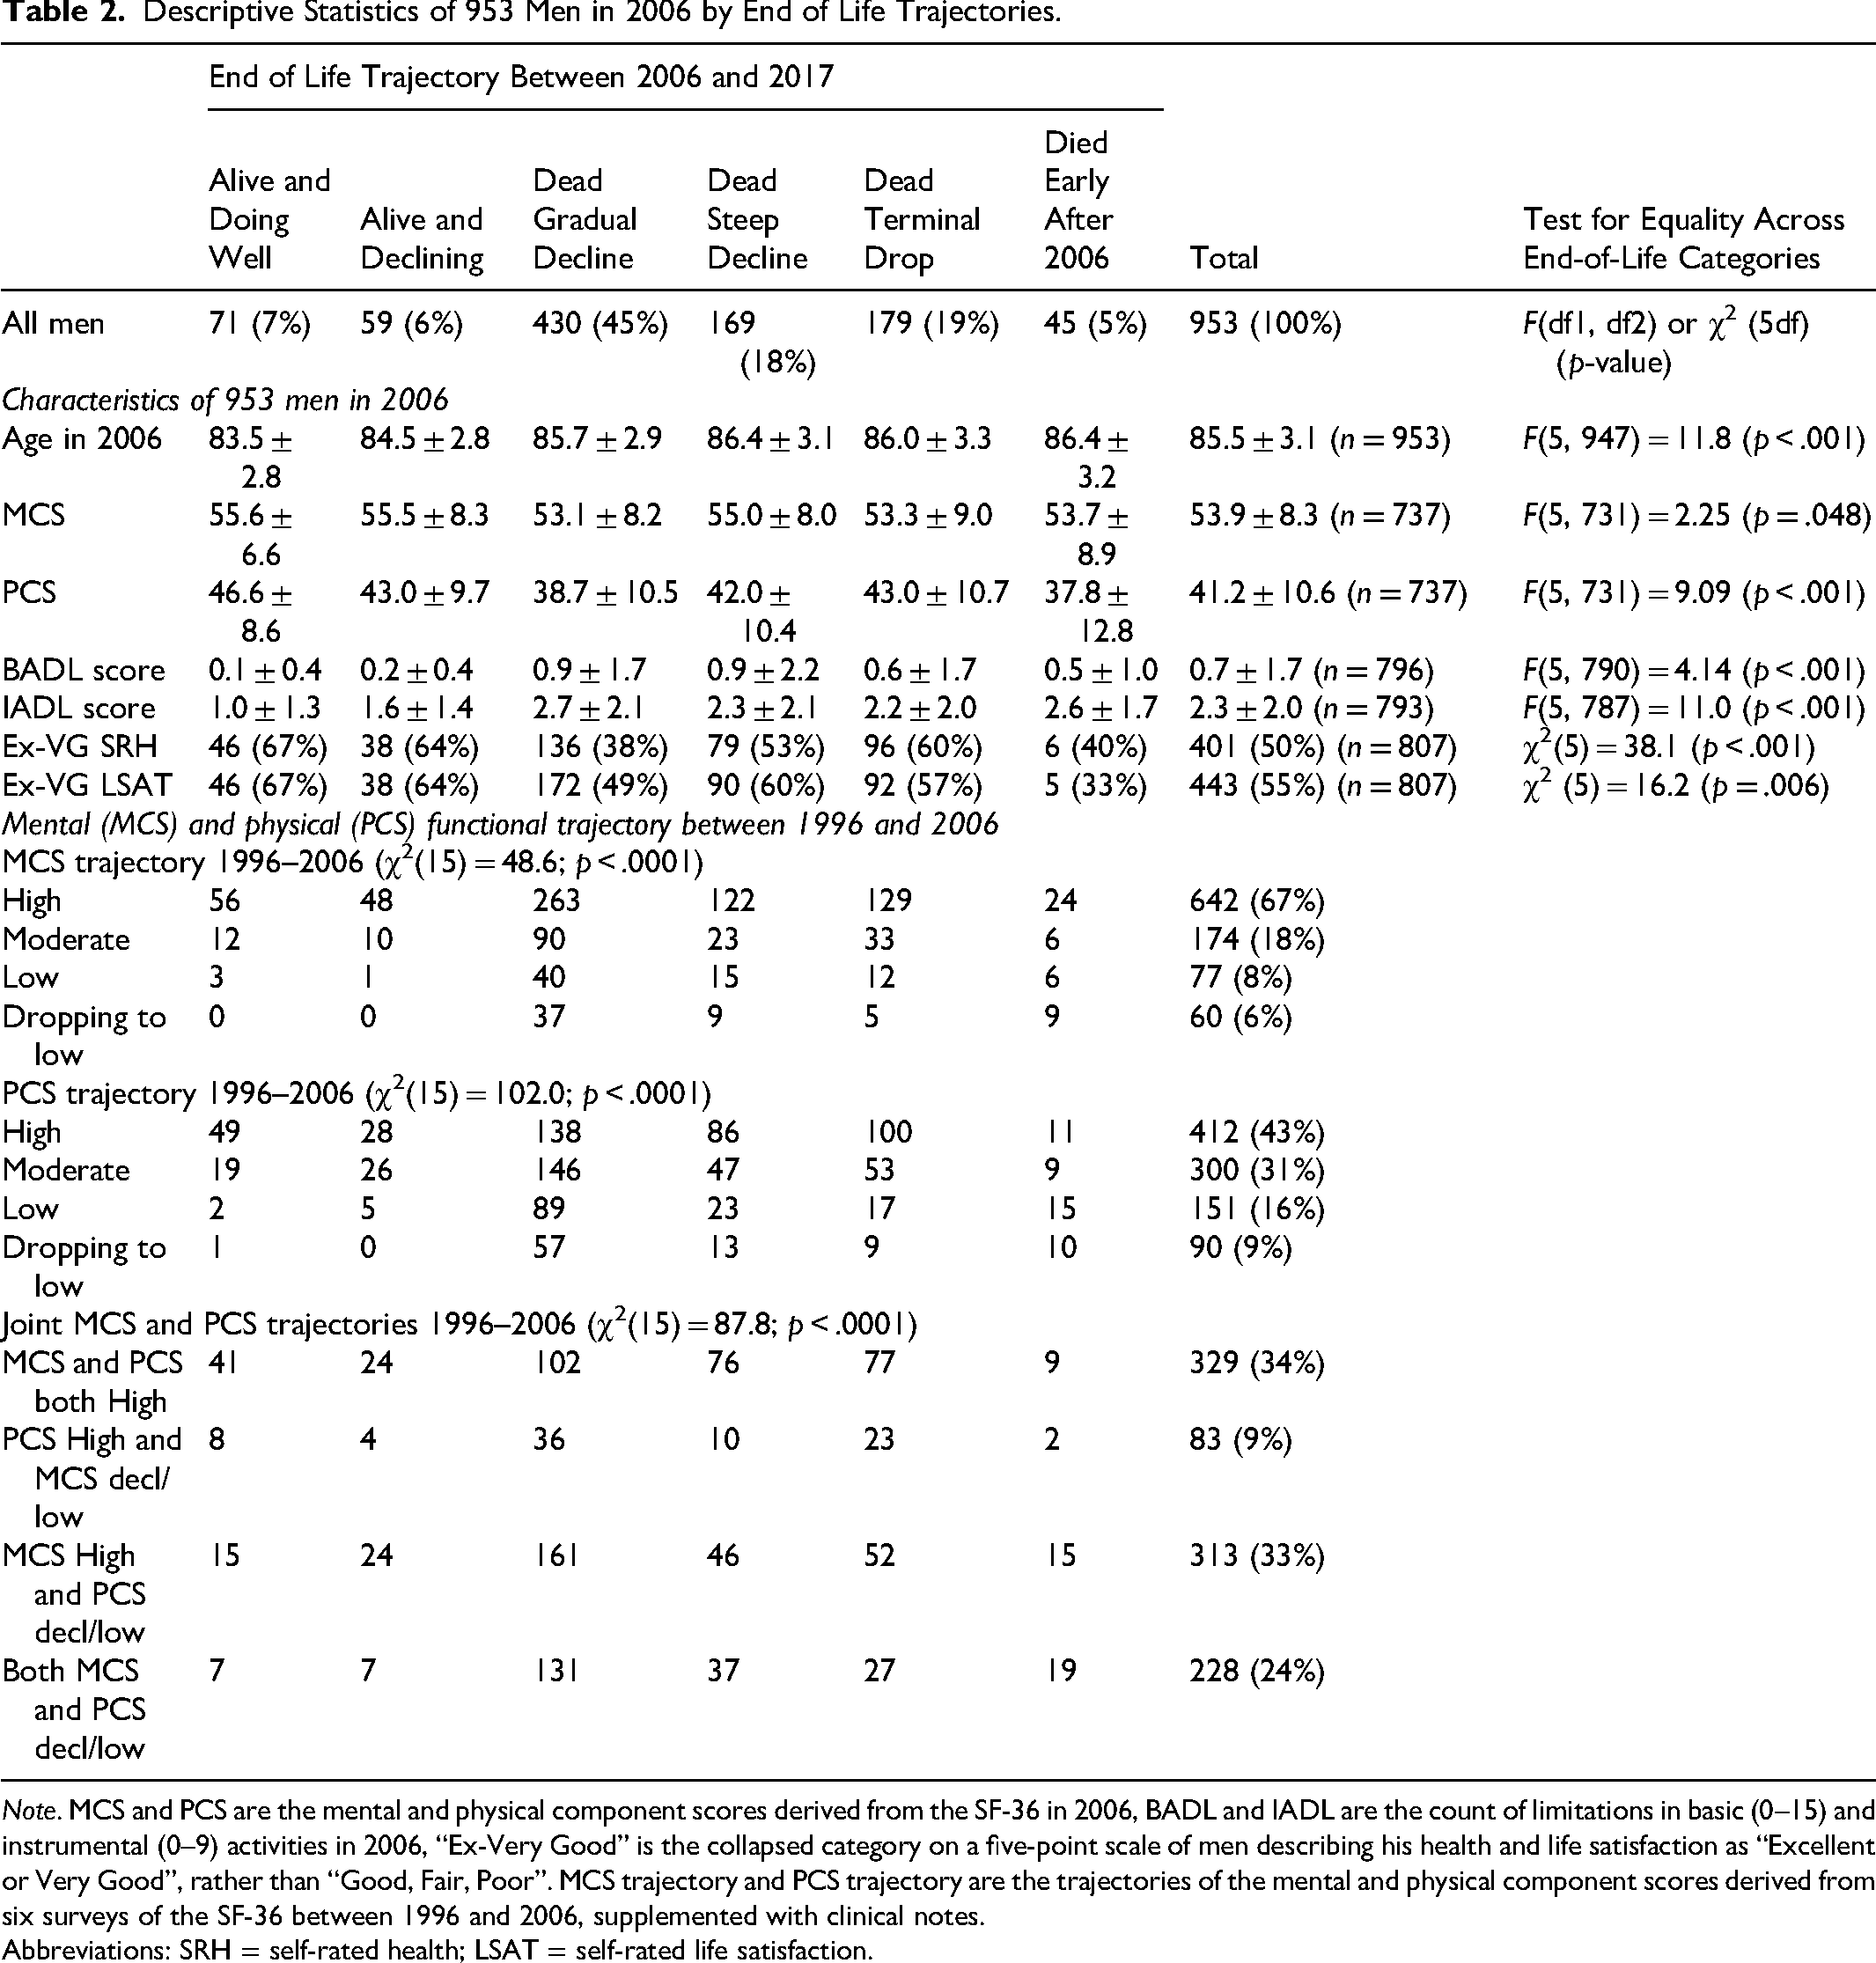
Note. MCS and PCS are the mental and physical component scores derived from the SF-36 in 2006, BADL and IADL are the count of limitations in basic (0–15) and instrumental (0–9) activities in 2006, “Ex-Very Good” is the collapsed category on a five-point scale of men describing his health and life satisfaction as “Excellent or Very Good”, rather than “Good, Fair, Poor”. MCS trajectory and PCS trajectory are the trajectories of the mental and physical component scores derived from six surveys of the SF-36 between 1996 and 2006, supplemented with clinical notes.
Abbreviations: SRH = self-rated health; LSAT = self-rated life satisfaction.
The prevalence of six chronic diseases, as well as reported alcohol misuse, known at 2006 were tabulated by end of life trajectory in Table 3. Seventy-one percent of men at that time had had at least one chronic disease reported. Chronic diseases, specifically diabetes mellitus, stroke, chronic obstructive pulmonary disease, as well as alcohol misuse were most prevalent in men showing subsequent decline after 2006. The age adjusted multinomial regression models of end of life trajectory with binary indicators of each disease found diabetes, stroke, chronic obstructive pulmonary disease and alcohol misuse known at 2006 were related to end of life trajectories. Prior ischemic heart disease, peripheral arterial disease or cancer diagnosis were not related to the end of life trajectory. Further, the count of chronic disease diagnosed prior to 2006 (ranging from 0 to 6), two or three or more chronic diseases diagnosed prior to 2006 was related to end of life trajectory. As the number of chronic conditions increases, the chances of a gradual decline to death increases, and to a lesser extent, so does the chances of a steeper decline to death. The relative odds of a “terminal drop,” that is, rapid decline to death, was not associated either with number of chronic diseases, nor to any specific previously noted chronic disease.
Age Adjusted Odds Ratios (with 95% CI) Derived from Multinomial Regression Models for 953 Men for Chronic Diseases Assessed in 2006. Reference Category for the Age Adjusted Odds Ratios Is Alive in 2017.
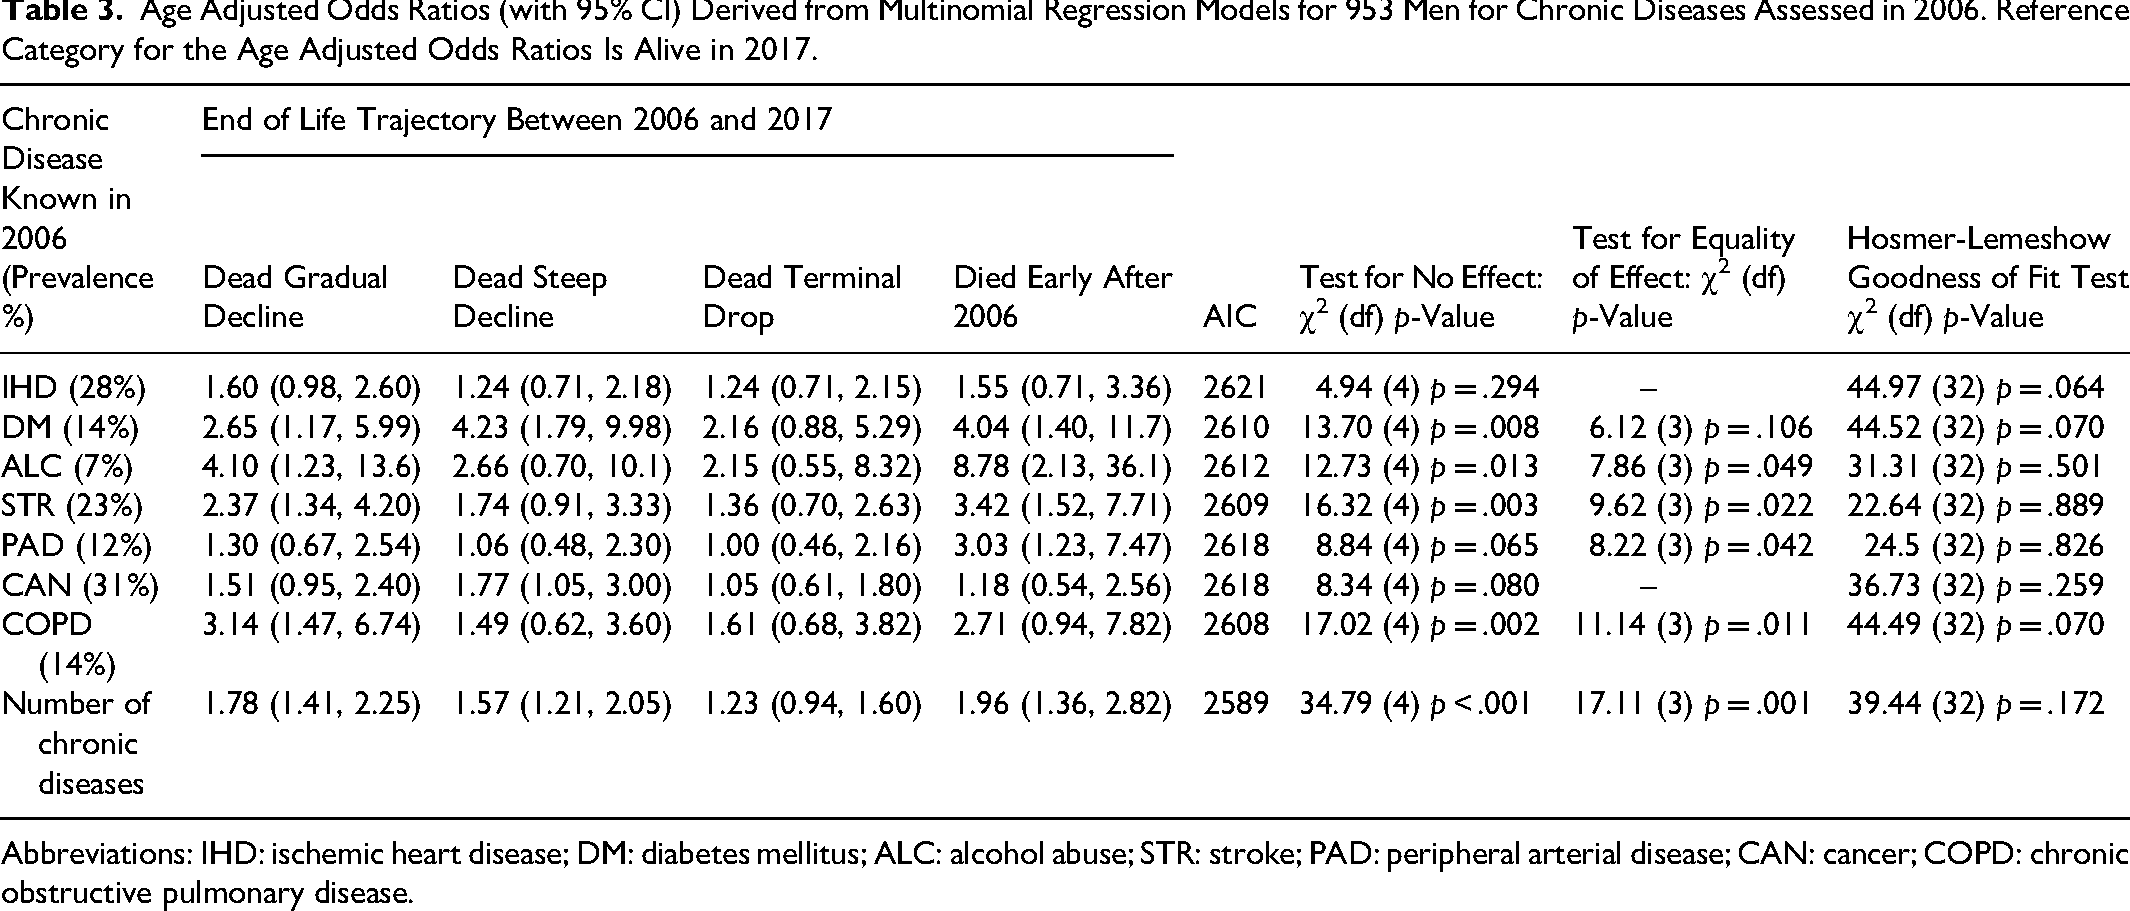
Abbreviations: IHD: ischemic heart disease; DM: diabetes mellitus; ALC: alcohol abuse; STR: stroke; PAD: peripheral arterial disease; CAN: cancer; COPD: chronic obstructive pulmonary disease.
Differences of functional status and health-related quality of life in 2006, and prevalent disease were explored for variation across end of life trajectories. A multinomial regression model, with the two combined “alive categories” as referent for reporting odds ratios and 95% confidence intervals in Table 4. Age was included in all regression models. Mental and physical health, functional status, self-reported limitation and self-assessment of health and life satisfaction were statistically significant, meaning each of these constructs was able to distinguish patterns of end of life from men alive at 2017. The effects PCS, IADL and poorer self-rated health were most strongly associated with a gradual decline to death as well as the category of very quick death after 2006. The AIC statistics (smaller is better fit) for comparison of models based on the same individuals indicate physical functioning is a better predictor than mental functioning, and self-rated health a better predictor over life satisfaction. The non-significance of the equality of effect of MCS and BADL for the four categories of trajectories leading to death, indicates that while each is important, overall, separating dead from alive, their effects did not differ across the four trajectories to death. The groupings of trajectory patterns of functioning over the 10 years from 1996 to 2006 for MCS and PCS and the combination of the two were significantly associated with patterns of end of life decline. The lowest AIC was for models of categories of PCS trajectory indicating that the trajectory of physical functioning is more important than the trajectory of mental functioning to discern end of life trajectories.
Age Adjusted Odds Ratios (with 95% CI) Derived from Multinomial Regression Models for 953 Men for Independent Variable Assessed in 2006. Reference Category for the Age Adjusted Odds Ratios Is Alive in 2017.
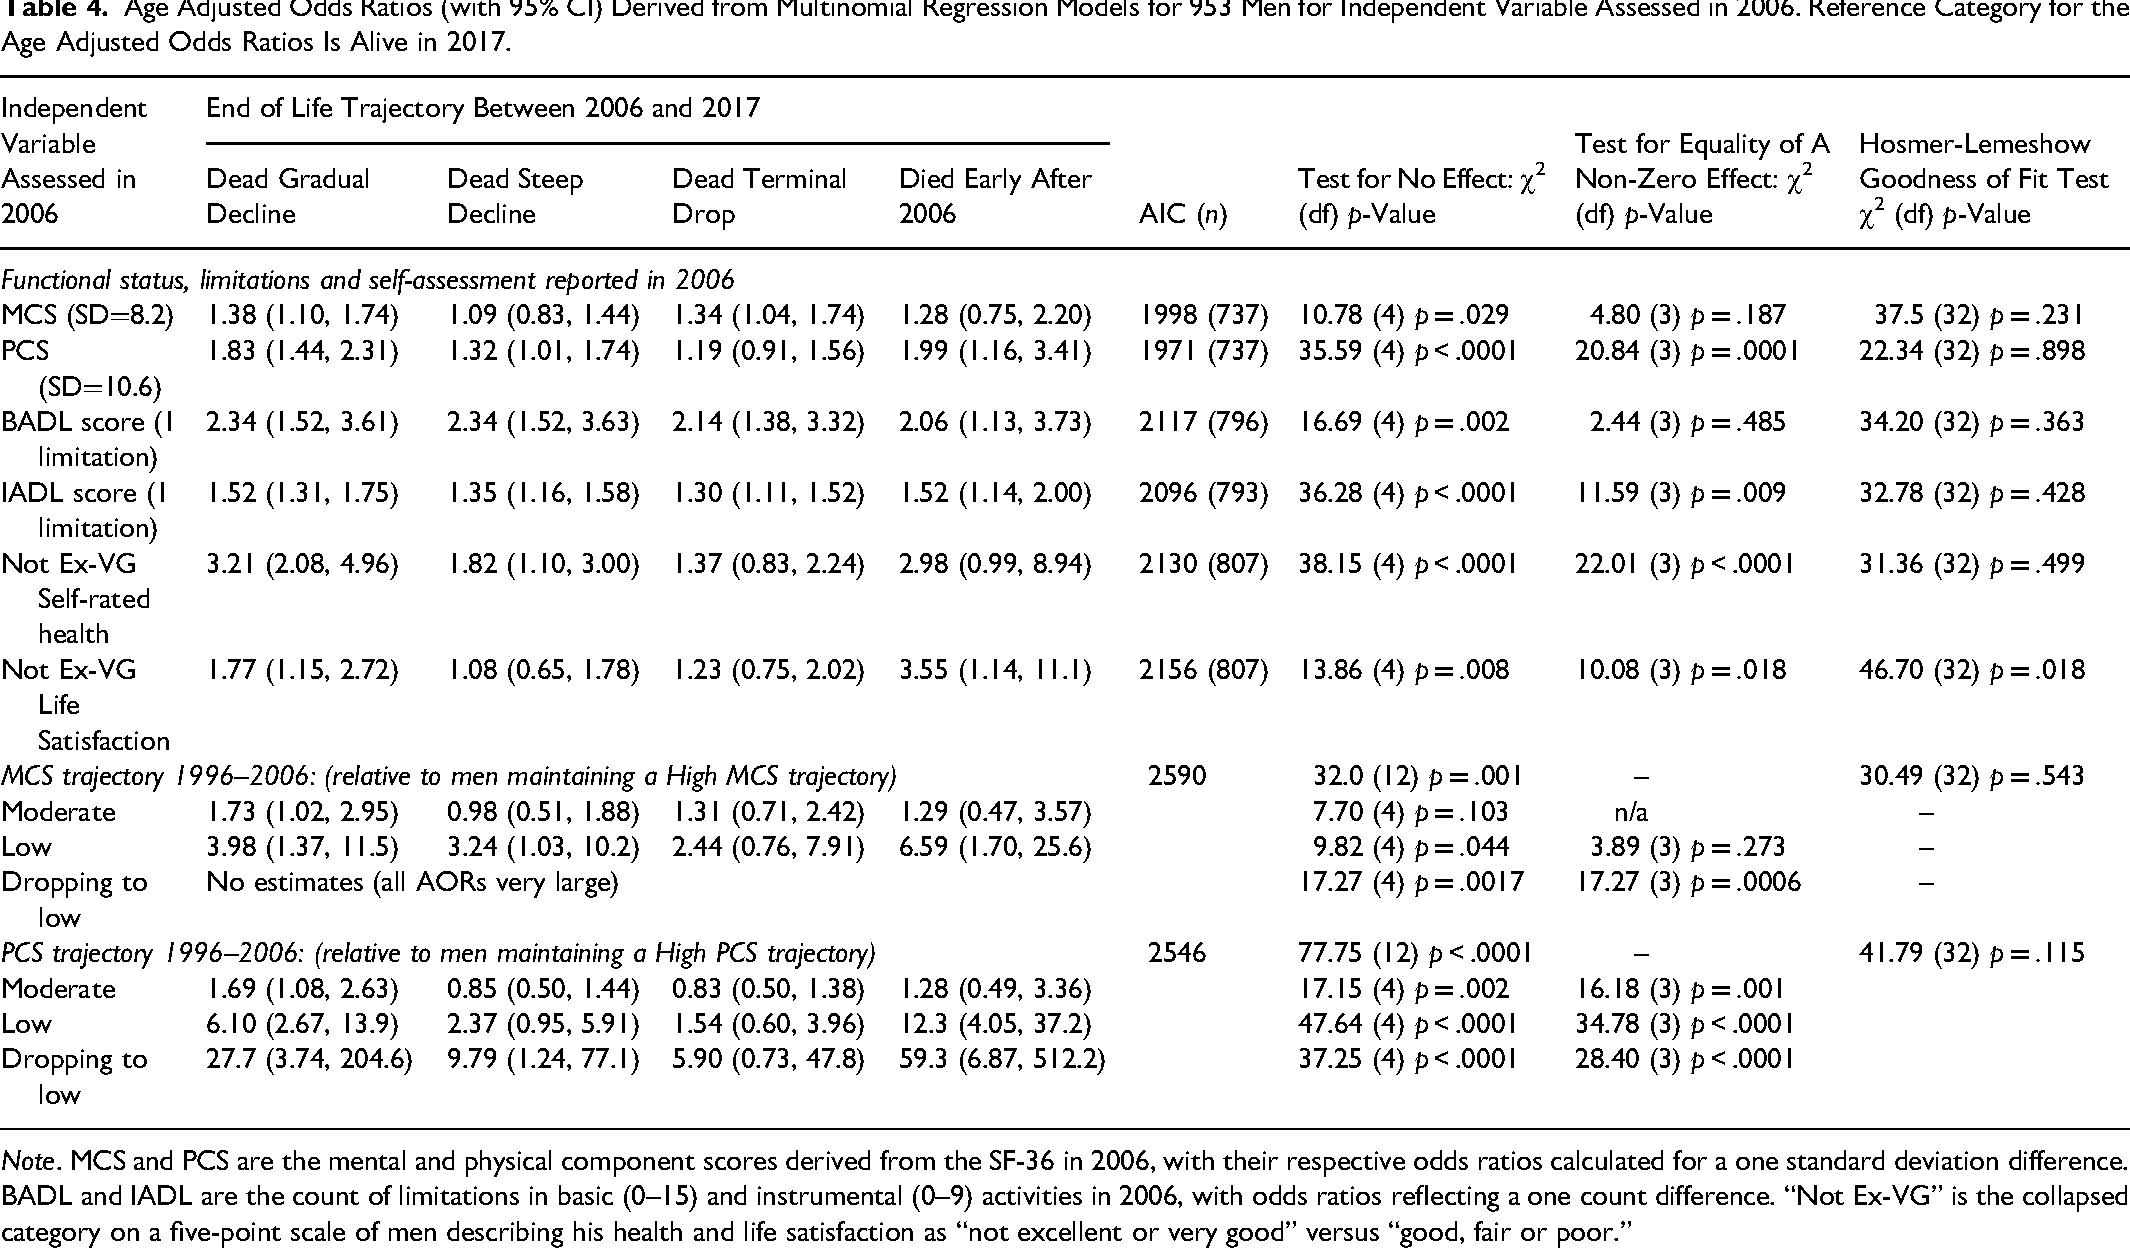
Note. MCS and PCS are the mental and physical component scores derived from the SF-36 in 2006, with their respective odds ratios calculated for a one standard deviation difference. BADL and IADL are the count of limitations in basic (0–15) and instrumental (0–9) activities in 2006, with odds ratios reflecting a one count difference. “Not Ex-VG” is the collapsed category on a five-point scale of men describing his health and life satisfaction as “not excellent or very good” versus “good, fair or poor.”
Chronic conditions in 2006, functioning at that time as well as the trajectory of functioning from the previous 10 years, were examined in a multivariable, multinomial logistic regression model. A backward stepwise elimination process was used and the resulting model is presented in Table 5. Together, age, physical functioning at 2006, the presence of instrumental ADL limitations and prior diagnoses of diabetes mellitus and chronic obstructive pulmonary disease all contributed to this model. The joint contributions of all three areas examined, functioning, limitations and chronic disease separate likelihood of different end of life trajectories. All areas are associated with a gradual decline to death.
Odds Ratios (with 95% CI) Derived from the Final Best Fit Multivariable Multinomial Regression Model for 953 Men with Independent Variables Assessed in 2006.
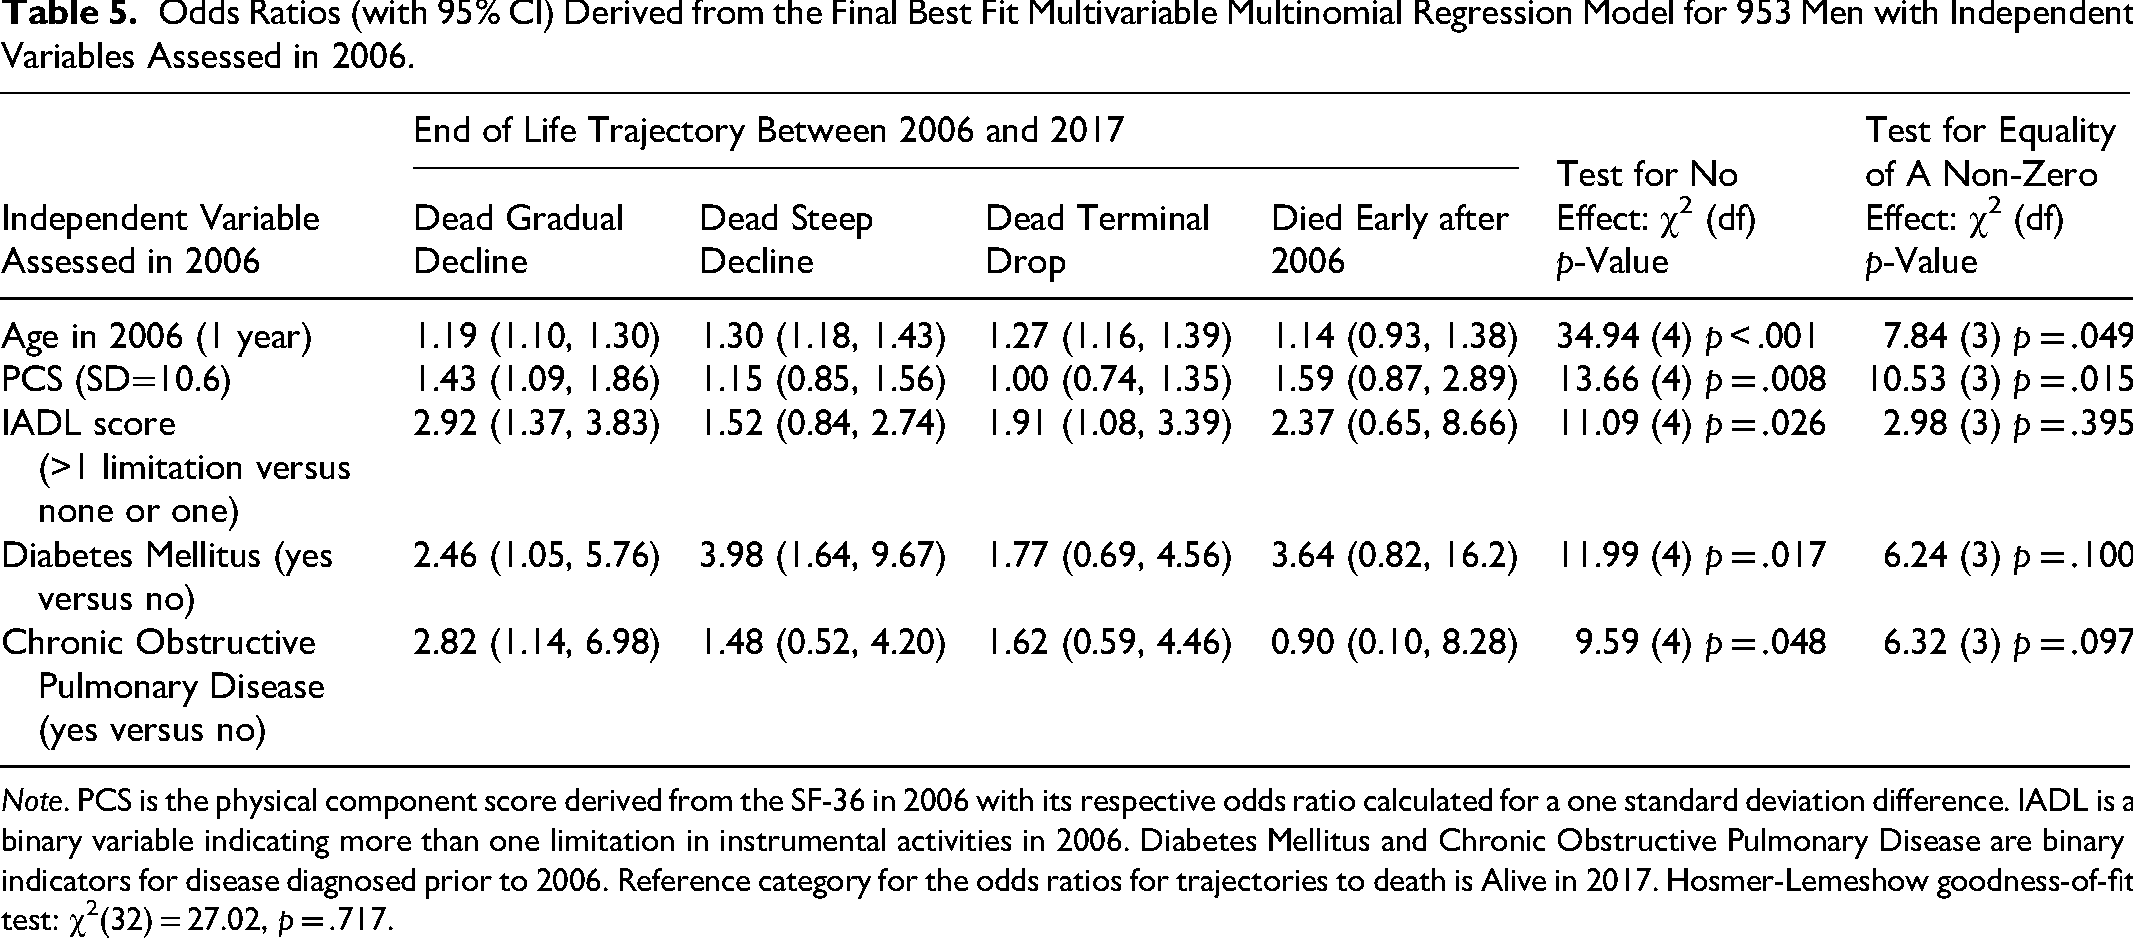
Note. PCS is the physical component score derived from the SF-36 in 2006 with its respective odds ratio calculated for a one standard deviation difference. IADL is a binary variable indicating more than one limitation in instrumental activities in 2006. Diabetes Mellitus and Chronic Obstructive Pulmonary Disease are binary indicators for disease diagnosed prior to 2006. Reference category for the odds ratios for trajectories to death is Alive in 2017. Hosmer-Lemeshow goodness-of-fit test: χ2(32) = 27.02, p = .717.
Discussion
We have conducted a prospective analysis of the end of life experience of a cohort of men over an 11-year time frame. Four distinct patterns of dying were classified. One pattern clearly describes a long-term slow decline in functioning leading to death. This pattern was the most frequent, in almost half the men studied, and can include a relapsing and remitting pattern observed in practice with older adults experiencing repeated insults to their health (e.g., falls or fractures), and with recovery and rehabilitation improving functional status, but frequently not to the level prior to the insult. It may also include a steady, gradual decline with no clear perturbations. The other patterns, noted in approximately equal proportion, include a steeper decline of less than 2-year duration, and one of terminal drop in function immediately prior to death. Each of these patterns accounts for about one in five deaths. Finally, after 11 years of follow-up, 13% of the men were still alive.
This analysis has contributed to an understanding of the distribution and determinants of end of life patterns to death of old men. We found that not all of the factors in the WHO Framework were consistently related with each other. That is, declines in one domain did not necessarily reflect declines in other areas. Overall, physical functioning was noted as the most common decline, in most men. However, coincident with this decline, other domains remained positive. Psychological well-being, social relationships and the general environment remained positive despite the decline in physical well-being. Moreover, many of the participants had mixed patterns of change in many of these domains, experiencing both positive and negative effects within that domain. Understanding the complex relationship within a domain and between these domains is an important question for future research.
Several factors, including both physical and mental functioning, self-perceptions of health and satisfaction with life, and diagnosed chronic disease predicted the pattern of decline prior to death. Those with a higher number of chronic illnesses were more likely to experience a slow, gradual decline to death compared to those with a lower burden of illness. Additionally, we found that some specific diseases: notably chronic obstructive pulmonary disease, stroke and diabetes were strongly associated with a gradual decline to death. We also noted that those with poor physical functioning at baseline were more likely to experience a gradual trajectory to death. Moreover, the trajectory of physical functioning, more so than the trajectory of mental functioning, predicted the subsequent pattern to death.
Previous literature has identified different patterns of decline to death. Lunney et al. (2003) noted four patterns while Gill et al. (2010) noted five. However, in subsequent analyses of the same cohort study considering a longer time frame, slightly different trajectories were noted (Stolz et al., 2021), which more closely resembled the trajectories noted by Lunney et al. (2003). We reviewed data available from chart review and from questionnaire responses directly. We did not consider statistical trajectory analyses. Yet, we identified relatively similar trajectories using this less quantitative approach. Our approach has strengths and weaknesses. We do not rely upon a single diagnosis for determining the trajectory. Techniques which identify a single disease - often the cause of death - as the sole cause of a disability trajectory may become problematic in older populations where multiple chronic conditions accumulate. Indeed, we noted that the presence of multiple conditions results in different trajectories than the presence of only a single disease. Some latent class models may also not detect oscillating courses of disability, whereas a human review of the data may identify this course more easily. However, our approach may introduce some subjectivity into the assessments. We attempted to minimize this by using the WHO criteria, and by multiple independent reviewers.
While perhaps not surprising to clinicians, these findings are important. Older adults with a high disease burden should be monitored closely over time. Prevention and appropriate management of these chronic conditions may improve the quality of life/dying, while poor care, or overly aggressive care may worsen quality of life. Determining the values and preferences of older adults with multiple chronic conditions is therefore paramount in providing appropriate care. Within the 5Ms framework of Geriatric Medicine of the Canadian and American Geriatrics Societies, this has been referred to as what “Matters Most” to older adults (Molnar & Frank, 2019).
Our findings are important for health care policy planning. Since there are heterogeneous patterns of change in health, there must be a flexible, individual approach to services. Some individuals will decline at a steady rate, and will need a steady predictable change in health and social services over time, but others with a more rapid decline will need more rapid adjustments in care. While this would appear obvious, services are often rigid, task oriented (Olsen et al., 2019) and not responsive to the changing health of a patient. Conversely, a change in the trajectory of well-being should prompt consideration of new clinical issues.
Specific to our investigation, although the MFUS continues to this day, it seemed reasonable to restrict the follow-up time for our research question to 2017, as the vast majority of men had died, and his distal proximity to factors considered of mental and physical functioning, activity limitations and disease diagnoses, are quite likely to have changed during the interim. It also removes the confounding period effect of the recent pandemic.
In our cohort of older men, measures of functioning, specifically physical functioning was related to trajectory of end of life. The level of physical functioning in 2006, more than the previous pattern of physical functioning change during the previous 10 years, was a more important factor in separation of trajectories to death. Personal assessment of health and life satisfaction plays a role in determining end of life pattern.
Footnotes
Acknowledgements
We would like to thank previous investigators, staff and volunteers with the Manitoba Follow Up Study over the years. We would particularly like to thank the participants for their enthusiastic participation over many decades.
Ethical Approval
The analyses for this manuscript were approved by the Health Research Ethics Board of the Bannatyne Campus of the University of Manitoba. The Manitoba Follow Up Study antedates modern informed consent procedures and the Health Research Ethics Board subsequently determined that sustained participation in the cohort study constituted informed consent. Currently, signed consent is included in the annual maintaining contact questionnaire.
Author Contributions
Robert B. Tate and Philip D. St John obtained funding and are involved with the design and conduct of MFUS; both obtained funding and conceived these analyses. Robert B. Tate conducted the analyses, and Philip D. St John and Tate interpreted the analyses. Robert B. Tate drafted the manuscript and Philip D. St John provided comments.
Funding
The authors declared the following potential conflicts of interest with respect to the research, authorship, and/or publication of this article: MFUS has received funding from a wide variety of sources over its course. Currently, the study is funded by charitable donations from study members and families. This work was supported by the Canadian Institutes for Health Research.
Declaration of Conflicting Interests
The authors declared no potential conflicts of interest with respect to the research, authorship, and/or publication of this article.
Data Availability
The participants of this study did not give written consent for their data to be shared publicly, so due to the sensitive nature of the research supporting data is not available.
Sponsors’ Role
Formal funding agencies have had no role in the design, methods, subject recruitment, data collection, or analysis and preparation of paper. Study members have provided periodic feedback and advice on MFUS; but had no role in the design, methods, subject recruitment, data collections, or analysis and preparation of paper.