
Abstract
Keywords
There are at least three prominent population trends in the United States that will influence educational access and equity conversations in higher education. The first is that the population is projected to be more racially and ethnically diverse, and the second is that an increasing number of individuals will be foreign born (U.S. Census Bureau, 2015). The projected increase in racial and ethnic diversity and the number of foreign-born immigrants suggests a third trend—that more individuals whose primary language is not English will enter higher education. A growing diverse and dual-language student population has led to an emerging body of K-12 policy literature focused on English Language Learner 1 in primary and secondary classrooms (e.g., Flores & Drake, 2014; Núñez & Sparks, 2012; Robinson, 2011; Robinson-Cimpian & Thompson, 2016; Suárez-Orozco, Pimentel, & Martin, 2009). However, there is limited empirical research publication on how these students fare in higher education.
Among various types of higher education institutions, community colleges are open-access institutions that serve a significant proportion of underrepresented students (Bailey, Jaggars, & Jenkins, 2015; Clark, 2008; Grubb & Gabriner, 2013). In particular, California community colleges enroll about 2.4 million students each year, which amounts to more than 20% of all community college students in the nation (California Community Colleges Chancellor’s Office, 2017). Furthermore, as open-access institutions, community colleges play a significant role in educating California’s growing immigrant population (Bunch, Endris, Panayotova, Romero, & Llosa, 2011). Mirroring the trends in California, community colleges nationwide are poised to play a big role in providing postsecondary access to the growing ethnically and racially diverse immigrant population.
This study focuses on students placed in the community college English as a Second Language (ESL) course in California, where the increase in immigrant population and racial diversity is noteworthy. Students in the ESL sequence include both international students and students who grew up in the United States but mainly speak another language at home. This study focuses on all students in the ESL sequence as well as a subset of students who most likely intend to remain in the United States after college. This subset of students is categorized as Generation 1.5/2.0 students who are either first- or second-generation immigrant students assessed with the ESL placement test. A closer look at this student population is warranted as they will participate in various societal functions, ranging from the workforce to voting and other forms of civic and societal engagements.
The purpose of this study is to provide a demographic profile of students placed in ESL and their progression patterns through the community college credit (shortened for credit-earning) ESL sequence, taking into account the time students spend in the sequence. This study examines students in the credit ESL sequence because unlike noncredit ESL courses, credit ESL courses more explicitly aim to strengthen students’ English language skills for college-level English. By using a survival model that estimates the relationship between students’ background characteristics on time to completing college-level English (i.e., English 101), 2 this study aims to answer two research questions:
This study focuses specifically on one community college in California as the course sequence and academic policies significantly vary by campus due to the decentralized nature of the California community college system (Melguizo, Kosiewicz, Prather, & Bos, 2014). However, the implications of this study can guide similar colleges in examining ESL placement policies and progression success. A better sense of who is placing where and how long it takes students to progress through the ESL sequence will be beneficial for institutional leaders, policy makers, and researchers who are seeking to improve educational attainment of immigrant students with varying levels of English proficiency.
Literature Review
Who Are Students in the ESL Sequence?
Typically, there are three broad categorizations of community college students in the ESL sequence: (a) Generation 1.5/2.0 students who are children of immigrants and have done most, if not all, of their schooling in the United States; (b) recent immigrants; or (c) international students who have traveled to the United States for educational reasons (Center for Student Success, 2007; Intersegmental Committee of Academic Senates Task Force, 2006). To elaborate on this first category, Generation 1.5/2.0 students may be younger in age and are proficient in conversational English (Bunch & Panayotova, 2008). These students typically went through some levels of K-12 schooling in the United States. Although proficient in conversational English, they may have grammar and pronunciation errors because their first language and the language spoken at home are typically not English. Scholars point out that these students are more likely than students whose primary language is English to be first-generation college-going students, highly transient, more likely to attend lower resourced schools in addition to being either native-born or foreign-born (Núñez, Rios-Aguilar, Kanno, & Flores, 2016). These students are not easily identifiable in the community college system as Generation 1.5/2.0 students. However, if these students take the ESL placement test or are referred to take the ESL exam, they are generally referred to the ESL sequence (Llosa & Bunch, 2011).
A second category of students is recent immigrants. These students tend to commute to school, attend school part time, are older in age, are more likely to have dependents, and are more affected by environmental factors that can affect persistence and completion (Bailey et al., 2015; Bean & Metzner, 1985; Erisman & Looney, 2007; Grubb & Gabriner, 2013). Examples of environmental factors include work and family responsibilities such as whether students can adjust their work schedules. Furthermore, Erisman and Looney (2007) found that immigrant families are considerably more likely to earn income below 150% of the federal poverty level.
Finally, international students are those traveling from another country to obtain a postsecondary education in the United States. These students typically have completed their high school education in another country and have a foreign secondary diploma. The United States remains a top destination for international students, with California as the most popular location (Zong & Batalova, 2018).
Relationship Between Student Characteristics and Community College Outcomes
Various student characteristics explain the patterns and trends in how students place, enroll, and complete ESL courses. Prior studies underscore the importance of exploring the association between student characteristics and community college success (e.g., Bailey, Jeong, & Cho, 2010; Calcagno, Crosta, Bailey, & Jenkins, 2007; EdSource, 2008; Erisman & Looney, 2007; Fong, Melguizo, & Prather, 2015; Núñez & Sparks, 2012; Scott-Clayton, 2012). To describe the patterns and trends between student background factors and the ESL course progression rate, this study explores the association between various covariates (race, gender, language, citizenship status, and educational background) and time to event (time students take to complete English 101).
Bailey et al. (2010) found a persistent gender effect among students in both developmental math and reading sequences. Specifically, they found that men had lower odds of progressing through the sequence. Calcagno et al. (2007) found that older students in Florida community colleges had a higher conditional probability of completing a degree or certificate than comparable younger community college students. These studies suggest that certain characteristics such as gender and age are covariates to consider when modeling outcomes in the community college setting.
Race and primary language are also commonly used student-level covariates. Examining the sorting of ESL students 3 in higher education, Núñez and Sparks (2012) found that ESL students were predominantly from Hispanic and Asian backgrounds and concluded that students who primarily spoke a foreign language were just as likely as English-speaking students to enroll in 4-year selective institutions. They also found statistically significant differences in enrollment by race and prior education (e.g., grade point average [GPA]). These authors emphasized the multiple factors that interact with students’ identities which then influence persistence and success. ESL designation alone does not explain success in college as student characteristics are also correlated with outcomes.
Another factor that is relevant for immigrant students’ educational outcomes is citizenship status. Students with a visitor or a student visa and are granted temporary stay in the United States may have different motivations for attending college than citizens or permanent residents (Zhao, Kuh, & Carini, 2005). Zhao et al. (2005) found that international students reported spending more time overcoming academic challenges and less time relaxing and socializing than American students during their first year. Moreover, refugees (e.g., those who are unable to return to their home country) or temporary residents (e.g., those who are allowed to stay in the United States to work for a temporary period of time) may be more motivated to excel in courses to maintain their status in the United States (Bers, 1994).
Finally, prior education is one of the strongest predictors of success in developmental education (Scott-Clayton, 2012). Emerging research on the use of high school GPA and prior academic preparation levels to gauge college readiness shows than students’ high school performance is predictive of performance in community college (Ngo, Chi, & Park, 2018; Ngo & Kwon, 2015; Scott-Clayton, 2012). A foreign secondary diploma is equivalent to a high school diploma for recent immigrants. As such, students with a high school diploma or a foreign secondary degree may have a higher likelihood of community college course success.
Introductory College-Level English as a Milestone
Several studies caution against the emphasis on completion and graduation as the sole metric for success in community college (Bahr, 2014; Dadgar & Trimble, 2015). For example, Bahr (2014) argued that students experienced labor market benefits from taking just a few community college courses irrespective of degree or certificate receipt. Furthermore, previous studies note that individuals’ fluency in English is an indicator of the ease with which they can navigate and understand various societal, cultural, and democratic processes (Akresh, Massey, & Frank, 2014; A. Singer, 2004). Thus, this study examines a milestone in the progression through the credit ESL sequence, college-level English.
Reaching college-level English is an appropriate outcome to investigate when examining students placed in the community college ESL sequence. These students are a diverse student population with various educational goals (Grubb & Gabriner, 2013). For one, older students with family and work obligations may take language courses to better converse with their child’s teachers and other parents without the goal of obtaining a degree. In a different scenario, a student may take an ESL course to meet the language needs for vocational training. These students may be enrolled in a quarter/semester or two but not necessarily seek a formal degree. In yet a different scenario, some students may intend to obtain a formal degree and transfer to a 4-year institution. Given the diverse reasons for attending college among students placed in ESL, completing the credit ESL sequence and reaching English 101 is a milestone and a policy-relevant outcome for this population.
Data and Context
The transcript data used in this study come from one community college that enrolls a significant number of students in the ESL sequence. The rich transcript data include students’ demographic information and course enrollment information as well as their assessment and placement results. Before an in-depth discussion of the data and sample construction, below is a discussion of the college policy and practices pertaining to ESL learners to situate the study.
Urban College Context
The present study provides an in-depth examination at one college, Urban College, which educates more than 28,000 4 students each year and enrolls the largest number of ESL students in one of the largest community college districts in California. Researchers found that ESL course levels and sequence vary across colleges in California, ranging from two to nine levels across the state (Bunch et al., 2011; Rodriguez, Bohn, Hill, & Brooks, 2019). At Urban College, students may take up to six credit ESL courses before they can take English 101 (see Table 1). 5
Credit ESL Sequence at Urban College.
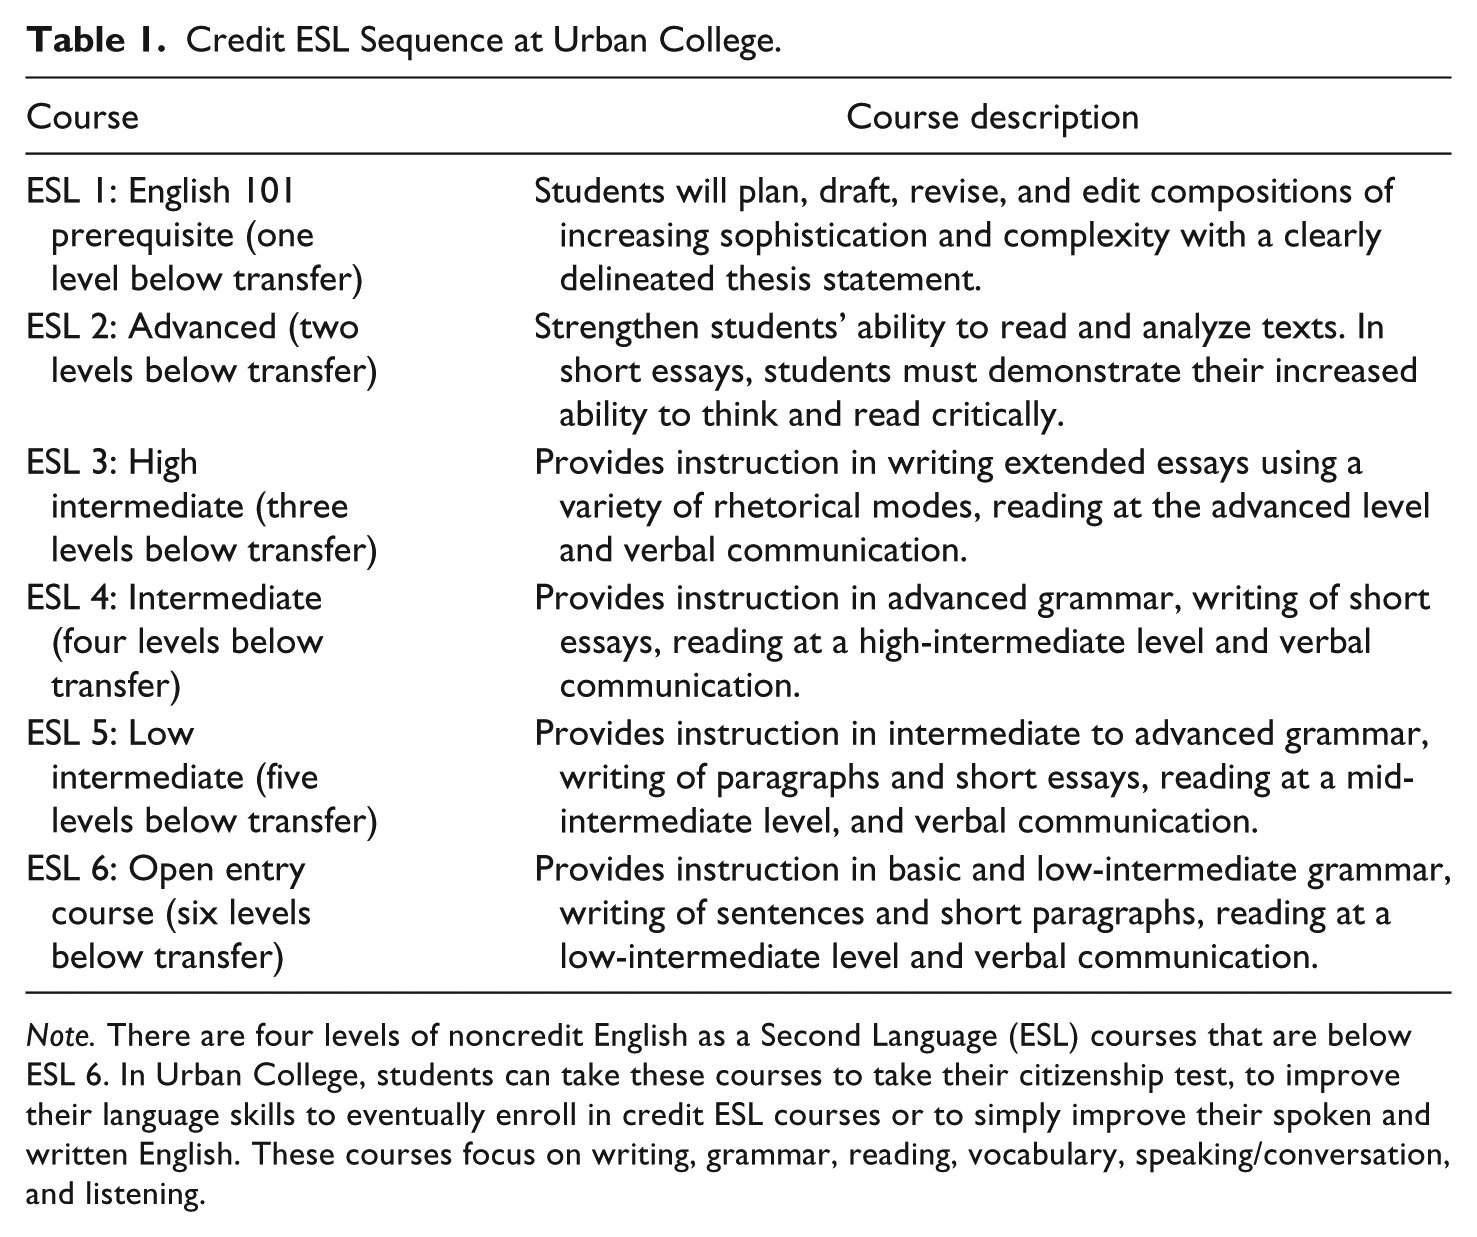
Note. There are four levels of noncredit English as a Second Language (ESL) courses that are below ESL 6. In Urban College, students can take these courses to take their citizenship test, to improve their language skills to eventually enroll in credit ESL courses or to simply improve their spoken and written English. These courses focus on writing, grammar, reading, vocabulary, speaking/conversation, and listening.
California is a unique context to examine the community college ESL sequence because unlike other states, some California community colleges allow students to choose whether to take the ESL or the English assessment test. In states like New York, the placement test and the writing test determine whether students should be placed in developmental English or ESL (Hodara, 2015). However, Urban College students are assigned to either ESL or developmental English courses if they are deemed not ready for college-level English based on a placement test that they opt to take. 6 Unlike the more streamlined math placement process (see, for example, Melguizo et al., 2014; Rodriguez, Mejia, & Johnson, 2016), students select whether they prefer to take the ESL or the English as a Native Language (ENL) test. If students take the ESL test, their placement score predominantly determines the level at which students begin their coursework in the ESL sequence. Although the underlying motivation for selecting one test versus another is unclear, the implication of students’ selection is that those who are quite proficient in English can place in the ESL sequence by choosing or being steered to take the ESL placement test.
Like other community colleges in this district and as previously mentioned, some ESL courses at Urban College are offered for institutional credit, whereas others are offered as noncredit courses. Noncredit ESL courses are offered to students who place below the lowest level of credit ESL sequence. These courses are not offered for credit and they do not count toward a degree or a certificate. There are four levels of noncredit ESL courses offered at this college and six levels of credit ESL courses. From interviews with various college personnel, 7 students typically take noncredit ESL courses to obtain their General Education Development (GED) or pass their citizenship test and their goal is not to take English 101. While it is possible that students who have only taken noncredit ESL courses may aspire to take credit ESL courses in the future, those who have only taken noncredit ESL courses are not included in the study. Students who have started off with noncredit courses and have eventually taken credit ESL courses are also not included in this study because it is not clear whether students taking predominantly noncredit courses aim to take English 101.
Sample
In this study, the sample includes all students who were ever assessed with the ESL placement test from 1999 to 2012 or have self-enrolled in an ESL course from spring of 2000 to fall of 2014. 8 Self-enrolled students are those who decided to take the lowest level of ESL course, also referred to as an open-entry course, per Table 1. Students are not required to have a placement score to take open-entry courses.
I categorize Urban College students as Generation 1.5/2.0 students in the ESL sequence if they have permanent residency or are citizens and have a high school diploma in the United States. It is important to note that this categorization is a proxy for Generation 1.5/2.0 identification. Based on these criteria, students who are categorized as Generation 1.5/2.0 may include older immigrants with significant work and family responsibilities as well as younger students who are more acclimated with the culture from attending primary and secondary schools in the United States. They may face similar challenges as first-generation college students or low-income students, such as gathering appropriate sources of college-related information and financial resources. Students with permanent residency or citizenship will remain in the United States and will participate in various economic, social, and cultural facets of the society in the long term. Thus, improving educational attainment of this population has implications for strengthening the economy and meaningfully engaging them in various societal functions.
First, I limit my sample to students who took the ESL assessment test between spring of 2005 and fall of 2012 and have subsequently enrolled up to fall of 2014. 9 To create an indicator of students’ ESL placement level that is comparable across cohorts, I cross-referenced Urban College’s course catalogs from 2005 to 2014. As previously mentioned, I only include students who have enrolled in credit ESL courses upon course placement. This means that I remove students who have only taken noncredit courses or for whom I do not have placement information. Furthermore, some students directly placed into English 101 and these students are also not included in the sample. This limits my sample to 5,371 ESL students. Next, students who are dual-enrolled high school students or have an associate’s degree or above are dropped from the sample (7% of the sample) as well as those who are born in or prior to 1965 (about 17% of the sample). As a result, the final sample is 4,456. Twenty-five percent of the sample (n = 1,138) are identified as Generation 1.5/2.0 students.
Table 2 lists the descriptive statistics of (a) all students placed in ESL at this large, urban district; (b) Urban College students placed in ESL; and (c) Generation 1.5/2.0 students attending Urban College. Most Urban College students in the ESL sequence are either Asian or Hispanic, similar to what Núñez and Sparks (2012) found using the Beginning Postsecondary Students Longitudinal Study, a nationally representative data of postsecondary students. Unlike how Núñez and Sparks defined their race categorization, I collapse the race categories into three binary variables, Asian, Hispanic, and Other, and add nuance by combining racial categorization with students’ primary language. Looking at the entire ESL sample (n = 4,456), 48% of the students indicated that they are Asian and primarily speak Chinese, and 24% of the sample indicated that they are Hispanic and primarily speak Spanish. Furthermore, 45% of the sample have a foreign secondary diploma, whereas 33% have a high school diploma from the United States. Looking at the Generation 1.5/2.0 immigrant sample, 70% are citizens and 30% are permanent residents, and 93% of Generation 1.5/2.0 students identify as either Asian or Hispanic.
Mean or Frequency Distribution of the Independent Variables Included in the Cox Model.
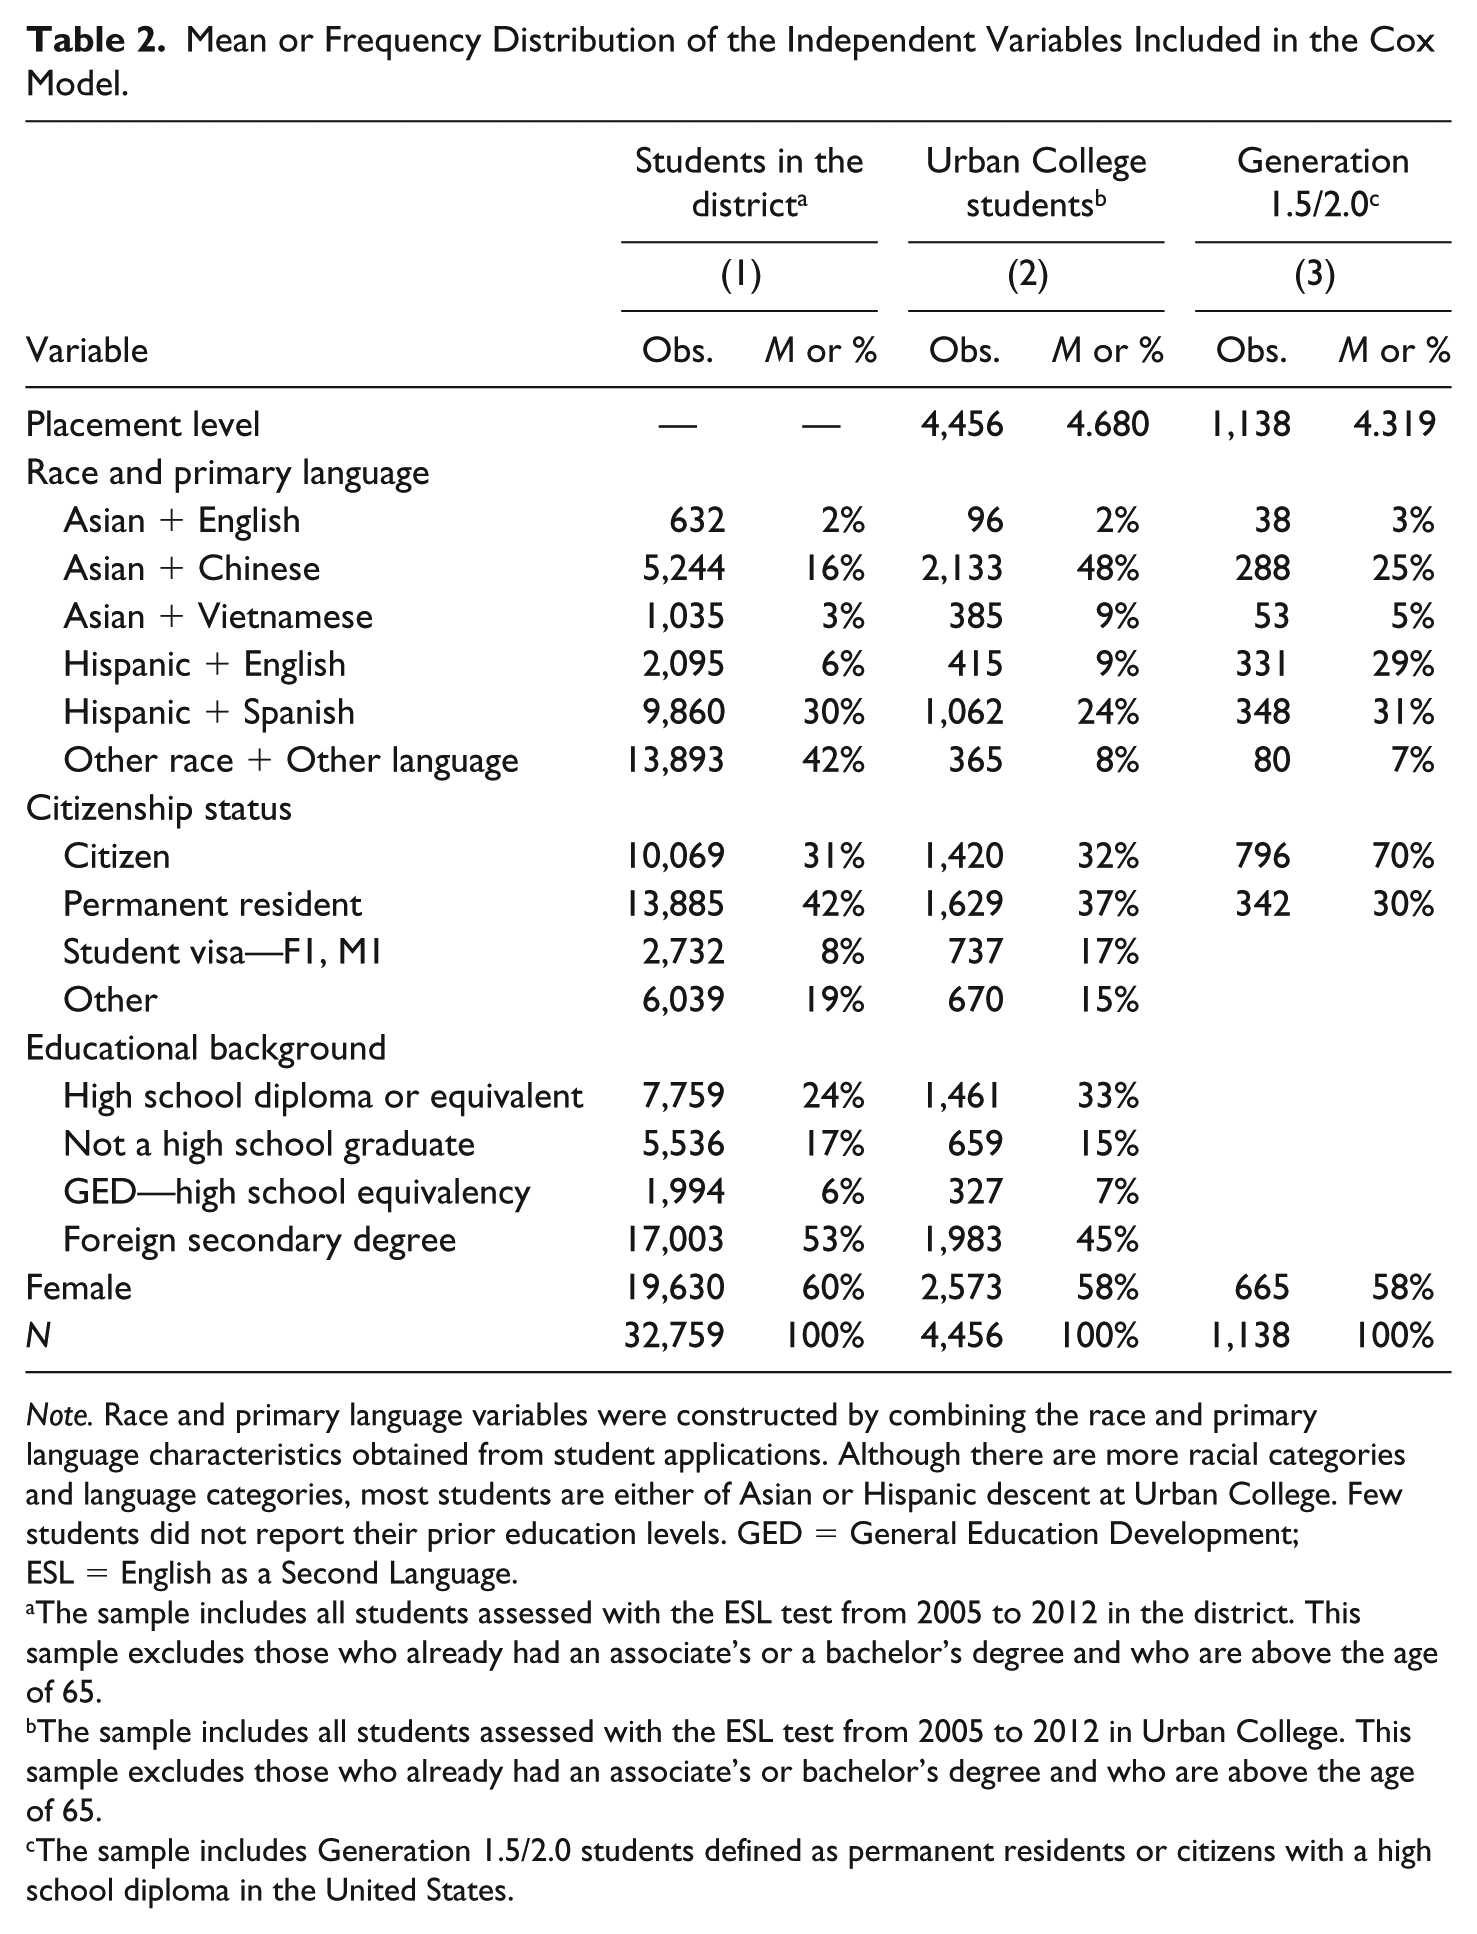
Note. Race and primary language variables were constructed by combining the race and primary language characteristics obtained from student applications. Although there are more racial categories and language categories, most students are either of Asian or Hispanic descent at Urban College. Few students did not report their prior education levels. GED = General Education Development; ESL = English as a Second Language.
The sample includes all students assessed with the ESL test from 2005 to 2012 in the district. This sample excludes those who already had an associate’s or a bachelor’s degree and who are above the age of 65.
The sample includes all students assessed with the ESL test from 2005 to 2012 in Urban College. This sample excludes those who already had an associate’s or bachelor’s degree and who are above the age of 65.
The sample includes Generation 1.5/2.0 students defined as permanent residents or citizens with a high school diploma in the United States.
Empirical Model
To look at the progression patterns, I first examine the percentage of students who attempted and passed each course based on where students initially placed in the ESL sequence. Then, I look at the percentage of Generation 1.5/2.0 immigrant students who attempted and passed each level conditional on their placement. Next, I estimate a Cox proportional hazards model in which the outcome of interest is the time students take to complete English 101 (i.e., the “event”) conditional on where they started in the sequence. Specifically, I estimate students’ hazard rates by background characteristics for the full sample as well as for the Generation 1.5/2.0 subsample.
Cox Proportional Hazards Model
Using a survival model in studying progression is appropriate because prior studies show that time and length of remediation are key factors in community college student persistence (Bailey et al., 2010; Boatman & Long, 2018; Fong et al., 2015; Melguizo, Bos, Ngo, Mills, & Prather, 2016). The survival analysis models time as the dependent variable. The assumption of using a logit, a probit, or a linear probability model is that completing English 101 as a dependent variable is time invariant (Jones & Branton, 2005). In other words, these models do not factor in the duration of time before an outcome is reached and assume that the probability of completing English 101 conditional on the covariates remains the same at each time period.
However, the amount of time students spend in developmental education is an important consideration in understanding its effectiveness (Melguizo et al., 2016). One can easily imagine some students having a higher likelihood of reaching college-level English (i.e., having a higher hazard rate) based on the level at which they place, the citizenship status (with citizens typically indicating longer residence), or indication of primary language. Given the diverse student population with varied educational goals in the community college ESL sequence, this study examines the duration of time before reaching college-level English.
Looking at which characteristics influence ESL students’ progression, I use a Cox’s proportional hazards model (Cox, 1972) 10 that estimates the probability that the student survives to English 101 among students who are assessed into one of the six ESL levels. The benefit to assessing the hazard rate is examining exactly whether and when an event occurs and the likelihood of experiencing the event at that particular time (Greene, 2012; Rabe-Hesketh & Skrondal, 2012). The event measured in this study is the time students take before completing English 101. The proportional hazards model given the covariates is specified below:

where i denotes student i and
Time to event is calculated as the number of years 11 students take to complete English 101, defined as completing English 101 with at least a D, from their first enrolled credit ESL course. In addition, I assume that events are absorbing, which means that once students complete English 101, they are no longer at risk of experiencing the event. In other words, once a student reaches English 101, the student is no longer in the risk set. Similarly, students who stop taking courses or have temporarily left the institution are also no longer in the risk set. Some students in the sample may have not experienced the event due to an arbitrary cutoff in the analysis, which typically hinges on the availability of data, called right censoring. The benefit to using a survival model is that the information of these censored individuals who have dropped out within the duration of the study can still be factored in as part of the equation—in other words, that the student survived at least to time t (Jones & Branton, 2005; Lacy, 2015).
I also include a proxy of the intent to complete college-level English by holding constant where students placed in math. During the time period of this study in this community college district, students placed into four distinct math levels: arithmetic, prealgebra, elementary algebra, intermediate algebra, and transfer-level math (Melguizo et al., 2014). Part of the requirements to obtaining an associate’s degree is passing intermediate algebra as well as English 101. This suggests that if students place in college-level math, students may enroll in the language sequence with the intention of eventually taking college-level English. Although not all ESL students seek to transfer to a four-year institution or even complete an associate’s degree, it is likely that Generation 1.5/2.0 students who enroll in language courses and have placed in higher levels of math attempt them with the intention of obtaining credits for completion. By holding students’ initial math placement constant, students in the same initial math level are compared with one another in the model.
Another assumption to using this model is the proportionality assumption, which states that the hazard function is proportional over time, conditional on the covariates. For example, the hazard profile for males should be proportional to women with a constant vertical separation (Singer & Willett, 1993). To formally test the proportionality assumption and the goodness of fit of the model, I do two things. First, I estimate the Cox–Snell residuals and see the fit between the estimated model and a straight-line slope of one. This is a goodness-of-fit test that looks at whether the model is appropriately specified and whether the proportionality assumption holds (Arjas, 1988). For all samples, the estimated residuals overlaid with the line closely, indicating good model fit. Second, I run the model and estimate the scaled Schoenfeld residuals. These residuals are calculated as the observed minus the expected values of the covariates at each failure time. Observing the plot, gender is the only covariate that violates the proportionality assumption. Therefore, I run the models separately by male and female.
I incrementally build the model by first accounting for differences by students’ background characteristics. Then, I include cohort fixed effects (cohort dummies) to account for different times at which students enter the model as the sample includes students who started the ESL sequence anytime between 2005 and 2012. Next, I control for math placement level to account for students’ intent to take college-level English. Finally, I include placement level to control for the level at which students initially started the ESL sequence. For example, one may hypothesize that starting off at Level 4 will have different implications for the length of time spent in the credit ESL sequence than starting one level below at English 101. Indeed, Bahr (2009) found that students who began at the bottom rung of the developmental/remedial ladder had barely enough time to complete college-level courses compared with those who started at the upper end of the sequence. I run these four models for all students as well as for Generation 1.5/2.0 students. The preferred specification reflects the rate of event per unit of time at risk, controlling for intent, placement level, and cohort.
Limitations
Before a discussion of the results, it is important to acknowledge that this study examines the ESL sequence at one community college in California. California community college districts have discretion over how they place students (Melguizo et al., 2014; Rodriguez et al., 2016). This means that ESL placement policies and the course structure (e.g., types of courses offered and the length of the sequence) vary across colleges (Rodriguez et al., 2019). Indeed, a statewide report noted that colleges use varied assessment measures to place students in ESL compared with math and English (Rodriguez et al., 2016).
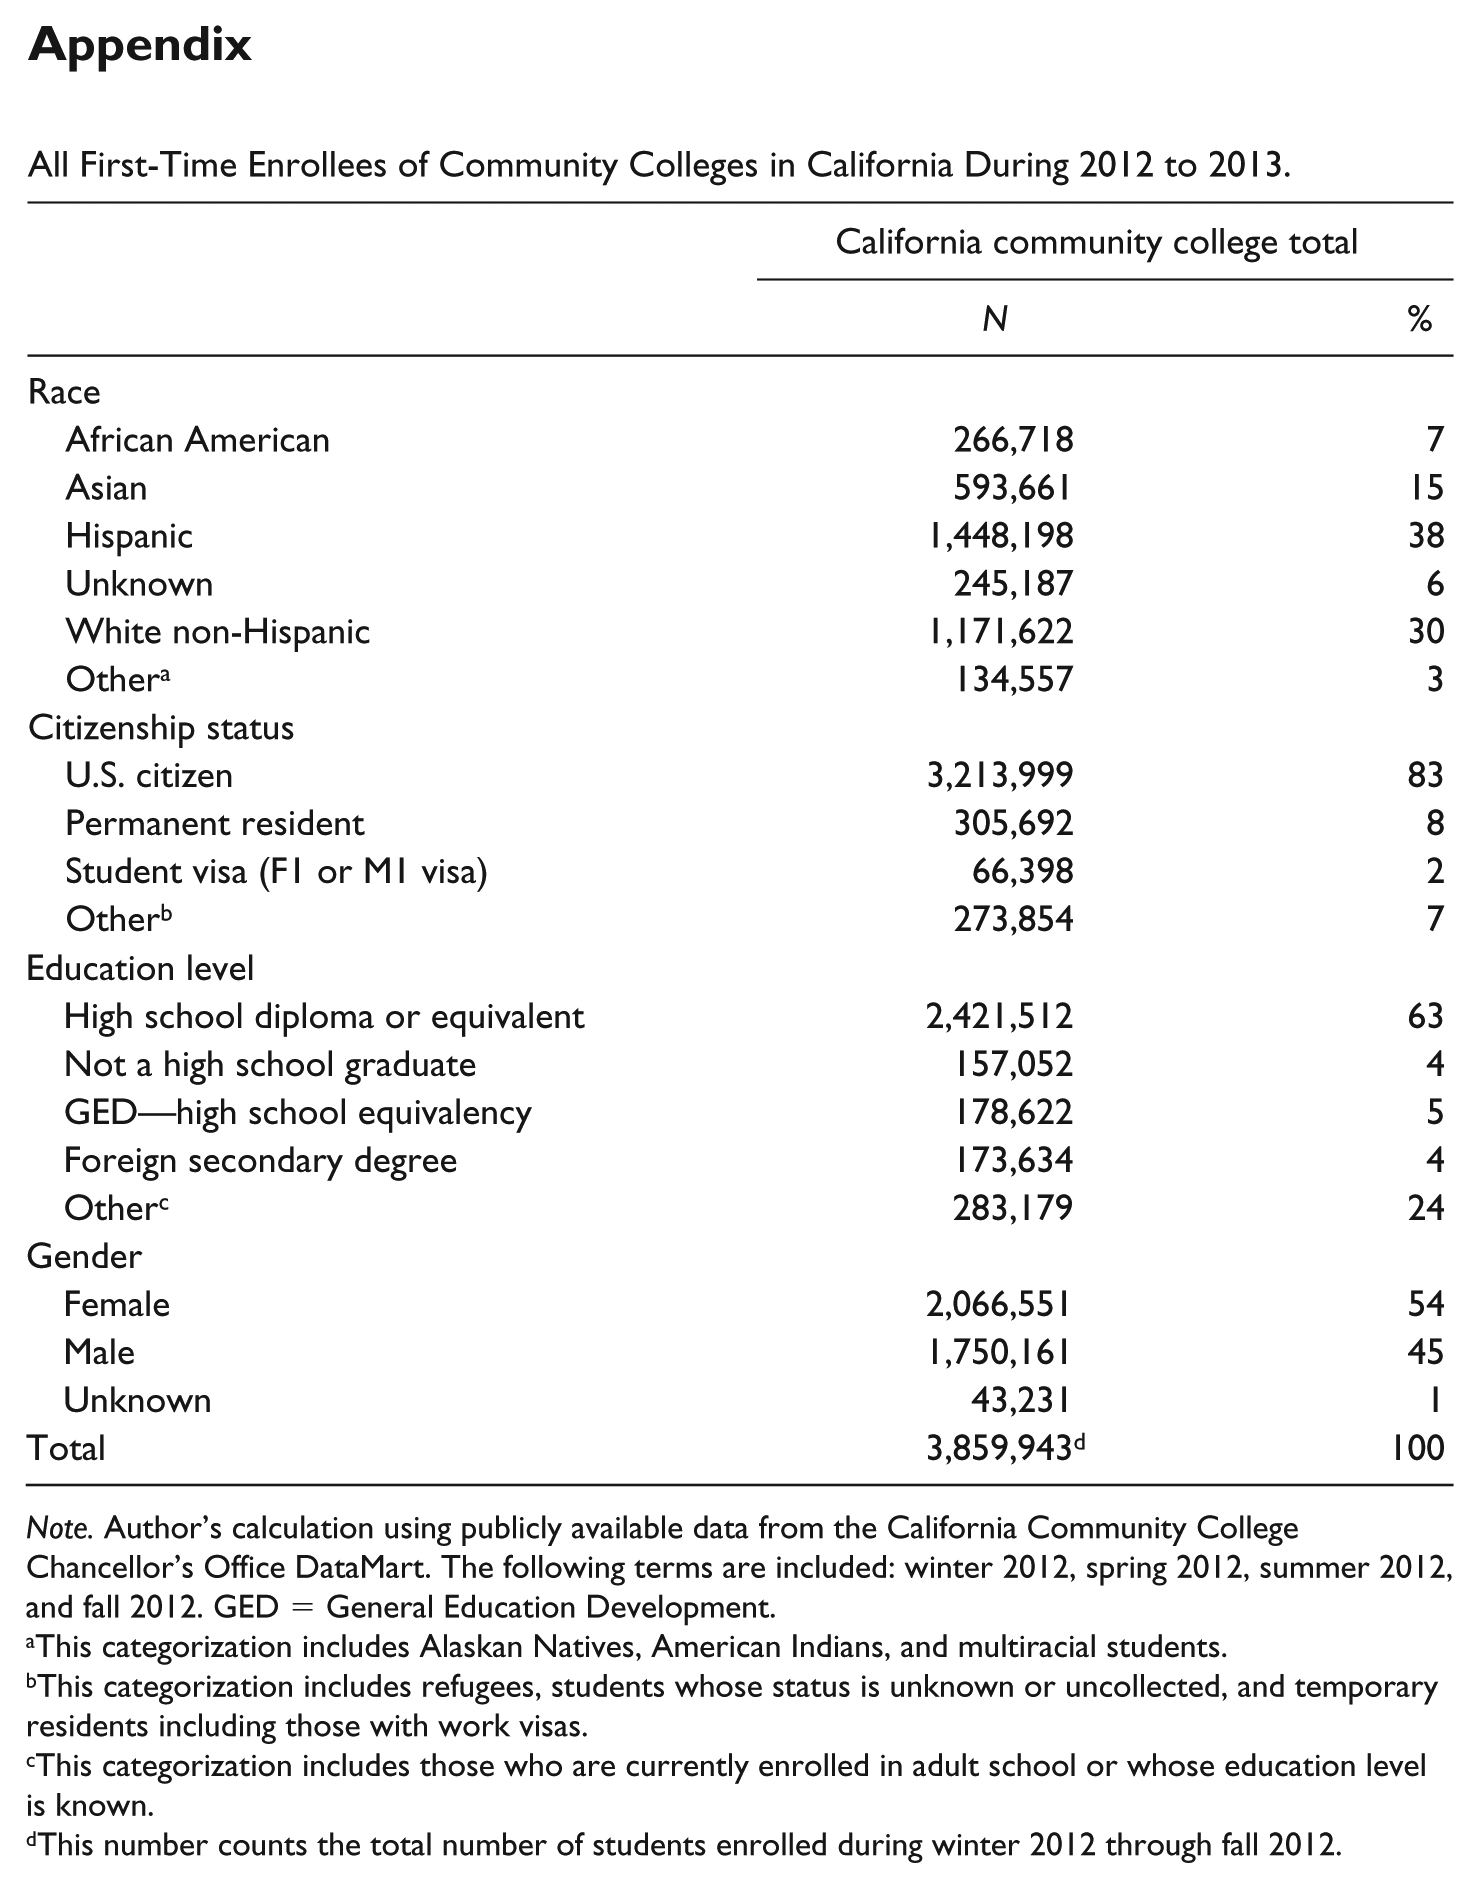
In the appendix, I reference publicly available data to examine how representative Urban College is compared with all California community colleges. Compared with all community college students in California, more students placed in ESL identify as Asian or Hispanic, fewer students are citizens, and more students have a foreign secondary degree (see the appendix). When comparing with all students placed in ESL in this district, a slightly larger proportion of students at Urban College are Asian and have a high school diploma (see Table 2).
Although the study is conducted at one college, this study brings to attention the potential educational trajectories of students placed in ESL across this district as well as other similar colleges in the state. By contributing to the emerging literature describing community college students placed in ESL, the study has analytical generalizability (Yin, 2013). The lessons gleaned from this study can be used to improve policy at different campuses and/or be used to further investigate the discrepancy in completion rate and the length of time spent in the ESL sequence, particularly among Generation 1.5/2.0 immigrants. Other colleges can better understand the types of students they serve through the findings of this study.
Results
To present an overview of how students are progressing, Table 3 shows the percentage of students who have attempted and completed their placed credit ESL course and the percentage of students who have attempted and completed English 101, by sample definitions. The attempted and completed rates are calculated for the full ESL sample (n = 4,456) and the Generation 1.5/2.0 sample (n = 1,138). International student sample (n = 593) results are presented for comparison. Attempted is defined as attempting the course at any point during 2005 to 2014 irrespective of whether the student dropped the course or withdrew, whereas completed is defined as receiving a grade of D or above or a P (e.g., pass).
Percent of Students Who Attempted and Completed Each Level of the ESL Sequence by Initial Placement Level and Immigrant Status.
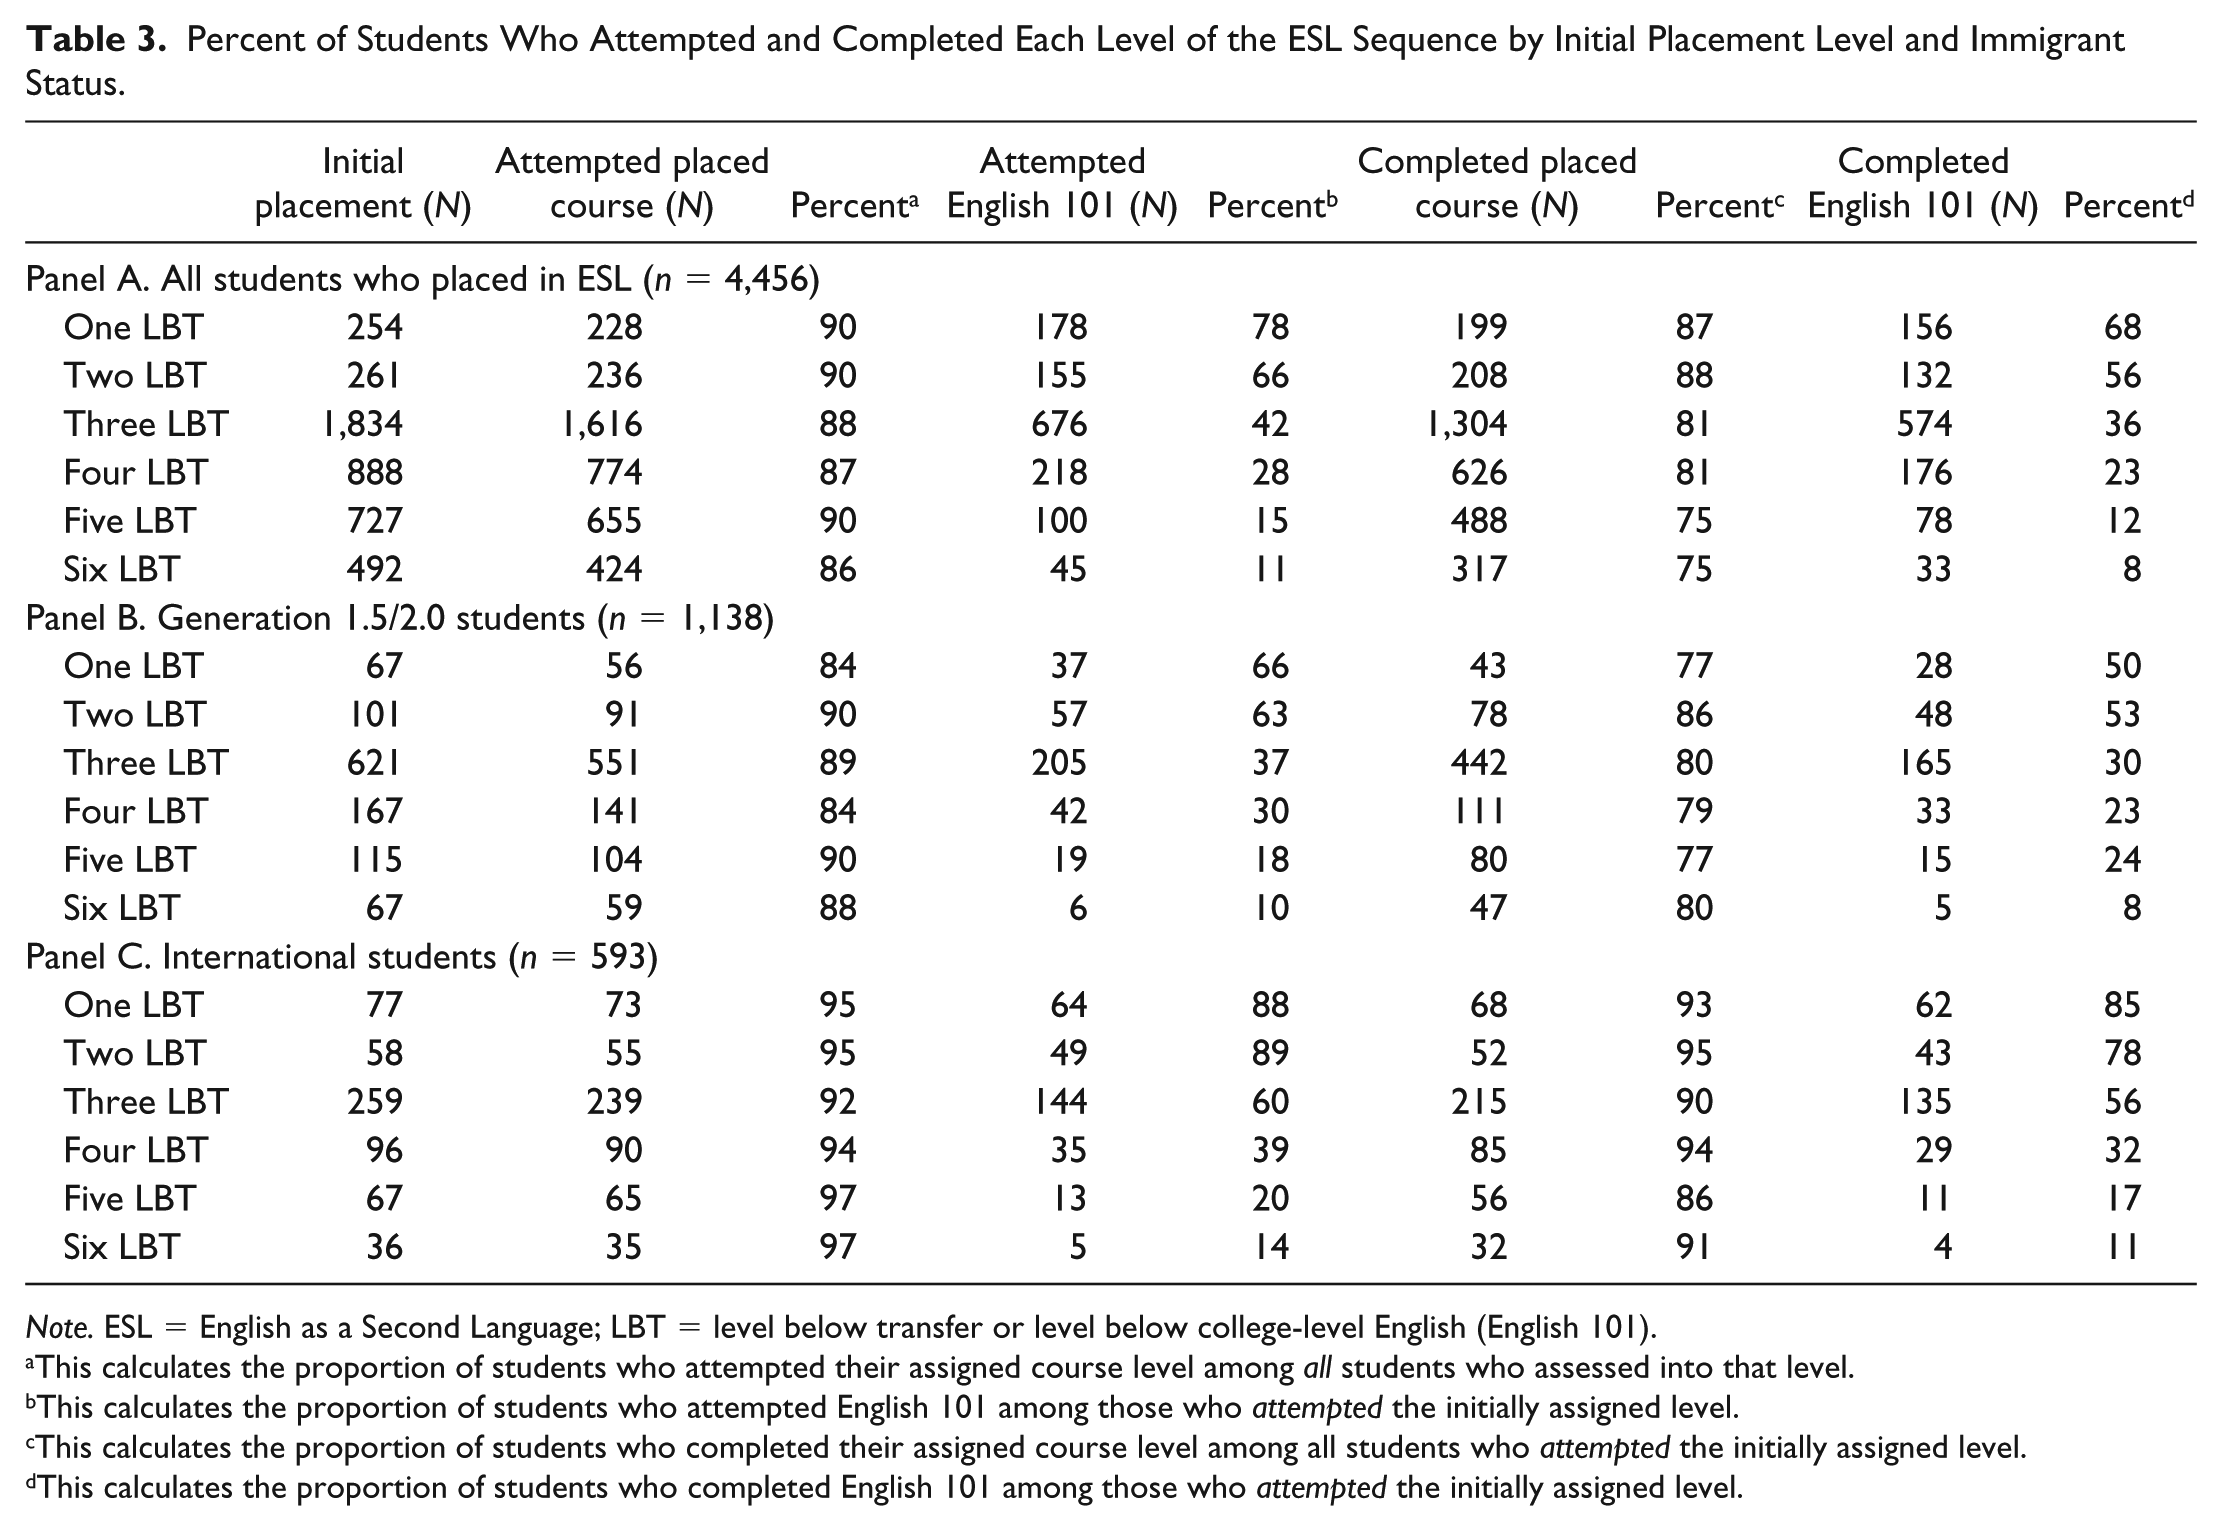
Note. ESL = English as a Second Language; LBT = level below transfer or level below college-level English (English 101).
This calculates the proportion of students who attempted their assigned course level among all students who assessed into that level.
This calculates the proportion of students who attempted English 101 among those who attempted the initially assigned level.
This calculates the proportion of students who completed their assigned course level among all students who attempted the initially assigned level.
This calculates the proportion of students who completed English 101 among those who attempted the initially assigned level.
Looking at where most students started in the ESL sequence, 88% of the full sample, 85% of the Generation 1.5/2.0 sample, and 77% of the international sample placed in ESL Level 3 and below. The general trend across all three samples is that high percentage of students attempted their placed course and high percentage of students completed the course if they attempted it. Another trend across samples is students who placed six levels below college-level English attempted and completed English 101 at a much lower rate than students who placed one level below college-level English. For example, 11% of students who placed six levels below English 101 attempted English 101 and 8% completed the course, but 78% of students who placed one level below English 101 attempted the course and 68% completed the course.
Despite these similarities, there are apparent differences by subsamples. Interestingly, the ESL course attempted and completed rates are lower among Generation 1.5/2.0 students than international students. Across all credit ESL levels, Generation 1.5/2.0 students (84%-90%) attempted their initially assigned ESL course at a lower rate than international students (92%-97%). Furthermore, fewer Generation 1.5/2.0 students (77%-86%) completed their initially assigned ESL course with at least a D upon attempting the course, whereas more international students (86%-95%) completed their initially assigned ESL course.
Surprisingly, Generation 1.5/2.0 students attempted and completed English 101 at a much lower rate than international students irrespective of the ESL level. For example, 50% of Generation 1.5/2.0 students who attempted one level below English 101 completed English 101, whereas 85% of international students who attempted one level below English 101 completed English 101. The big gap in who completes English 101 narrows at lower ESL levels. Specifically, 8% of Generation 1.5/2.0 students and 11% of international students who placed six levels below transfer completed English 101. In all three samples, students who began the credit ESL sequence three or more levels below English 101 were much less likely to attempt and complete English 101. One potential explanation to this last trend is that the prospect of reaching English 101 is much farther away if placed in ESL three levels or below compared with one level or two levels below college-level English.
Next, I estimate a semiparametric Cox proportional hazards model with time to completing English 101 as the dependent variable. In the time-to-event analysis, the first time of entry is spring of 2005 and the last quarter observed in the data is fall 2014. Looking at the sample as a whole, 25% (n = 1,134) of all students placed in ESL have completed English 101. A simple calculation of students who completed English masks the fact that some students may have entered the sequence six levels below English 101, whereas others have entered one level below college-level English, or that some students may have a higher likelihood of reaching English 101 depending on one’s background characteristics. The median time students take in experiencing the event is 1.6 years. The final exit time of this survival data set is approximately 9.5 years, which means that some students have taken credit ESL courses through the duration of the study’s time frame (2005-2014).
Tables 4 and 5 show the hazard estimates for each sample separated by male and female using the Cox proportional hazards model. Model 1 includes only the covariates, Model 2 includes cohort fixed effects, Model 3 includes a dummy for whether students placed in intermediate algebra and above (i.e., transfer intent), and, the preferred specification, Model 4 controls for all of the above plus the placement level. The baseline hazard for the full sample can be interpreted as students who (a) are neither Asian nor Hispanic and speak a language other than English, Spanish, Vietnamese, or Chinese; (b) hold a citizenship from the United States; and (c) have earned at least a high school diploma prior to attending community college.
Exponentiated Coefficients and Statistical Significance of the Cox Proportional Hazards Model for the Full Sample.
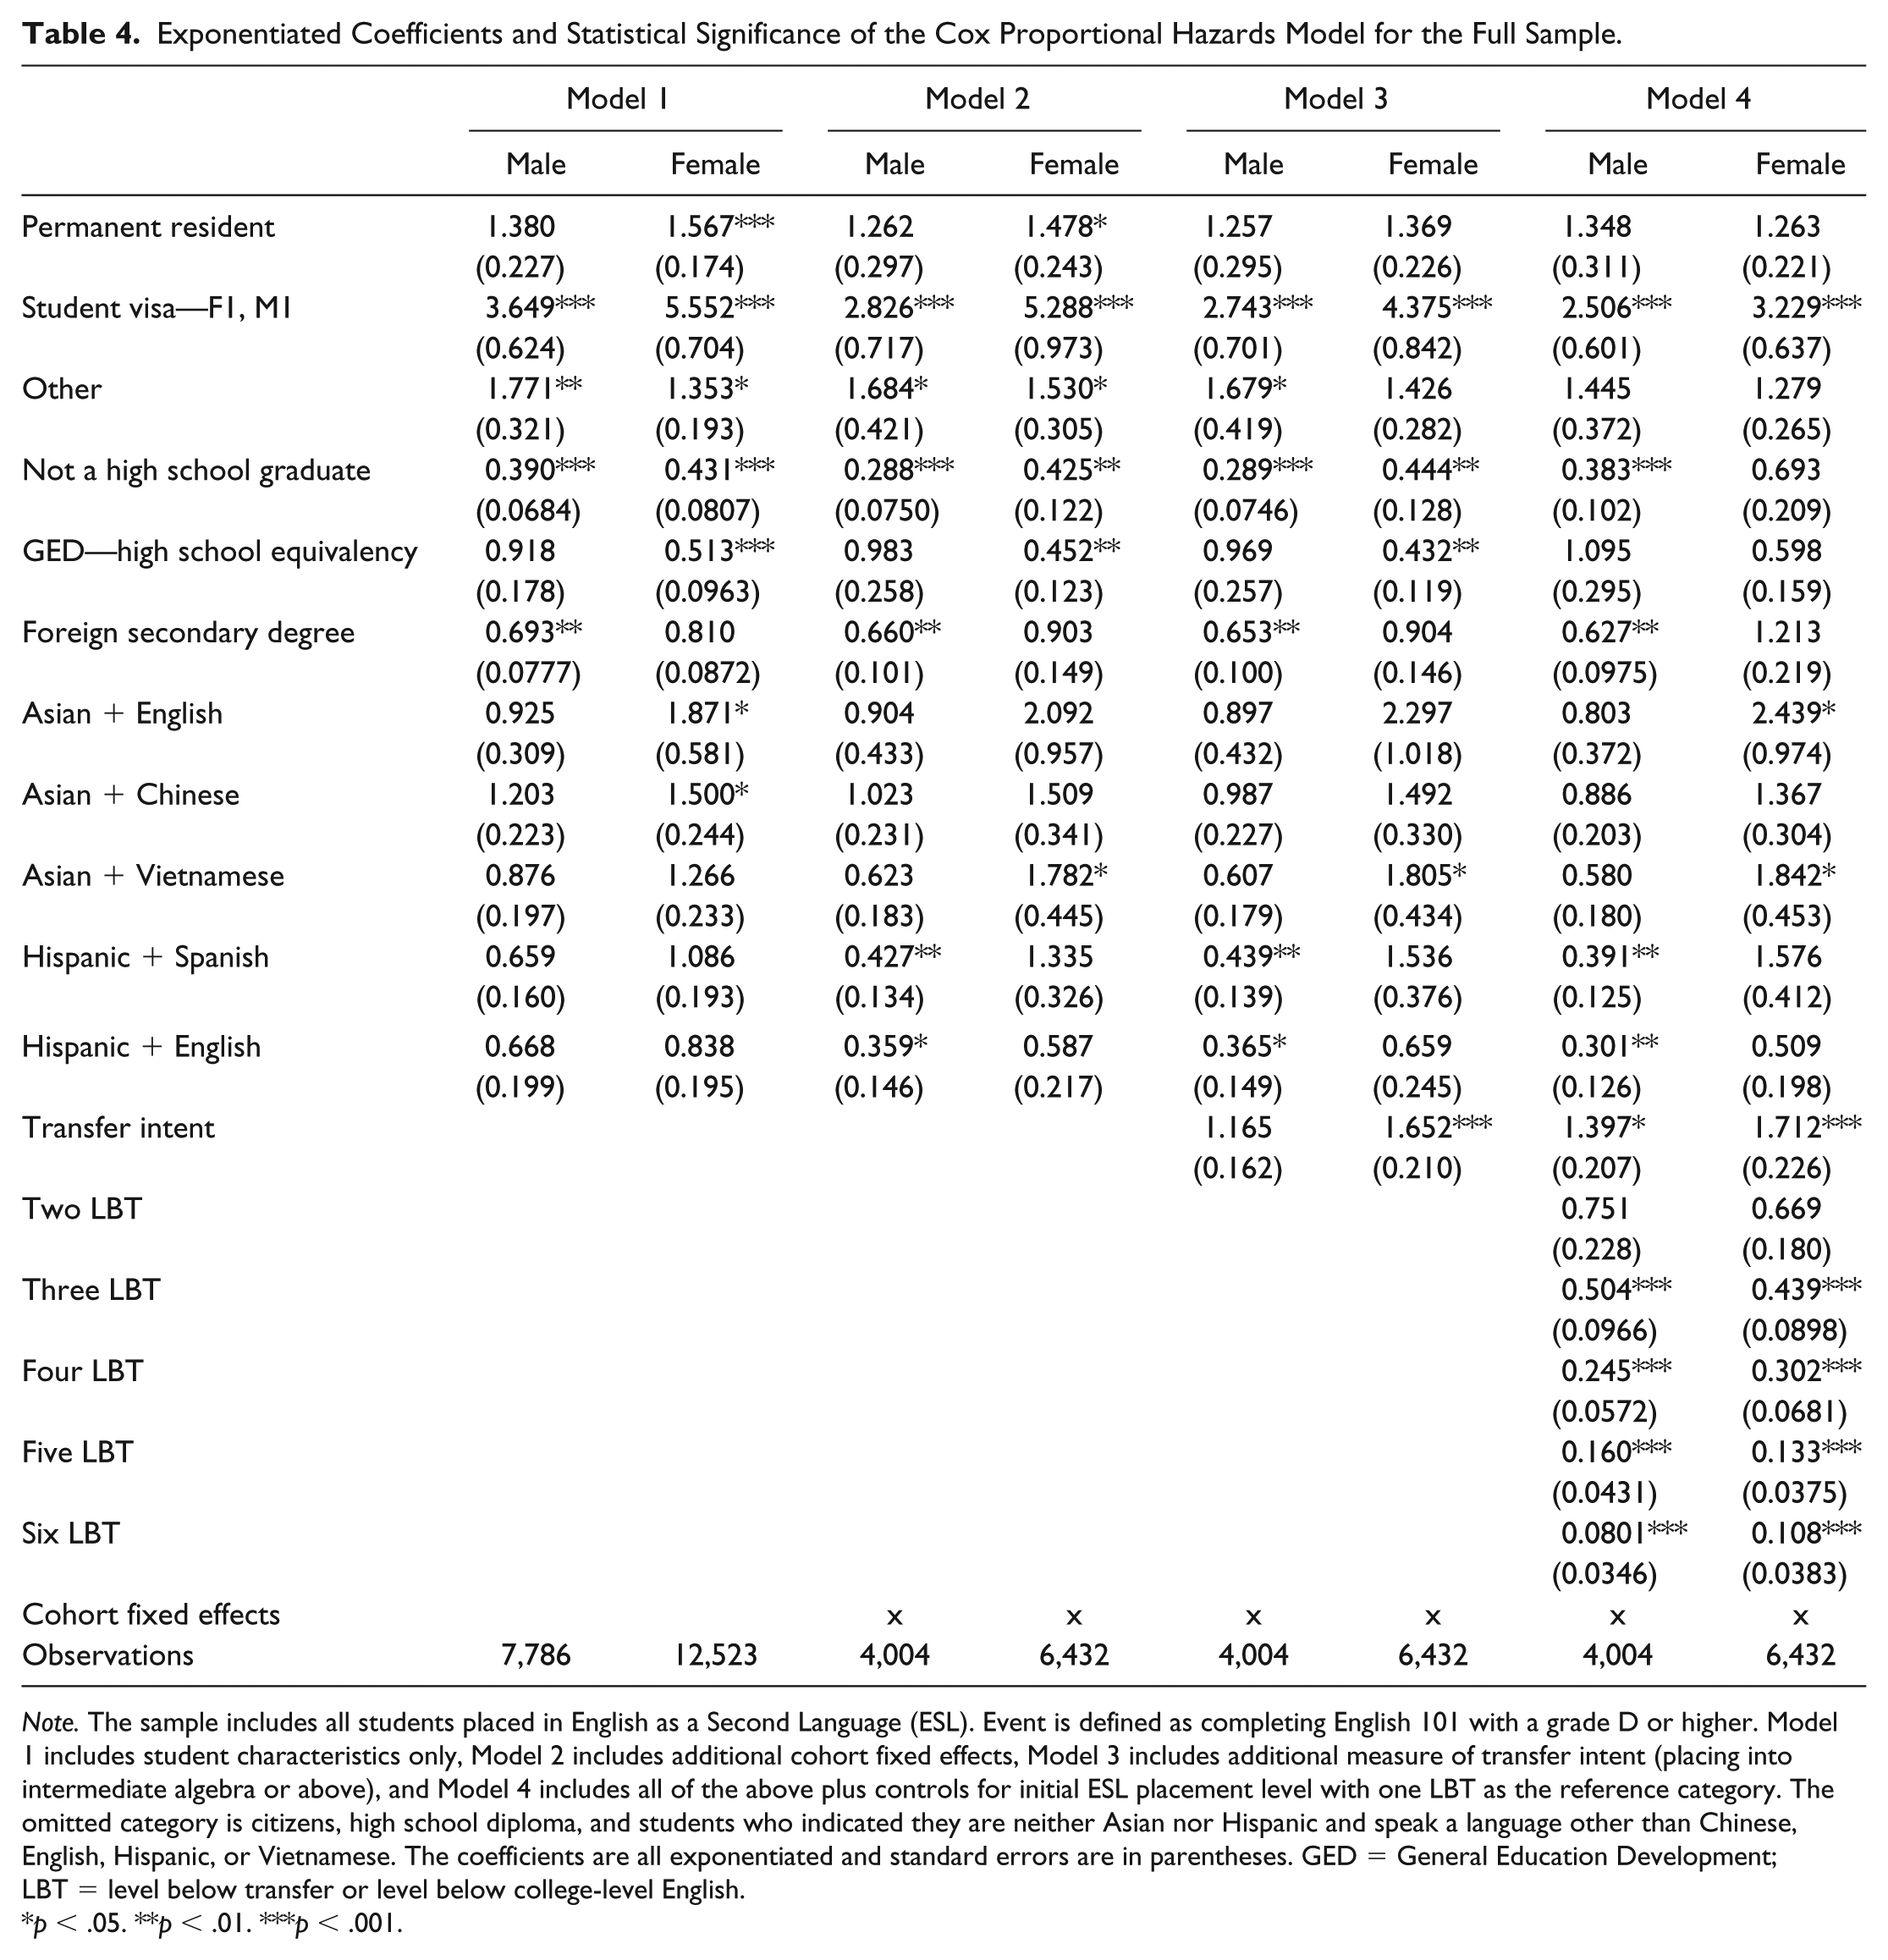
Note. The sample includes all students placed in English as a Second Language (ESL). Event is defined as completing English 101 with a grade D or higher. Model 1 includes student characteristics only, Model 2 includes additional cohort fixed effects, Model 3 includes additional measure of transfer intent (placing into intermediate algebra or above), and Model 4 includes all of the above plus controls for initial ESL placement level with one LBT as the reference category. The omitted category is citizens, high school diploma, and students who indicated they are neither Asian nor Hispanic and speak a language other than Chinese, English, Hispanic, or Vietnamese. The coefficients are all exponentiated and standard errors are in parentheses. GED = General Education Development; LBT = level below transfer or level below college-level English.
p < .05. **p < .01. ***p < .001.
Exponentiated Coefficients and Statistical Significance of the Cox Proportional Hazards Model for Generation 1.5/2.0 Immigrants.
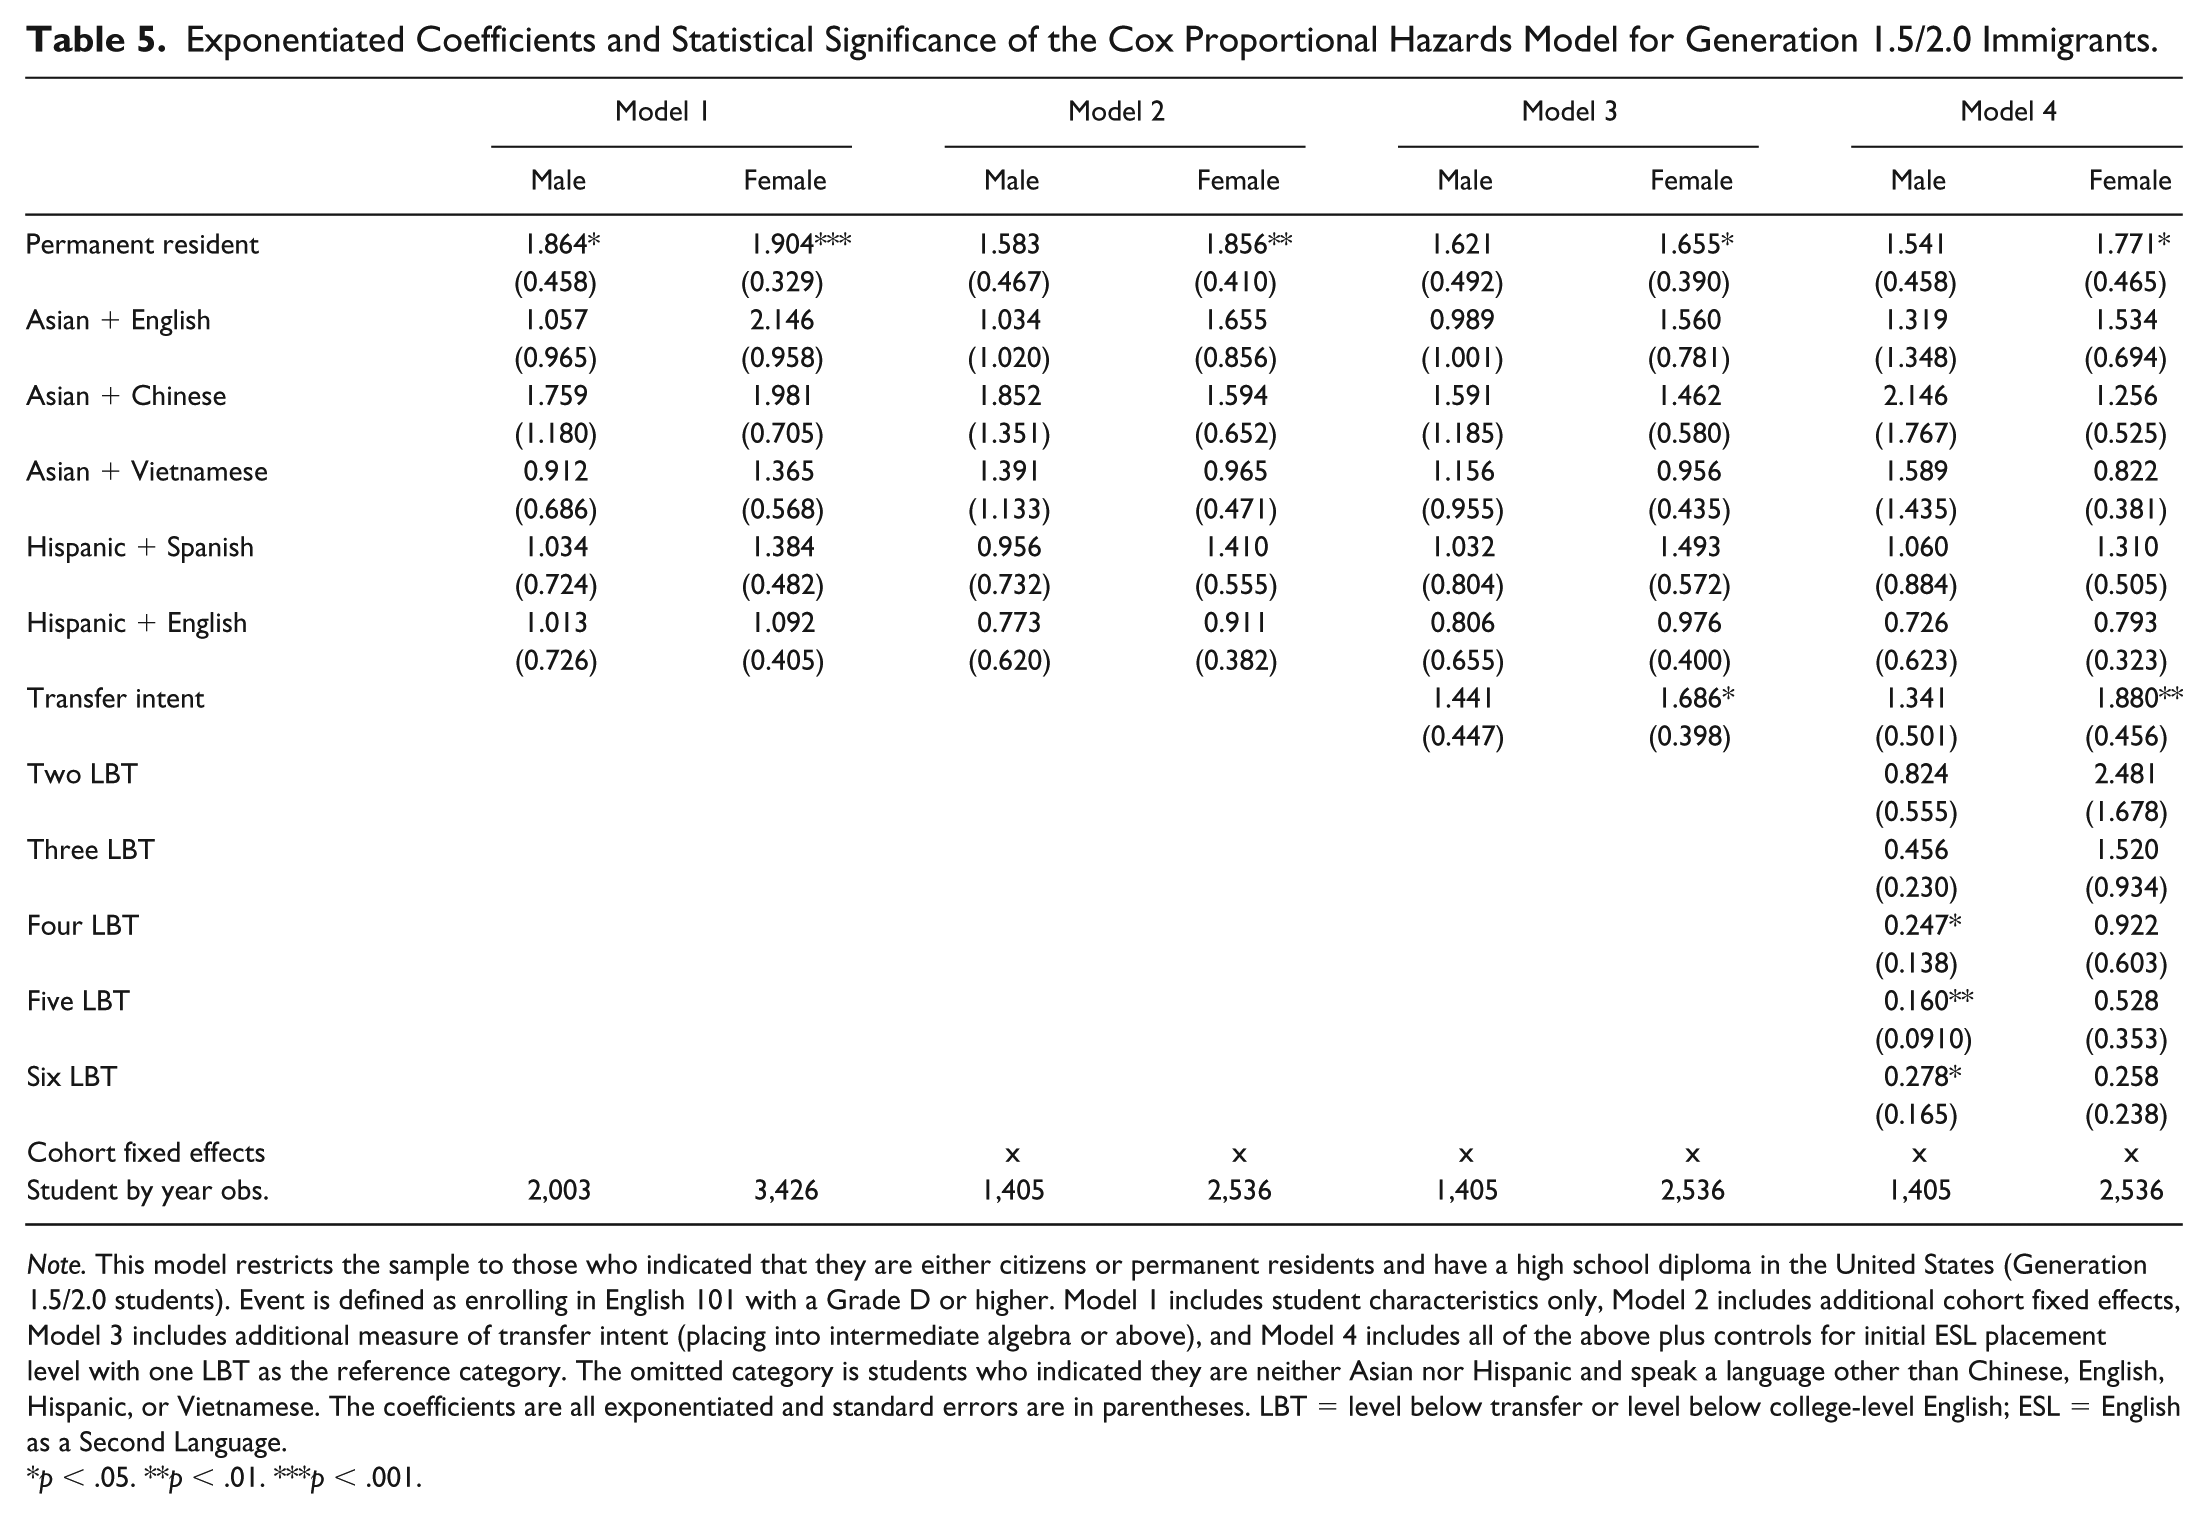
Note. This model restricts the sample to those who indicated that they are either citizens or permanent residents and have a high school diploma in the United States (Generation 1.5/2.0 students). Event is defined as enrolling in English 101 with a Grade D or higher. Model 1 includes student characteristics only, Model 2 includes additional cohort fixed effects, Model 3 includes additional measure of transfer intent (placing into intermediate algebra or above), and Model 4 includes all of the above plus controls for initial ESL placement level with one LBT as the reference category. The omitted category is students who indicated they are neither Asian nor Hispanic and speak a language other than Chinese, English, Hispanic, or Vietnamese. The coefficients are all exponentiated and standard errors are in parentheses. LBT = level below transfer or level below college-level English; ESL = English as a Second Language.
p < .05. **p < .01. ***p < .001.
In Table 4, one of the strongest predictors of reaching and completing English 101 is students’ placement level—students who placed three levels below transfer are significantly less likely to complete English 101 at any given point in time. Also, in Table 4, students with a student visa (i.e., international students) have a higher incident rate, or likelihood of completing English 101, compared with citizens and this relationship is significant at the 0.1% significance level across all model specifications. Male students who are not high school graduates or have a foreign secondary diploma have a lower incident rate than students with a high school diploma (p < .001). Although controlling for placement level increases the standard error and eliminates statistical significance, it is noteworthy that female students also have a lower likelihood of completing English 101 if they do not have a high school diploma compared with those who do, indicating the importance of obtaining a high school diploma in completing English 101. Finally, in Model 4, female Asian students who primarily speak English or Vietnamese have a higher rate of completing English 101 at any given point in time than non-Hispanic, non-Asian female students (p < .05). In brief, in the full sample, those with a student visa, a high school diploma, or who identify as female are more likely to complete English 101 at any given point in time.
In Table 5, I restrict the sample to Generation 1.5/2.0 students and use the same model specification as the full sample and present the results separately by gender. In Table 5, column 1, both male and female students with permanent residency are almost twice as more likely than citizens to complete English 101 at any given point in time and these relationships are significant at the 5% and 0.1% significance levels, respectively. Among male Generation 1.5/2.0 students, including cohort fixed effects eliminates the statistical significance of this relationship but the coefficient still remains positive (see Model 2). Among female Generation 1.5/2.0 students, those who are permanent residents are statistically significantly associated with higher incident rate compared with citizens despite holding constant a set of relevant covariates (
In sum, the hazard rates show suggestive evidence that prior education and citizenship status are associated with the hazard or likelihood of completing English 101. Female Generation 1.5/2.0 permanent residents are more likely to complete English 101 than female Generation 1.5/2.0 citizens at any given point in time at this college. This relationship supports the argument that immigrant students tend have higher aspirations and the desire to succeed in the educational system compared with their native-born counterparts (Kao & Tienda, 1995). Furthermore, Hispanic males who do not have a high school diploma or have a foreign secondary diploma have lower incident rates than students with a high school diploma underscoring the value of a strong secondary education in preparing Hispanic male students for postsecondary education. Among Generation 1.5/2.0 student sample, none of the students’ race and language characteristics are significantly associated with the outcome. In other words, language and racial background are not predictive of completing English 101 at any given point in time within the Generation 1.5/2.0 sample. This finding does not mean that all students have equal hazard rates of completing English 101. As indicated in Table 3, Generation 1.5/2.0 students populated all ESL levels and attempted and completed English 101 at a lower rate than international students at this college. The results from the Cox model combined with the progression rate highlight the need to unpack why Generation 1.5/2.0 students are completing English 101 at a lower rate.
Discussion
Providing educational opportunities for racially and linguistically diverse students have important benefits not only for the student but also for the society. Higher education is correlated with higher income and occupational advancement as well as increased community and civic engagement (Erisman & Looney, 2007). Although longer residing immigrant populations tend to exhibit lower poverty rates and relatively higher rates of naturalization, English proficiency remains low (Singer, 2004). As institutions committed to providing education access to its community members, community colleges are poised to play a particularly important role in providing educational access to diverse, immigrant populations.
The goal of this article is to provide a descriptive overview of the ESL sequence progression rate with a focus on Generation 1.5/2.0 students. A small but emerging body of literature on this student population highlights the heterogeneity within the term ESL learners (Bers, 1994; Hodara, 2015; Núñez et al., 2016). As Teranishi, Suárez-Orozco, and Suárez-Orozco (2011) noted, data on community college second language learners are sparse and what data there are confound international students, those with a student visa who most likely will return to their country, with immigrant students, and those who intend to stay in the United States. The present study intentionally accounts for this distinction by capitalizing on citizenship and prior education information and disaggregating results by students who intend to remain in the United States and contribute to various economic and societal functions.
Similar to previous studies, I found that students who started at lower levels attempted and completed each level of the course at lower rates than students who started one level above (see, for example, Bailey et al., 2010; Patthey-Chavez, Dillon, & Thomas-Speigel, 2005). Similar to Patthey-Chavez et al.’s (2005) findings, the present study also found, of those who placed in the lowest ESL level, 8% of the full ESL sample passed English 101 and 8% of the Generation 1.5/2.0 sample passed English 101. This suggests that students placed in the lowest level of the ESL sequence need much more support to successfully progress toward English 101.
Furthermore, when comparing the progression percentages between Generation 1.5/2.0 and international students, Generation 1.5/2.0 students completed English 101 at a lower rate than international students. The low percentage of students completing English 101 may be indicative of lack of finances or full-time employment and family obligations (Almon, 2015) and may also point to the differences in educational goals and intentions for taking these courses (Bahr, 2014; Bers, 1994; Bunch et al., 2011; Center for Student Success, 2007; Dadgar & Trimble, 2015). The lower success rate than international students may also be due to incorrect placement or ineffective pedagogical practices for this population.
In addition to looking at the progression rate, a second and related goal of this article is to examine progression patterns with an emphasis on the time students take toward reaching a milestone in language proficiency, college-level English. When exploring the relationship between student characteristics and progression, the two strongest correlates in the full ESL sample is that those with student visas and those placed in higher levels are more likely to reach and complete English 101. This supports the progression findings on low attempt and completion rate among Generation 1.5/2.0 students compared with international students and puts into question why this may be the case. When limiting the sample to only Generation 1.5/2.0 students, I find that female Generation 1.5/2.0 students with permanent residency are almost twice as more likely to reach English 101 than female Generation 1.5/2.0 citizens, lending credence to the immigrant optimism effect (Callahan & Humphries, 2016; Kao & Tienda, 1995).
Finally, the results from the Cox model support the notion that females progress further in the ESL sequence compared with males. For instance, male students placed in ESL without a high school diploma are less likely to reach English 101 at any given point in time than students with a high school diploma, but this association is not present among female students placed in ESL. Furthermore, female Generation 1.5/2.0 students placed in lower levels persist at similar rates as those placed in higher levels. This finding suggests the need to support and encourage males through their high school and postsecondary transition.
Implications for Policy and Practice
A rather high percentage of Generation 1.5/2.0 immigrants in the ESL sequence can mean that students are not completely aware of the difference between ESL and developmental English. Several qualitative studies have shown that community college students take the placement test without knowing the full implications of the test (Bunch & Panayotova, 2008; Malagon, Alonso, Johnson-Ahorlu, & Shek, 2013) and, in some cases, are steered to take the ESL test (Bunch & Endris, 2012). If the course level is appropriate for the student, all is well; however, if the student is inappropriately placed into lower levels of the ESL sequence, the student faces barriers to reaching college-level English. Some of the barriers might be persisting through a longer educational sequence (Hodara, 2015) and feeling demoralized due to being placed in an ESL course (Bunch & Panayotova, 2008; Callahan, Wilkinson, & Muller, 2010). Therefore, students’ decisions at the beginning of their college career have huge implications on students’ confidence, motivation, persistence, and success. Hypothetically, if a student who has gone through high school in the United States is placed in ESL, but perceives that ESL is only for immigrants with limited English proficiency, the student may disengage with the course. In contrast, if an immigrant student with high English-speaking abilities perceives that ESL is designed to help all immigrants, it is likely that the student will understand it as a necessary step to other courses and will remain engaged in an easier language course. Institutional leaders, counselors, and faculty will benefit from better understanding how students select between the two types of placement tests and how students understand and distinguish between the two English language sequences. The findings of this study also suggest a need to better align placement results with creating an instructional environment appropriate for Generation 1.5/2.0 students. Furthermore, intentional outreach by high schools or colleges to increase awareness of the types of language courses offered and the different routes possible may be a step towards improving placement, progression, and completion.
Implications for Future Research
This study sheds light on several areas for future research. One area of inquiry that merits continued attention is defining Generation 1.5/2.0 students. Although students in K-12 are assigned to take an English language proficiency test based on responses to the Home Language Survey, students have more flexibility in higher education as they choose to take the ESL placement test. This study singles out the rather large percentage of students who indicated that they are either permanent residents or citizens and have obtained their high school diploma in the United States and defines this group as Generation 1.5/2.0 students. It is impossible with the current data to identify how long these students have attended high schools in the United States and whether they have been identified as an English Language Learner at any point in their K-12 schooling. Future studies should unpack the decision-making process among Generation 1.5/2.0 students along several crucial points in students’ educational careers—from placement decisions to persisting through various ESL courses is an area for future research.
Next, future studies should examine whether the pedagogical approaches to language instruction differs in any substantive way between ESL and developmental English courses. Cox (2015) noted that the most common pedagogical approach employed by developmental math faculty at two community colleges was the traditional skill and drill approach. It is unclear how students are taught in ESL classrooms and how the experiences of the students in classrooms play a role in their likelihood of reaching English 101. The lack of clarity on the language instructional practices underscores the need for future research focused on this area.
Conclusion
This study found that most students start three levels or below college-level English (English 101) even when limiting the sample to Generation 1.5/2.0 students. Results from the Cox proportional hazards model show that students with a student visa (i.e., international students) have higher hazards of reaching English 101 than citizens. This study provides suggestive evidence that Generation 1.5/2.0 students are not reaching English 101 at rates akin to international students despite having more familiarity with the U.S. educational system. Citizens most likely have attended primary or secondary schools in the United States. Still, a considerable number of students in this sample do not complete English 101. For Generation 1.5/2.0 students who placed at three to six levels below college-level English, it may be that lower placement coupled with the lengthy ESL sequence served as a demoralizing experience. Indeed, Bunch and Panayotova (2008) suggested that the low placement may, in effect, serve as a self-fulfilling prophecy: Students feel stigmatized at their low placement and achieve at lower rates than what they can potentially achieve.
This study provides some of the first empirical evidence on the time students take toward reaching a key milestone in the ESL sequence, completing college-level English. A better sense of who is placing where and how long it takes students to progress through the ESL sequence will be beneficial for institutional leaders, policymakers, and researchers who seek to improve educational attainment and workforce success of these students.
Footnotes
Appendix
All First-Time Enrollees of Community Colleges in California During 2012 to 2013.
| California community college total | ||
|---|---|---|
| N | % | |
| Race | ||
| African American | 266,718 | 7 |
| Asian | 593,661 | 15 |
| Hispanic | 1,448,198 | 38 |
| Unknown | 245,187 | 6 |
| White non-Hispanic | 1,171,622 | 30 |
| Other a | 134,557 | 3 |
| Citizenship status | ||
| U.S. citizen | 3,213,999 | 83 |
| Permanent resident | 305,692 | 8 |
| Student visa (F1 or M1 visa) | 66,398 | 2 |
| Other b | 273,854 | 7 |
| Education level | ||
| High school diploma or equivalent | 2,421,512 | 63 |
| Not a high school graduate | 157,052 | 4 |
| GED—high school equivalency | 178,622 | 5 |
| Foreign secondary degree | 173,634 | 4 |
| Other c | 283,179 | 24 |
| Gender | ||
| Female | 2,066,551 | 54 |
| Male | 1,750,161 | 45 |
| Unknown | 43,231 | 1 |
| Total | 3,859,943 d | 100 |
Note. Author’s calculation using publicly available data from the California Community College Chancellor’s Office DataMart. The following terms are included: winter 2012, spring 2012, summer 2012, and fall 2012. GED = General Education Development.
This categorization includes Alaskan Natives, American Indians, and multiracial students.
This categorization includes refugees, students whose status is unknown or uncollected, and temporary residents including those with work visas.
This categorization includes those who are currently enrolled in adult school or whose education level is known.
This number counts the total number of students enrolled during winter 2012 through fall 2012.
Acknowledgements
The author would like to acknowledge Tatiana Melguizo, Federick Ngo, Morgan Polikoff, Olga Rodriguez, W. Edward Chi, and the anonymous reviewers and editors for their thoughtful input throughout this study.
Declaration of Conflicting Interests
The author declared no potential conflicts of interest with respect to the research, authorship, and/or publication of this article.
Funding
The author received no financial support for the research, authorship, and/or publication of this article.