
Abstract
Keywords
Much American college aid operates through a logic of merit. Institutional and private grants, which are disbursed mostly according to merit criteria, collectively overwhelm federal need-based aid ($83 billion vs. $41 billion in 2018–2019) (College Board, 2020). Over the 1990s and 2000s, a wave of programs, starting with Georgia’s HOPE scholarship, shifted state higher education spending towards merit-based aid (Dynarski, 2004). Today, 25% of state financial aid is awarded on merit basis (College Board, 2020)
Merit scholarships are often presented as encouraging and rewarding academic effort (Heller, 2002). But most “merit aid”—private and institutional scholarships—is too individualized and idiosyncratic to alter behavior. It also is mostly allotted to high-scoring students, whose academic performance and likelihood of attending college are likely not motivated by the expectation of this reward (Doyle, 2010; Dynarski 2004). Mass-based merit scholarships, like Georgia’s HOPE scholarship, set eligibility requirements beyond the reach of the most disadvantaged and are disproportionately captured by those who easily qualify (Rubenstein & Scafidi, 2002).
Recent years have witnessed the proliferation of “free community college” initiatives often called “Promise programs” (Perna & Leigh, 2018). Many such programs make eligibility contingent on high school performance but set thresholds at modest levels of attainment. The Detroit College Promise, for instance, requires a high school grade point average (GPA) of 2.5 (Miller-Adams et al., 2017). While such programs might conceivably incentivize improved performance among struggling students, research has not yet determined if this is so.
We examine the impacts of the Milwaukee Area Technical College Promise (MATC Promise) 1 which, in its first 2 years, made eligibility contingent on modest high school attendance and performance—a 2.0 GPA and 90% attendance during 12th grade. 2 But MATC draws principally from a high-poverty school district with many academically struggling students. We leverage the program’s eligibility rules to identify its effects on high school students’ attendance and academic performance using a differences-in-differences design. Specifically, we investigate the following:
1) Did the MATC Promise improve 12th grade performance and attendance?
2) Were improvements sufficient to make more students eligible for the Promise program?
3) Did effects differ across subgroups of students (e.g., by gender, race/ethnicity, free lunch status, special education status, ELL status, and high school type)?
Our results can inform policymakers considering low-bar merit scholarships to boost academic performance among low-income youth.
Conceptual Framework and Prior Research
Promise programs
The earliest modern “Promise” program was launched in Kalamazoo in 2005. The Kalamazoo Promise (KP) fully covers tuition and fees at any in-state 2- or 4-year public college. Because KP is “first-dollar,” students may apply other grants and scholarships to housing and other expenses. Eligibility is restricted only by residency—one must live in Kalamazoo and attend its schools for at least 4 years—and not by need or academic performance 3 (Miller-Adams, 2009, 2015).
KP has been very well-studied and its results are impressive. It reversed enrollment decline in Kalamazoo Public schools, boosted population and housing prices in some parts of the city (Bartik et al., 2010; LeGower & Walsh, 2017), raised students’ aspirations, and improved their perceptions of school climate (Miron et al., 2012). Researchers estimate that it increased college enrollment by 7 percentage points, degree completion by 12 percentage points and bachelor’s completion by 8 percentage points (Bartik et al., 2021).
KP inspired other locally-based entities, including corporations, municipalities, foundations, and community colleges, to launch new scholarships (Miller-Adams, 2015). By 2010, 38 such programs were operating, 27 of whose titles contained the word “Promise” (Miller-Adams et al., 2017). However, departure from rather than strict fidelity to KP’s model has been the rule. Except for the El Dorado Promise, 4 subsequent programs were much less generous, and most compromised universality with need and/or merit criteria (Billings, 2018). Most were “last-dollar” scholarships, covering tuition remaining after the application of other grants, and many restricted applicability to community colleges and often to a single college.
The results of KP’s early imitators are mixed. The El Dorado Promise increased postsecondary enrollment by 14 percentage points and degree completion by 8 percentage points (Swanson & Ritter, 2020). Say Yes to Education, a last-dollar scholarship contingent only on longer-term residency and applicable at 4-year colleges, improved enrollment in Syracuse and Buffalo schools, and increased college matriculation by 8 to 10 percentage points (Bifulco et al., 2019). But merit-based programs in New Haven, Milwaukee, and Pittsburgh had mostly null effects on both college enrollment and completion (Bozick et al., 2015; Daugherty & Gonzalez, 2016; Gonzalez et al. 2011, 2014; Harris et al., 2020; but see Page et al., 2019).
In 2014, the Tennessee Promise effectively redefined “Promise” programs as last-dollar “free community college” programs. Of the nine states that launched Promise-type programs since 2014, only one (New York’s Excelsior Scholarship) can be used at 4-year colleges and all but one (the Oregon Promise) is last-dollar (Davidson et al., 2018). Among local programs, 103 out of the 119 programs launched since 2014 (87%) are restricted to community colleges, 114 (96%) are last-dollar programs, and 101 (85%) are last-dollar community college programs (Miller-Adams et al., 2017); 89 programs (75%) are usable at single community colleges.
Promise programs became “community college” programs for three reasons. First, since community college tuition is often, for low-income students, fully covered by federal grants, a last-dollar scholarship can be implemented at low cost. Second, Promise programs could reverse the steep enrollment decline community colleges have suffered since 2010 (Schmidt, 2018). Third, Promise programs are an opportunity for community colleges to promote themselves as solutions to the crisis of college affordability. The “community college-ization” of Promise programs effects their design. Since it is not the interest of community colleges to limit eligibility by long-term residency, this feature has vanished from newer programs.
Given its focus on early and uncharacteristically generous programs, findings from extant Promise research may not generalize to newer programs. Studies of last-dollar community college programs suggest that those which are more universal have stronger positive impacts (Billings et al., 2021). Knox Achieves boosted college enrollment by 2 to 4 percentage points (differences-in-differences estimate) or 24 percentage points (matching estimate) (Carruthers & Fox, 2016). In its second year, the Oregon Promise increased postsecondary enrollment by 5 percentage points (Gurantz, 2020). Scholars have also found that Promise programs increase enrollments at eligible institutions (Li & Gándara, 2020; but see Nguyen, 2019), though some enrollment gain may result from diverting students from 4-year institutions (Carruthers & Fox, 2016; Gurantz, 2020).
Policy justification for merit-based grants
Policymakers have various reasons for including merit criteria in college aid programs. These reasons include controlling costs and increasing a proposed program’s political viability. A swathe of the public looks askance on non-merit restricted scholarships as funding the “undeserving” (Bell, 2020); such rationales were explicitly invoked in the creation of state merit programs (Cornwell et al., 2005). Merit-based scholarships may be a means of providing middle-class constituencies with tuition relief (Dynarski, 2004). Additionally, state merit scholarships are promoted as a means of stemming brain drain (Zhang & Ness, 2010).
The most common argument is that merit scholarships encourage and reward academic performance. This claim is rooted in rational-actor, human capital models of human behavior (Catsiapis, 1987; Manski, 1993). From this perspective, “students make choices between leisure and schoolwork in a fashion parallel to the choices made by workers” (Henry & Rubenstein, 2002, p. 96). Merit scholarships are thus incentives for students to increase effort on schoolwork (Hernández-Julián, 2010). Scholarships should mostly boost effort among students who believe they could not otherwise afford to attend college.
This logic is evident in “theories of change” for performance-based scholarships, close cousins of merit scholarships. Performance-based scholarships “provide incentives for academic progress and motivate students. In order to meet the scholarship benchmark, students might study more (or better)” (Mayer et al., 2015, p. 5). Monetary incentives are “an inducement to adopt new behaviors” such as seeking tutoring, or they “encourage students to continue efforts they already make, such as completing assignments daily, (or) attending class regularly” (Cha & Patel, 2010, p. 5).
Such claims are rooted in culturally institutionalized understandings of motivation, behavior, and performance. In this understanding, grades result primarily from effort. Effort is moralized as resulting from and indicating “character.” Low-performing students are those who failed to work hard enough and therefore, have questionable character. Justifications for merit scholarships easily slide into deficit thinking (Valencia, 1997). Deficit thinking holds that academic failure among disempowered populations results from cognitive, motivational, or moral deficiencies of students, families, or communities. Merit scholarship justifications hold that only those who work hard to succeed are deserving of consideration or assistance.
By reducing academic success to incentives, motivation, and decisions, the rational-actor, human capital framework reinforces an individualistic, moralized model of academic performance and ignores the influence of structural factors (Tan, 2014). First, it assumes that students have reserves of time and/or energy available to be tapped. But if students are hampered by external factors such as extensive family responsibilities or disruptions in housing, such reserves may be negligible (Sanchez et al., 2010). Second, it assumes that once a program is created, students most in need will know of it and know they are eligible. The success of a scholarship is thus crucially dependent on systems of information distribution (Tierney & Venegas, 2009). Third, the model assumes the effectiveness (or irrelevance) of academic supports for historically marginalized students (Roderick et al., 2011). Finally, it ignores the persistent influence of past experiences on academic capacities and orientations. Cumulative experiences of discrimination, deprivation, and disempowerment can be durably inscribed in one’s perceptions of capacities and possibilities, forming the baseline of “rational” decision-making (Bourdieu, 2000).
Rational-actor and moral worth conceptions are unquestionably influential in educational policy. One of rational-actor theory’s strengths is its easy convertibility into empirically testable hypotheses. In this case, rational-actor models predict that monetary incentives for college-going linked to meeting performance baselines will boost effort and resultant performance among eligible youth, and particularly among lower-income youth with modest academic performance histories.
Prior research on merit scholarships
The balance of evidence suggests that state merit scholarships modestly improve high school performance. Henry and Rubenstein (2002) found a disproportionate increase in the percentage of Georgia high school graduates meeting a 3.0 GPA threshold after the HOPE scholarship’s launch. Domina (2007), using fixed-effects model, found that Texas’s “top 10% law” increased school attendance and the share of students taking advanced courses. Pallais (2009), using a differences-in-differences design, found that Tennessee’s lottery scholarship led to increases in the number of students scoring at or above that scholarship’s ACT threshold. In his study of 21 state merit aid programs, Domina (2014) found that the percentage of students taking higher level mathematics courses grew more rapidly in states with than in those without merit scholarships, with stronger effects in states with more generous scholarships. Increases in rigorous course taking also resulted from Florida’s Bright Futures Scholarship (Harkreader et al., 2008). Using a Heckman selection model, Klein and Perry-Sizemore (2017) found that state merit scholarships considerably increased overall high school graduation rates as well as those for Black and Latinx students.
In contrast, Promise programs with merit criteria have not been shown to boost high school performance. Gonzalez et al. (2011) found no evidence that the Pittsburgh Promise increased student persistence in high school, nor the likelihood of meeting GPA or attendance requirements. Likewise, Gonzalez et al. (2014) found that the New Haven Promise did not impact achievement exam scores or high school completion.
Promise programs without merit criteria have been found to impact high school performance. Carruthers and Fox (2016) found higher rates of on-time graduation for low achieving participants of the Knox Achieves program in comparison to similar students in Tennessee. In a study of KP, Bartik and Lachowska (2014) found overall positive effects on credits earned as well as a positive effect on GPA for Black students. Ash (2015) found that the El Dorado Promise led to higher scores on state achievement exams for students in El Dorado in comparison to a synthetic control group. However, Bifulco et al. (2019) found mostly null impacts on graduation rates from Syracuse’s “Say Yes to Education” program. Overall, research suggests that more universal and generous Promise scholarships can sometimes incentivize improved student outcomes in high school without using merit criteria.
The Present Study
Milwaukee Area Technical College (MATC) is the largest of the fifteen colleges in the Wisconsin Technical College System (WTCS). 5 Its main campus is in downtown Milwaukee, and it has three smaller suburban satellite campuses. More than two-thirds of MATC’s 14,000 students attend part-time. Its student body is split evenly between those older and younger than age 25. It is a majority-minoritized institution (38% White; 62% non-White) where 59% of students are Pell recipients. Yearly in-state tuition and fees in 2017 to 2018 were $4,491 (National Center for Education Statistics n.d.).
Milwaukee is a city of more than 600,000, and like many others in the Midwest, it has suffered significant disinvestment and population decline since the mid-20th century. Today, Milwaukee is a highly segregated city with a child poverty rate of over 40% (Malina, 2017). Milwaukee Public Schools (MPS) enrolls roughly 75,000 students, 82 and 88% of whom are classed by Wisconsin’s Department of Public Instruction as economically disadvantaged and as “underserved minorities,, respectively. In 2016, 19 and 11% of MPS high schoolers met state proficiency in English and Math respectively, compared with 61 and 39% for the state. In the same year, 60% of MPS high schoolers graduated in 4 years and 41% of graduates enrolled immediately in postsecondary education (compared with 92 and 56% for the state). Thus, the rate of on-time postsecondary enrollment is only 25% (49% for Wisconsin). 6
Like many community colleges, MATC faces significant challenges. Its enrollment in 2016 was 30% below its 2009 peak and 17% below pre-recessionary level (National Center for Education Statistics, n.d.). Its 3-year graduation rate of 12% is the lowest of all WTCS colleges, making it the target of scrutiny and state intervention (Stein, 2012). Its reputational struggles are intertwined with the broader struggles of Milwaukee’s high-poverty, largely Black and Latinx population.
Partly in response to these challenges, MATC announced in the fall of 2015 the launch of its own “free-college” program: “The MATC Promise.” The MATC Promise is a privately funded, last-dollar, tuition-only scholarship available first to the entering class of Fall 2016. Eligibility is restricted to direct high school enrollees who reside or graduate from a high school within MATC’s catchment district (Figure 1). Students must meet filing deadlines for both the program and FAFSA. Eligibility is restricted by need; in 2016 to 2017 the threshold was an expected family contribution (EFC) equal to or lower than $3,000 (this was raised the next year to $4,500). Eligibility is also restricted by merit: students must graduate on time and satisfy at least a 16 on the ACT. And crucially for this study, the program required at least 90% attendance and a 2.0 GPA in a student’s senior year of high school. 7
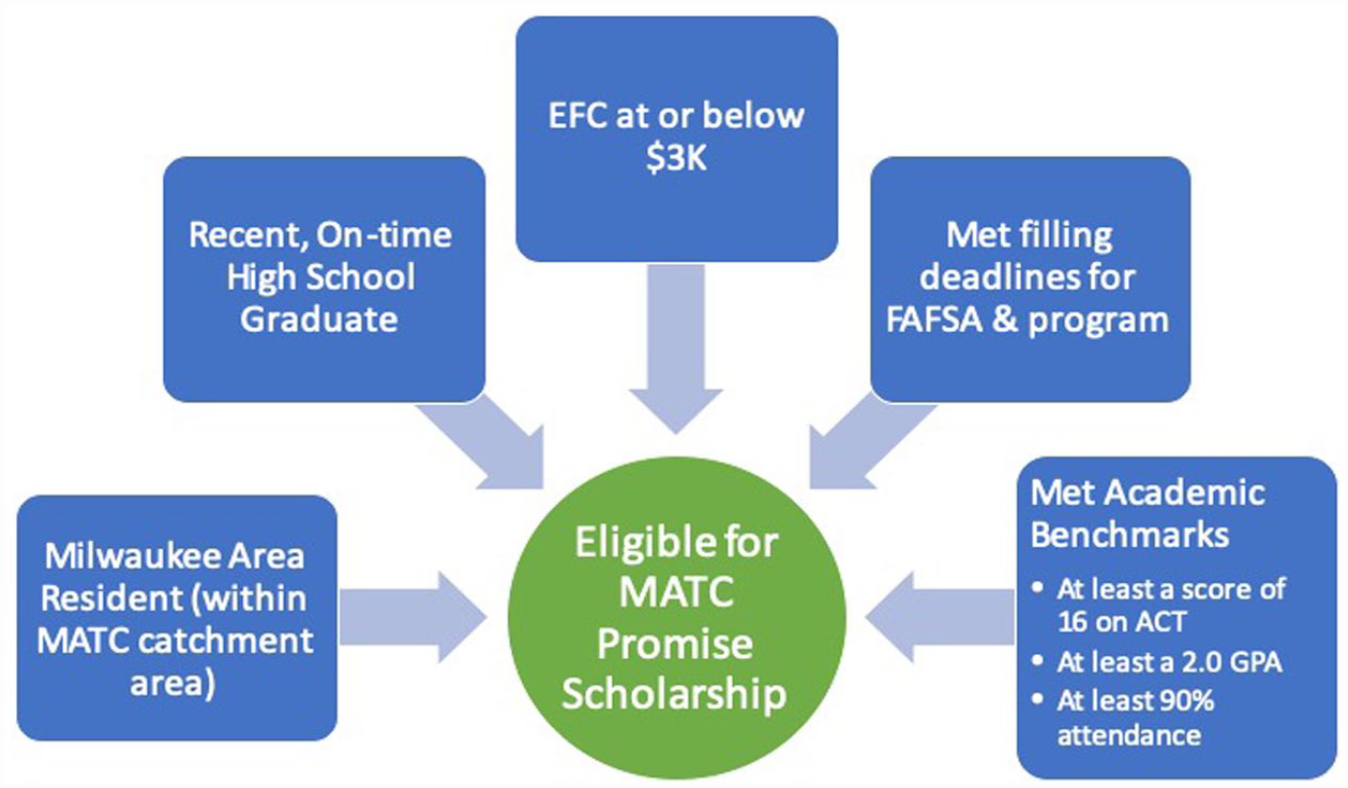
Eligibility requirement for MATC promise scholarship.
The college put considerable effort into publicity and recruitment in the Fall of 2015, working closely with Milwaukee’s high schools. The best evidence of success in this regard is that between September and December 2015, MATC received over 8,400 applications, an increase of nearly 2,500 over the same period in the prior year. 8
MATC administrators discussed two motivations for making Promise eligibility contingent on attendance and performance. 9 First, they wanted to increase the probability that Promise-qualifiers were college-ready, thereby not discrediting the program with low completion rates. At the same time, given the realities of student performance in MPS, MATC did not want to discourage applications by setting requirements too high. This is why performance requirements apply to senior year only. Second, MATC planners and MPS officials, who were consulted during the planning process, believed the requirements would spur greater effort and performance among MPS students.
The MATC Promise only pays tuition left over after need-based grants are applied. MATC’s tuition is low enough to be fully covered by need-based grants for low-income students. Therefore, students with a low enough EFC (i.e., most MATC students) will not receive any Promise funding regardless of meeting eligibility requirements. If high school students understood this, it could have limited the efficacy of the MATC Promise to influence academic behavior in high school. However, prior research has documented limited understanding of financial aid among lower-income youth (Goldrick-Rab, 2016; Grodsky & Jones, 2007). Thus, it is possible that most students did not understand this situation.
In addition, interviews (conducted by the first author) with MATC enrollees revealed widespread confusion regarding the financial benefits of the Promise program. Several students who believed that they were receiving Promise funds made statements revealing that they in fact were not. They claimed that the Promise paid for their books, but 1) Promise dollars applied to tuition only, and 2) for students whose Pell grant exceeds tuition, MATC automatically makes the balance available to cover books. Additionally, MATC administrators said that they focused, in marketing the Promise, on the “free college” message, expecting that this would motivate application by students for whom MATC was already effectively “free” but who did not know this. Earlier evaluations of Promise programs found evidence of similar confusion (Gonzalez et al., 2011).
Methods and Data
Data
Milwaukee Public Schools (MPS) was central to MATC’s recruitment strategy. In 2015 to 2016, MPS served 36% of all 12th graders in MATC’s catchment area. Of the 24 districts in this catchment area, MPS had the lowest proportion of recent high school graduates to enroll directly in postsecondary education (40%), indicating the greatest reservoir of potential college enrollees. And among districts, MPS had the highest proportion (50%) of college enrollees to attend a 2-year college (Wisconsin Department of Public Instruction, n.d.). Moreover, the MATC Promise’s low EFC threshold disqualified most suburban students, while the low ACT scores (MPS average in 2015–2016: 16) and high school grades of many MPS students disqualified them from attending anything other than open-access colleges.
We draw mainly on student-level administrative data from Milwaukee Public Schools (MPS). MPS provided us with data including all students enrolled in grades 9 to 12 at any point between academic years 2008 to 2009 and 2016 to 2017—a total of 80,814 students. The data covered two promise-eligible cohorts (those graduating in AY 2015–2016 and 2016–2017), as well as well as six comparison cohorts, each observed for at least 2 years. Because the MATC Promise restricted eligibility using only 12th grade academic performance, our analytic focus is on 12th grade outcomes and so we include in our analytic sample only students who were ever in 12th grade in MPS over the study period. Since we require data on prior academic performance as well, we further restricted to students who attended in MPS in both 11th and 12th grades during the study window. For those who repeated 12th grade, we include only the first attempt since the MATC Promise restricted eligibility to on-time high school graduates. Finally, we dropped from our analytic sample any student missing any attendance or GPA. 10 The resulting analytic sample is 23,351. Restriction criteria ensure that included cases have a minimum of 2 years’ data (grades 11 and 12); additional years were included if they are present. 83% of the analytic sample has at least 3 years of academic data, and 66% have 4 years.
Table 1 presents descriptive statistics for the analytic sample. This population is characterized by concentrated disadvantage. Three-quarters of the sample are free lunch eligible and nearly 90% are from racialized groups. Academically, they post average outcomes on the margin of Promise eligibility. The mean GPA (that is, within student, across years of enrollment) for the analytic sample is a low C (2.27), and the sample mean attendance rate is below 90%. Students in the sample on average attend schools in which the number of referrals and suspensions was over three times greater than the number of students.
Descriptive Statistics for Full MPS High School Population (2008–2009 Through 2016–2017) and Analytic Sample.
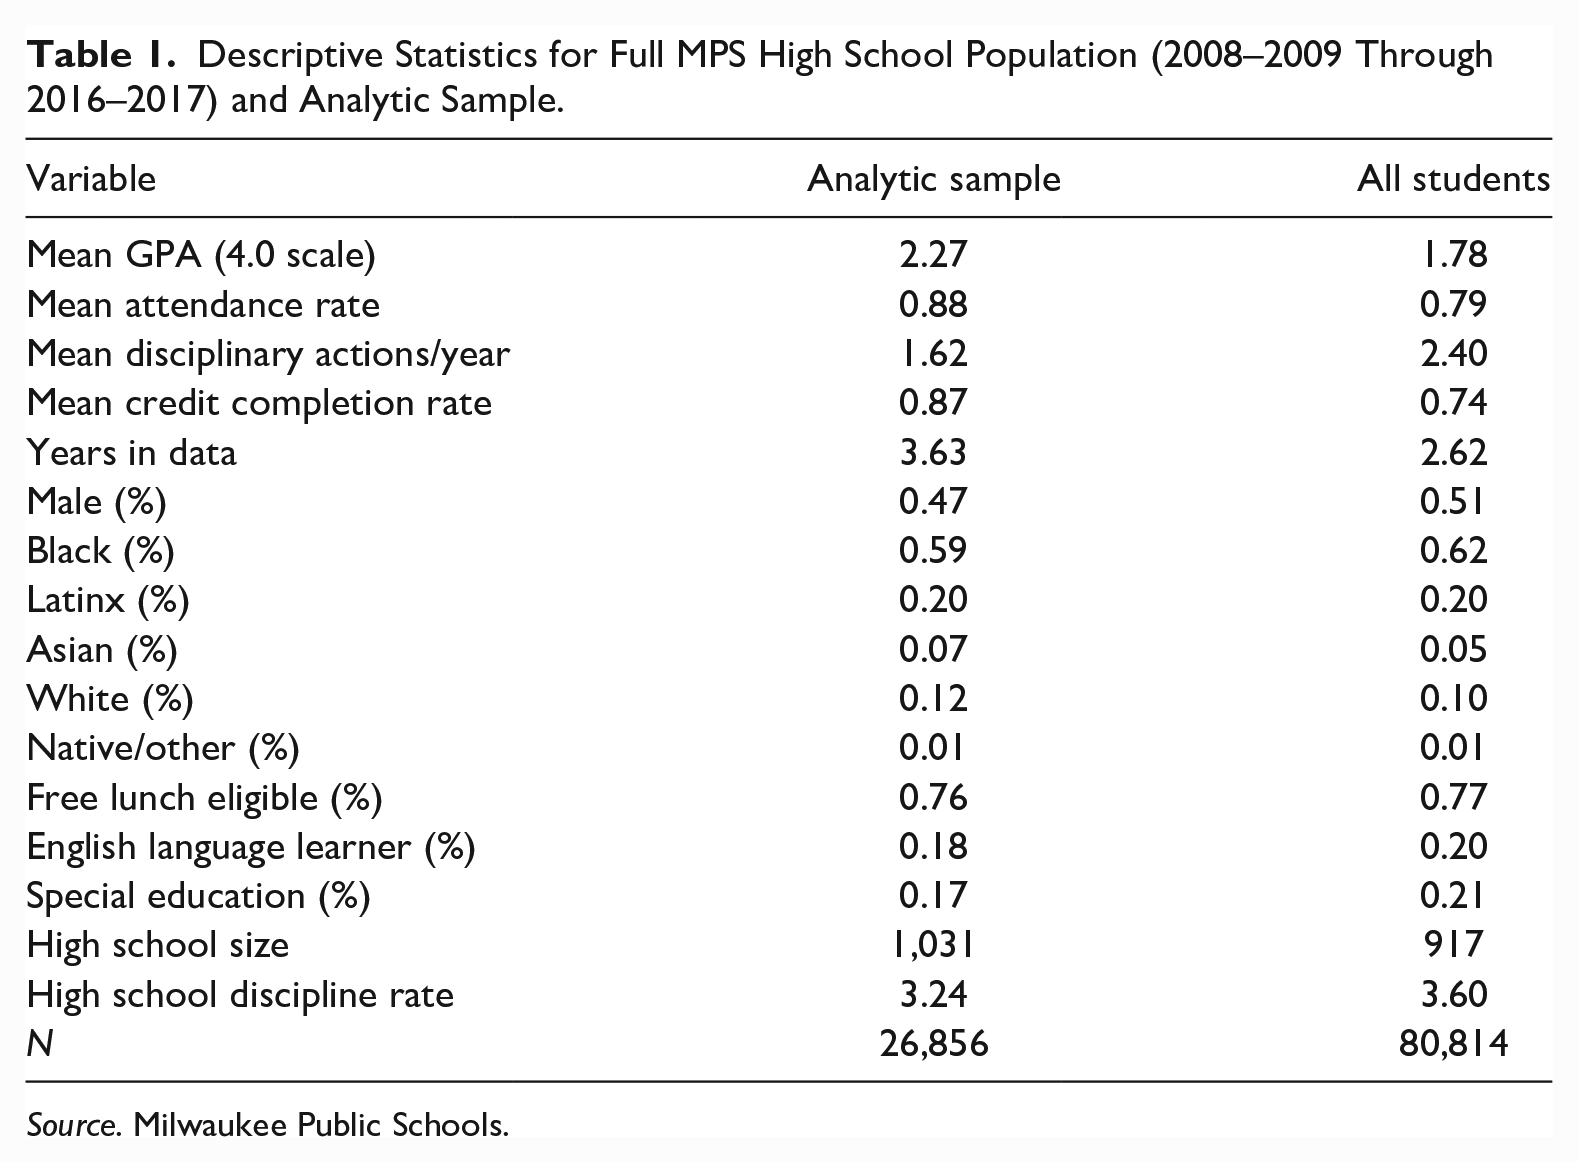
Source. Milwaukee Public Schools.
Table 1 also compares this sample to the full population of MPS high school students in the period in question to establish external validity for our results. The main divergences between the analytic sample and the full student population are in academic and behavioral indicators. The analytic sample’s mean GPA (that is, within student, across years of enrollment) is 27% higher than the district average, their average attendance rate is roughly 9 percentage points higher, and they are subject to 33% fewer disciplinary incidents per year. Otherwise, divergence is minimal. These differences are likely the result of credit-based promotion in high schools. To be included in the analytic sample, students had to earn sufficient credits to be classed as in 12th grade. Many students in MPS spend years classed as ninth or tenth graders, some never making it beyond this point. Differences in school characteristics likely stem from the resulting exclusion of students attending smaller, specialized schools for particularly at-risk populations.
Analytic Strategy
That the MATC Promise covers only specific cohorts (i.e., beginning with AY 2015–2016 12th graders), and that only senior year performance matters for Promise qualification, present an opportunity for differences-in-differences (DiD) identification. DiD is simple, intuitive, and widespread in applied education research as well as across the social and biomedical sciences. It is frequently employed to establish impacts of policy interventions on outcomes of interest.
In certain conditions and given certain assumptions, DiD can credibly identify causal effects (Angrist & Pisckhe, 2009). DiD is appropriate when 1) panel data is available, and 2) researchers cannot be sure that all pre-treatment confounders can be effectively controlled and thus that the conditional independence assumption is satisfied. In fact, DiD does not require baseline comparability between treatment and control groups; instead, it assumes that their outcomes, in absence of the treatment, would have exhibited parallel trends. If treatment and control groups are similar pre-treatment (conditional on the observables), DiD remains appropriate (Lechner, 2010).
A DiD estimator requires panel data separated into treated and untreated periods, and cases into treated and untreated groups. Just as with an experimental setup, in the period prior to the treatment, neither treated nor control groups are exposed to the treatment condition, while in the treatment period only the treatment group experiences the treatment. The difference is that it is not the control group that serves as a counterfactual but its trend-line for the outcome in question (see Figure 2). The causal effect is the difference between the treatment group’s pre-post difference and that of the control group. Most typically, DiD estimators appear in a regression framework with an interaction term (period × group) as the parameter of interest.
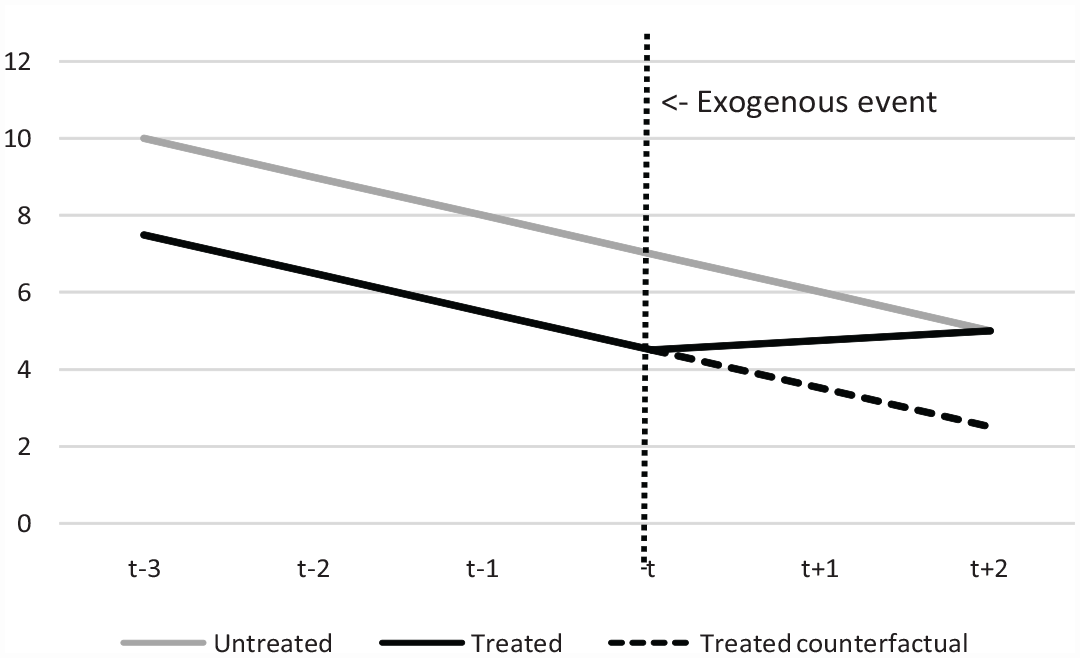
A representation of a ideal-typical differences-in-differences analysis. An exogenous event at t effects only the treatment group, changing the slope of its trend-line. The control group’s trend after t, not its value, provides the counterfactual for the treatment group’s trend after t. The parameter of interest is the difference, between treatment and control group, of the differences between pre- and post-measurements.
There are two assumptions upon which DiD rests, only one of which is even partially testable. The first is that of parallel trends: that, in absence of treatment, outcome trends for treated and control groups proceed in parallel. As the counterfactual trend is not observed, the best researchers can do is determine whether trends before the treatment are parallel. However, establishing that pre-treatment are parallel trends is neither necessary nor sufficient to conclude that trends post-treatment would have been so (Kahn-Lang & Lang, 2020). At best, parallel pre-treatment trends make the counterfactual assumption more credible. The other major assumption is the absence of a confounding event (e.g., another policy change), simultaneous to the onset of treatment, that may have affected treated and control groups differentially. This assumption is ultimately untestable.
Because eligibility for the MATC Promise was based on academic outcomes (GPA and attendance rate) in 12th grade only, its introduction should mostly, if not exclusively, impact academic performance in 12th grade. 11 Thus, the DiD’s first difference is between students’ attendance and performance in 12th grade as compared with prior grades. If this difference was appreciably greater (or smaller) for Promise-eligible cohorts than for prior cohorts (the second difference), this difference can be attributed to the program. The analytic strategy is captured in this model:
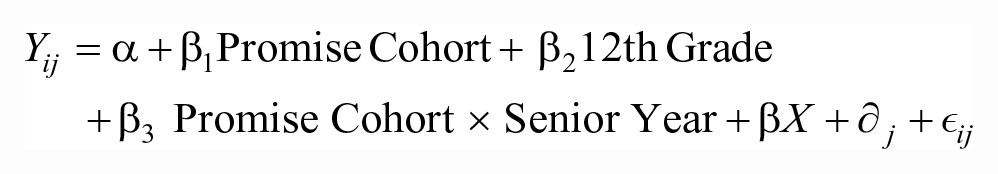
Yij is an outcome (attendance rate or GPA) observed for student i in year j. PromiseCohort is equal to 1 for students whose (first) senior year was in either 2015 to 2016 or 2016 to 2017, and otherwise 0. 12th Grade is equal to 1 for a student’s (first) senior year, 0 otherwise. The parameter of interest is the coefficient
A crucial—and untestable—assumption is that nothing else of importance changed for the Promise cohorts relative to prior cohorts that would make their senior years fundamentally different. Grade-level effects are to be expected, as are cohort effects; DiD controls these well, for mathematically DiD is equivalent to a two-way fixed-effects estimator for the units covered by the main-effects variables (Angrist & Pisckhe, 2009, pp. 227–243). 13 But if some other district-wide policy were enacted in 2015 to 2016, 14 affecting only 12th graders (or affecting 12th graders differently from students in other grades), then this would undermine identification. We know of nothing likely to have had this impact but cannot be ruled out. The DiD estimator permits identification of a local average treatment effect. Our estimates apply only to students enrolled in MPS for at least junior and senior year during the time period in question and may be generalized beyond this only with caution.
Variables
Our outcome variables are yearly grade point average (GPA) and attendance rate. The latter does not presume full-year attendance in-district; it is calculated using total in-district member days. We also constructed binary versions of both dependent variables using Promise eligibility thresholds, as well as a dummy variable equal to 1 if the student cleared both eligibility thresholds.
Controls include a binary gender variable, race (Latinx, White, Asian, and Native, and other race versus a Black reference category), as well as dummy variables for special education and free-lunch eligible (FLE) status. The latter dummy is equal to 1 if students are not FLE because most district students are eligible. English language learner (ELL) status is coded as never, formerly, or currently ELL. Because this is an unbalanced panel, cases with more years in the data may unduly influence outcomes. To guard against this, we include a variable measuring the total number of years a student was enrolled in MPS.
We divide MPS high schools into six categories and use dummy variables for each category as school-level control variables. 15 Comprehensive high schools are large, have no enrollment eligibility, and mostly draw from surrounding neighborhoods. Test-in high schools include magnet schools and Milwaukee’s large arts and languages high schools. Tech schools have an explicit vocational mission, and at-risk schools serve populations identified for behavioral problems or as being highly likely to drop out (e.g., student-parents). Charter high schools are publicly funded but privately managed schools open to district students. 16 Finally, alternative schools are publicly managed and open enrollment, but smaller than comprehensives and often organized around specific missions (e.g., a public K-12 Montessori school). School type varies within student but not within year. Students who attended multiple schools in a year were assigned to the school at which they spent the most member days.
Two school-level controls were included in the model. School size is the (logged) average population of students enrolled in a school each year, across the three district census days. Discipline rate is the number of referrals or suspensions at a school each year, divided by that school’s average population and logged. 17
Results
Baseline Comparison and Pre-Treatment Trends
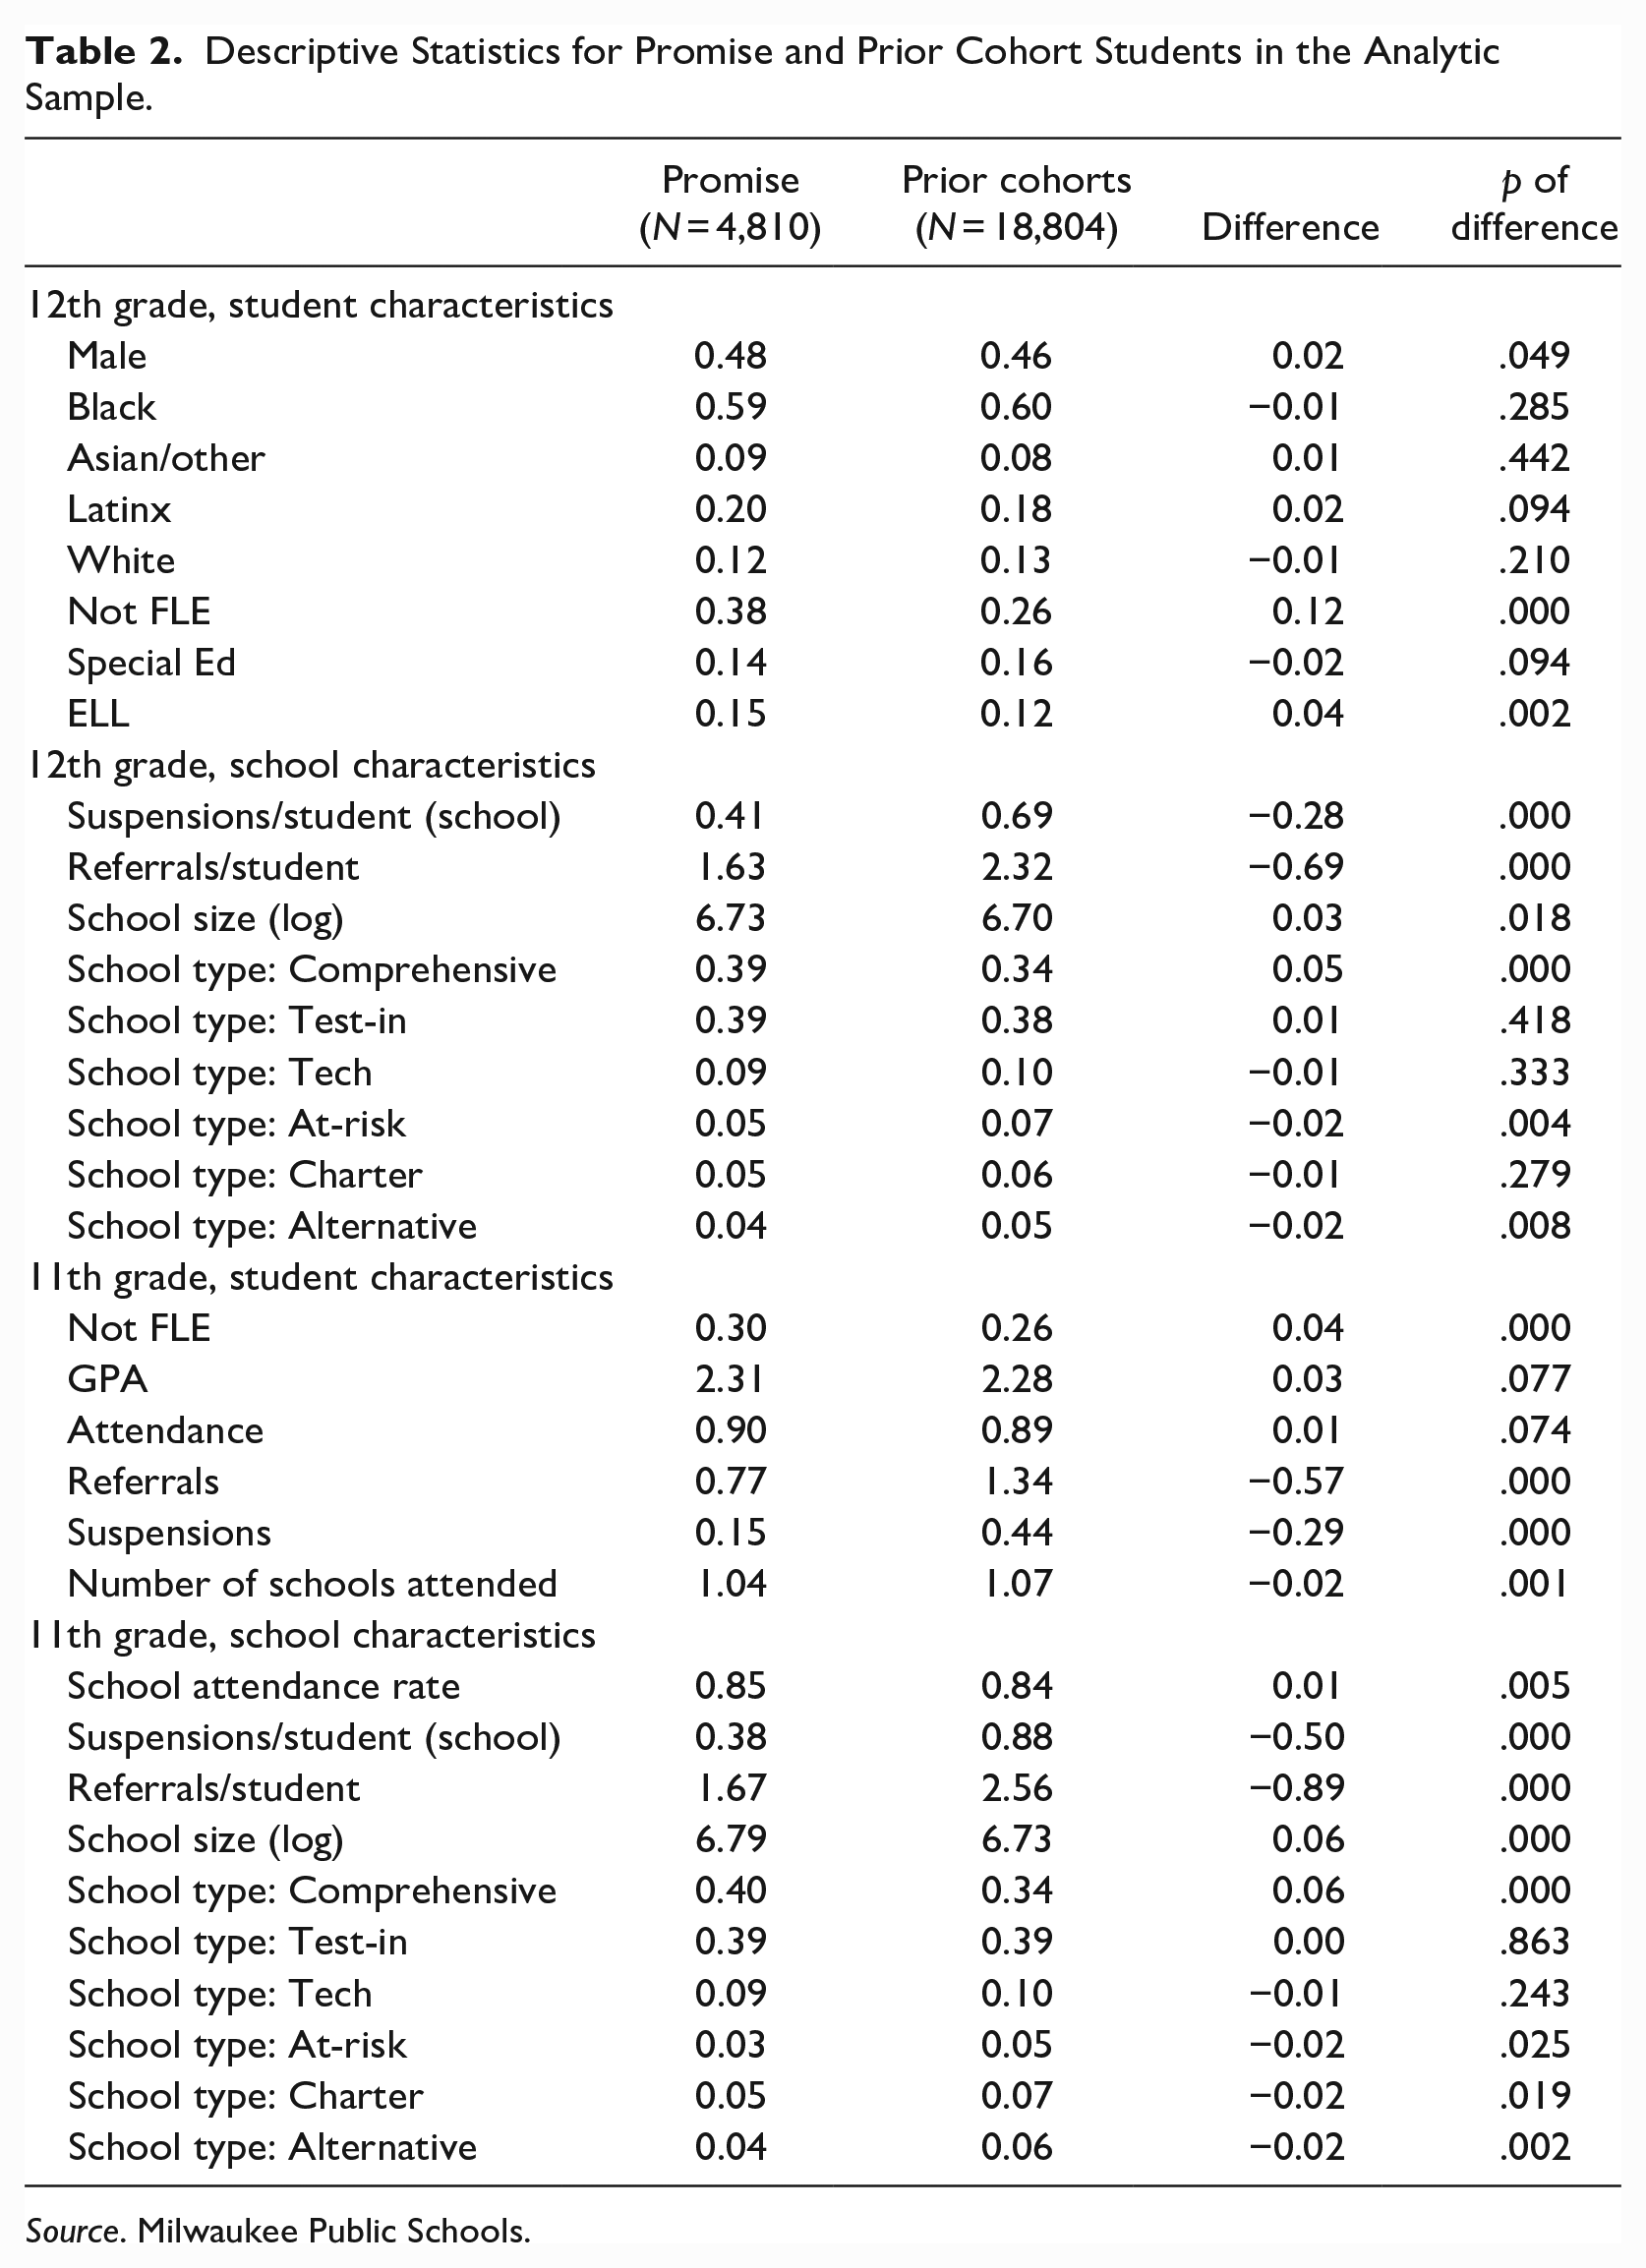
Table 3 presents descriptive statistics comparing Promise-eligible cohorts to prior cohorts in our analytic sample. The groups are quite comparable at baseline; that some differences merit statistical significance (p < .05) reflects our large sample size. The major divergences are in measures of disciplinary sanctions. Promise cohort members were much less likely to have been individually referred or suspended in 11th grade, and in both 11th and 12th grade students in their schools experienced fewer such actions as well. We do not know whether this reflects changes in school policies, behaviors of students, or both.
As discussed above, the DiD strategy depends on the parallel trends assumption. Outcome trends by grade are depicted visually in Figures 3 and 4. For GPA, the comparison cohorts have a 9th grade average that is slightly higher than Promise-eligible cohorts. Trends subsequent to 9th grade, however, are strikingly parallel. That trends in attendance rate are parallel from grades 9 through 11 is also very clear from Figure 4. This graphic analysis provides some confidence the validity of the DiD strategy.
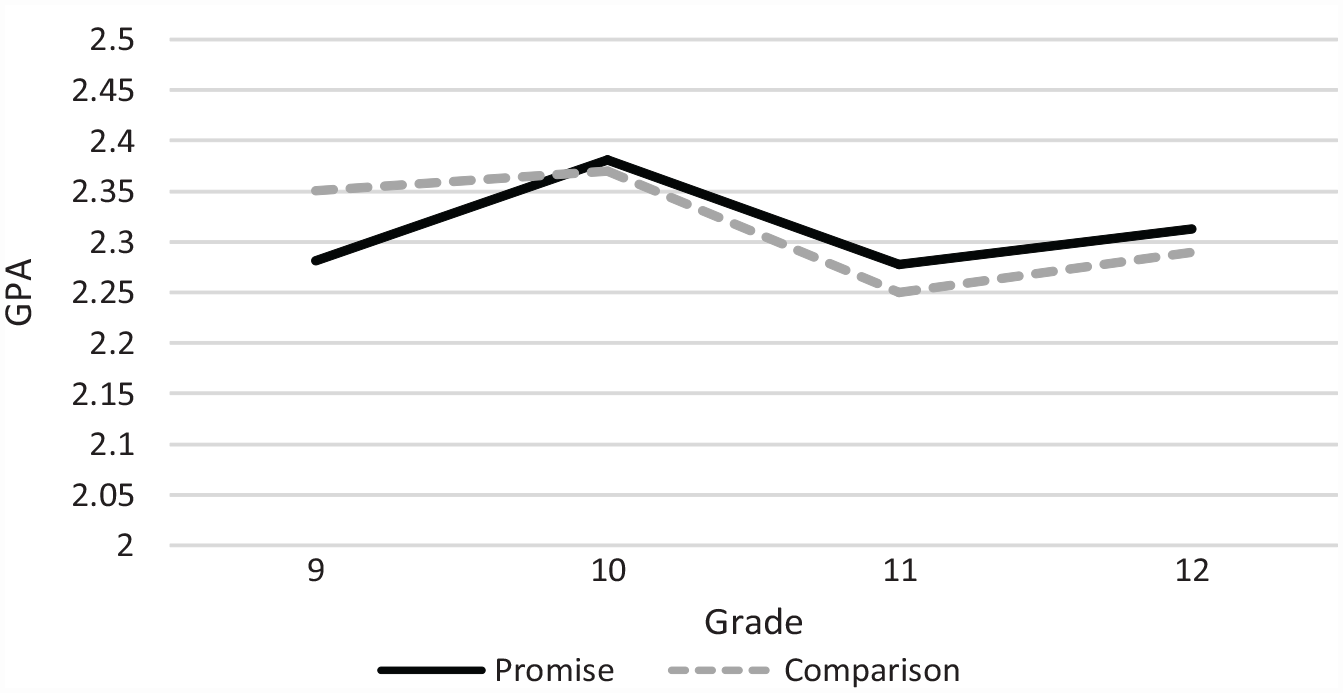
Mean GPA by grade for Promise-eligible and comparison cohorts, analytic sample only.
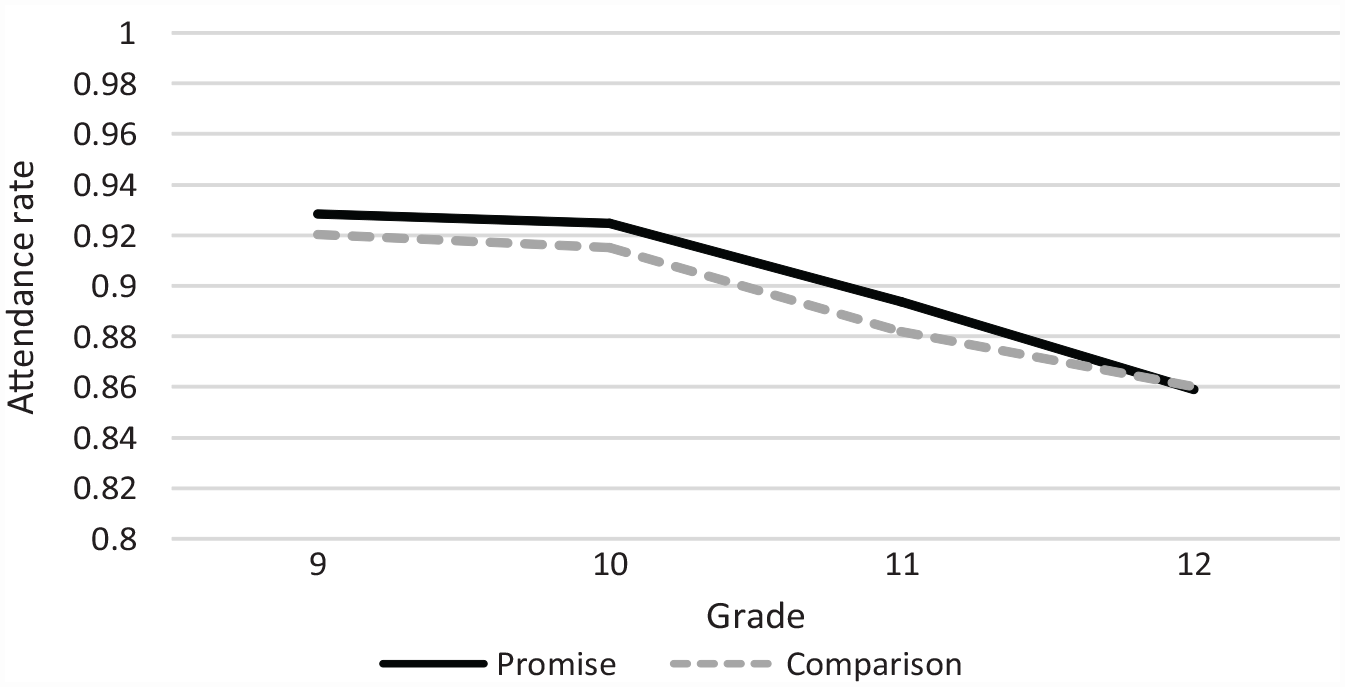
Mean attendance rate by grade for Promise-eligible and comparison cohorts, analytic sample only.
These figures also provide a first look at our outcomes. The focus should be on differences in the slope of the lines as students move into 12th grade. For GPA, there are no visually apparent differences between these two trend-lines. Looking at attendance, it appears that comparison cohorts improve more from 11th to 12th grade than do the Promise cohorts. Descriptive means in retention rates before and during grade 12 for the two groups confirm that Promise cohorts indeed worsened more in 12th grade [[PromisePost (0.8591) − PromisePre (0.9152)] − [ComparisonPost (0.8603) − ComparisonPre (0.9021)] = −0.0143]. Similar arithmetic for GPA reveals an advantage for Promise cohorts of three-hundredths of a grade point. Thus, descriptive analysis suggests null-to-negative effects of the MATC Promise on these outcomes.
Differences-in-Differences Analysis
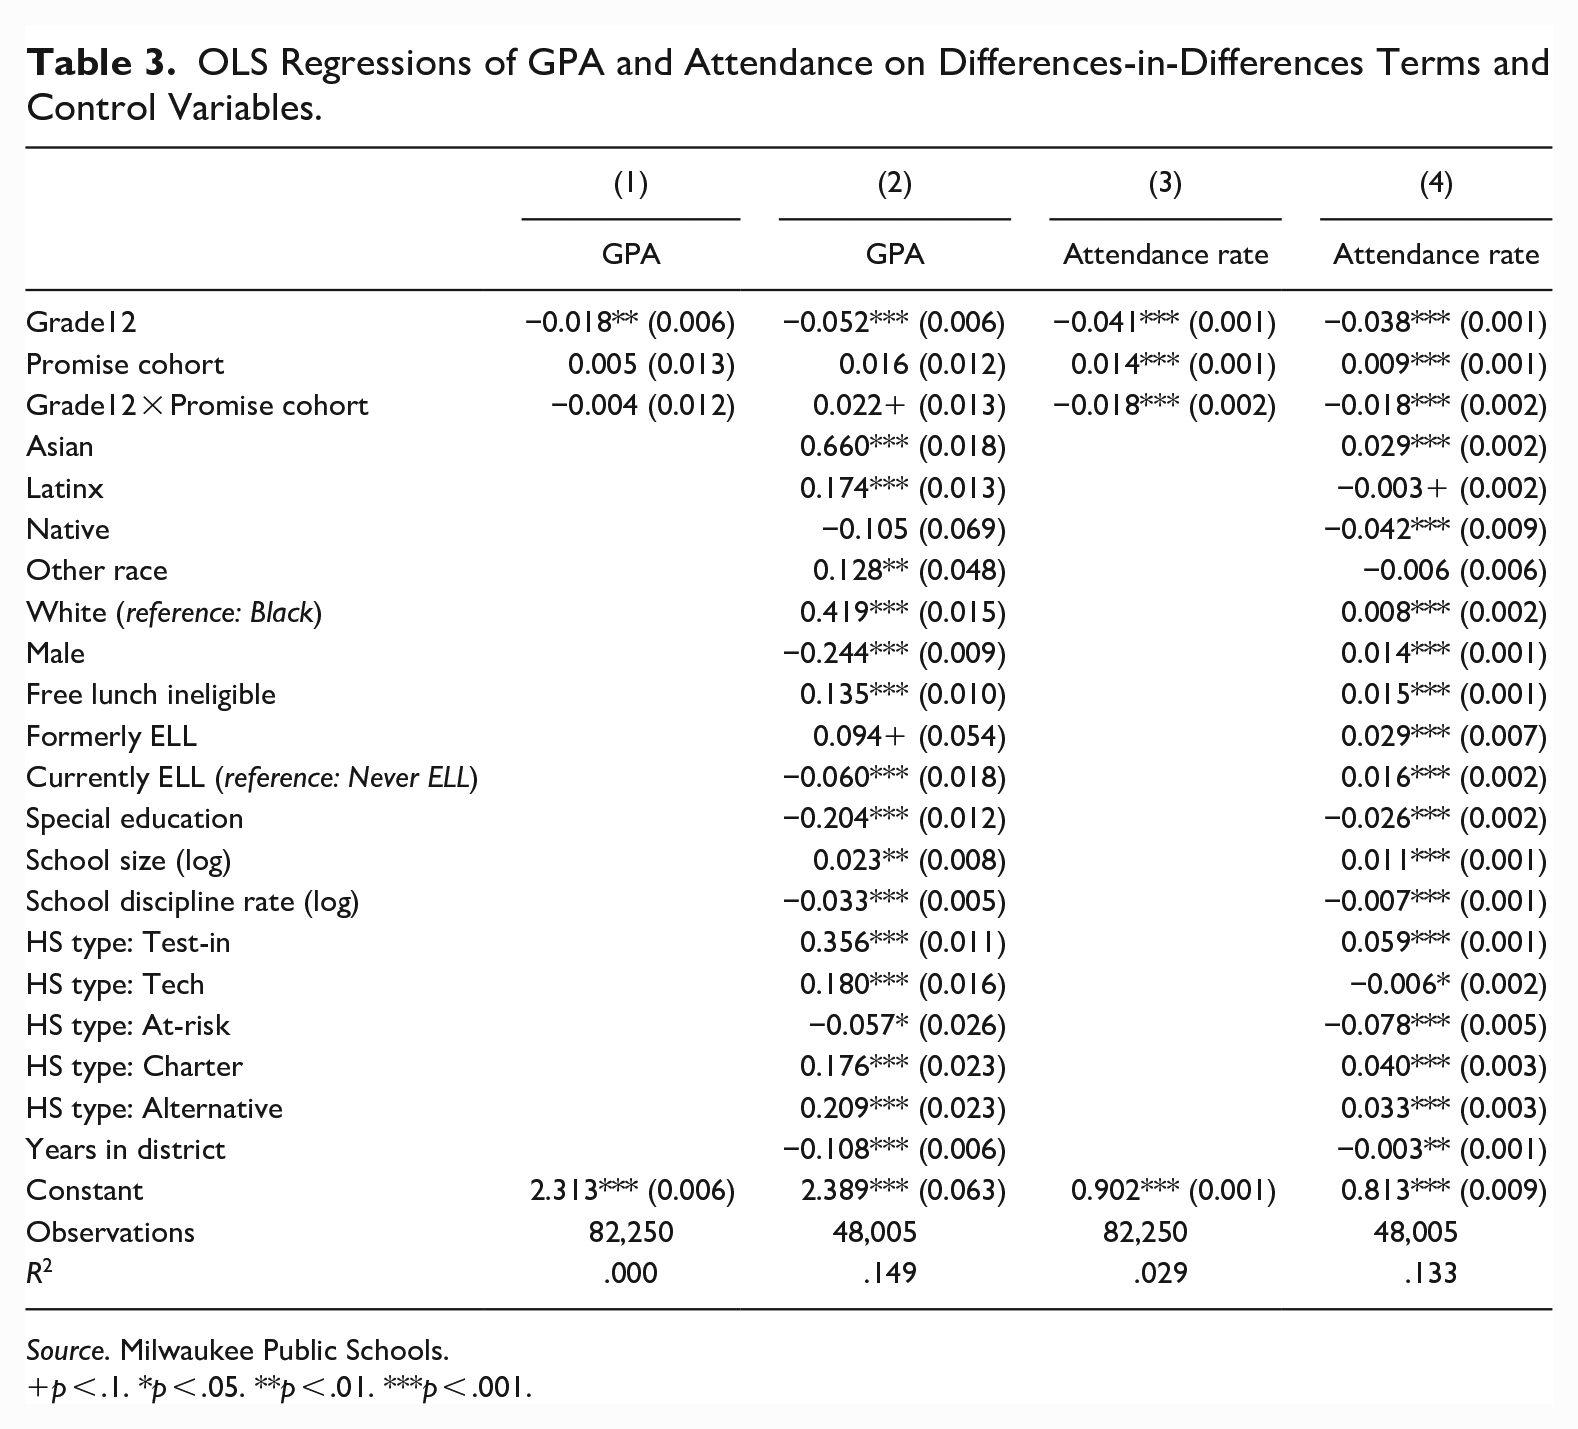
Table 3 presents the results of our main differences-in-differences analysis. The parameter of interest is, in each analysis, the coefficient for the term interacting the variables Grade 12 and Promise cohort. In the first column, GPA was regressed on the target variables only. Results suggest that GPA tends to be slightly lower during 12th grade than in prior years on average. This is because though GPA is lower on average in 11th grade, it is higher prior to that than in 12th (see Figure 3). With controls added (column 2), results suggest that this 12th grade downturn was slightly smaller than expected among Promise cohorts (p < .1). This estimated effect is small—between two and three-hundredths of a grade point, and only 2.5% of a standard deviation (SD = 0.896).
In the regressions reported in the right-most columns of Table 2, the dependent variable is the student’s attendance rate. Students in MPS have a 4.1 percentage point lower attendance rate in 12th grade than in prior grades. The introduction of the Promise led eligible cohorts to lower their attendance rate still further—by another 1.8 percentage points. The addition of controls does not alter this result.
Descriptive Statistics for Promise and Prior Cohort Students in the Analytic Sample.
Source. Milwaukee Public Schools.
Were these changes sufficient to push more students across program eligibility thresholds? To examine this, we regressed indicator variables for having met or exceeded program thresholds on target and control variables (Table 4). Results suggest that in prior cohorts, about 1.3 percentage points fewer students earned at least a 2.0 GPA in 12th grade than had in prior years. In the Promise cohort, there was a small increase in the proportion making this grade threshold (roughly 1%), relative to the cohorts’ lower baseline. Overall, we estimate that in this cohort, the share of students earning at least a 2.0 GPA was 1.8 to 2.2 percentage points larger than had would have occurred without the Promise.
Results for attendance are quite different. Students are less likely to meet the attendance threshold of 90% as seniors, but the negative coefficient on the interaction term shows that Promise cohorts were even less likely to do so. The estimated marginal effect of the Promise program’s creation is to reduce the share of students attending at least 90% of the time by 5 percentage points, against a counterfactual rate of 58%. These two impacts mostly counterbalance each other. The estimated marginal effect of Promise introduction on meeting both eligibility criteria is negative, statistically nonsignificant, and smaller than 1 percentage point. 18
Treatment Effect Heterogeneity
Tables 3 and 4 display only average effects, but Promise effects could vary across subgroups of students. We investigate this possibility in Table 5, reporting only statistics related to the target interaction term: coefficient (β), standard error, and p value. Separate OLS regressions were conducted for groups defined by gender, race/ethnicity, free lunch status, special education status, ELL status, and school type.
OLS Regressions of GPA and Attendance on Differences-in-Differences Terms and Control Variables.
Source. Milwaukee Public Schools.
p < .1. *p < .05. **p < .01. ***p < .001.
Logistic Regressions of GPA and Attendance on Differences-in-Differences Terms and Control Variables.
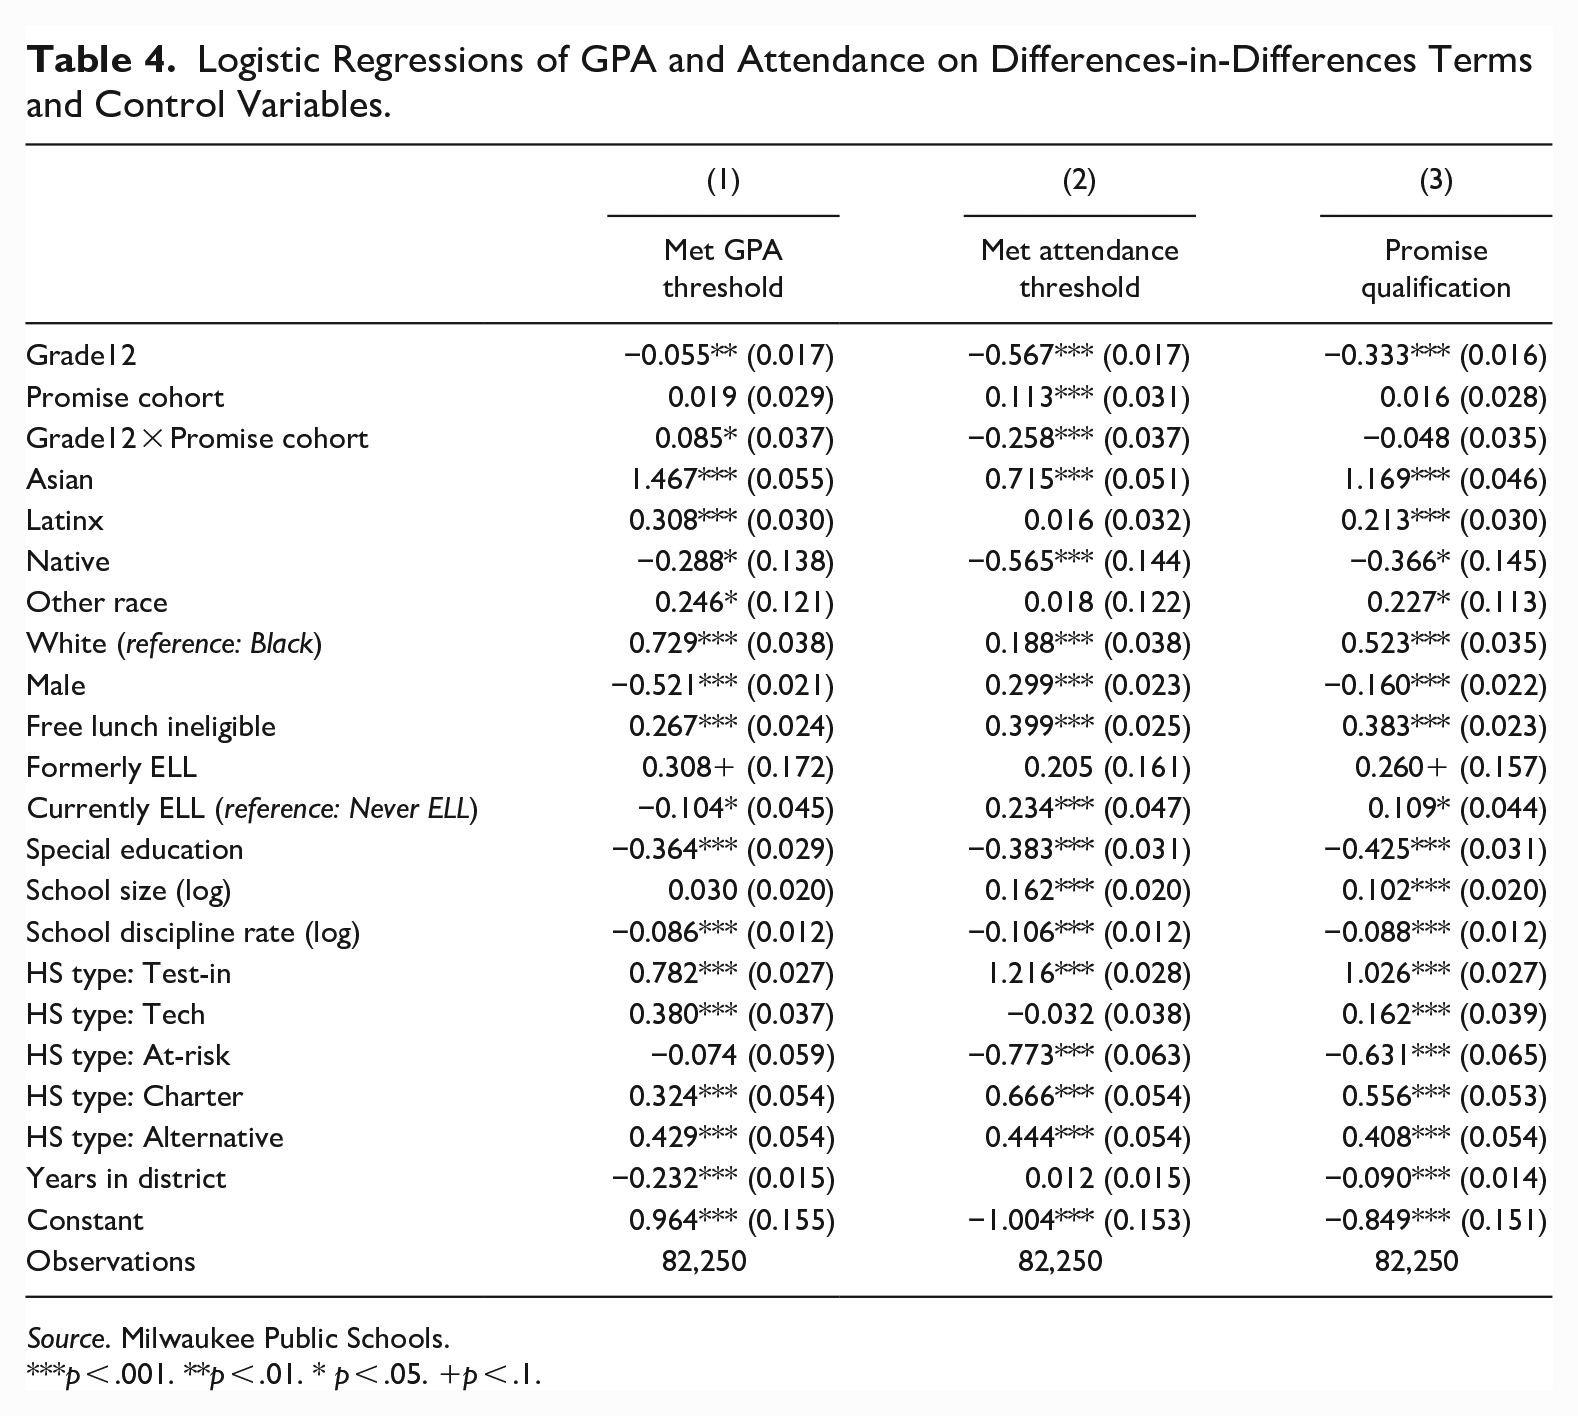
Source. Milwaukee Public Schools.
p < .001. **p < .01. * p < .05. +p < .1.
Analysis of Treatment Effect Heterogeneity.
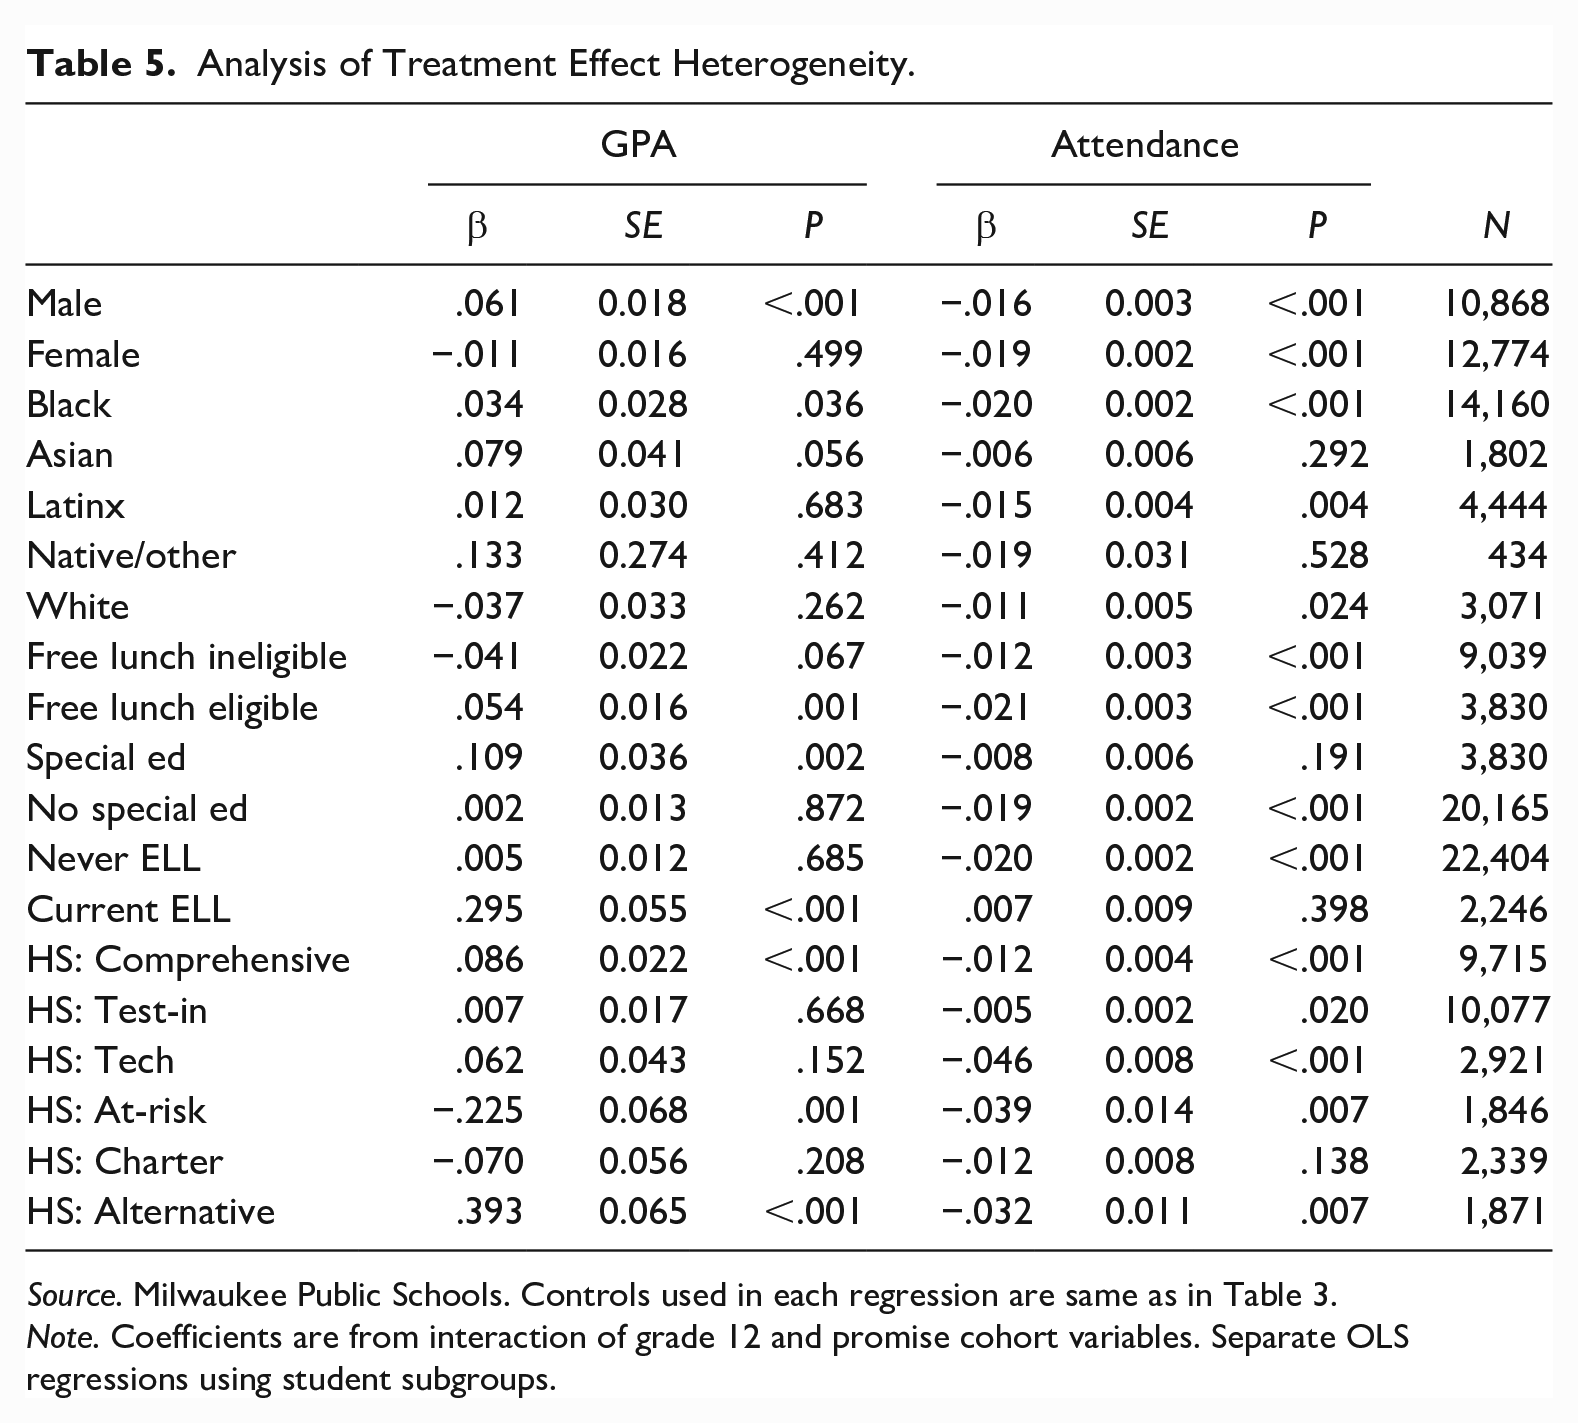
Source. Milwaukee Public Schools. Controls used in each regression are same as in Table 3.
Note. Coefficients are from interaction of grade 12 and promise cohort variables. Separate OLS regressions using student subgroups.
For GPA, estimated Promise effects are positive for most subgroups. Estimates are statistically significant for males, Asians, students eligible for free lunch, special education students and current ELL students. Effects are positive and statistically significant for those attending comprehensive and alternative high schools but negative for students in charter schools. Estimated effects are larger than average for students in special education, current ELL students, and students in alternative high schools.
By contrast, estimated effects of the Promise on attendance are nearly uniformly negative. Point estimates for most groups range from between a 1.5 and 2.5 percentage point reduction in attendance rate. Effects appear slightly larger among students at technical high schools and schools for at-risk populations, and smaller among Asians, Latinxs, and students at test-in schools. For only one subgroup (current ELL) do we witness a positive point estimate, and this is nonsignificant.
It is possible that the Promise’s introduction might have a larger impact on students whose performance or attendance was closer to the threshold of eligibility. Students whose performance was too low may have perceived thresholds as out of reach, and those whose performance was above the threshold did not have an incentive to further increase performance. To investigate this, we constructed bounds around both GPA and attendance thresholds. For GPA, we built one-point (1.5–2.5) and half-point margins (1.75–2.25) symmetrically about the threshold. We did not use symmetrical attendance margins as the attendance threshold of 0.9 is high enough to raise concerns about ceiling effects. Instead, we created two 20-point margins, one running from 15 percentage points below to five points above the threshold, and another from 20 points below to the threshold itself. For these analyses, margins are based on 11th grade performance and attendance.
In all cases, estimated effects among students near the margins of eligibility are similar to those for the full analytic sample (see Table 6). Among students near the GPA threshold, point estimates suggest Promise-related increases of roughly two hundredths of a grade point, but these do not reach statistical significance. Among those near the margin of eligibility for attendance, there is a reduction in attendance rate of between 2 and 3.5 percentage points.
Effects of Promise Introduction on Students Near Margins of Eligibility.
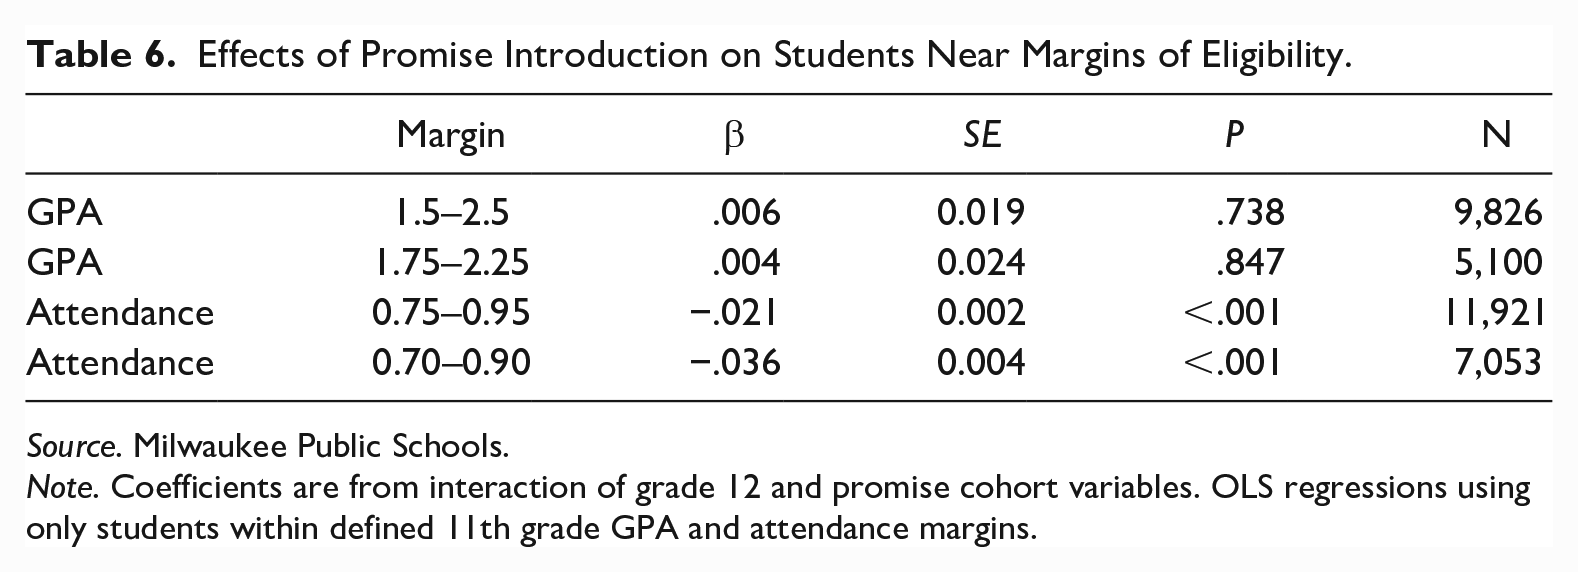
Source. Milwaukee Public Schools.
Note. Coefficients are from interaction of grade 12 and promise cohort variables. OLS regressions using only students within defined 11th grade GPA and attendance margins.
Finally, the Promise may have had differing impacts on the two Promise-eligible cohorts. This is not to argue that there might be heterogeneous effects of the same treatment, but that there might effectively be two distinct treatments. Perhaps in the first year the novelty of the program led to greater enthusiasm and organizational effort in outreach and recruitment relative to the second year. Alternatively, perhaps the first year was characterized by implementation mishaps and confusion that were corrected during the following year.
To investigate this, we created separate indicator variables for the two Promise cohorts and interacted both with the 12th grade dummy. These interaction terms’ coefficients from regressions of GPA and attendance are included in Table 6. For GPA, there is a larger estimated impact of the Promise for the second cohort, and only among this cohort is the estimate statistically significant. The 2016 cohort also has a slightly larger negative estimate for attendance (both are statistically significant at p < .001). This suggests that average effects are more attributable to effects on the second eligible cohort.
Robustness Checks
Given that our results are somewhat counterintuitive, we tested their robustness in several ways. First, there is a concern that the specific decisions that we made in building our analytical sample biased results. To test this possibility, we constructed alternative samples including as many cases as possible (Table A1). We relaxed the requirement that students appear in both 12th and 11th grade, including any student for whom we had data for 12th grade and any prior grade. When examining GPA, we included cases missing data on attendance, and vice versa. Doing so added roughly 4,800 cases to the analysis of GPA, and 5,500 cases to that for attendance. These analyses echo our main findings. We also conducted analyses without restricting to students who attended in 12th grade—permitting a sample of 79,372 cases. In such analyses, the target variable remained the interaction between Promise cohort membership and 12th grade. Results (available upon request) were substantively like those in Table 3.
Or perhaps our results are sensitive to the number of comparison cohorts or comparison grades included in the analysis. We tested by progressively restricting to more recent comparison cohorts (Appendix Tables A2 and A3). When only the most recent comparison cohorts are included, the estimated effect of the MATC Promise on GPA turns negative, but the effect on attendance is unaffected. We reproduced analyses that only included grade 11 and grade 12 data, and again results are nearly identical to those in Table 3 (results available upon request).
Finally, we tested for the effect of the MATC Promise through propensity score matching. Matching estimators involve different assumptions from DiD, and we are confident that DiD is more appropriate for our analysis. Nonetheless, matching results agree with our DiD results (Appendix Table A4), providing further confidence in our findings.
Discussion
The results from the current study are counterintuitive. The introduction of a free-college program which set GPA and attendance requirements for eligibility appears to have had the expected effect on GPA, albeit a small one, but an opposite impact with regards to attendance. This result is difficult to explain given that attendance is more readily under students’ control than grades. If significant results for attendance were found but no measurable effects on GPA, one may interpret results as suggesting that students were devoting more effort but did not know how to convert effort into better grades. But why the introduction of the Promise would lower attendance—particularly concurrently with increased performance—is baffling.
One possible explanation is that students were less aware of the attendance requirement than the GPA requirement. Prior studies of Promise programs suggest that misunderstandings of program rules are common (Gonzalez et al., 2011), and the MATC Promise has particularly complex criteria for eligibility. Still, this would lead one to suspect a null effect on attendance, not a negative impact. Another possibility is that students (at least in the second cohort) were more motivated to pass their classes but not to attend them. This lines up with the concept of “senior slump” in which high school seniors ensure the maintenance of their GPA by taking non-academic courses. Because these non-academic courses are rarely engaging or demanding, some students feel freer to skip them (Kirst 2001; Roderick et al., 2013). Somewhat similarly, by the second year, some students may have become aware that, because of their economic situation (i.e., EFC = $0), they could attend MATC at no cost anyway. With a plan to attend MATC firmly set, these students may have felt freer to focus on other activities rather than attend class.
Some readers may suspect that contradictory results reflect mild but pervasive grade inflation in the district. If teachers believed that receipt of the Promise scholarship could have lasting impacts on students’ lives, they may have rounded grades up or offered extra credit where previously they would not have. Evidence of such manipulation has been found in high school exit exams (Dee et al., 2019), but not from the introduction of state merit scholarships (Bugler et al., 1999). This is inconsistent with results in Tables 6 and 7. One would expect teachers to engage in subtle grade manipulation for students closer to the margin of eligibility, and there is no evidence of this. One would also expect this to be more prevalent in the program’s first year, when it was more novel and better publicized; the opposite occurred.
Effects of Promise Introduction on Separate Eligible Cohorts.
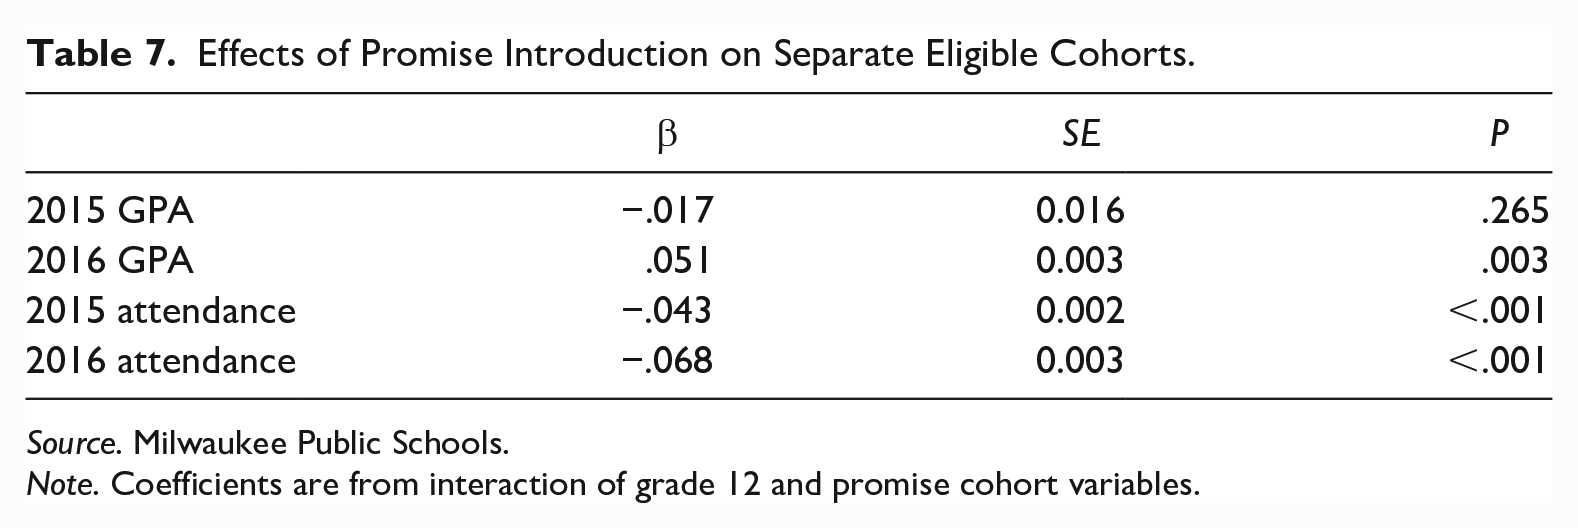
Source. Milwaukee Public Schools.
Note. Coefficients are from interaction of grade 12 and promise cohort variables.
Though more research is clearly warranted, results should give pause to policymakers wishing to use low-bar merit scholarships to improve high school performance. At the very least, findings suggest that program design may matter quite a bit. The MATC Promise had many eligibility criteria, including academic thresholds, financial thresholds, and multiple filing deadlines. The resultant confusing maze of requirements may have dampened effort.
MATC may have obscured eligibility rules to entice the greatest number of students possible to apply and attend. One member of the planning committee told us: “We wanted to make sure the message was easy enough that any student could go home and have a conversation with their family . . . We came to the consensus that people would understand ‘free’.” And the Promise website announced: “The MATC Promise will help area high school students realize their dream of attending college and preparing for a career . . . at NO COST to the student!.” 19 Trumpeting the program as “free” at the expense of all else may have worked against the goal of increasing student engagement. To the extent that policymakers want to increase both college-going and school engagement, clearly indicating reachable thresholds may be more effective. Indeed, present research suggests that universal, merit-indifferent free college programs improve secondary school performance better than do low-bar merit designs.
Conclusion
Policy is often crafted with the presumption that youth are “adolescent econometricians” (Manski, 1993) who respond to incentives for academic performance by increasing effort. In theory, low-bar merit scholarships can boost performance by shifting the incentive structure. This study investigates whether one such program, announced in 2015 and launched in 2016 by Milwaukee Area Technical College, had such an influence. The results are contradictory: the program appears to have slightly increased students’ performance (grades) but decreased rule-oriented effort (attendance). The number of additional students who exceeded the performance threshold was matched (in fact, slightly exceeded) by the number falling below the attendance threshold.
Our findings regarding whether low-bar merit scholarships boost academic performance among low-income youth are inconclusive. It might be, paradoxically, that among students with limited prior academic success, not including merit criteria could inspire improved performance better than including them (Bartik & Lachowska, 2014; Carruthers & Fox 2016). The existence of the academic threshold might inhibit performance by priming awareness of prior setbacks. In the absence of such a threshold, no such priming occurs, and the student is mainly impacted by changes in the perceived opportunity structure.
An additional implication of this study regards program simplicity and communication. Scholars have argued that by emphasizing the word “free,” Promise programs cut through the confusions of the financial aid system and thereby boost college-going among economically struggling youth (Goldrick-Rab & Miller-Adams, 2018). This is probably true, but it would undermine an effort to boost high school performance by making aid seem unconditional. Further, as the MATC Promise involved a welter of eligibility criteria, students on the margin of eligibility may have been distracted from the criteria specifically related to high school performance. If incentivizing academic performance in high school is a major program goal, little else should restrict eligibility and the criteria should be foregrounded in marketing.
While our results may not directly challenge the rational-actor framework that justifies merit programs, they certainly call these justifications into question. The vast expansion of Promise programs over the past decade, some of which do and some of which do not have merit criteria, has created plentiful opportunities for further examining these questions. If programs which have merit criteria raise performance more effectively than those that do not, ceteris paribus, then this would suggest these thresholds incentivize achievement. Given that new scholarship programs are created every year, researchers should continue to investigate whether, to what extent, and under what conditions merit criteria can impact high school academic performance—particularly among the lowest-scoring half of students.
Footnotes
Appendix
We used 5-nearest neighbors matching with a caliper equal to .25 times the standard deviation in the propensity score, imposing common support, and allowing for ties. The model generating the propensity score (i.e., predicting treatment status) had the following independent variables: gender, race, special education status, free lunch status (12th grade), ELL status, years attended MPS, 12th grade school population, 12th grade school type, 12th grade school discipline rate, free lunch status (11th grade), number of schools attended (11th grade), GPA (11th grade), attendance rate (11th grade), number of disciplinary incidents (11th grade), 11th grade school discipline rate, 11th grade school attendance rate, 11th grade school population. Outcomes are all measured in 12th grade.
Declaration of Conflicting Interests
The author(s) declared no potential conflicts of interest with respect to the research, authorship, and/or publication of this article.
Funding
The author(s) received no financial support for the research, authorship, and/or publication of this article.