






Abstract
Objective:
In recent years, many colleges have switched developmental education (DE) from prerequisite models to corequisite models. While extensive literature has demonstrated that corequisite DE is more effective at helping underprepared students achieve better college outcomes, less attention has been given to its costs and cost effectiveness. This study estimates the cost and cost effectiveness of the mathematics corequisite model under the Kentucky Community and Technical College System (KCTCS).
Methods:
Leveraging comprehensive administrative, human resources, and fiscal data across all 16 colleges, we estimated both direct and indirect instructional costs of corequisite DE and compared them with the costs of traditional prerequisite models. Using enrollment and passing rates of college mathematics courses, we evaluated how much it would cost to achieve the immediate goal of DE: supporting academically underprepared students to pass introductory college mathematics courses.
Results:
The total cost for an average student to reach college-level mathematics is about $1,529 under corequisite DE and $1,395 under prerequisite DE (in 2020 dollars). However, because students under corequisite DE were more likely to pass college-level math than students under prerequisite DE, corequisite DE is 54% less costly per student passing a college-level math course than prerequisite DE.
Contributions:
There is wide variation in corequisite DE implementation. Our results add to the only known cost study of corequisite DE, and they largely confirm the previous findings about a corequisite model implemented in a different context. Taken together, the results advocate for continued investment in corequisite DE as a scalable solution to improve mathematics outcomes while maintaining fiscal responsibility.
Introduction
Traditionally, community college students who are underprepared for college mathematics must take a sequence of non-credit-bearing developmental courses before enrolling in introductory college mathematics courses. However, this model—known as prerequisite developmental education (DE)—has been shown to be generally ineffective, and in some cases to have a negative impact on student outcomes (Valentine et al., 2017). In recent years, the prerequisite model has gradually been replaced by corequisite DE that allows academically underprepared students to enroll directly in a college-level course while simultaneously receiving supplemental support. As of 2023, 77% of community colleges around the country offered corequisites (Litschwartz et al., 2023). Evidence shows that corequisite DE leads to better college outcomes relative to prerequisite DE among students who are near college readiness thresholds (e.g., Logue et al., 2019).
One underexamined question about the corequisite model concerns its cost when implemented at scale. The only existing study to address this (of which we are aware) estimates that corequisite DE in mathematics costs about twice as much per student as prerequisite DE (Belfield et al., 2016). 1 This higher cost is largely driven by the fact that more students take college-level mathematics under the corequisite model than under the prerequisite model. Students referred to DE under the corequisite model are enrolled concurrently in a college-level mathematics course, whereas students taking prerequisite DE experience a high level of attrition and a majority never enroll in a college-level course (Jaggars & Stacey, 2014). However, since the corequisite model is shown to be more effective in helping students pass introductory college mathematics, corequisite DE has been shown to cost half as much per successful student compared with the prerequisite model (Belfield et al., 2016).
Our study adds to this research in at least two ways. First, corequisite DE is not monolithic. Although various corequisite models share a basic feature—students take college-level courses and receive supplemental support at the same time—they vary in support structure, instructor assignment, and student composition (Miller et al., 2022). 2 Existing cost estimates are based on the mathematics corequisite model implemented in Tennessee community colleges, but our study focuses on community colleges in the Kentucky Community and Technical College System (KCTCS), which fully transitioned to its mathematics corequisite model in fall 2019. We describe the KCTCS model in the next section, but as an example of how corequisite models vary, mathematics remediation takes three credit hours per week in Tennessee and just 1 to 2 hours per week in Kentucky.
Second, our study uses comprehensive administrative data from all 16 KCTCS colleges to estimate the cost of the corequisite model. As detailed in the data section, we use data that link individual students, the corequisite and college-level courses they took, the number of credits for each course, the instructors of those courses, and the instructors’ compensation (salaries and benefits) to accurately calculate direct instructional costs. In addition, we use fiscal expenditure data that include department and operational function codes to account for noninstructional costs. Although our approach is not as detailed as the “ingredients” approach (which typically relies on interviews for cost information), our coverage is systemwide, including all 16 community colleges throughout the state. As a result, our cost estimates can capture variation across community colleges. Our method also reduces data inaccuracies often found in retrospective interviews, in which respondents may struggle to recall details from a few years ago. 3
In this study, we focus on how much it costs to reach the immediate goal of DE: supporting academically underprepared students to pass introductory college mathematics courses. Completion of these courses is required to graduate for college students enrolled in degree programs, and it has been a major roadblock to college completion. With this in mind, DE has two cost components regardless of how it is provided: efforts dedicated to pre-college-level learning and introductory college-level courses.
Compared to the estimated costs reported for Tennessee in Belfield et al. (2016), our estimated costs for corequisite courses in Kentucky are slightly higher and our estimated costs for college-level mathematics courses are slightly lower (after adjusting for differences in price levels across states and over time). We also found the corequisite model in Kentucky to be more cost-effective than the prerequisite model, due to the fact that the corequisite model is more effective at getting students to enroll in and pass college-level mathematics courses.
In the sections that follow, we describe KCTCS’s corequisite model, as well as the data and methodology used to estimate the per-student credit hour cost of providing mathematics DE. We then present our findings and discuss the results.
KCTCS’s Corequisite Model
To understand the implementation of corequisite DE in KCTCS, we conducted document reviews and semi-structured virtual interviews with 2 faculty members in each of the 16 KCTCS colleges. These faculty members represented their colleges on KCTCS’s Mathematics Curriculum Committee and Transitional Mathematics Committee.
Under KCTCS’s corequisite model, supplemental support is delivered through corequisite courses that are paired with college-level mathematics courses (although some instructors use lab-based instruction, sometimes exclusively, instead of lectures). Students taking corequisite courses receive additional support from teaching assistants in the college-level course as well as out-of-class support delivered through KCTCS’s Academic Center for Excellence (ACE) tutoring services. ACE services are typically located in libraries, are free of charge, and are available both by appointment and on a walk-in basis. Students taking corequisite courses also have access to online tutoring support via NetTutor in Blackboard. Both ACE and NetTutor are existing academic resources that are not limited to assisting mathematics corequisite students.
Mathematics corequisite courses are delivered both in person and online. In both formats, the class size is typically limited to 30, although it is often much smaller, particularly in in-person classes. In some colleges, paired college-level mathematics courses include students who are ready for college-level instruction and students who are not ready (without a predetermined target student mix ratio); in other colleges, students who are not ready for college-level instruction take separate sections of the same college-level course. A typical college mathematics course meets twice a week, whereas a paired corequisite course meets once or twice a week. The corequisite class meets either right before the paired college-level mathematics class or on alternate days, with each session lasting 50 minutes. In most cases, paired courses are taught concurrently for 16 weeks. In some cases, the corequisite course is shorter, lasting just 12 weeks, and may start several weeks before or after the paired college-level mathematics course. On rare occasions, instructors offer a 2-week bootcamp for students who are not adequately prepared, with an opportunity at the end to test out of corequisite requirements (using, e.g., the EdReady assessment). In most cases, the same instructor is responsible for both the corequisite and the paired college-level mathematics courses. However, instructors could be different for paired courses in some cases, especially when enrollment is small.
Interviews with KCTCS mathematics faculty suggested that the costs for supporting the transition from prerequisite to corequisite DE were likely minimal. Corequisite mathematics–related professional development was limited. Existing professional development hours were used occasionally to discuss corequisite DE. The annual Kentucky Mathematical Association of 2-year Colleges conference provided another venue to exchange ideas and experiences about corequisite DE, but not every faculty member attended those conferences. Systematic developmental mathematics curriculum redesign also was limited. Corequisite courses were used to provide whatever support students needed to succeed in the paired college-level mathematics course. In many cases, students learned at their own pace in corequisite mathematics courses. For example, corequisite classes that met immediately before the paired college-level course were often used to address questions from the previous class and preview the upcoming college-level class. Finally, existing services (such as ACE and NetTutor) and systems (such as the Virtual Schedule Builder, KCTCS’s course registration system) were repurposed to support corequisite students with little change.
Although corequisite DE has been implemented systemwide since the 2019–20 school year, prerequisite DE has remained an option for KCTCS students who start college with mathematics skills that are far below the level required by their fields of study. For example, students pursuing an associate in science degree in medical sonography are required to take college algebra, which requires an ACT mathematics score of 22 or a high school GPA of 3.2. Students who just miss either benchmark would be placed in college algebra corequisite. Students with ACT mathematic scores below 19 and high school GPAs lower than 3.0 would have to enroll in prerequisite courses. However, for students in degree programs that do not require college algebra (such as computer and information technologies), those who are in the lowest proficiency group could take corequisite for courses like applied statistics. In short, enrollment in prerequisite or corequisite DE depends on students’ college major choices and initial mathematics skills. Empirically, Xu and Backes (2025) report that about 90% of the developmental mathematics courses undertaken by students who just missed the college algebra readiness benchmarks were corequisites and, for students in the lowest proficiency group, 60% of the developmental mathematics courses they took were prerequisites in 2019–20 and 2020–21.
Methods
We rely on administrative data to estimate the costs of helping underprepared students pass introductory mathematics courses. This differs from the “ingredients” approach that is often used in cost studies. The ingredients approach has clear strengths. It is a systematic, well-tested method for identifying the comprehensive costs of implementing intervention services. It tracks the costs corresponding to the specific resources used across intervention activities and accounts for costs that are often inadequately identified in budget or expenditure data, such as those associated with contributed (in-kind) resources or shared between the intervention and other operational activities (Cost Analysis Standards Project, 2021).
In our setting, accurately estimating costs using the ingredients approach proves challenging due to its reliance on interviews for retrospective cost information. Similar to Belfield et al. (2016), we interviewed mathematics faculty members who were familiar with corequisite DE from each of the 16 KCTCS colleges in Fall 2023 and collected cost information. Interviewees were also asked to complete a pre-interview worksheet designed to collect faculty members’ time allocation for the previous school year by function (e.g., direct instruction, indirect instruction, administration, etc.) and the share of function-specific time devoted to mathematics corequisite courses, support staff’s time allocation, and non-personnel spending on mathematics corequisite courses. Although interviewees were generally able to provide information on the time and cost of activities they were directly involved in, they were not confident about departmentwide activities. Interviewees also struggled to estimate the portion of common supports available to all students that were used specifically by mathematics DE students (e.g., walk-in office hours, tutoring labs). For these reasons, we decided not to rely on interview data and use administrative records instead.
Using administrative records to estimate program costs allows us to more accurately and comprehensively account for direct instructional costs across all 16 community colleges in the state than applying the ingredients approach to a sample of colleges. The tradeoff is that administrative data may be less adequate in identifying indirect costs associated with student support and administration than the ingredients approach (especially in terms of mapping costs to the individual departments delivering the mathematics courses that are the focus of our analysis). In this section, we describe the data sources, the methods used for cost estimation, and the limitations of our approach.
Data Sources
Our work uses administrative data covering the 2019–20 and 2020–21 academic years from three sources. Figure 1 provides a simple diagram of how the three data sources are used in conjunction to make cost calculations. Our first source is staffing data provided by KCTCS. These merge compensation information from the Human Resources Department with course section assignment data collected by the Office of Research and Policy Analysis using employee IDs. Merged data are at the course section level and include detailed course information—such as uniform course code, section number, semester (fall, spring or summer), instruction mode (in-person, online, or hybrid), credit hours, and section enrollment—for all six semesters of the study period (the 2019–20 and 2020–21 academic years). Information on specific instructors assigned to each course section includes their classification (full time or part time), salaries, and benefit rate. For full-time instructors, overall monthly salaries are provided, which are mostly constant across all assigned course sections taught within the same semester and college. The overall monthly salaries for full-time instructors can be prorated over the sum of the credit hours that make up their teaching loads. For part-time instructors, course section–specific salaries are directly recorded. A benefit rate that is fixed across all course sections is also reported for each instructor, and it is used to calculate the benefit portion of total instructor compensation.
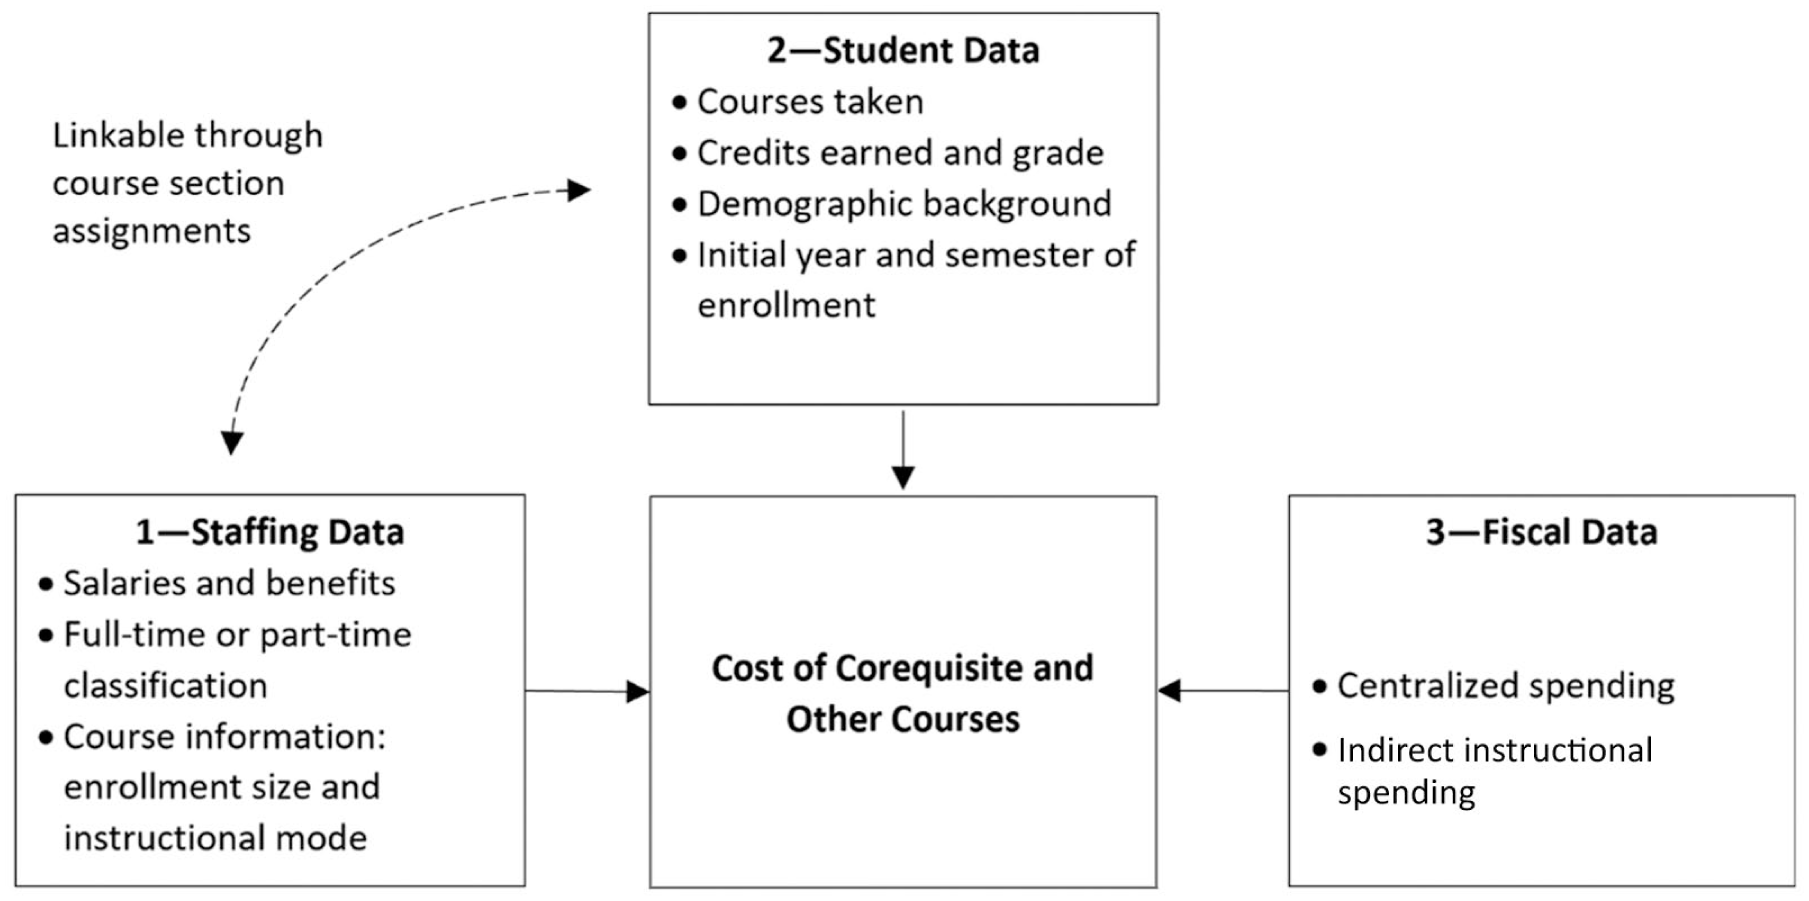
Illustration of data sources used to derive course costs.
The second data source includes extant student-level administrative data from the Kentucky Center for Statistics (KYStats). KYStats is a data repository of linked education and workforce data for the state. At the secondary level, student records include information on background characteristics (race, gender, home language, subsidized lunch status). At the postsecondary level, data include the initial year and semester enrolled in a degree-earning program, the field and program of study (if declared), each course taken, grades and credits earned, and credential attainment at 2- and 4-year institutions within the state. The student data identify course sections using the same uniform codes as the staffing data, which allowed the linking of student outcomes and performance on any specific course section with the instructor teaching the course section and their compensation.
The third data source contains college-level fiscal data collected by KCTCS Financial Services for all colleges within KCTCS, organized by account, program, and department codes. The account code denotes what was purchased under the expenditure (e.g., salaries and wages, benefits). The program code represents the purpose or function accomplished by the disbursement (e.g., instruction, public service, student services). Finally, the department code lists under which organizational unit the expense was incurred. These codes can be used to calculate the indirect cost, that is, the operational expenses associated with delivering precollege and college-level mathematics courses above and beyond the direct instructional costs captured using KCTCS staffing data (described above).
Cost Estimation
The total cost of delivering instructional services has two major components: direct instructional costs and indirect costs. We define direct instructional costs as all personnel expenses related to providing course instruction to enrolled students. We define indirect costs as both personnel and non-personnel expenses incurred to provide all other indirect instructional support, pupil support, and administration that make up the day-to-day operation and management of colleges.
To calculate direct instructional costs, we first applied the benefit rate (
For full-time instructors, compensation (salary and benefits) was reported as monthly rates that did not vary across courses taught by the same instructor within the same semester and college. To derive compensation associated with a particular course, the monthly compensation was prorated based on the proportion of credit hours assigned to that course relative to the total credit hours they taught during the semester at a given college. By comparison, no prorating was necessary for part-time instructors because their monthly compensation was already reported on a course-specific basis.
Course section-specific monthly compensation was multiplied by the number of months each course section ran (

To estimate the indirect costs associated with delivering the four types of mathematics courses, we first identified the operational cost for each college (

This method makes two assumptions. First, it assumes that the indirect-to-direct cost ratio is constant across all courses offered by a college. Because community colleges offer a wide variety of courses ranging from barber studies to radiology and the composition of courses across colleges varies, this assumption is likely too strong. However, it is impossible to estimate how much instructional support each course requires with the available data, and it is unclear in which direction this assumption will bias the indirect cost estimates. Second, our method assumes that salaries and benefits reported under the instruction expense category include compensation for classroom instructors only. However, as defined in IPEDS, the instruction expense category could also include expenses for functions like departmental research, public service, and information technology related to instructional activities. 4 Staff compensation associated with these functions will inflate the actual direct instructional cost, resulting in downward bias in the indirect-to-direct cost ratio.
Lastly, we made two adjustments to the cost estimates. First, we presented the costs in 2019–20 dollars by inflation adjusting (deflating) costs calculated for the 2020–21 year. 5 We then adjusted for regional variation in the price of hiring and retaining staff across counties in Kentucky using the Comparable Wage Index for Teachers (CWIFT), centering the cost around the state average wage. 6 The final estimated per-student credit hour costs are used in conjunction with the average number of credits by course type and the expected “throughput” to calculate the per-student costs for taking and passing the college-level mathematics courses, which we describe in the next section.
Cost Effectiveness
To conduct a cost effectiveness analysis, we measured effectiveness descriptively as the difference in the observed passing rates of college-level mathematics courses between students who were enrolled in corequisite and prerequisite mathematics courses. For students enrolled in corequisite courses, the passing rate of college-level mathematics was measured by the end of their first year in college. For students enrolled in prerequisite courses, the passing rate was measured by the end of their second year in college. The rationale behind the longer observation window for prerequisite students is that these students, by design, would not have access to college-level mathematics courses until they completed the prerequisites. By comparison, corequisite students could access college-level courses immediately. Allowing a longer observation window can better align the amount of time students had to demonstrate success in college-level mathematics. However, by using the 2-year “throughput” for prerequisite students, our approach may have overcompensated for the time needed for prerequisite students to complete a gateway mathematics course. As a result, the estimated cost effectiveness of corequisite DE relative to prerequisite DE represents the lower bound.
After calculating the passing rates of college-level mathematics under corequisite and prerequisite DE models, cost-effectiveness was estimated as the average cost per student successfully completing a college-level course (i.e., dividing per-student cost of the typical corequisite or prerequisite course by the corresponding observed pass rate). We then estimated the efficiency gain from switching from the prerequisite to the corequisite DE by calculating the reduction in cost per successful student as a percentage of the cost per successful student under the prerequisite model.
As described above, students with lower initial proficiency in mathematics were more likely to enroll in prerequisite courses, whereas students with higher initial proficiency were more likely to enroll in corequisite courses during the study period (2019–20 and 2020–21). This suggests that the passing rates of college-level mathematics courses among prerequisite students are not appropriate counterfactuals for corequisite students. Because corequisite students had higher initial mathematics skills, it is plausible that they might have achieved higher passing rates in college-level mathematics courses had they been required to undertake prerequisite DE than the observed passing rates among students who actually enrolled in prerequisite courses. To mitigate this challenge, we estimated the passing rates of college-level mathematics for prerequisite students using data from 2017–18 and 2018–19, a period before corequisite DE became implemented systemwide. However, even with data borrowed from earlier years, the efficiency gain estimated using observed differences in passing rates will still be overestimated because students close to college readiness in mathematics were overrepresented in corequisite DE.
To investigate the extent of the bias in our cost-effectiveness estimate, we ideally should estimate the causal impact of corequisite DE relative to prerequisite. Although predetermined placement benchmarks may appear to be conducive to a regression discontinuity design, the treatment-comparison contrast around the cutoff is not always clear due to the interplay between college major choices and students’ initial skills in mathematics. For example, there are corequisite students on both sides of the ACT cutoff of 19 (college algebra corequisite students above the cutoff and applied statistics corequisite students below the cutoff). Students just above the cutoff also include those taking applied statistics without DE, and students just below the cutoff also include those taking prerequisite college algebra. Teasing out all these nuances is beyond the scope of the current study. Instead, we assess the sensitivity of our descriptive cost-effectiveness estimates by compiling a range of impact estimates from the empirical literature that uses experimental or quasi-experimental methods. We then project the passing rates for corequisite students had they been assigned to prerequisite courses by subtracting the published impact estimates from the passing rates observed among corequisite students in our data. The cost-effectiveness of corequisite DE, in the form of percentage reduction in the average cost per successful student, was then recalculated using the projected passing rate under prerequisite DE and the observed passing rate under corequisite DE.
Summary of Study Limitations
The study has some notable limitations. The lack of reliable interview data precluded us from using the ingredients approach to cost analysis, and the study’s reliance on administrative data necessitated extrapolation of indirect costs using simplified assumptions. The complexity of KCTCS’s mathematics placement policy also prevented us from estimating the effectiveness of corequisite DE relative to prerequisite DE rigorously. In addition, the study years coincided with the COVID19 pandemic, and the generalizability of study findings is likely limited by the unique circumstances brought about by the pandemic.
Furthermore, one might question the outcomes considered as lacking alignment with the larger goals of community college education such as completing a degree or subsequent higher returns in the labor market. Passing an introductory college-level mathematics course is considered a key early momentum metric (Belfield et al., 2019), but it is not a strong predictor of college completion on its own. Nevertheless, there is substantial value placed on completing an introductory college-level mathematics course. Raising the percentage of KCTCS students who complete an introductory college mathematics course is an explicit goal set by the Council on Postsecondary Education in Kentucky (Council on Postsecondary Education, 2019), and many community college systems award additional funding to institutions for each student who achieves this outcome. 7
Findings
The student population in community colleges is diverse, and there are some notable differences between students enrolled in corequisite mathematics courses and the overall student population in KCTCS colleges (Table 1). For example, students taking corequisite mathematics courses in 2020–21 were more likely to be female (64% vs. 58%), economically disadvantaged (75% vs. 67%), and enrolled full time (75% vs. 50%). A higher percentage of courses taken by corequisite students were taught by full-time instructors than the overall percentage of courses taught by full-time instructors (88% vs. 72%). It is also notable that the percentage of courses that were taught online or as a hybrid increased for both student samples from 2019–20 to 2020–21, likely reflecting the impact of the COVID-19 pandemic, with the increase being more pronounced in the corequisite student sample (from 44% to 74% for all students and from 36% to 82% for corequisite students).
Mean of Student and Course Characteristics, by Year and Student Type.
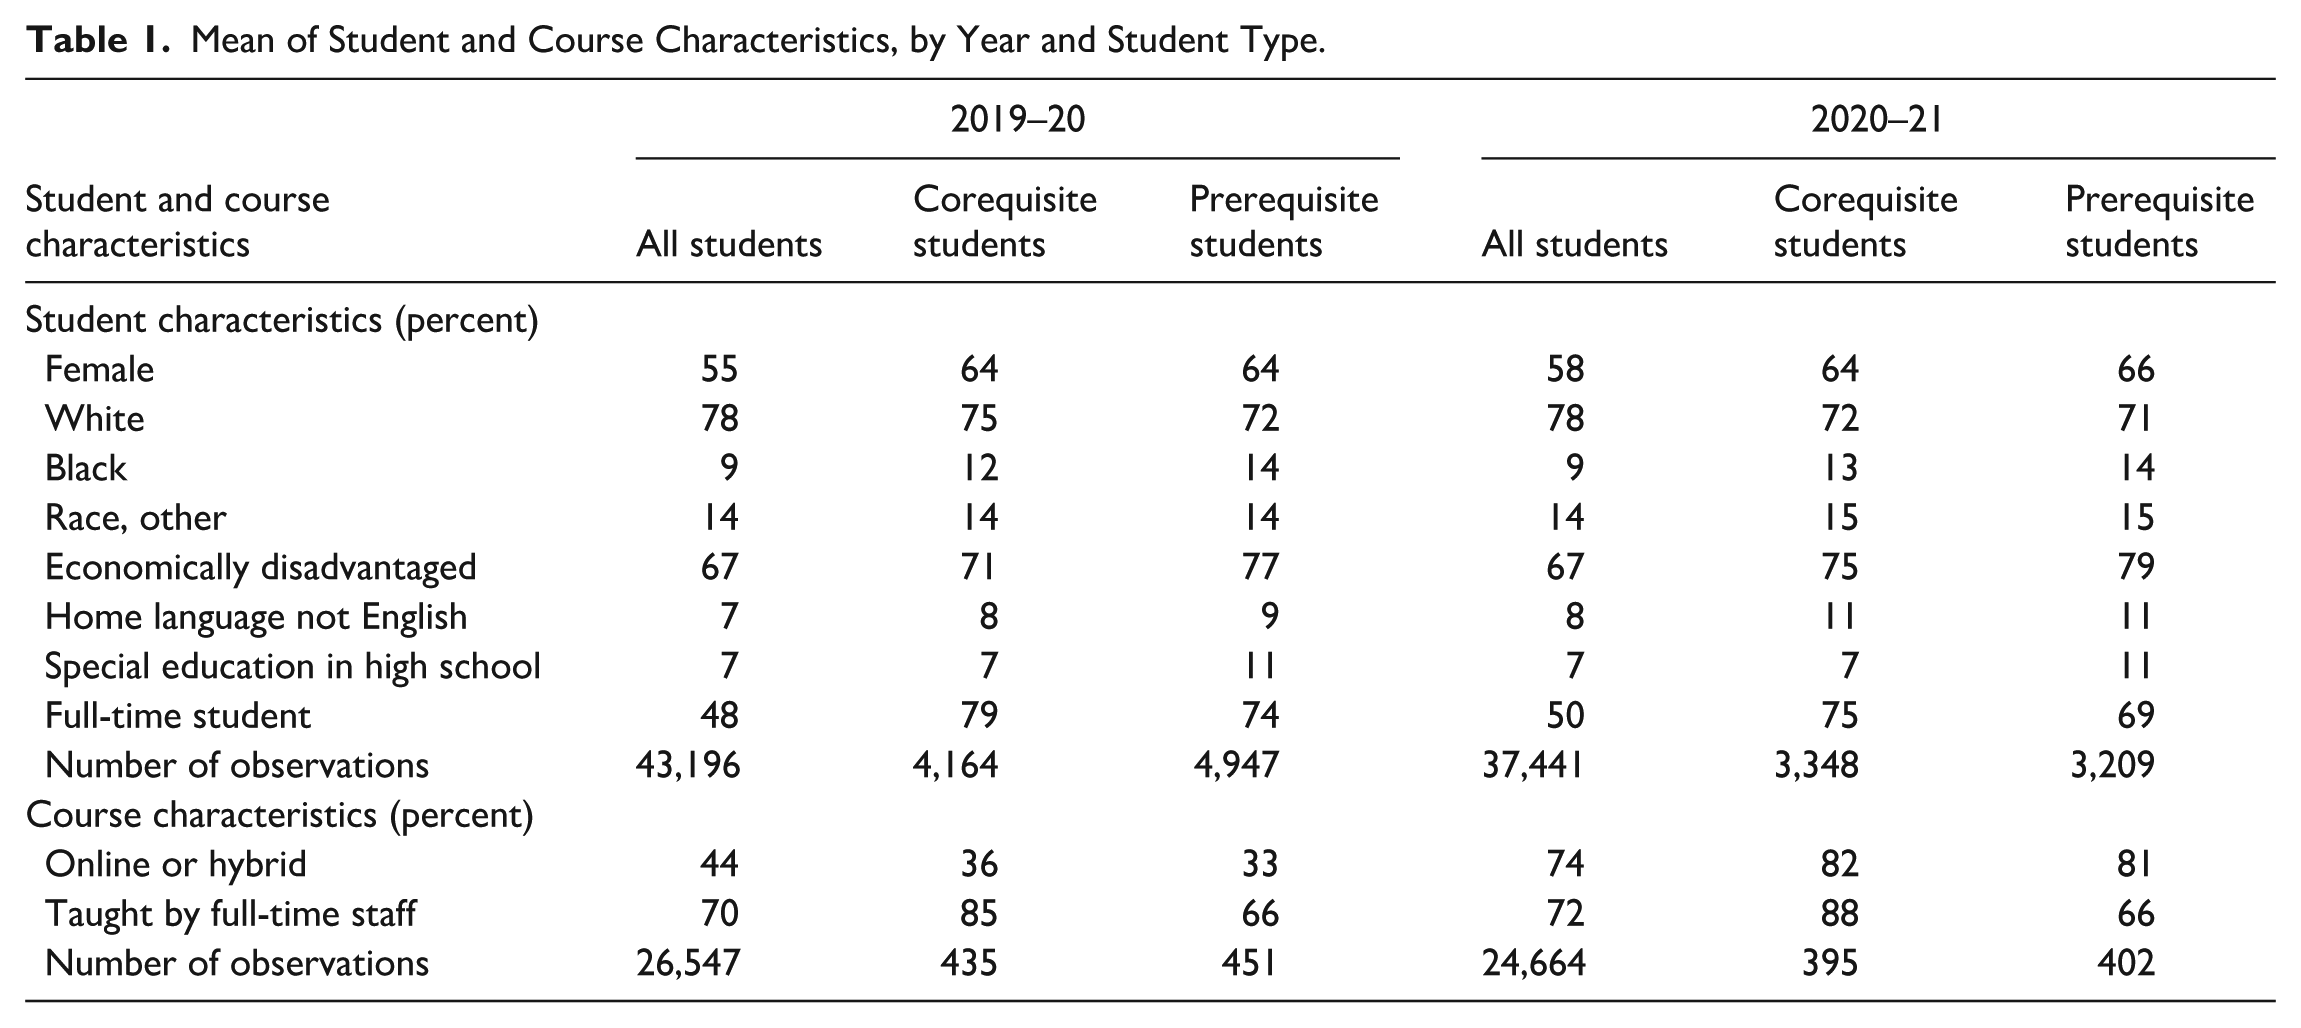
We also report the population characteristics of students enrolled in prerequisite mathematics courses in years 2019–20 to 2020–21 in Table 1 to highlight differences between students enrolled in corequisite and prerequisite courses. Students enrolled in prerequisite courses are more likely to be economically disadvantaged, to have been assigned to special education in high school, to be enrolled part-time, and to be taught by part-time instructors than students in corequisite courses. These differences are consistent with KCTCS’ placement policy, which requires only students with the lowest initial proficiency to take prerequisite courses. As discussed in the methods section earlier, because students taking prerequisite courses after the introduction of the corequisite model are no longer representative of the developmental student population, we believe students enrolled in prerequisite courses before the adoption of corequisites (i.e., school years 2017–18 and 2018–19) are the more appropriate comparison group for the effectiveness of the corequisite model.
Because the impact of the pandemic may lead to variation in direct instructional and indirect costs, the per-student credit hour costs averaged across colleges are presented for each academic year in the first six columns of Table 2. Within each year, the per-student credit hour costs are reported by cost and course types. The average total costs per student credit hour are reported in the last column of the table.
Per-Student Credit Hour Costs (in 2019–20 Dollars), by School Year, Cost Type, and Course Type.
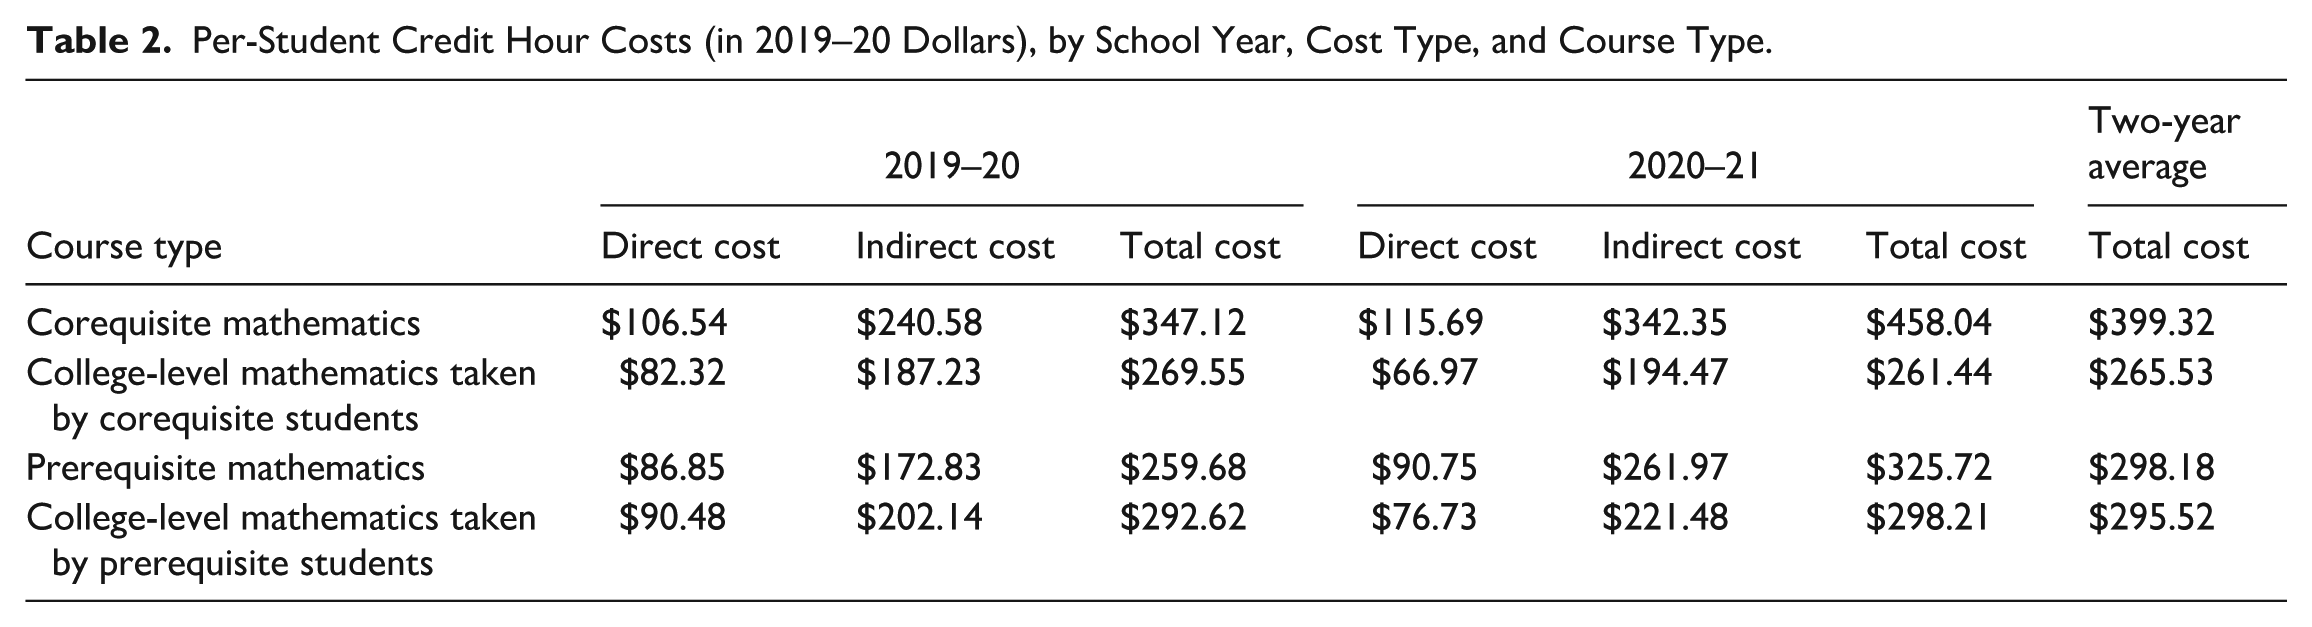
The indirect costs for all course types increased over time, with increases ranging from 4% to 10% for college-level mathematics courses to 42% to 52% for corequisite and prerequisite mathematics courses. One potential explanation for the rising indirect costs is a 13% year-over-year drop in college enrollment from 2019–20 to 2020–21. Because inputs used to support college operations that make up the indirect costs could not adjust immediately to enrollment declines, this may have put upward pressure on per-student credit hour indirect costs. It is also possible that the operational costs may have increased due to expenses related to health protocols and the transition to remote learning that were necessitated by the pandemic.
By comparison, the direct costs increased by only 4% to 9% for corequisite and prerequisite mathematics courses and decreased by 15% to 19% for college-level mathematics during the same period. The reason why direct costs did not uniformly increase along with indirect costs is that, while the overall enrollment dropped, average class size tended to increase, possibly reflecting the expansion of online instruction. Specifically, the average class size increased by less than 1 student for both types of developmental mathematics courses and by 5.4 students for college-level mathematics courses.
Combining both direct and indirect costs, the 2-year average total cost for delivering instruction for corequisite mathematics courses is $399 in 2019–20 dollars per student credit hour. This is much higher than the per-student credit hour costs for prerequisite mathematics courses ($298), college-level mathematics courses taken by corequisite students ($266), and college-level mathematics courses taken students who successfully completed a prerequisite course ($296). Two important drivers of this cost difference are course staffing and structure. Compared to corequisite sections, prerequisite sections are more likely to be taught by part-time teachers, who are typically paid slightly more per section than full-time teachers. However, this higher per-section cost is reversed when the cost is spread across the larger per-section enrollment and credit hours associated with prerequisite sections. Compared to costs estimated using data from Tennessee community colleges (Belfield et al., 2016), after adjusting for differences in price levels across states and over time, our estimates are 22% higher for corequisite courses and 2% higher for prerequisite courses, but 27% lower for college-level courses taken by corequisite students and 16% lower for college-level courses taken by students who successfully completed a prerequisite course.
The average per-student credit hour costs mask variation across colleges and years (Table 3). For example, although the average cost for corequisite mathematics courses is just under $400, they would cost less than $225 ($399.32 – $175.04, i.e., subtracting 1 standard deviation from the mean) per student credit hour among the least costly one third of the college years and more than $575 ($399.32 + $175.04, i.e., adding 1 standard deviation to the mean) among the most expensive one third of the college years. Based on the coefficient of variation (calculated as the ratio of the estimated standard deviation and the mean), the costs for precollege mathematics courses tend to vary more than the costs for college-level mathematics. Because the cost estimates have been adjusted for regional differences in living costs, the observed variation in costs is likely driven by the enrollment size and average class size of the college.
Variation in Per-Student Credit Hour Costs (in 2019–20 Dollars) Across Colleges and Years, by Course Type.
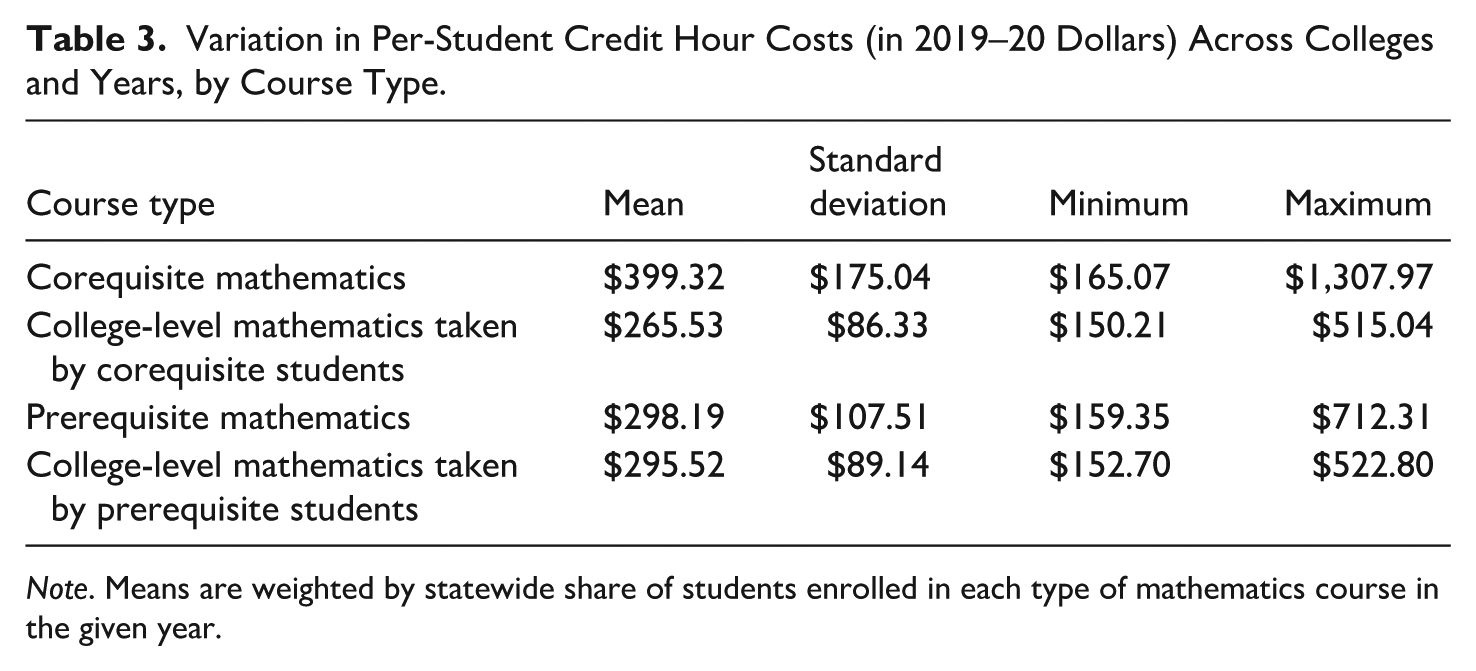
Note. Means are weighted by statewide share of students enrolled in each type of mathematics course in the given year.
Using student data collected by KYStats, we calculate and compare the cost-effectiveness of corequisite and prerequisite DE in Table 4. The first row redisplays the estimated per-student credit hour instructional costs by DE model and course type presented in Table 2. The second row shows the average number of credit hours that a typical student took by DE model and course type. For example, students who participated in corequisite DE took an average of 1.8 credit hours of developmental mathematics, whereas students who participated in prerequisite DE took an average of 3.5 credit hours of developmental mathematics. Under both DE models, students who enrolled in college-level mathematics courses typically took about three credit hours of college mathematics.
Cost-Effectiveness of Corequisite and Prerequisite DE Models.
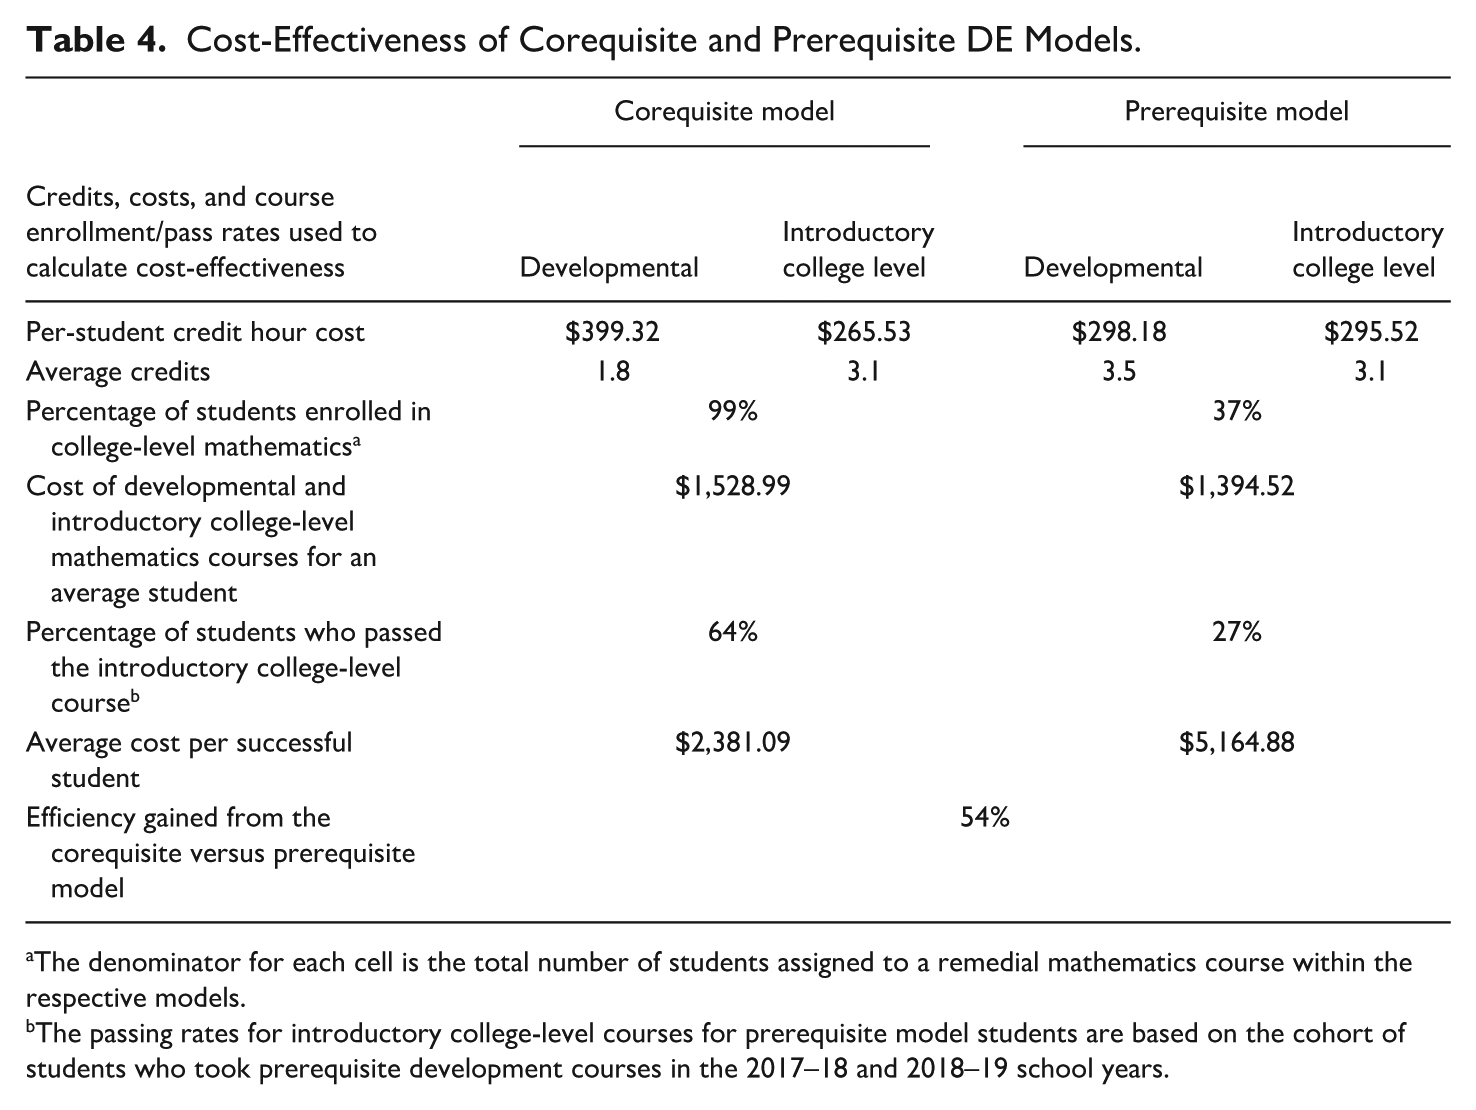
The denominator for each cell is the total number of students assigned to a remedial mathematics course within the respective models.
The passing rates for introductory college-level courses for prerequisite model students are based on the cohort of students who took prerequisite development courses in the 2017–18 and 2018–19 school years.
By design, nearly all students (99%) who took corequisite mathematics courses also took college-level mathematics courses (Row 3). In contrast, only 37% of students who started in prerequisite mathematics courses went on to take college-level mathematics courses. The total cost for an average student to reach college-level mathematics—the sum of the costs for precollege and college-level courses, weighted by the likelihood that a student enrolls in college-level courses—is about $1,529 under corequisite DE and $1,395 under prerequisite DE (Row 4). These two figures are similar because the higher cost associated with enrolling a higher percentage of corequisite students in college-level mathematics courses is balanced out by the higher cost associated with more credit hours of developmental courses under the prerequisite model.
However, among students who started in developmental mathematics courses, 64% successfully completed college-level mathematics courses under corequisite DE, compared to 27% under prerequisite DE (Row 5). The gap in observed passing rates of college-level mathematics courses (37 percentage points) between the two DE models is similar to the gap (39 percentage points) reported among Tennessee community college students (Belfield et al., 2016). Factoring in the probability of passing college-level mathematics (dividing Row 4 by Row 5), the estimated cost per successful student is $2,381 under corequisite DE and $5,165 under prerequisite DE. In other words, the corequisite DE model is 54% less costly in helping underprepared students pass a college-level mathematics course. This is comparable to the efficiency gain (50%) estimated in Belfield et al. (2016) using Tennessee data.
As discussed in the methods section, the passing rate of college-level mathematics courses among students who participated in prerequisite DE is not a rigorous counterfactual for students enrolled in corequisite DE. As a result, the estimated efficiency gain is likely upwardly biased. Previous research suggests that the estimated causal impact of corequisite DE relative to prerequisite DE on introductory college mathematics course completion ranges between 0.18 and 0.38 (Logue et al., 2016; Meiselman & Schudde, 2022; Ran & Lin, 2022). Among three frequently cited studies, Logue et al. (2016) is a randomized controlled trial conducted in the City University of New York (CUNY), whereas Meiselman and Schudde (2022) and Ran and Lin (2022) are regression discontinuity (RD) studies conducted in Texas and Tennessee, respectively. Another important distinction among the three studies is that the CUNY and Texas studies were conducted among a small number of community colleges that offered corequisite DE voluntarily, and as a result their estimated impacts may not scale to a setting where corequisite DE is mandatory statewide. By contrast, the Tennessee study was conducted after the state implemented corequisite DE systemwide, and so its impact estimate is likely more applicable to the context of our study.
The first column of Table 5 displays the estimated impact of corequisite DE. Because we are interested in the passing rates of college-level mathematics courses among students who enrolled in (and were not just assigned to) developmental mathematics courses, we use the treatment on the treated (TOT) effects instead of the intent-to-treat (ITT) effects reported in the RD studies. Subtracting the estimated impacts from the observed passing rate of college-level mathematics courses among corequisite students (64%) in our sample yields the extrapolated counterfactual: the projected passing rates for corequisite students had they participated in prerequisite DE (Column 2). For example, using the impact estimate from Tennessee, 40% of corequisite students in our study are projected to pass college-level mathematics courses by the end of the second year in college if they enrolled in prerequisite DE.
Average Cost Per Successful Student and Efficiency Gain Projected Using Published Causal Impact of Corequisite DE Relative to Prerequisite DE.
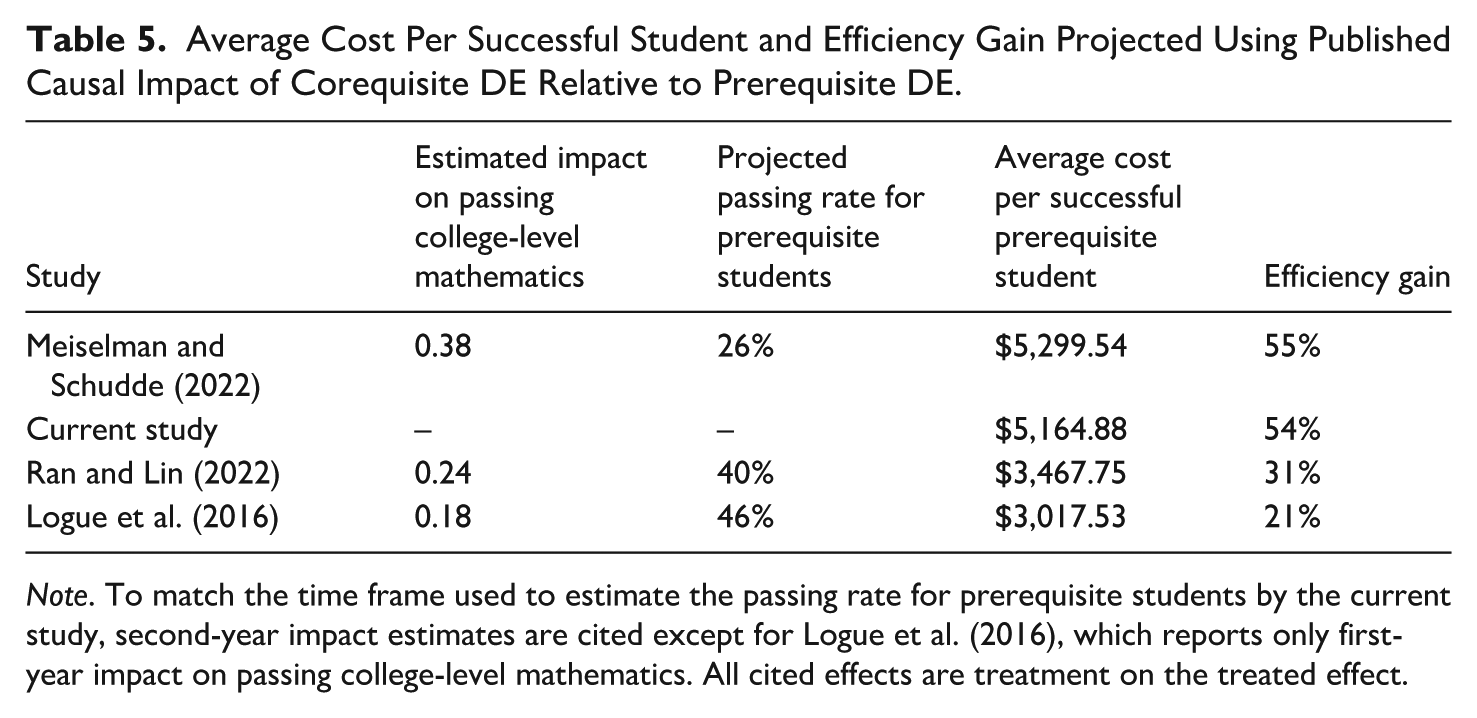
Note. To match the time frame used to estimate the passing rate for prerequisite students by the current study, second-year impact estimates are cited except for Logue et al. (2016), which reports only first-year impact on passing college-level mathematics. All cited effects are treatment on the treated effect.
The total cost for an average student to reach college-level mathematics under prerequisite DE ($1,395 from Table 4) is then divided by the projected passing rates to estimate the per-successful-student costs under the prerequisite model (Column 3, Table 5). Compared to these cost estimates, corequisite DE is about 21% to 55% less costly in helping underprepared students pass a college-level mathematics course. The efficiency gain estimated using observational data (54%) is within this range. However, it is higher than the efficiency gain extrapolated based on the impact estimate from Tennessee (50%), a setting that is the most comparable to that for the current study.
Conclusion
Our study is only the second known cost analysis of a corequisite DE model implemented statewide. Although the settings and methodologies differ, our results are largely consistent with those observed in Tennessee (Belfield et al., 2016) despite the differences in settings and methodologies. Estimates from both Kentucky and Tennessee suggest that even though corequisite DE is more costly than prerequisite DE, it is at least 50% more cost-effective in helping underprepared students to succeed in college-level mathematics. These results support continued investment in, and refinement of, corequisite models as a scalable solution to improve mathematics outcomes while maintaining fiscal responsibility.
While corequisite DE is more cost-effective than prerequisite DE in helping students pass gateway mathematics courses, it is not costless. Emerging evidence from Tennessee suggests that corequisite DE is no more effective than directly enrolling students in college-level courses without any developmental requirements (Ran & Lin, 2022). This raises the question of whether resources allocated to corequisite DE should be redeployed to more productive educational inputs and support programs. For example, the Accelerated Study in Associate Programs (ASAP) implemented by CUNY has demonstrated great success, nearly doubling the graduation rates within 3 years after the experiment started (Azurdia & Galkin, 2020). ASAP, however, requires spending nearly $14,000 more per student compared to business as usual over an 8-year period.
Even when we compare corequisite with prerequisite DE, it is important to consider what outcomes we should focus on. A nuanced discussion is needed because evidence of the impact of corequisite DE (relative to prerequisite DE) on outcomes other than passing college-level courses in mathematics (or English for that matter) is mixed at best. For example, no study except for Logue et al. (2019) has found any significant positive effect on college graduation rate when comparing corequisite DE to prerequisite DE. Although passing college-level courses is often a direct policy goal and a metric used by many community college systems in their institutional funding formulas, it is an intermediate outcome and a weak predictor of college completion by itself. For more important goals like college completion, it is likely that shifting from prerequisite DE to corequisite DE will produce no efficiency gains.
Footnotes
Acknowledgements
We thank Shauna King-Simms from the Kentucky Community and Technical College System (KCTCS) for the pivotal role she played in making this study possible. We are grateful for the support and insights from Anjanette Buckler, Buddy Combs, Alicia Crouch, Alan Lawson II, Kris Williams, and the members of the Mathematics Curriculum Committee and the Transitional Mathematics Committee from KCTCS. We thank Barrett Ross from KYStats for providing the administrative data and Adam Hearn from the American Institutes for Research for assistance in analyzing the fiscal expenditure data.

Funding
The authors disclosed receipt of the following financial support for the research, authorship, and/or publication of this article: This material is based upon work supported by the National Science Foundation under Grant Number 2200895. Any opinions, findings, and conclusions or recommendations expressed in this material are those of the author(s) and do not necessarily reflect the views of the National Science Foundation.
Declaration of Conflicting Interests
The authors declared no potential conflicts of interest with respect to the research, authorship, and/or publication of this article.