
Abstract
This meta-analysis examined whether training improves detection of deception. Overall, 30 studies (22 published and 8 unpublished; control-group design) resulted in a small to medium training effect for detection accuracy (k = 30, gu = 0.331) and for lie accuracy (k = 11, gu = 0.422), but not for truth accuracy (k = 11, gu = 0.060). If participants were guided by cues to detect the truth, rather than to detect deception, only truth accuracy was increased. Moderator analyses revealed larger training effects if the training was based on verbal content cues, whereas feedback, nonverbal and paraverbal, or multichannel cue training had only small effects. Type of training, duration, mode of instruction, and publication status were also important moderators. Recommendations for designing, conducting, and reporting training studies are discussed.
Detecting deception can be a difficult task and neither lay persons nor professionals show an impressive ability to correctly differentiate deceptive and true statements in strangers (Bond & DePaulo, 2006; Vrij, 2008). Several researchers and practitioners tried to improve this ability through different training approaches (Frank & Feeley, 2003). The aim of the following meta-analysis was to (a) quantitatively assess the extent to which training improves the ability to detect deception and (b) determine the characteristics of the training protocol that may be most effective in improving detection accuracy. To this end, the role of several moderator variables on training effects will be investigated. Guidelines for creating new training methods and for improving already existing training programs are derived from the results. Finally, standards for designing and reporting experimental training studies are recommended.
Human Judges’ Deception Detection Accuracy
Previous findings show that the ability of lay persons to correctly distinguish between deceptive and true stories is only slightly better than flipping a coin. The meta-analysis by Aamodt and Custer (2006) yielded an average detection accuracy of 54.22% (k = 156). Bond and DePaulo’s (2006) large-scale meta-analysis with 206 studies reported a weighted average detection accuracy of 53.46%, which was slightly above chance level.
Regardless of overall accuracy, Bond and DePaulo found that judges rated more accounts as truthful (55.23%) than as lies (44.77%), confirming the well-known “truth bias” (Zuckerman, Koestner, Colella, & Alton, 1984). By implication, a truth bias leads to higher accuracy for detecting true stories (truth accuracy) than lies (lie accuracy), given an equal number of lies and truths to be judged.
Unweighted analyses by Bond and DePaulo (2006) supported this relation by finding a truth accuracy of 61.34% compared with a lower lie accuracy of 47.55%. This relation is referred to as the “veracity effect” (Levine, Park, & McCornack, 1999). A response bias shift may occur if a training program directs judges to look for lie or truth criteria, respectively, thus inducing a lie or truth bias.
While a truth bias is prevalent among lay judges, a lie bias may also occur under some conditions. For example, Meissner and Kassin (2002) showed that training or experience as police/parole officers or social workers was associated with a lie bias (“investigator bias”). Using signal detection theory, they showed that neither experience (k = 4) nor training (k = 2) led to better discrimination ability, but to a lie bias. However, other authors found no evidence for such a lie bias (e.g., McCornack & Levine, 1990; see the overview in Burgoon & Levine, 2009). This inconsistency in findings could be due to the use of different experimental designs, research paradigms, or participant samples (e.g., police vs. students).
Furthermore, detection accuracy is not better for professionals expected to have lie detection experience (e.g., police investigators, detectives, psychologists, or judges). Aamodt and Custer’s (2006) meta-analysis suggested no relationships between detection accuracy and experience (k = 13, r = −.08, corresponding to d = −0.16) or education (k = 4, r = .03, d = 0.06). Average detection accuracy for professional lie catchers (55.51%) did not significantly differ from that of lay persons (54.22%). In the meta-analysis by Bond and DePaulo (2006), experts did not significantly outperform lay persons (k = 20, d = −0.03).
Given such discouraging findings, researchers and practitioners have tried to develop training programs to improve the ability to detect deception.
Overview of Training Studies and Their Theoretical Underpinnings
This review focuses on training approaches that involved (a) feedback on participants’ judgments of truth and deception, (b) nonverbal and paraverbal cues, (c) verbal content cues, and (d) combinations of (a) to (c).
Feedback Training
Several authors attempted to improve detection of deception by providing feedback after judgments (e.g., Elaad, 2003; Porter, McCabe, Woodworth, & Peace, 2007). Why would the feedback approach work? From a theoretical perspective, the most relevant answer comes from the “law of effect” proposed by Thorndike (1913, 1927): Positive feedback is equated with reinforcement and negative feedback with punishment. Both types of feedback should have positive effects on performance because positive feedback reinforces correct behavior and negative feedback punishes incorrect behavior. Applied to the detection of deception training context, the law of effect would predict greater detection accuracy if a correct judgment is followed by positive feedback (e.g., “Your judgment was correct”), or if an incorrect judgment is followed by negative feedback (e.g., “Your judgment was incorrect”).
From an empirical perspective, Kluger and DeNisi’s (1996) large-scale meta-analysis on training feedback on different kinds of performance found that, on average, feedback has a moderate positive effect on performance (k = 607, d = 0.41), though effect sizes were quite heterogeneous.
Porter, Woodworth, and Birt (2000) proposed two possible mechanisms why feedback could lead to improved detection accuracy. First, feedback may lead participants “to detect (consciously or unconsciously) valid cues to deception and modify their decision-making accordingly” (p. 655). Second, feedback implies a social demand factor for making “more careful judgments” (Porter et al., 2000, p. 655), in that participants may be motivated due to increased pressure to perform better. To discover which mechanism is more likely to work, Porter et al. (2007) compared a bogus (inaccurate) feedback with an accurate feedback condition (see also Zuckerman, Koestner, & Alton, 1984). Unfortunately, neither accurate nor inaccurate feedback improved detection accuracy.
An extension of the mere feedback approach is to link information about and use of specific deception cues (see next section) with feedback about the accuracy of a given judgment (e.g., Fiedler & Walka, 1993).
In sum, we hypothesized different types of feedback to improve performance. In the following sections, we discuss training judges to use different types of cues that are thought to be associated with deception.
Nonverbal and Paraverbal Cues Training
All training studies including nonverbal or paraverbal cues share the assumption that senders show systematic differences when lying or telling the truth with respect to these behaviors. While some authors subsume vocal expressions under nonverbal behaviors, we use the term nonverbal referring only to visual cues, subsuming vocal expressions under “paraverbal” behavior (also called “paralanguage,” “prosodic,” or “vocalics”).
Three meta-analyses showed only a few reliable differences of these cues in deceptive versus true stories, all small in magnitude (DePaulo, Lindsay, Malone, Muhlenbruck, Charlton, & Cooper, 2003; Sporer & Schwandt, 2006, 2007). For example, Sporer and Schwandt (2007) found a decrease in nodding (k = 9, d = −0.18), in hand and finger movements (k = 5, d = −0.38), and in leg and foot movements (k = 15, d = −0.14) for liars, whereas DePaulo et al. (2003) observed an increase in adaptors (k = 14, d = 0.16) and a decrease of illustrators (k = 16, d = −0.14) for liars. Concerning paraverbal behaviors, two meta-analyses found a significant positive effect size for liars’ voice pitch (DePaulo et al., 2003: k = 12, d = 0.21; Sporer & Schwandt, 2006: k = 7, d = −0.18). Furthermore, DePaulo et al. found an increase in repetitions (k = 4, d = 0.21), and Sporer and Schwandt (2006) observed an increase in response latency for liars (k = 18, d = 0.21). Despite their significance, these effect sizes were small and varied widely across studies. Some of the differences between these meta-analyses are due to the operationalizations used and the inclusion/exclusion of different studies.
In addition, there are several theoretical approaches (e.g., Zuckerman, DePaulo, & Rosenthal, 1981) leading to different, and at times, contradictory predictions for particular behaviors (see DePaulo et al., 2003; Sporer & Schwandt, 2006, 2007, for an overview). For example, the arousal approach as well as the emotion-fear approach predicts an increase of head movements with deception, whereas the emotion-guilt approach, the attempted control approach, and the cognitive load/working memory model assume a decrease with deception (Sporer & Schwandt, 2007). Individual training studies justify their choice of cues trained with these different theoretical backgrounds or with an idiosyncratic selection of previous findings. Consequently, different training programs taught either nonverbal cues only (e.g., Vrij, 1994), a combination of nonverbal and paraverbal cues (e.g., DePaulo, Lassiter, & Stone, 1982), or compared these two (e.g., DePaulo et al., 1982). More problematically, some training programs actually instructed participants to look for increases in certain behaviors that were actually negatively related to deception according to these later meta-analyses mentioned.
Because of the small effect sizes for the validity of nonverbal and paraverbal cues, effectiveness of training approaches using such cues is predicted to be low overall.
Verbal Content Cues Training
Few training approaches have focused solely on the verbal content of statements. Three approaches provide support for the hypothesis that senders’ speech content would systematically differ when telling the truth than when lying. First, Undeutsch (1967) stated that statements based on memory of real experiences differ in quality and quantity from invented and false statements. Steller and Köhnken (1989) developed a list of 19 reality criteria, referred to as criteria-based content analysis (CBCA), which integrated criteria described by Arntzen (1970, 1983), Dettenborn, Froehlich, and Szewczyk (1984), Sporer (1983), Szewczyk (1973), and Undeutsch (1967). True statements are believed to contain more of these criteria than false statements. For example, if a statement is logically structured, includes many details, for example, of conversations, the statement is more likely to be true. CBCA is only a part of statement validity analysis (SVA), which is a comprehensive approach including different methods of collecting and analyzing data to assess the credibility of statements (Steller & Köhnken, 1989). Although the validity of various CBCA criteria has been experimentally tested in numerous studies (see Vrij, 2005), there are only a few training studies yet (e.g., Akehurst, Bull, Vrij, & Köhnken, 2004; Landry & Brigham, 1992).
Empirical evidence for the validity of the CBCA criteria comes from Vrij’s (2005) vote-counting review and from DePaulo et al.’s (2003) meta-analysis. Vote-counting refers to a simple tallying of significant positive, significant negative, and null findings. Vote-counting has been criticized as being an inadequate method of meta-analysis because it neither takes sample sizes nor the magnitude of observed effects (i.e., their effect sizes) into account (Hedges & Olkin, 1985; see also Sporer & Cohn, 2011). In their meta-analysis, DePaulo et al. found support for some of the CBCA criteria. Truth-tellers’ accounts include more details (k = 24, d = −0.30) and more spontaneous corrections (k = 5, d = −0.29), are more logically structured (k = 6, d = −0.25), and participants admitted a lack of memory more frequently (k = 5, d = −0.42). Note, however, that DePaulo et al. used only a very small portion of the literature (k = 5 or 6).
Second, Johnson and Raye (1981) developed the reality monitoring (RM) approach which assumes that people rely on qualitative characteristics, such as sensory, contextual, semantic, and emotional information, when deciding whether one’s own memory is based upon an actual event (external) or not (internal). This assumption has been extended to interpersonal RM, that is, judging the reality of other people’s memories (Mitchell & Johnson, 2000; Sporer, 1997; Sporer & Sharman, 2006) including the detection of deception (for reviews, see Masip, Sporer, Garrido, & Herrero, 2005; Sporer, 2004). DePaulo et al.’s (2003) meta-analysis reported a nonsignificant tendency that sensory information was more frequently present in true accounts compared with lies (k = 4, d = −0.17). In addition, in summarizing results from RM studies from Vrij and colleagues, Sporer (2004) reported positive effect sizes for visual details, sound details, and spatial, temporal, and affective information ranging from d = 0.43 to d = 1.46, and both a positive (d = 0.85, in Vrij, Edward, Roberts, & Bull, 2000) and a negative (d = −0.41, in Vrij, Akehurst, Soukara, & Bull, 2004) effect size for cognitive operations (e.g., associations, reflections, decision processes).
Third, several studies used combinations of selected CBCA and RM criteria (e.g., Sporer & Bursch, 1996; Sporer & McCrimmon, 1997; Sporer & McFadyen, 2001). Sporer (1998, 2004) theoretically and empirically combined the CBCA and the RM approach on the basis of factor analyses and laid a theoretical foundation from research on autobiographical memory, impression management, and attribution theory resulting in a comprehensive set of truth criteria referred to as the Aberdeen Report Judgment Scales (ARJS; Sporer, 1998, 2004). A few training studies by Sporer and his colleagues using the ARJS have been conducted (e.g., Sporer, Samweber, & Stucke, 2000).
Other researchers trained their participants with different methods involving different types of verbal content analysis (see Colwell et al., 2009; deTurck, Feeley, & Roman, 1997; Santarcangelo, Cribbie, & Ebesu Hubbard, 2004). Finally, some researchers applied a mixture of nonverbal, paraverbal, and verbal content cues, for example, using the Reid Technique (Blair, 2009; Kassin & Fong, 1999) and other techniques (Hendershot, 1981).
We did not include studies that used specific computer programs, such as the Linguistic Inquiry and Word Count (Newman, Pennebaker, Berry, & Richards, 2003; Zhou, Burgoon, Nunamaker, & Twitchell, 2004) to find linguistic cues to deception because they did not involve training human raters (for a recent meta-analysis on these cues, see Hauch, Blandón-Gitlin, Masip, & Sporer, 2013).
We predict that training programs using verbal content cues yield the largest training effects compared with multichannel cues or feedback due to the larger effect sizes of the cues trained.
Previous Meta-Analyses of Training Studies
Although two previous meta-analyses on training to detect deception have been published, we identified important methodological issues that lead us to call into question the reliability of their findings. Frank and Feeley (2003) summarized 11 published studies with 20 hypothesis tests, missing several relevant studies already available at the time. In addition, the authors did not consider an important statistical problem of dependent effect sizes (Gleser & Olkin, 1994, 2009; Lipsey & Wilson, 2001): Studies with multiple training groups and only one control group were treated as if they were independent. This led to an overrepresentation of control groups, which apparently were used repeatedly for comparison. Thus, the weighted average effect size reported (r = .20, d = 0.41), with a heterogeneous effect size distribution, is likely an overestimate of the population parameter and an underestimate of its variability.
While Driskell’s (2012) 1 attempt to update Frank and Feeley’s (2003) meta-analysis is more comprehensive, including 16 published studies, it did not cover 13 relevant published and unpublished studies, nor 8 studies using other experimental designs. Consequently, our synthesis not only covers a larger set of studies and experimental designs but also reduces a potential publication bias by making a special attempt to include unpublished studies (most of which are conference presentations).
Driskell’s meta-analysis contains similar methodological problems as Frank and Feeley’s although the author seems to be aware of them. In his synthesis, Driskell found a weighted average training effect of d = 0.50 in 16 published training studies (from 1984 to 2006) with 30 hypothesis tests. Our synthesis included 30 studies with a total of 55 hypothesis tests. 2 While Driskell did note the problem of dependent effect sizes in a footnote (p. 728, Note 3), calculating an average effect size for 16 studies by pooling across the different comparisons does not solve this problem. Using the same control group repeatedly is likely to have led to an overestimation of the mean training effect size (see our Discussion). Last but not least, Driskell did not analyze lie and truth accuracy separately. This differentiation is important because an overall improvement in detection accuracy does not necessarily mean that both abilities—correctly classifying lies and truths—are improved. Therefore, a meta-analysis on training to detect deception should consider at least three dependent variables, namely, overall detection accuracy, lie accuracy, and truth accuracy.
Here we present a new meta-analysis with a substantially larger number of studies that addresses the methodological issues noted and updates the current state of knowledge on deception detection training. We also address the issue of publication bias by using newer statistical methods borrowed from the medical literature (Rothstein, Sutton, & Borenstein, 2005; Sutton, 2009), which are explained in the Method and Results section.
Designs of Training Studies to Be Included
Training studies involve several phases. The first phase is to obtain true or false statements from senders. In one paradigm, senders are asked to tell their true or false opinions, attitudes, or feelings about a particular theme, a film, or a person. Alternatively, they are instructed to tell a true or false story about a self-experienced event or about a mock crime they either did or did not commit. In the second phase, other participants, referred to as judges or receivers, are either randomly assigned to the experimental (training) and control condition (true experiment) or nonrandomly (quasi-experiment, see Campbell & Stanley, 1963). Then, a set of statements of the senders is either presented audiovisually, visually, or as a written transcript, and judged regarding their truthfulness.
Moreover, a training study can be assessed in three different designs (Campbell & Stanley, 1963; see Table 1). The first is referred to as posttest only with control (POWC; see Carlson & Schmidt, 1999) design and implies a training and a control group, each measured only once. The second is referred to as one-group pretest-posttest (OGPP) design and consists of at least one training group measured before and after training. The third is referred to as pretest-posttest with control (PPWC; see Carlson & Schmidt, 1999) design and includes an experimental and a control group both tested before and after training. Lipsey and Wilson (2001) suggested that studies with these different experimental designs should not be aggregated into a single meta-analysis, because different effect size measures are used that should be interpreted separately (POWC: comparison of control vs. training group; OGPP: comparison of pretest vs. posttest; PPWC: comparison of pre- and posttest changes in trained vs. control group). Therefore, different study designs were investigated in separate meta-analyses.
Different Designs of Training Studies.
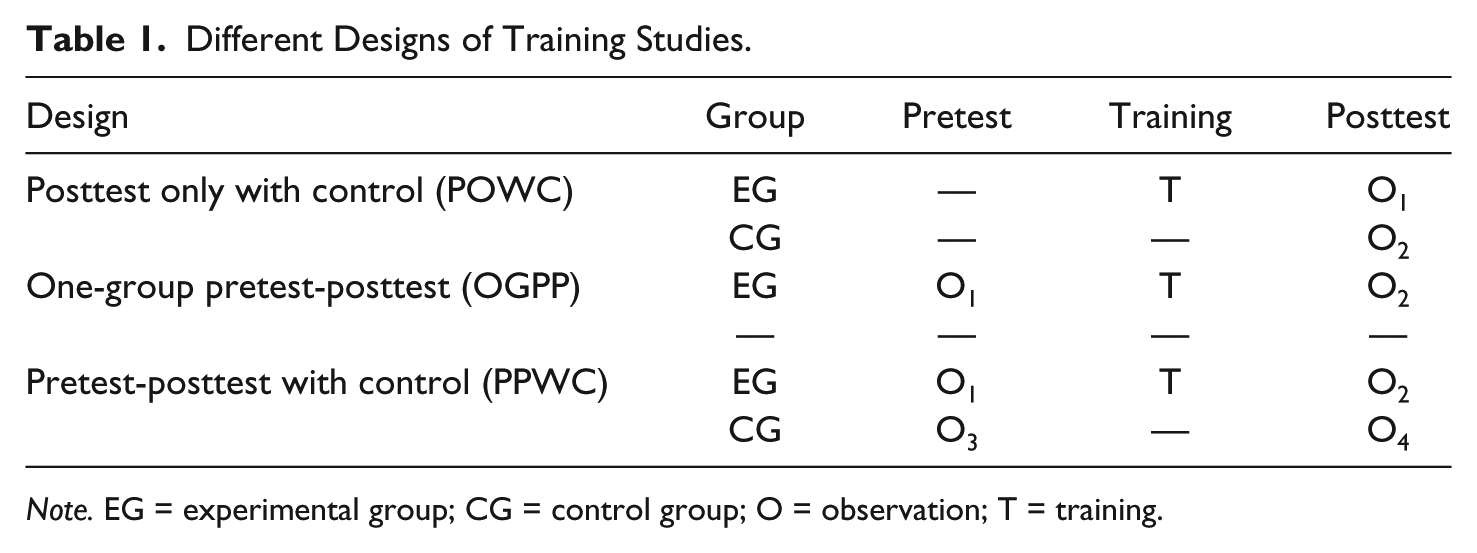
Note. EG = experimental group; CG = control group; O = observation; T = training.
Main Hypotheses
An underlying assumption is that training people or giving feedback on any task aims to improve a particular ability (Patrick, 1992). Therefore, we expected to find an overall positive training effect regarding detection accuracy, as well as for lie and truth accuracy.
Hypotheses for Potential Moderator Variables
In a meta-analysis, a moderator may account for systematic variability between studies (Hedges & Olkin, 1985; Lipsey & Wilson, 2001). Studies differ with respect to a range of independent variables, some of which could have an indirect relationship with training effects. A priori hypotheses with theoretical or empirical background rather than post hoc tests were developed for moderator variables to produce a higher level of certainty for the interpretation of the results (Wood & Eagly, 2009).
Training Category
The training category (nonverbal and paraverbal cues, verbal content cues, and feedback) was assumed to moderate effect sizes. Thus, training with verbal content cues was hypothesized to have stronger training effects on detection accuracy compared with the other training categories, because verbal content cues are more strongly related to deception/truthfulness compared with nonverbal or paraverbal cues (DePaulo et al., 2003; Sporer, 2004; Sporer & Schwandt, 2006, 2007; Vrij, 2005). Studies using a feedback paradigm were also expected to lead to a positive (but small) training effect due to Thorndike’s (1913, 1927) “law of effect.” In addition, we expected a negative training effect when studies utilized a bogus feedback paradigm.
Purpose of the Training
As discussed above, a truth bias in judgment has been revealed for lay persons (e.g., Bond & DePaulo, 2006), whereas an “investigator bias” or lie bias was found for professional lie catchers (Meissner & Kassin, 2002). In relation to training, Masip, Alonso, Garrido, and Herrero (2009) demonstrated that the particular purpose of a specific training, that is, focusing on either cues to deception or cues to truthfulness biased participants’ responses toward deception or truth, respectively. Therefore, it was expected that training programs using cues to deception would lead to higher lie accuracy for trained compared with untrained persons. In contrast, training programs with the aim to detect the truth would lead to higher truth accuracy.
Intensity of Training
It was predicted that the intensity of the training is positively associated with a training effect. We defined training intensity as a conglomerate of five individual components analyzed as separate moderators: duration, presentation medium of cues to be learned (referred to as training medium), number of practice examples, group size, and trainer presence. Training intensity was expected to increase the longer the training session, and the higher the number of different media the training content was presented with (e.g., a combination of video-lecture, lecture, handwritten instructions). Providing practice examples, as opposed to no practice, smaller group sizes, and the presence of a trainer in person should also enhance training effects.
Senders’ Motivation
As a general hypothesis, from a self-presentational perspective (DePaulo, 1992), one would expect that more highly motivated liars and truth-tellers will make a stronger attempt to tell more compelling stories, be more cooperative, provide more details, and so forth (DePaulo et al., 2003; Sporer, 2004). When training focuses on verbal content cues, highly motivated story-tellers who actually experienced an event should provide more details, which are used as truth criteria in the CBCA and RM approach. Consequently, when training focuses on verbal content cues, discrimination should be better and training more effective.
On the other hand, DePaulo and Kirkendol (1989) proposed the motivational impairment effect, which predicts the opposite for nonverbal cues: If senders are more highly motivated to lie successfully, they try too hard to control their behavior, but, unable to do so, display more nonverbal cues to deception (DePaulo et al., 2003; Sporer & Schwandt, 2006, 2007). Thus, liars should actually be easier to detect by judges trained to look for these nonverbal cues. Motivation across studies varied as a function of monetary incentives or participation in a (mock) crime.
Story Content
Originally we had coded a large number of categories regarding the content of lies/truths that we recoded into three categories: (a) lies about attitudes (e.g., liking or disliking somebody or something), (b) lies about a personally experienced (significant) autobiographical life event (e.g., an operation), and (c) lies about an observed or staged event (e.g., a mock crime). With increasing involvement, more cues to deception may become discernible and make training more effective.
Design and Base Rate Information
First, we test whether within-participants designs are more sensitive to training effects than between-participants designs. Senders might show intraindividual differences when lying or telling the truth (Bond & DePaulo, 2008; DePaulo & Morris, 2004; Köhnken, 1989). If judges have the opportunity to evaluate both deceptive and true stories of the same sender, they should be better in their discrimination performance, because they have two behavioral excerpts of a person. Thus, we expected a higher training effect for within-participants than between-participants designs.
Second, in some studies, trainers or researchers informed their participants on the actual lie/truth ratio (the base rate) beforehand. If judges knew this base rate (usually 50%; with the exception of DePaulo et al., 1982, who used a base rate of 67%), the training effect was expected to be higher than if they did not know it due to the fact that they might not be inclined toward a truth bias or a lie bias.
Research Group
Different groups of researchers may differ regarding the effectiveness of training for reasons not documented in their reports. Different research groups may have used different types of stimulus material. Two issues need to be distinguished: (a) If studies differ in difficulty level of stimulus material, this should only affect training effects as main effects (except in case of floor or ceiling effects). One could analyze for this by using overall (or control group) accuracy as a continuous predictor in a meta-regression, but we have opted against this for space reasons. (b) A more serious problem arises if the choice of stimulus material interacts with training effectiveness (by leading to an improvement for one type of training over another).
No specific hypotheses are possible, but in case of differences, the type of training program or stimuli used by each laboratory should be scrutinized.
Publication Bias
Publication bias is related to the tendency of researchers to submit and for journals to be more likely to publish studies reporting significant results than those with nonsignificant results (Begg, 1994; Cooper, 2010; Rothstein et al., 2005; Sporer & Cohn, 2011). There is strong evidence for a publication bias in psychological treatment research (Lipsey & Wilson, 1993). It is hypothesized that published studies show stronger effects than unpublished ones. Furthermore, higher precision of estimates (i.e., smaller standard errors due to larger samples) should be negatively associated with the size of effects.
Method
Research Question and Dependent Variables
To study training effects on the ability to detect deception, three dependent variables were used: Overall detection accuracy was operationalized by the total number of correct judgments irrespective of truth status, divided by the total number of judgments made, multiplied by 100. Truth or lie accuracy was calculated by the number of correctly classified true/false statements, divided by the total number of true/false statements, multiplied by 100.
Inclusion and Exclusion Criteria
First, to be included, studies needed to be designed to investigate the effects of training or feedback on detection accuracy. Second, studies must have used one of the aforementioned designs: (a) POWC, (b) OGPP, or (c) PPWC. Third, studies had to report statistical data from which an effect size for detection accuracy could be derived. Fourth, participants must have judged both deceptive and true stories, whereby the actual truth status of the statement remained unknown to the participants (at least until the judgment was given). Studies in which any kind of technical tool or physiological measure (e.g., a polygraph) was used or taught to participants were excluded. In cases where the results of a specific data set were re-used or otherwise duplicated in more than one publication, we chose the publication that contained most information or with the highest peer-review journal status. A complete list of all excluded studies with the respective reasons for exclusion can be found in Appendix A.
Moreover, training studies could be constructed in one of two research paradigms. The first paradigm requires an approximately equal number of participants in the control and experimental conditions and a sample size larger than 10 participants in the OGPP design. Studies designed with the second paradigm include a relatively small number of trained participants (e.g., one to five “experts”) compared with a much larger number of untrained participants. Another difference between these designs is the much larger number of judgments made in this second paradigm. Only studies that utilized the first paradigm were included in the meta-analysis.
Literature Search
The first step to locate relevant studies was to search through the reference lists of relevant review articles (Bond & DePaulo, 2006; Bull, 1989, 2004; Frank & Feeley, 2003; Vrij, 2008). The first and third author read the abstracts or methods sections to evaluate the suitability according to the aforementioned criteria. Reference sections of these potential training or feedback studies were examined for further studies.
In a second step, computer-based searches of the Social Sciences Citation Index with the cited reference search procedure were conducted. In addition, PsycInfo, WorldCat, and Psyndex searches were conducted using combinations (with the Boolean connector AND) of the three keyword categories: training/feedback/improv*, detect*/credibility judg*, and deceit/decept*/truth. Repeated searches were conducted, searching for articles since 1980 until March 2009. A final search was conducted in February 2011, which located five further studies.
The third step was to execute a search with the internet searching tool Google Scholar using different combinations of all listed keywords. The first 20 sites of results were examined for relevant studies. The final step included sending emails to the authors of all potential training or feedback studies to request further unpublished or published articles or conference papers.
A total of 39 studies met the inclusion criteria: 31 POWC, 2 OGPP, and 6 PPWC studies with sufficient statistical data. Some studies included more than one hypothesis test, comparing more than one training group with a control group, which will be explained later.
Coding Scheme
Besides effect sizes, five groups of variables were coded: (a) general study characteristics, and information about (b) the judges, (c) the senders, (d) the training, and (e) the judgment procedure.
General study characteristics were year published, publication status (unpublished or published), and type of publication. We subdivided studies into six research groups by authors (deTurck/Feeley/Levine; Sporer et al.; Vrij et al.; Zuckerman et al.; and “other” deception researchers who only conducted one training study). Information about the judges included total sample size and ns for experimental and control groups), age, gender, and occupation. In addition, assignment to conditions (random vs. nonrandom) and the motivation to detect lies were coded (none; low: $1-$5, or short written instruction; medium: $6-$10 or long written instruction). Regarding information about senders, sample size, randomization, number, duration and type of stories (attitude/liking, personal autobiographical event, observed/staged event/mock crime), motivation to lie successfully (none; low to medium: $1-$50, or written instruction; high: crime), and design (between- or within-participants) were coded.
Information about the training were training category (feedback, multichannel, verbal content, combination), purpose (to detect lies or the truth), duration, training medium (written instruction or lecture or combination), number of examples, group size, trainer presence, and base rate information. Information about the judgment procedure were the medium in which stories of senders were presented and the number of judgments made.
Categories were later collapsed due to empty cells or too few studies in particular subcategories. Some continuous variables (e.g., training duration, examples, and group size) were recoded into categorical variables in order to conduct moderator analyses.
To code the dependent variables detection accuracy, lie accuracy, and truth accuracy, appropriate statistical values were coded (e.g., means and standard deviations) for each investigated experimental and control group, and/or ANOVA results (F, dfs, and p values) and/or t-values for pairwise comparisons between two groups.
Coding Procedure and Intercoder Reliability
Two independent coders (first and third author) coded all variables listed above for each study. The Coding Manual and Coding Protocol were first established in collaboration with the second author and iteratively refined. In order to train coders and establish reliability of the coding scheme, the coders first worked simultaneously through two studies. Then, the coders rated the POWC design studies in the aforementioned manner into an Excel spreadsheet. An agreement was defined as coding exactly the same value for a particular variable. All disagreements were resolved by the concordant decision of both coders.
Cohen’s kappa (Cohen, 1960) for categorical moderator variables that ranged from .71 to .95, and Pearson’s r for continuous variables from .73 to .90, were highly satisfactory (Orwin & Vevea, 2009).
Effect Size Estimates for POWC
An appropriate effect size for the POWC design is the standardized mean difference (usually referred to as Cohen’s d), where the mean of the control group is first subtracted from the mean of the experimental group and then divided by the pooled standard deviation. As this estimate slightly overestimates the population effect size for small sample sizes, d was adjusted with a correction factor, resulting in the unbiased estimate gu (Borenstein, 2009; Lipsey & Wilson, 2001).
Whenever possible, cell Ms, SDs, and ns were used for calculation. If studies reported other statistical measures, such as t-values, F values, p values, Z values, or F values with more than one degree of freedom (mean-square error method, Lipsey & Wilson, 2001), appropriate formulae were applied to calculate effect sizes (Borenstein, 2009). In cases where the comparison was reported simply as “nonsignificant,” gu = 0 was assumed.
Effect Size Estimates for OGPP
For studies using a training group tested both before and after training, we used the same formula as above for between-participants designs to calculate the standardized mean difference from means and standard deviations of pre- and posttest (dOGPP; Dunlap, Cortina, Vaslow, & Burke, 1996, Formula 1; Lipsey & Wilson, 2001). If means and standard deviations were not provided, no effect size could be calculated because the formula for repeated measures designs requires the correlation between pre- and posttest (Borenstein, 2009; Dunlap et al., 1996), which was not reported in any study.
Effect Size Estimates for PPWC
Because PPWC designed studies provide more data than POWC or OGPP designs, the “standardized mean change” was computed (see Morris, 2008, Formula 12). In this formula, the difference (change) between pre- and posttest scores of the control group is subtracted from the difference between the pre- and posttest scores of the training group. The result is divided by the pooled pre- and posttest standard deviations for both control and training group (Formula 13). In other words, the effect size dPPWC estimates the standardized difference between the pretest versus posttest changes of the training and the control group, respectively. Because this effect size is not directly comparable with the gu for the POWC or OGPP designs, results are reported separately.
Following the recommendations by Lipsey and Wilson (2001), the different effect size metrics from the three study designs were not combined in a single meta-analysis, but analyzed separately.
Statistically Dependent Effect Sizes
An important issue of this meta-analysis is that more than half of the included studies had conducted different training approaches with more than one trained group and only one control group. For each training group versus control group comparison, a separate effect size was computed. Because these comparisons (hypothesis tests) were always between several training groups and a single identical control group, these effect sizes are statistically dependent.
Meta-analyses are based on the requirement of independent data points as the unit of analysis (Lipsey & Wilson, 2001). Inclusion of dependent effect sizes incurs problems of inflated sample size, underestimation of standard error, and overrepresentation of studies with multiple effect sizes. Therefore, the average of these dependent effect sizes of a given study and the adjusted inverse variance weights were computed. Our first meta-analysis integrated these averaged effect sizes to test the overall training effect across all studies.
To investigate the more interesting question of the effectiveness of different types of training, separate (and thus independent) meta-analyses were subsequently conducted for eight different types of training, with specific training type versus control group comparisons (hypothesis tests) derived from all studies that involved the respective comparison: bogus feedback or training, feedback, nonverbal cues, paraverbal cues, nonverbal and paraverbal cues, nonverbal and paraverbal cues and feedback, verbal content cues, verbal content and nonverbal and paraverbal cues.
Meta-Analytic Procedures
Before integration of effect sizes, we tested for outliers by visual inspection of the distributions of individual effect sizes and their confidence intervals, as well as by a more sophisticated method that tests standardized residuals and homogeneity after removing any particular study as recommended by Hedges and Olkin (1985). According to this method, removal of an outlier significantly reduces the heterogeneity within a set of studies.
If these techniques revealed the same effect sizes as outliers, sensitivity analyses were conducted with and without these effect sizes (Greenhouse & Iyengar, 2009). The reason for conducting outlier analyses is that outliers in meta-analyses would make the calculation of a “mean effect size” meaningless (just as outliers distort correlation coefficients or multivariate analyses).
The weighted average effect size was calculated by weighting each individual effect size (gu) by the inverse of its variance (Lipsey & Wilson, 2001). The fixed effects model was applied, which assumes that all individual effect sizes estimate the same fixed population parameter. 3 Heterogeneity tests were calculated yielding the Q statistic, which approximates a chi-square distribution with k − 1 df (Lipsey & Wilson, 2001). As an additional indicator of heterogeneity, the descriptive statistic I2 was used to indicate the proportion of total variation of effect sizes that is due to heterogeneity (Higgins & Thompson, 2002; Shadish & Haddock, 2009). As a rule of thumb, an I2 value of 25% is considered to indicate small heterogeneity, 50% medium heterogeneity, and 75% large heterogeneity.
Meta-Analytic Procedure for OGPP and PPWC Studies
To compute the OGPP and PPWC studies’ variance, the correlation between pretest and posttest measures (see Dunlap et al., 1996; Morris, 2008) is needed, which none of the studies reported. Hence, no mean effect size weighted by inverse variance weights could be computed. Instead, we calculated the unweighted mean and a mean effect size weighted by sample sizes as a tentative estimate.
Publication Bias
Publication bias is addressed both via graphical and statistical methods (Sutton, 2009). A funnel plot is presented to show an overview of the distribution of effect sizes plotted against the inverse of the standard error (Sterne, Becker, & Egger, 2005). It is assumed that results from studies with smaller sample sizes are more widely spread around the mean effect size because of larger random error (Sutton, Duval, Tweedie, Abrams, & Jones, 2000). Thus, the shape of the distribution should look like a symmetric funnel if no publication bias is present. As an additional test of publication bias, we compared results of published and unpublished studies, using publication status as a moderator.
Computer Software
For computing individual effect sizes, variances, weights, and standard errors, all formulae were programmed in Excel spreadsheets programmed in Microsoft Office Excel (2003) by the second author and cross-checked by the first author. Calculations of meta-analyses were conducted using both Excel spreadsheets and SPSS 20 for Mac, using the macros provided by Wilson (2010).
Results
Study Characteristics
The frequencies and descriptive statistics of continuous variables are displayed in Table 2. A total of 30 POWC 4 designed studies were located, of which 8 were unpublished (including 2 master’s theses, a doctoral dissertation, an unpublished manuscript, and 4 conference presentations) and 22 published articles. They were conducted between 1981 and 2011. Judges were randomly assigned to experimental conditions in 20 studies; 10 studies did not report the mode of assignment. All but one study provided information about the occupation of the judges, 86.2% being students, 3.4% trainees, and 10.3% police or parole officers. In four studies, participants received some incentives to successfully detect deception and the truth.
Frequencies and Descriptive Statistics of Continuous Variables.
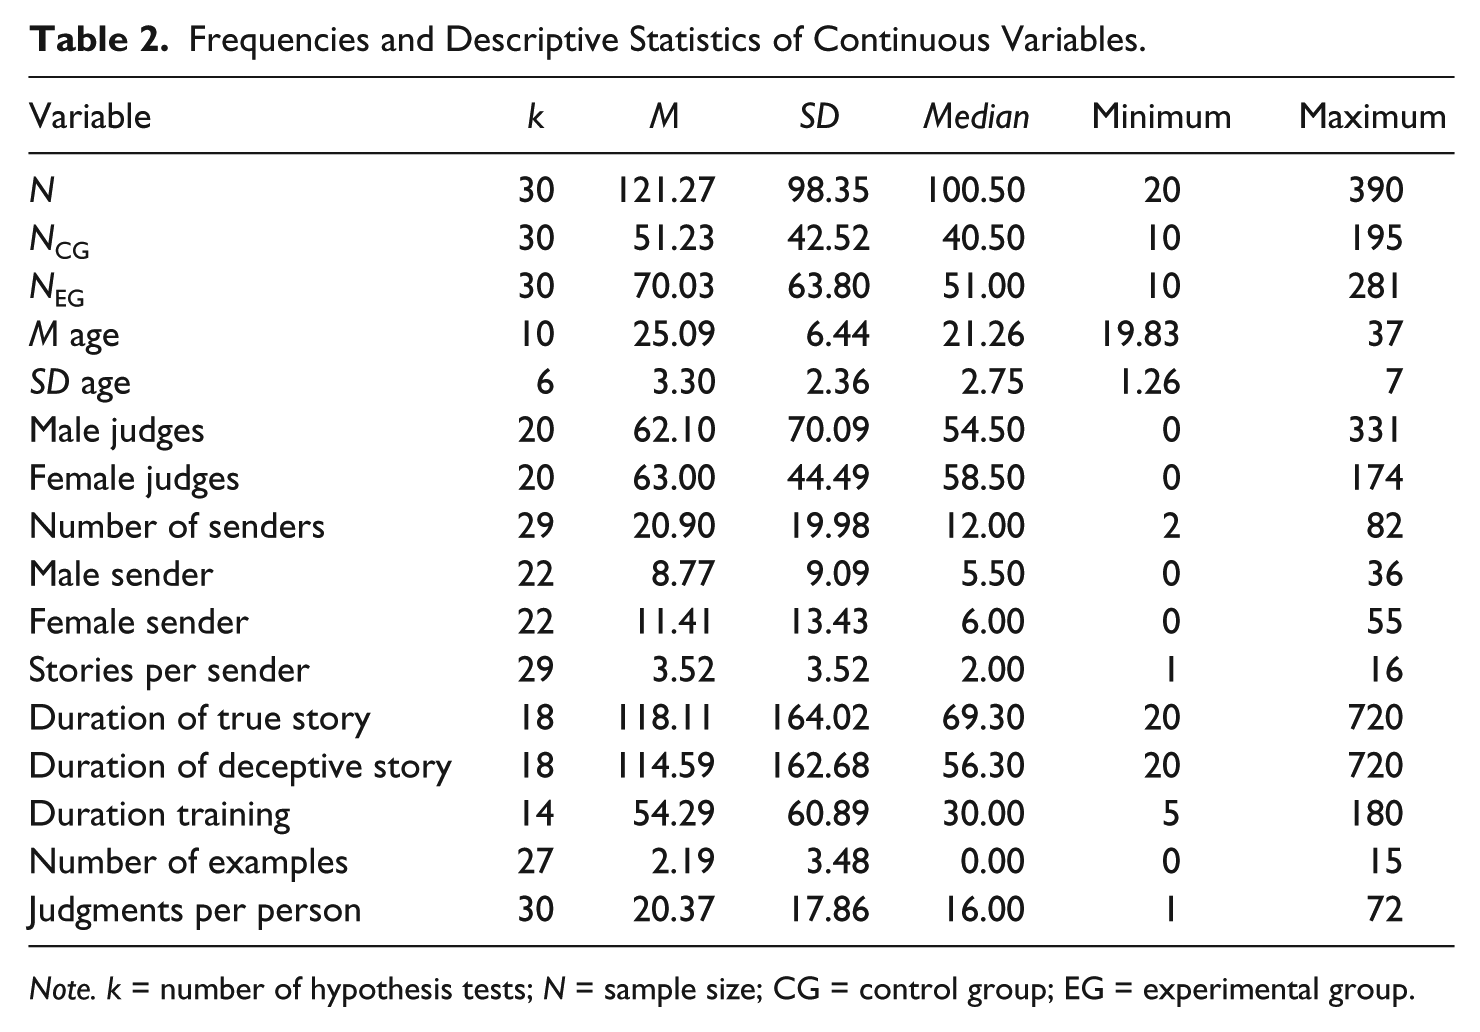
Note. k = number of hypothesis tests; N = sample size; CG = control group; EG = experimental group.
Of all studies, 70% used a within- and 30% a between-participants design for telling lies and truths. The average number of words did not differ between true (M = 118.11, SD = 164.02, Mdn = 69.30, k = 18) and deceptive statements (M = 114.59, SD = 162.68, Mdn = 56.30, k = 18, gu = 0.02). Participants were asked to judge M = 20.37 stories per study, via an audiovisual medium (82.1%), via transcript (14.3%), or via a combination of both (3.6%). All variables coded are listed in Appendix B (Tables B1, B2 and B3).
Meta-Analytic Syntheses of Effect Sizes
This section deals with the overall effect of any type of training on detection accuracy, lie accuracy, and truth accuracy. Thus, multiple training groups were averaged resulting in one effect size per study as the unit of analysis. All groups involving bogus feedback were excluded from the analysis, because they did not have the aim to improve detection accuracy. Following Cohen’s (1988) recommendation, gu = 0.20 is considered a small, gu = 0.50 a medium, and gu = 0.80 a large effect size.
Overall detection accuracy
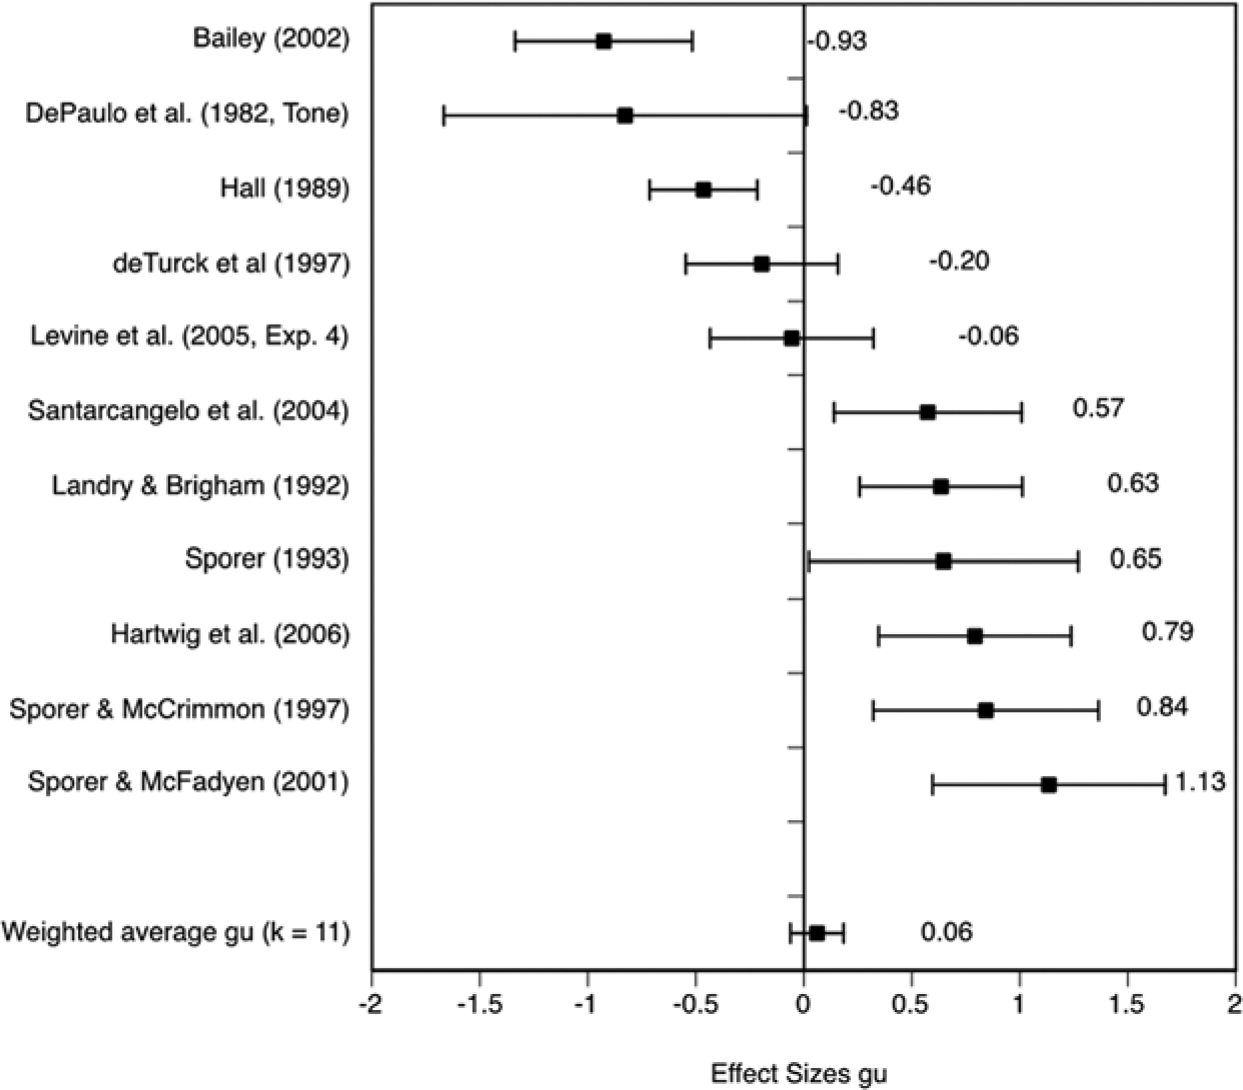
A total of 30 hypothesis tests involving n = 3,614 participants resulted in a small to medium training effect of gu = 0.331 [0.262, 0.400]. The results were highly heterogeneous, Q(29) = 141.44, p < .001, I2 = 79.50, with gus ranging from gu = −0.672 to gu = 1.424. Of these 30 effect sizes, 2 had a significant negative, 8 a nonsignificant negative, 17 a significant positive, and 3 a nonsignificant positive effect. Figure 1 reflects this heterogeneity, also indicating graphically that some studies on either side of the distribution may be considered outliers.
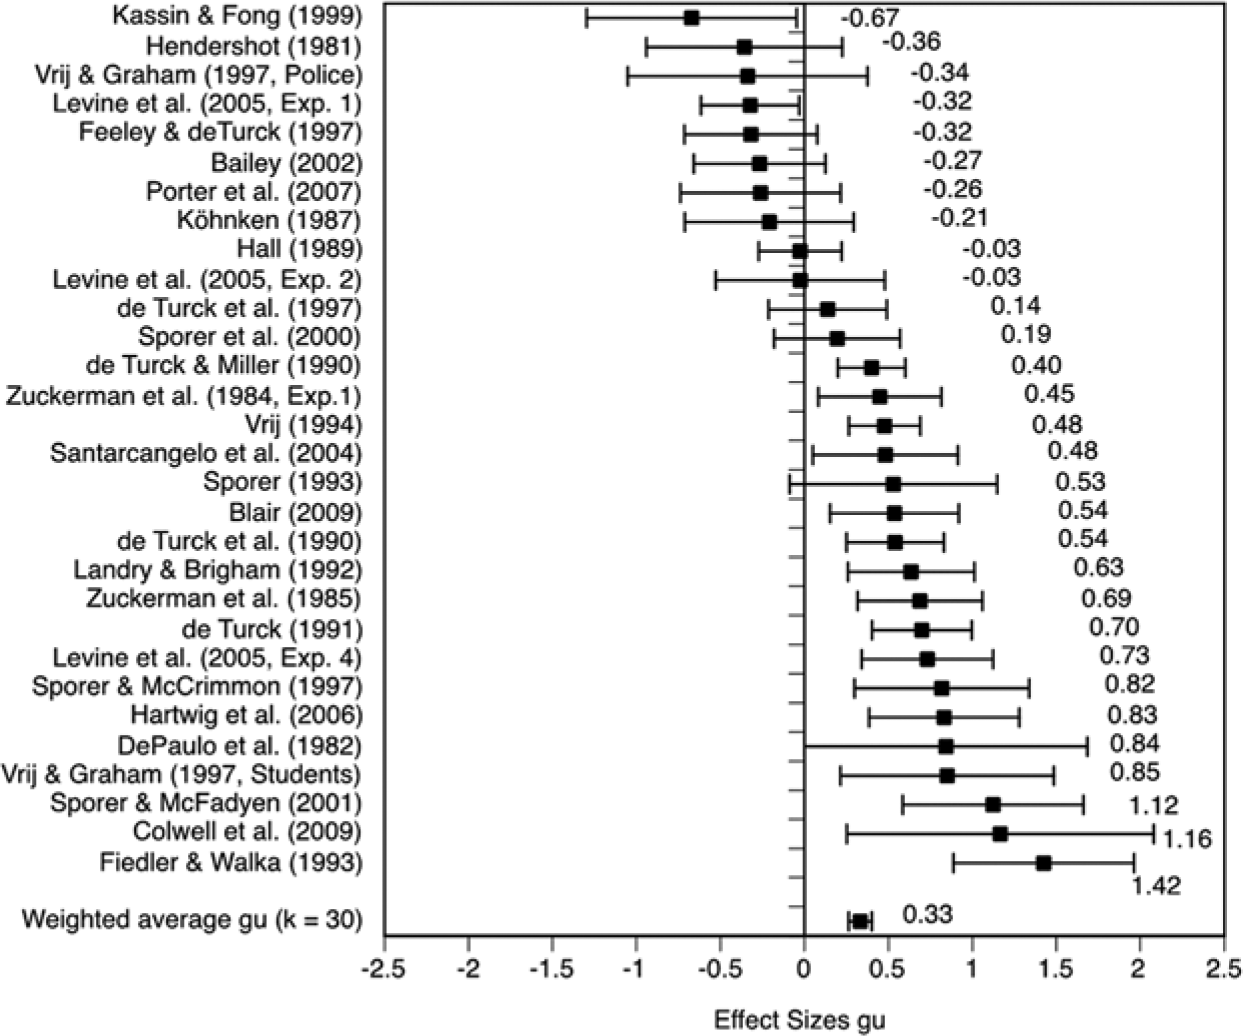
Effect size distribution of mean effect sizes (and 95% CIs) for overall detection accuracy.
Lie accuracy
Only 11 out of 30 studies reported detection accuracy separately for lies and true accounts. These 11 hypothesis tests involving n = 1,274 judges revealed a significant training effect of gu = 0.422 [0.299, 0.544] for lie accuracy (Figure 2). The distribution was heterogeneous, Q(10) = 22.26, p = .014, I2 = 55.32. The outlier analysis identified the study by Levine, Feeley, McCornack, Hughes, and Harms (2005, Exp. 4), as an outlier. After removing that study, Q(9) = 13.49, p = .142 shrank to a nonsignificant value, and I2 = 33.27 also indicated that most of the variation was due to sampling error. The weighted average effect size slightly decreased to gu = 0.362 [0.233, 0.491], still a small to medium training effect.
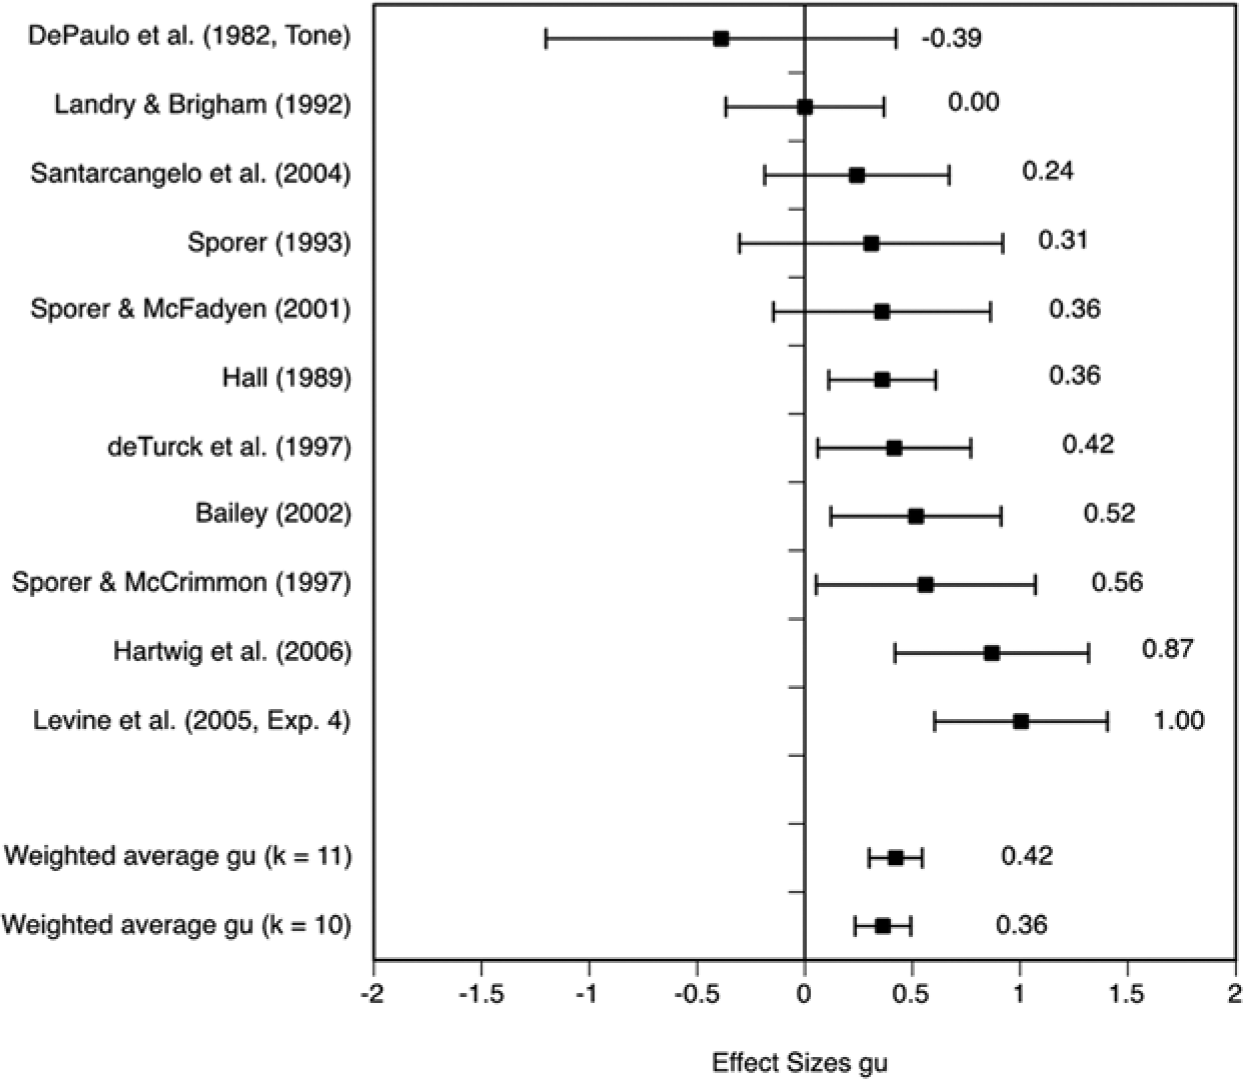
Effect size distribution of mean effect sizes (and 95% CIs) for lie accuracy.
Truth accuracy
Three out of 11 studies (n = 1,274) showed significant negative, while 6 studies showed significant positive effects for truth accuracy; the remaining 2 were not significantly different from 0 (Figure 3). The analysis resulted in a nonsignificant weighted average effect size of gu = 0.060 [−0.063, 0.184], p = .337, with a highly heterogeneous effect size distribution, Q(10) = 97.95, p < .001, I2 = 89.79. Although some of the studies on either side of the distribution could formally be considered as outliers, none of them was excluded.
Effect size distribution of mean effect sizes (and 95% CIs) for truth accuracy.
Moderator Analyses
This section deals with the analyses of previously selected independent variables to moderate the relationship between training and detection accuracy. The pairwise associations between all independent variables, which follow an ordinal relationship, are displayed in Table 3.
Correlation Matrix (Phi or Cramer’s V) of Moderator Variables.
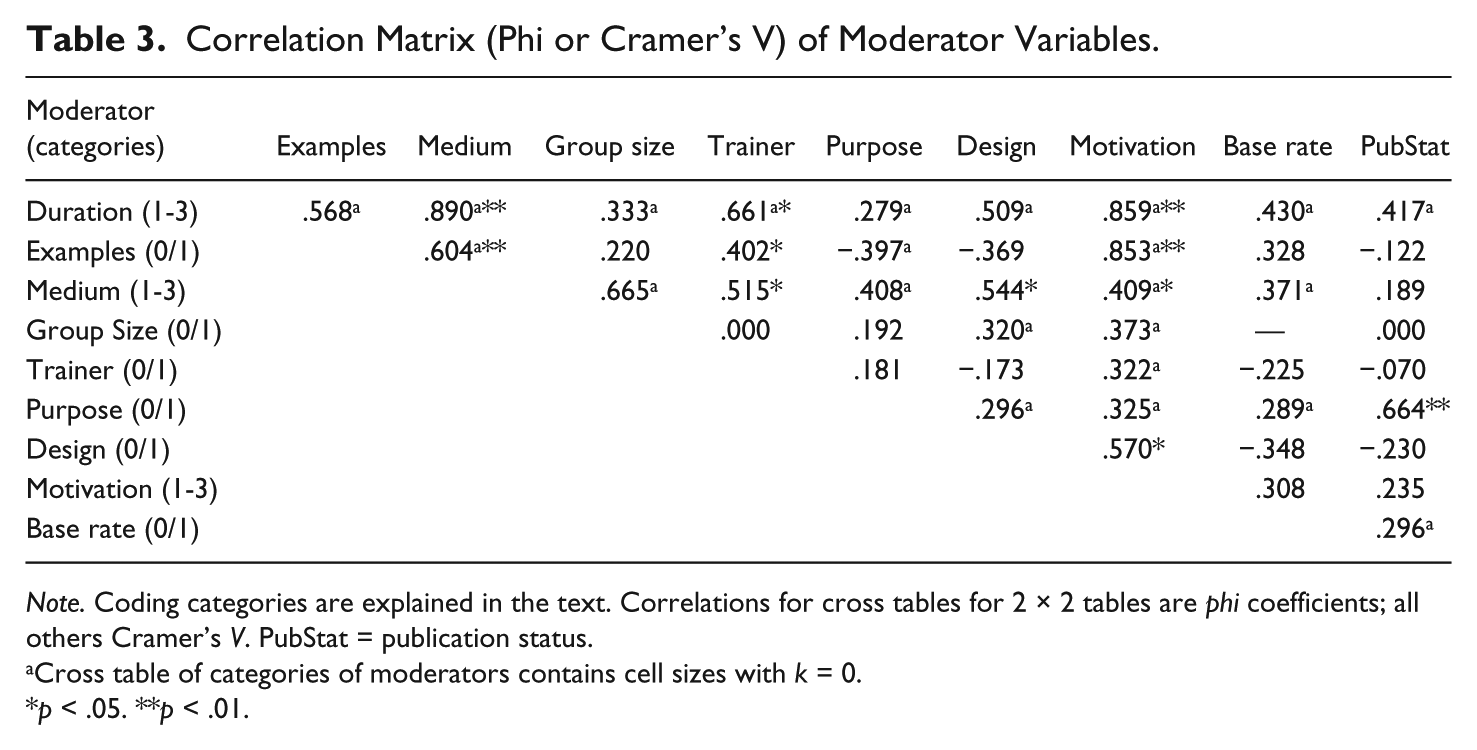
Note. Coding categories are explained in the text. Correlations for cross tables for 2 × 2 tables are phi coefficients; all others Cramer’s V. PubStat = publication status.
Cross table of categories of moderators contains cell sizes with k = 0.
p < .05. **p < .01.
Training category
We classified all training programs into four major categories according to training content: (a) accurate feedback about truth status (k = 4); (b) “multichannel” category (k = 10): information about specific nonverbal and/or paraverbal cues to deception; (c) verbal content cues (such as CBCA, RM, or ARJS; k = 7); (d) combination of at least two of the aforementioned categories (k = 9). A significant homogeneity test statistic, QB(3) = 15.79, p < .001, suggested reliable differences between these categories (Figure 4), although some heterogeneity remained within each training category, QW(26) = 134.08, p < .001. Studies giving feedback (k = 4, n = 693, gu = 0.189 [0.022, 0.357]), as well as programs teaching multichannel cues (k = 10, n = 1,351, gu = 0.276 [0.170, 0.382]), or a combination of the above paradigms (k = 9, n = 887, gu = 0.336 [0.201, 0.470]), revealed small effect sizes, while verbal content cue training provided a medium training effect of gu = 0.653 ([0.471, 0.835], k = 7, n = 683).
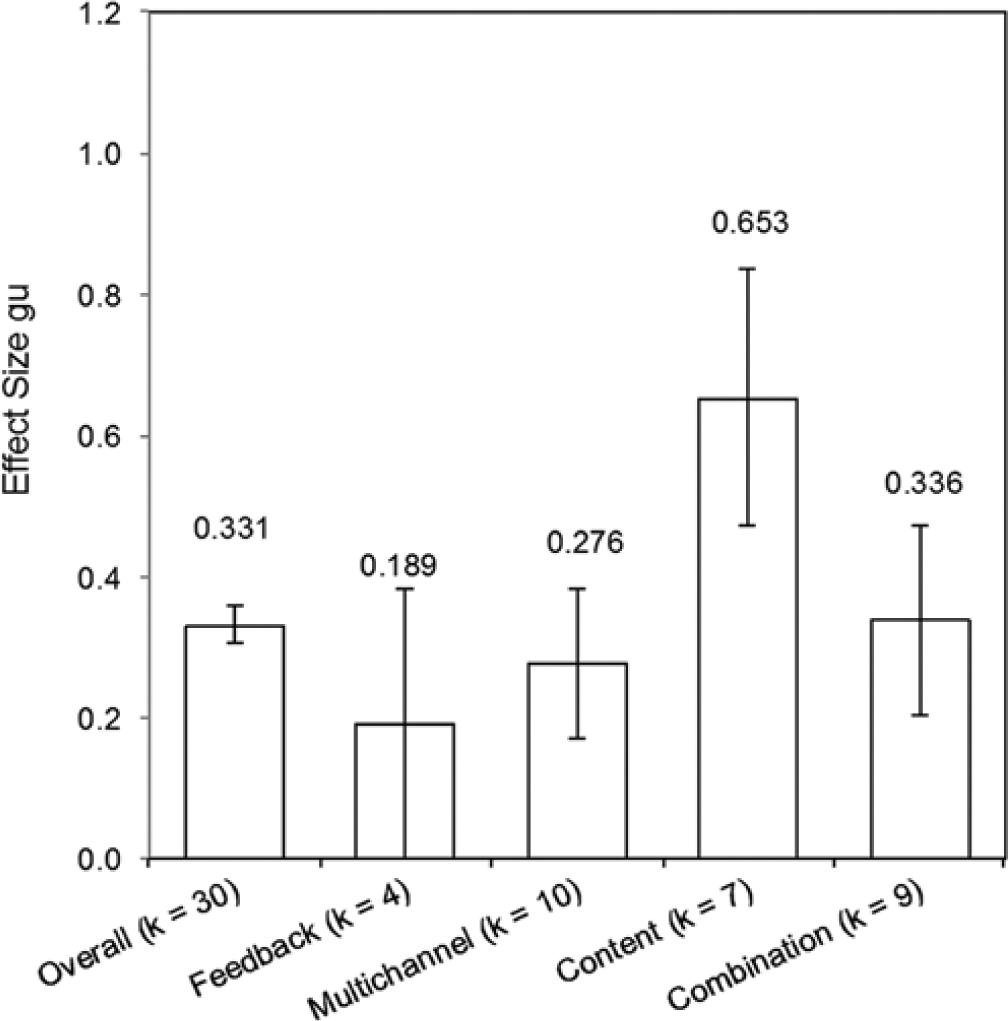
Moderator analysis for training category on overall accuracy.
It should be noted that the variable training category is highly associated with the variable purpose in that only verbal content training studies (but no other training category) had the purpose to detect the truth (k = 5), and only two verbal content training studies had the purpose to detect lies.
Purpose of the training
The predictor variable purpose—whether training had the aim to detect lies or the truth—was assumed to moderate effect sizes for lie and truth accuracy. A total of 26 studies (N = 3,070) reported the purpose of their training, either to detect lies (k = 21, n = 2,568) or the truth (k = 5, n = 502). From those 11 studies reporting lie and truth accuracies, 6 had the aim to detect lies, 4 had the aim to detect the truth, and the study by Hall (1989) did not report this information. Because all studies with the aim to detect the truth implemented verbal content cue training, purpose is entirely confounded with training category (verbal content).
The moderator analysis for lie accuracy yielded a significant effect for purpose, QB(1) = 4.09, p = .043 (Figure 5). Training programs with the aim to detect lies resulted in a larger training effect for lie accuracy (gu = 0.550 [0.374, 0.725]) than programs with the aim to detect the truth (gu = 0.246 [0.010, 0.483]). This result was no longer significant if the outlier (gu = 1.003 [0.602, 1.405], Levine et al., 2005, Exp. 4) was removed, QB(1) = 1.58, p = .209.
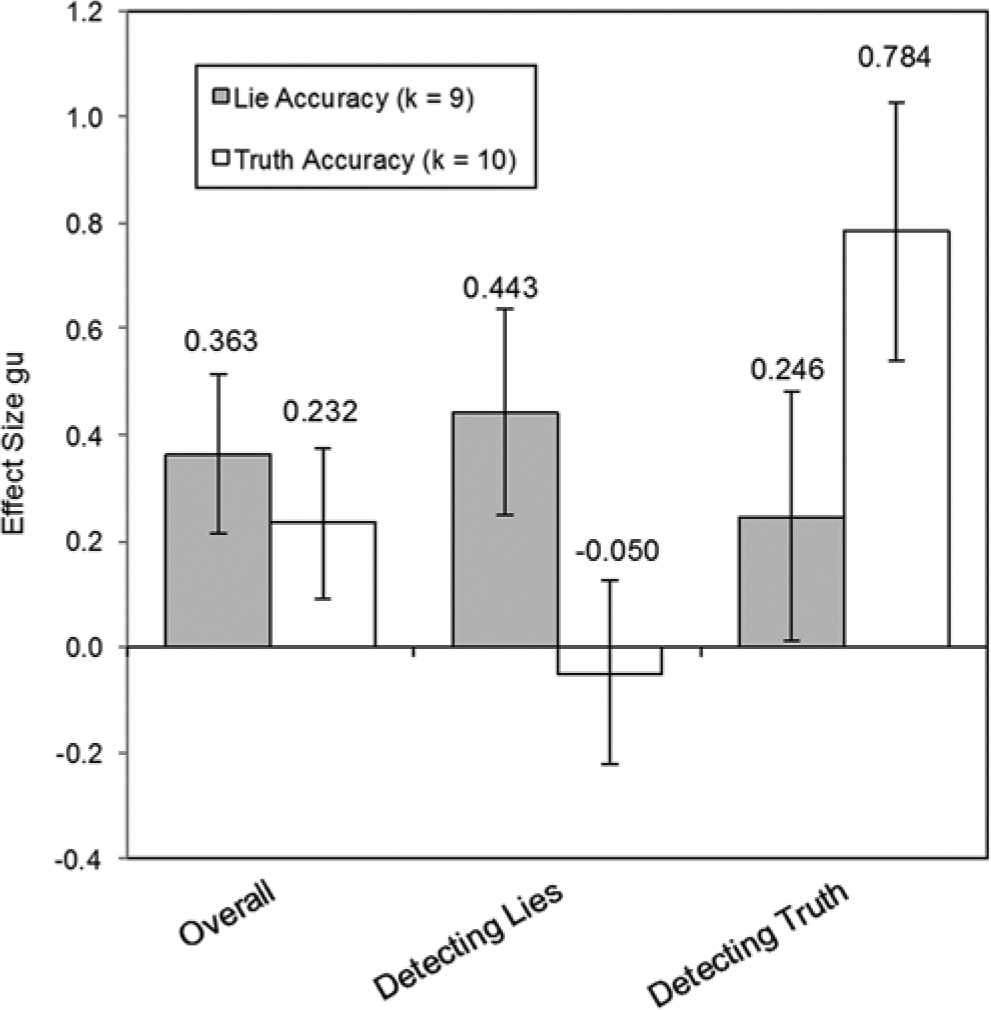
Moderator analyses of purpose for lie and truth accuracy.
The moderator analysis for truth accuracy suggested a significant main effect for purpose, QB(1) = 29.64, p < .001, though heterogeneity within groups was still large, QW(8) = 45.59, p < .001. A large training effect for truth accuracy could only be found if trainings aimed to detect the truth (gu = 0.784 [0.540, 1.029]) but not if they aimed to detect lies (gu = −0.050 [−0.225, 0.124]).
Intensity of the training
Duration. The duration of the training had a mean of 54.29 (SD = 60.89, k = 14, n = 1,744), and a Mdn = 30.00 minutes per training. The short training category (5-20 minutes) included four studies (n = 384), medium training (21-60 minutes) seven studies (n = 1,159), and long training (61-180 minutes) included three studies (n = 201). A moderator analysis showed a significant effect, QB(2) = 15.45, p < .004, but heterogeneity remained within groups, QW(11) = 57.70, p < .001. The short training had a nonsignificant effect of gu = −0.030 [−0.217, 0.157], whereas medium and long training yielded medium effects of gu = 0.391 [0.271, 0.511] and gu = 0.491 [0.160, 0.822], respectively.
Training medium. A moderator analysis resulted in a significant difference between groups, QB(1) = 39.97, p < .001, showing that training programs using written instructions (k = 10, n = 940, gu = 0.470 [0.334, 0.605]), or using a combination of written instruction and lecture or video (k = 11, n = 1,477, gu = 0.443 [0.337, 0.549]) had larger training effects than training programs using only a lecture or video format (k = 7, n = 848, gu = −0.067 [−0.205, 0.071]).
Number of examples. A nonsignificant QB(1) = 0.03, p = .860, indicated that training effectiveness did not differ as a function of practicing examples (k = 11, n = 1,715, gu = 0.341 [0.225, 0.456]) or no examples (k = 16, n = 1,330, gu = 0.354 [0.256, 0.453]).
Group size. Training programs were either assessed in small groups of 1 to 6 trainees (k = 9, n = 820, gu = 0.308 [0.158, 0.457]), or in larger groups of 7 to 30 trainees (k = 6, n = 1,005, gu = 0.285 [0.157, 0.412]). A moderator analysis yielded no difference between these groups, QB(1) = 0.05, p = .812.
Trainer presence. Trainer presence yielded a nonsignificant QB(1) = 1.55, p = .312, indicating that effectiveness did not differ whether training was conducted by a live person (k = 19, n = 2,298, gu = 0.360 [0.275, 0.445]), or without any trainer present (k = 10, n = 1,216, gu = 0.267 [0.148, 0.386]), for example, by a computer program or only by written instructions.
Senders’ motivation
Senders were not specifically motivated in 19 cases (n = 1,877, gu = 0.354 [0.259, 0.449]), received low to medium motivation ($1-$50) in seven studies (n = 1,496, gu = 0.266 [0.156, 0.375]), and were assumed to be highly motivated in four studies (n = 241, gu = 0.510 [0.260, 0.760]). A moderator analysis resulted in a nonsignificant QB(2) = 3.56, p = .169, leading to the conclusion that senders’ incentives did not moderate the training effect.
To test for a possible motivational impairment effect, we separately analyzed studies that used either only multichannel cues (nonverbal or paraverbal) or only verbal content cues. Training with multichannel cues was more effective under medium motivation of senders than studies where senders were not motivated, QB(1) = 14.62, p < .001. When senders were not explicitly motivated, there was no training effect, gu = 0.011 [−0.171, 0.193], k = 5, n = 406. For medium motivation stories, there was a significant training effect, gu = 0.451 [0.318, 0.584], k = 4, n = 925. The study by Hendershot (1981), which was the only one classified as a high motivation study, showed a negative training effect (gu = −0.358, n = 20).
When training was conducted with verbal content cues only, the difference in training effectiveness was not significant, QB(1) = 1.76, p = .185. When senders were not explicitly motivated, there was a medium size significant training effect, gu = 0.590 [0.386, 0.795], k = 5, n = 502. For high motivation stories, there was a strong training effect, gu = 0.895 [0.494, 1.297], k = 2, n = 181, but this was based on only two studies.
Story content
There were no significant differences in training effects as a function of story content, QB(2) = 0.96, p = .620: attitudes (k = 9, n = 1,520, gu = 0.301 [0.201, 0.410]); personal autobiographical events (k = 8, n = 664; gu = 0.395, [0.232, 0.558]); observed or staged events (k = 9, n = 1,116, gu = 0.303 [0.179, 0.428]).
Design
Nine studies (n = 961) used a between- (senders telling the truth or lying), and 21 a within-participants design (n = 2,653; senders telling the truth and lying). The experimental design did not moderate the training effect, QB(1) = 0.52, p = .472.
Base rate information
The significant homogeneity test statistic, QB(1) = 4.53, p = .033, suggested that the training effect was larger if participants were aware of the lie/truth ratio beforehand (k = 5, n = 527, gu = 0.446 [0.261, 0.630]) than if they were not (k = 19, n = 1,997, gu = 0.221 [0.126, 0.316]).
Research group
There was a significant difference among the six different research groups, QB(5) = 32.12, p < .001 (see Appendix B: Table B1). The largest effect sizes were obtained in two studies by Zuckerman and colleagues (n = 249, gu = 0.566 [0.305, 0.827]), and four studies by Sporer and colleagues (n = 388, gu = 0.572 [0.329, 0.816]), although these were not significantly different from three studies by Vrij and colleagues (n = 429, gu = 0.450 [0.256, 0.645]), nor from the 10 studies from other deception researchers who had conducted only a single training study (n = 728, gu = 0.453 [0.297, 0.608]). Eight training studies from deTurck, Feeley, and/or Levine showed a small weighted average effect size of gu = 0.285 [0.177, 0.394], n = 1,368, which was significantly smaller than the effect sizes obtained from the labs by Zuckerman or Sporer, but not significantly different from effect sizes found from Vrij’s or other deception researchers’ laboratories. Only one group (that we referred to as “others” who reported three studies) resulted in a nonsignificant, slightly negative training effect (gu = −0.126 [−0.322, 0.071], n = 452) that differed significantly from all other groups.
It should be noted that this moderator variable was highly correlated with other moderator variables showing that research groups systematically differ with respect to study characteristics. For example, all four studies conducted by Sporer and colleagues trained criteria to detect the truth and not lies (only the study by Landry & Brigham, 1992, also used truth criteria), all studies by Zuckerman applied an attitude/liking paradigm, and studies by deTurck/Feeley/Levine did not ask senders to lie about a personal event.
Publication status
The 22 published studies (n = 2,734) differed from the eight unpublished studies (n = 880), QB(1) = 4.12, p = .042, suggesting a publication bias. The training effect for published studies was significantly higher (gu = 0.371 [0.292, 0.450]) than for unpublished studies (gu = 0.202 [0.060, 0.344]). It should be noted that publication status was confounded with purpose. Unpublished studies tended to train people to detect the truth, while only one published study did (Landry & Brigham, 1992).
Figure 6 displays the funnel plot of the effect sizes of published and unpublished studies and the inverse of the standard error (precision = 1/SE). Although it is difficult to ascertain asymmetry of funnel plots by visual inspection, there appear to be fewer published studies with lower precision and a negative effect size or an effect size close to zero, indicating the possibility of publication bias.
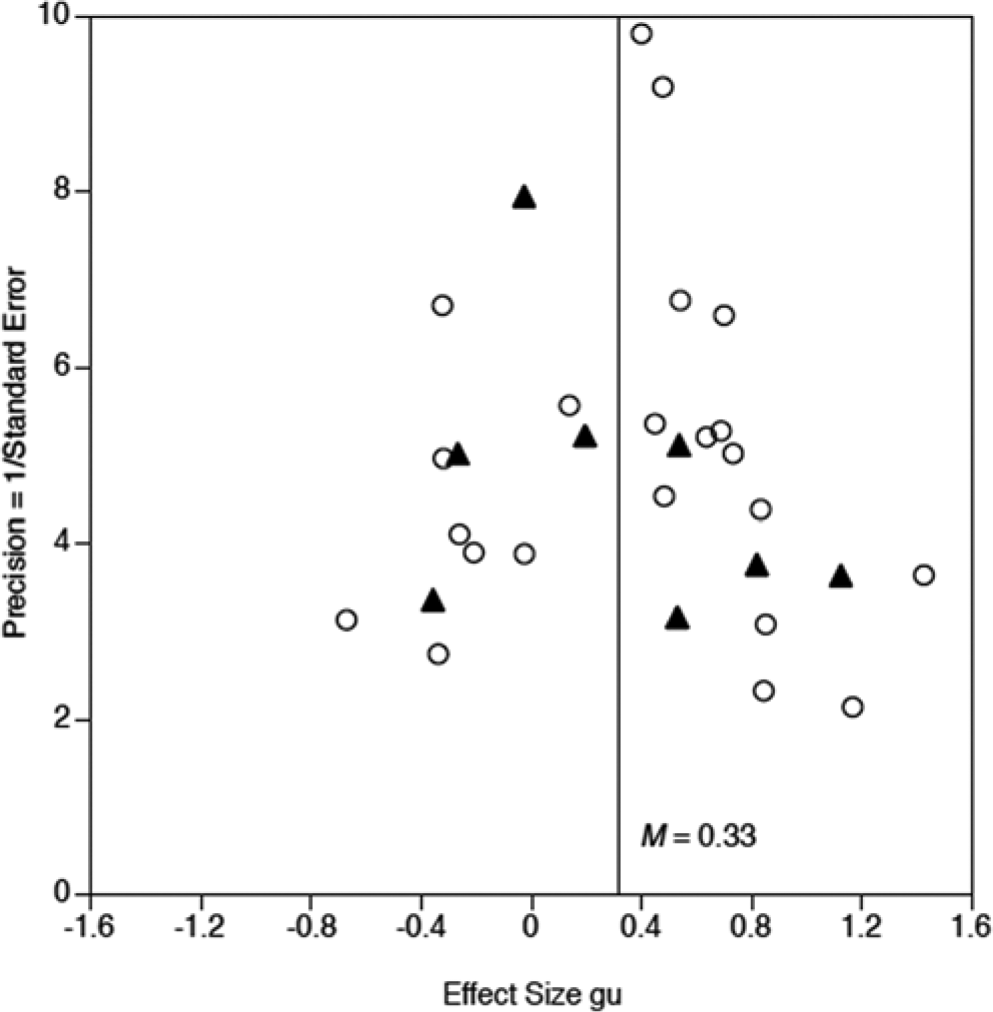
Funnel plot of effect sizes of published (open circles) and unpublished (black triangles) studies for overall detection accuracy and the inverse of the standard error.
However, more formal tests to address publication bias, such as Begg and Mazumdar’s (1994) rank correlation test, or Egger’s regression test (Egger, Davey Smith, Schneider, & Minder, 1997; see Sutton, 2009), yielded significant results that would have suggested a publication bias. Duval and Tweedie’s (2000a, 2000b) trim and fill method, which estimates and adjusts for the numbers and outcomes of missing studies by an iterative method, suggested only a slight downward adjustment of the mean overall effect size from gu = 0.331 to gu = 0.312. Note also that in Figure 6, there are as many unpublished studies above the mean weighted effect size as below, which would be an argument against a publication bias.
Effect Size Analyses for Different Training Types
To evaluate differences between the contents of training, all training programs were classified into eight different types: bogus feedback, feedback, nonverbal cues, paraverbal cues, nonverbal and paraverbal cues, nonverbal and paraverbal cues and feedback, verbal content cues, and verbal content and nonverbal and paraverbal cues. This approach involved synthesizing all studies using a particular training separately as tests for the efficacy of these specific training procedures versus a control group (Appendix C). If any training study contained two or more training contents of the same type, the effect sizes were averaged to avoid dependence of effect sizes using the same control groups. Figure 7 displays the weighted average effect sizes and CIs sorted by their effect sizes.
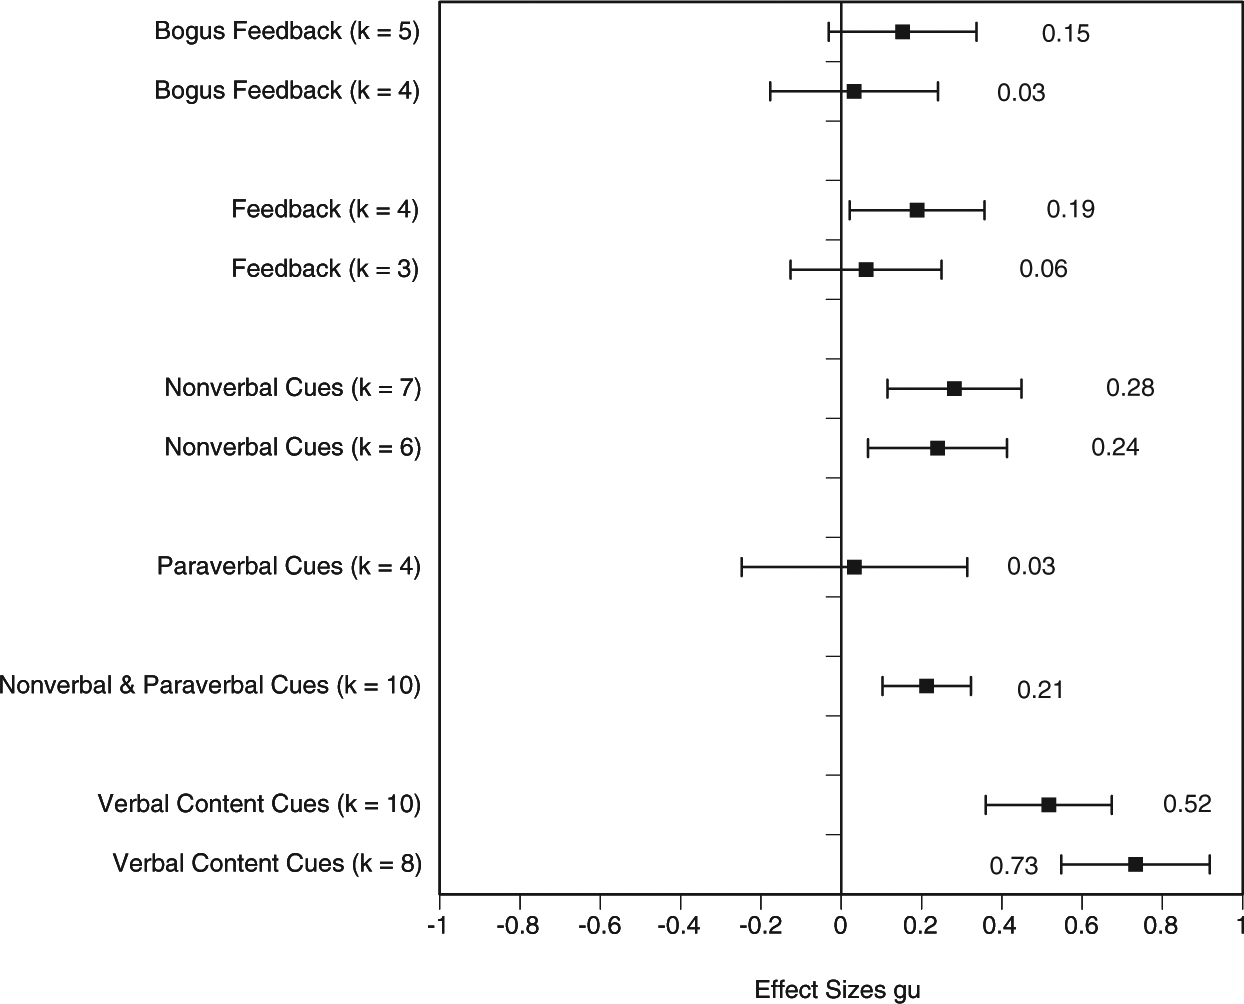
Overview of meta-analyses for different types of training.
Bogus feedback or training
Two studies (Porter et al., 2007; Zuckerman, Koestner, & Alton, 1984, Exp. 2) implemented bogus feedback, and three studies (Levine et al., 2005, Exp. 1, 2, and 4) conducted a bogus training. The weighted average effect size of these five studies (n = 486 judges) was gu = 0.153 [−0.030, 0.337], p = .102, with quite a heterogeneous distribution, Q(4) = 13.01, p = .011, I2 = 69.24, and individual effect sizes ranging from −0.373 to 0.565. If the outlier from Levine et al. (2005, Exp. 4; gu = 0.565) was removed, the weighted average training effect was gu = 0.032 [−0.176, 0.241], p = .760, and the homogeneity test was no longer significant, Q(3) = 7.35, p = .061, I2 = 59.20. These results suggest that bogus feedback did not have an effect on detection accuracy.
Accurate feedback
A total of four accurate feedback studies, involving n = 712 judges, provided a small weighted average effect size of gu = 0.189 [0.022, 0.357], p = .027, indicating that judges who were given feedback were slightly better than untrained judges. But the results were quite heterogeneous, Q(3) = 15.21, p = .002, I2 = 80.27, primarily due to an outlier by Zuckerman, Koestner, and Colella (1985; gu = 0.692). Removing this outlier, the weighted average effect size became nonsignificant, gu = 0.062 [−0.126, 0.250], p = .518, indicating that feedback had no effect.
Nonverbal cues
Seven hypothesis tests (n = 559) resulted in effect sizes ranging from −0.339 (Vrij & Graham, 1997, Exp. 2) to 0.849 (Vrij & Graham, 1997, Exp. 1) for studies training on nonverbal cues only. The weighted average effect size was gu = 0.282 [0.115, 0.449], p = .001, but rather heterogeneous, Q(6) = 13.73, p = .033, I2 = 56.29. Removing the outlier (Vrij & Graham, 1997, Exp. 1) resulted in gu = 0.240 [0.067, 0.413], p = .007, and a nonsignificant homogeneity test statistic. Thus, nonverbal cue training had a small positive effect on detection accuracy—with and without the outlier.
Paraverbal cues
A nonsignificant weighted average effect size of 0.033 [−0.247, 0.314], p = .815, occurred for four paraverbal cue training studies (n = 194). Although effect sizes ranged from a minimum of −0.397 (deTurck et al., 1997) to a maximum of 0.842 (DePaulo et al., 1982), the homogeneity test statistic yielded a nonsignificant value, Q(3) = 6.60, p = .086, I2 = 54.54. Thus, on average, training with paraverbal cues had no effect on detection accuracy.
Combination of nonverbal and paraverbal cues
Ten studies with a total of n = 1,308 judges evaluated a training with a combination of nonverbal and paraverbal cues, yielding a significant training effect of gu = 0.213 [0.103, 0.323], p < .001. The minimum effect size was gu = −0.480 (Blair, 2009) and the maximum was gu = 1.360 (Fiedler & Walka, 1993), yielding a quite heterogeneous distribution, Q(9) = 69.37, p < .001, I2 = 87.03, with several outliers on either side of the distribution (standardized residuals larger than |2.5|).
Combination of nonverbal and paraverbal cues with feedback
Only three studies involving a total of n = 488 judges conducted training with a combination of nonverbal cues and feedback (Vrij, 1994; gu = 0.485), or a combination of nonverbal and paraverbal cues and feedback (deTurck, Harszlak, Bodhorn, & Texter, 1990: gu = 0.541; Fiedler & Walka, 1993: gu = 1.495) reporting medium to very large positive effect sizes. Due to a quite heterogeneous effect size distribution, Q(2) = 8.32, p = .016, I2 = 74.06, no weighted average effect size was calculated.
Verbal content cues
Ten hypothesis tests (n = 645) yielded effect sizes ranging from gu = −0.429 (Feeley & deTurck, 1997) to gu = 1.165 (Colwell et al., 2009), resulting in a quite heterogeneous effect size distribution, Q(9) = 31.39, p < .001, I2 = 71.33. Meta-analysis resulted in a medium size training effect of 0.517 [0.359, 0.674], p < .001. Analysis of outliers suggested two studies (Feeley & deTurck, 1997; Sporer et al., 2000) as outliers. When they were removed, the weighted average training effect turned out to be even larger (gu = 0.733 [0.547, 0.918], p < .001), with a homogeneous effect size distribution, Q(7) = 8.78, p < .269, I2 = 20.25.
Combination of nonverbal, paraverbal, and verbal content cues
Three studies trained judges (n = 190) with a combination of nonverbal, paraverbal, and verbal content cues. The results were quite contradictory, with a significant negative effect size of gu = −0.672 ([−1.297, −0.047], Kassin & Fong, 1999), a nonsignificant effect size of gu = −0.358 ([−0.941, 0.224], Hendershot, 1981), and a large positive effect size of gu = 1.261 ([0.785, 1.737]; Blair, 2009). Due to the large heterogeneity, Q(2) = 29.85, p < .001, I2 = 93.30, as well as the small number of studies, no synthesis was attempted.
Results for OGPP Designs
The two OGPP studies used a multimedia training system called Agent99 Trainer (see Table 4). Because the studies by Crews, Cao, Lin, Nunamaker, and Burgoon (2007) and George, Biros, Adkins, Burgoon, and Nunamaker (2004) did not report the correlation between pretest and posttest outcomes, no meta-analysis in the same metric as the previously reported effect sizes could be conducted. As reported in Table 4, consistent medium to large positive effect sizes ranging from dOGPP = 0.474 to dOGPP = 1.566 were found, with quite a large unweighted mean effect size (dOGPP = 0.973). If effect sizes were weighted by sample size, the average effect size was dOGPP = 0.693. Thus, a large standardized pre- to posttest change effect size was observed as detection accuracy was higher after training than before.
Summary of Effect Sizes for OGPP Studies.
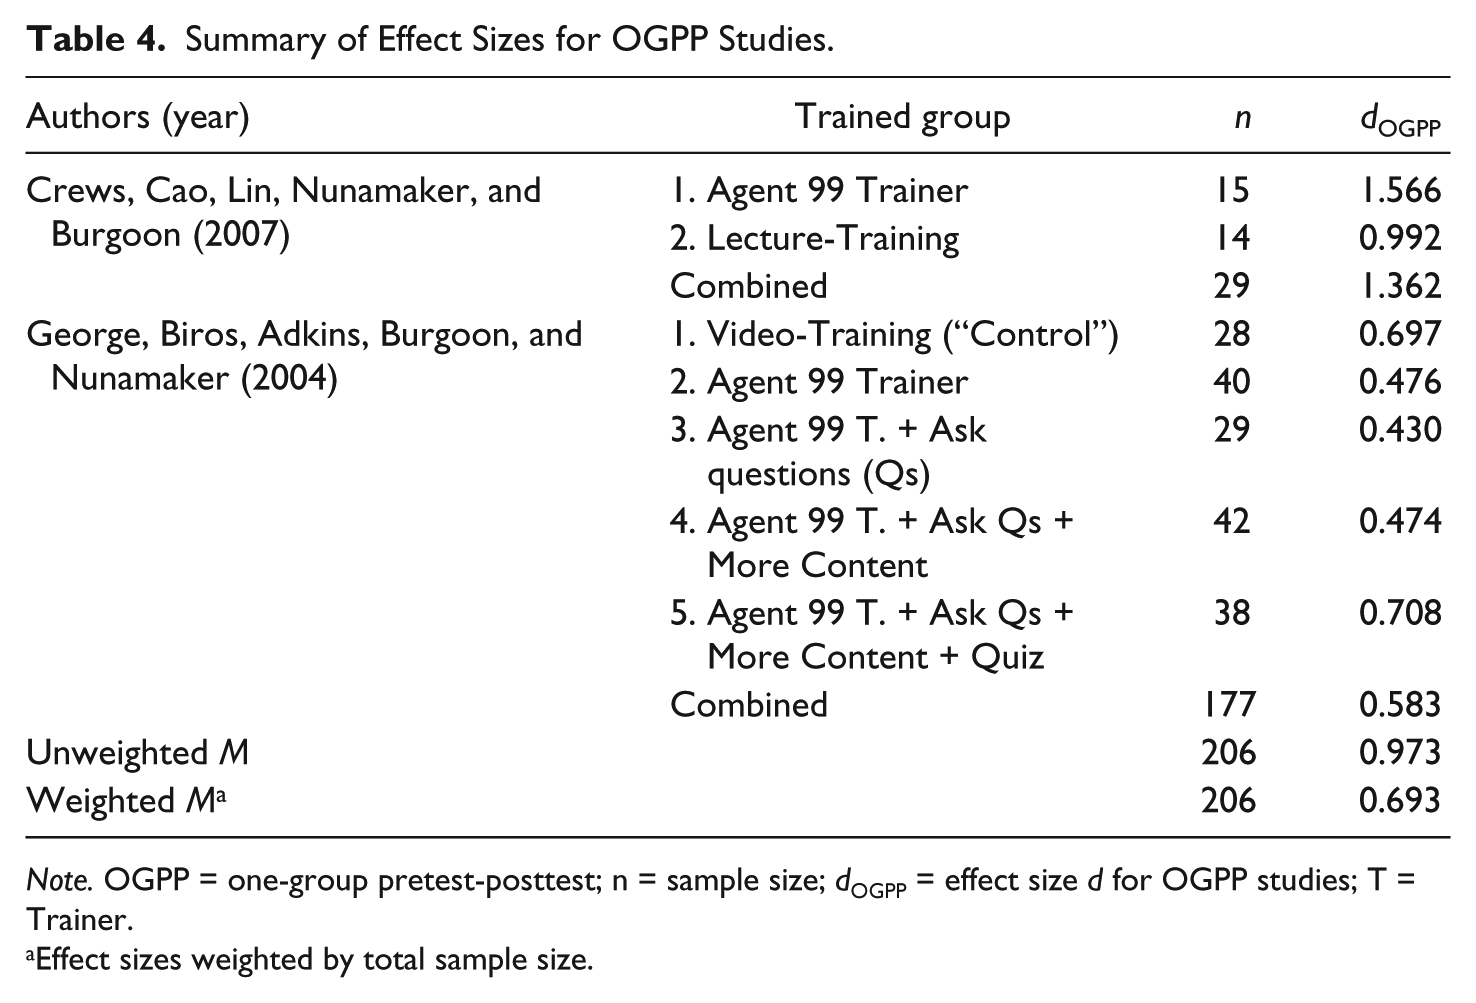
Note. OGPP = one-group pretest-posttest; n = sample size; dOGPP = effect size d for OGPP studies; T = Trainer.
Effect sizes weighted by total sample size.
Results for PPWC Designs
PPWC studies used different forms of training (see Table 5). None of the six PPWC designed studies reported information about the correlation between pre- and posttest measures, so that no meta-analysis could be conducted. However, the standardized mean change effect size was calculated for each training group (Table 5). Effect sizes ranged from dPPWC = −1.112 (Porter et al., 2000) to dPPWC = 1.161 (Blair, 2006), revealing quite a heterogeneous distribution. The unweighted average effect size was dPPWC = 0.203 (n = 647); weighted by sample size, it was dPPWC = 0.180. Therefore, on average, the training group might have a small advantage in pretest-posttest change compared with the control group regarding their detection accuracy.
Summary of Effect Sizes for PPWC Studies.
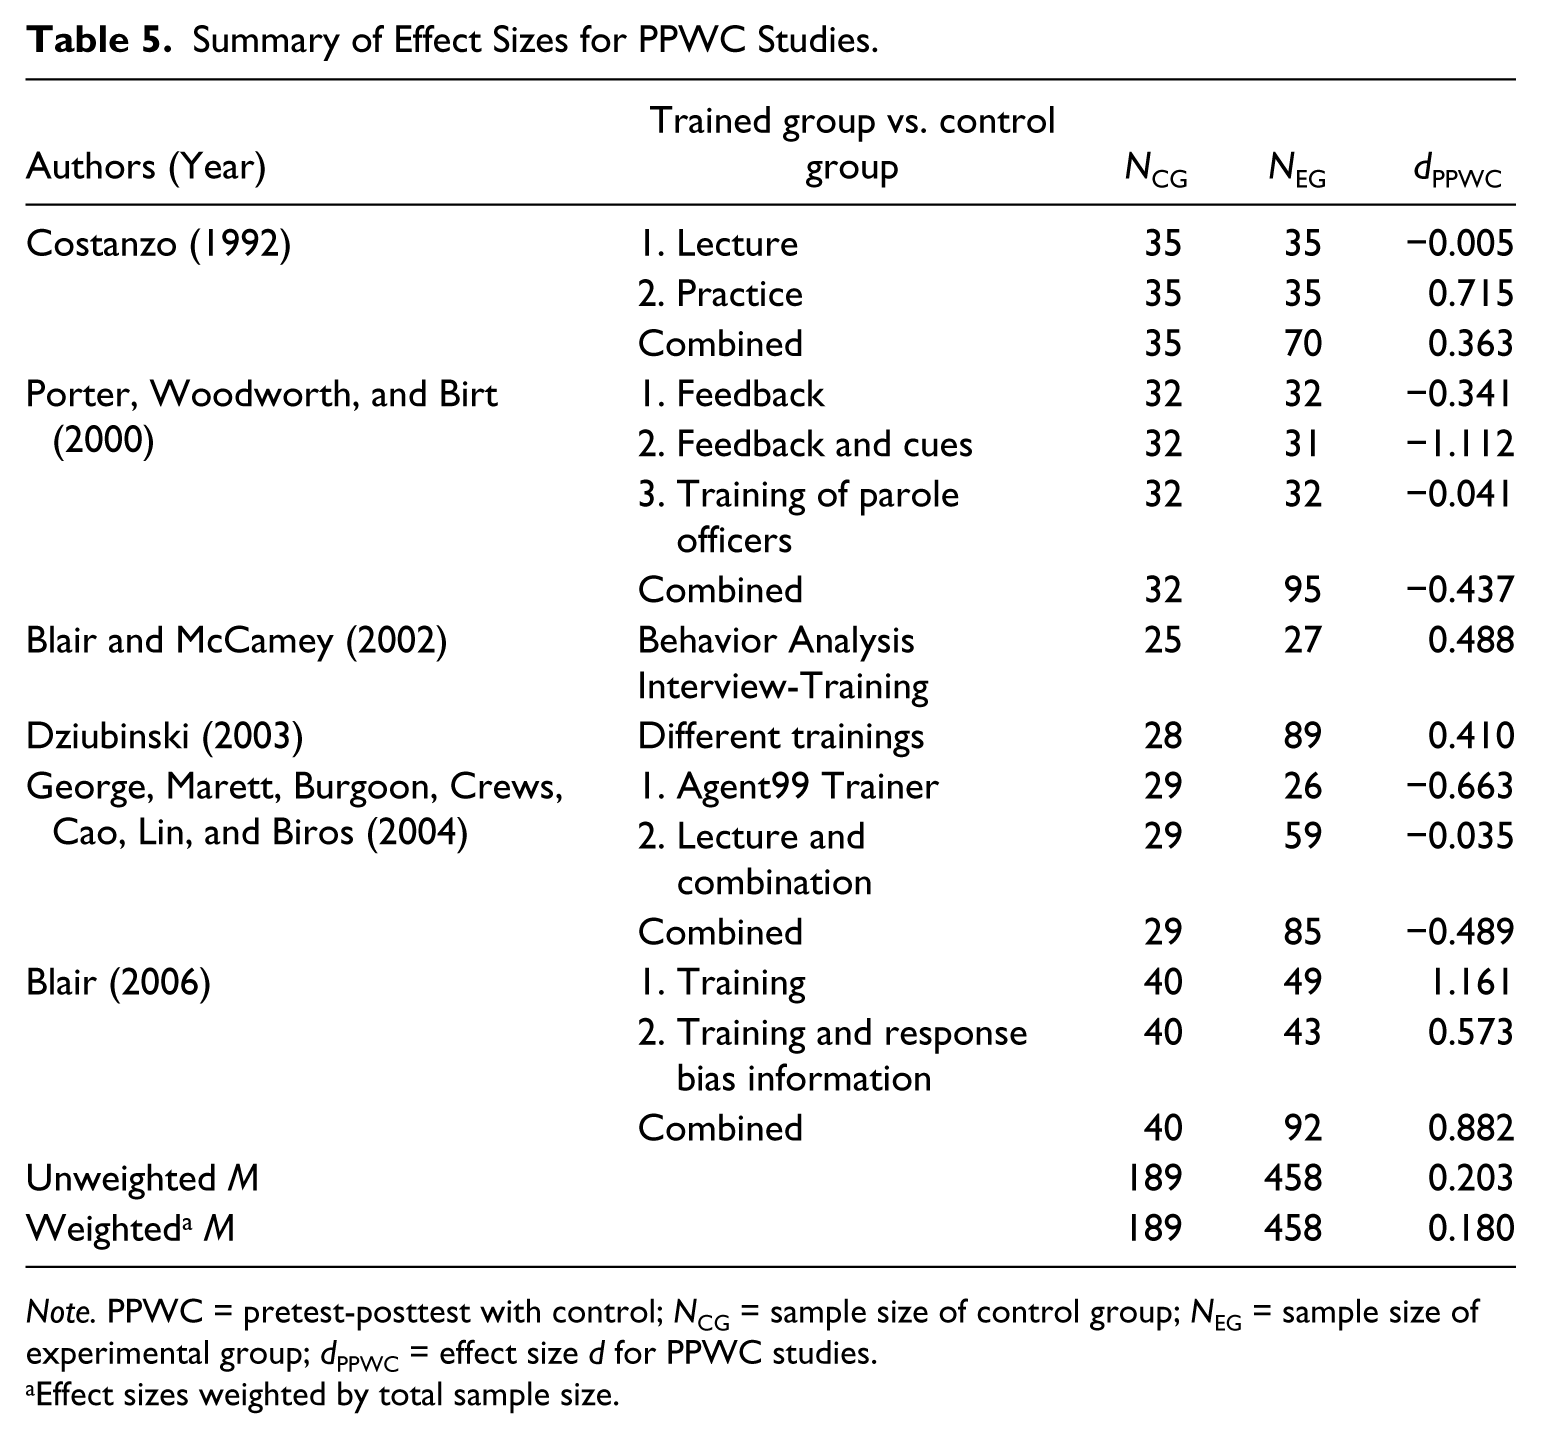
Note. PPWC = pretest-posttest with control; NCG = sample size of control group; NEG = sample size of experimental group; dPPWC = effect size d for PPWC studies.
Effect sizes weighted by total sample size.
Discussion
This meta-analysis showed that training improved the overall ability to detect deception with a small to medium effect size. This finding is especially encouraging if we think about the disillusioning 54% detection accuracy found in Aamodt and Custer’s (2006), as well as Bond and DePaulo’s (2006), meta-analyses. However, the mean training effects observed in our meta-analysis were not as strong as those in Driskell’s (2012) meta-analysis, and many of the cautions spelled out in Frank and Feeley’s (2003) summary still apply for our updated set of studies. Lie accuracy increased with training while there was no significant effect on truth accuracy.
As training effects varied widely, we took a closer look at subgroups of studies differing in training content and other variables to identify the most promising approaches.
Which Trainings Appear Most Promising for Overall Detection Accuracy?
Training on verbal content cues
As hypothesized, training with verbal content cues had the largest training effect on detection accuracy. This could be due to theoretically more differentiated and empirically tested assumptions (e.g., CBCA, RM, and ARJS criteria; Köhnken, 2004; Masip et al., 2005; Sporer, 1998, 2004) of this approach. Also, DePaulo et al. (2003) found higher effect sizes for CBCA and RM verbal content cues than for nonverbal and paraverbal cues in their meta-analysis (but a large-scale meta-analysis of individual verbal content cues is still wanting).
Focusing on verbal content rather than on heuristic cues like nonverbal behavior has also been demonstrated to result in higher detection rates in a series of recent studies based on dual process theories of credibility attribution (Reinhard, Sporer, & Scharmach, 2013; Reinhard, Sporer, Scharmach, & Marksteiner, 2011).
We found additional support for verbal content training within the second meta-analytic approach, where these programs showed a medium size training effect, with the exception of studies by Feeley and deTurck (1997) and Köhnken (1987) who obtained negative training effects.
Multichannel studies
Studies with the use of multichannel training programs showed only a small training effect. The second meta-analytic approach supported this finding: Training programs using only paraverbal cues yielded no training effect, whereas training programs using only nonverbal cues, or a combination of nonverbal and paraverbal cues, showed a marginal training effect. Considering that recent meta-analyses found either no or only faint relations for most nonverbal and paraverbal cues to deception (DePaulo et al., 2003; Sporer & Schwandt, 2006, 2007), people trained to focus on these cues, which were presumably not present in the stimulus material and therefore may simply not be diagnostic for differentiating between truth and deception, are likely to fail.
Although subjective ratings of nonverbal behaviors may be more likely to be associated with deception than more objective frequency counts (DePaulo et al., 2003; DePaulo & Morris, 2004, Hauch et al., 2013), these cues have not been incorporated into the training programs reviewed here (for an exception, see Fiedler & Walka, 1993, who used subjective ratings of channel discrepancies).
Feedback
Feedback studies resulted in a small effect for detection accuracy, as it was expected from the “law of effect” (Thorndike, 1913, 1927). In contrast to the medium effect size (d = 0.41) from Kluger and DeNisi’s (1996) meta-analysis on all kinds of feedback interventions, we found a markedly smaller effect of gu = 0.19. This difference may be explained by the fact that participants in the feedback studies reviewed here only learned about the outcome (truth or lie) and not upon which cues they should have based their judgment (Fiedler & Walka, 1993). In other words, if trainees only learn about the outcome of their judgments, but not what they may have done right or wrong in evaluating signs of deceit or truths, and how to weight these signals (the process of lie detection), we cannot really expect large effects from feedback in this domain.
This is not to say that feedback could not be more beneficial than in the studies reviewed here. For example, training studies using Agent99 Trainer (comprehensive computer training program using a combination of nonverbal, paraverbal, and verbal content cues) evaluated not only the final outcome but also an increase in knowledge, which was tested via pop-up quizzes (Biros, Sakamoto, et al., 2005; George, Marett, Burgoon, et al., 2004). Similarly, more interactive approaches (e.g., Agent99 Trainer) where trainees navigate through the materials taught may be promising, as discussed in Lin, Crews, Cao, Nunamaker, and Burgoon (2003). Unfortunately, reports of these studies (Crews et al., 2007; George, Marett, Burgoon, et al., 2004) did not provide enough statistical details necessary for meta-analytic synthesis or information about the precise content of the training itself.
Finally, neither bogus feedback nor bogus training had any positive or deteriorating effects.
Combinations of approaches
Compared with the mere feedback approach, combining information about nonverbal and paraverbal cues and providing feedback may be more promising. The second meta-analytic approach found that three studies implementing this technique yielded quite large training effects (especially the study by Fiedler & Walka, 1993). Here, participants seemed to have learned to detect particular cues they were searching for and applied them appropriately to make a lie-truth judgment (Fiedler & Walka, 1993). This was demonstrated by conducting a Brunswikian lens model analysis that tests whether people actually use ecologically valid cues for their judgments (Fiedler & Walka, 1993; Hartwig & Bond, 2011; Reinhard et al., 2011; Sporer, Masip, & Cramer, 2014).
Combinations of cue training without feedback (nonverbal, paraverbal, and verbal content) were adapted in three studies indicating quite contradictory effects. For instance, training with the Reid Technique, which is very popular in the United States, resulted in a large positive training effect in Blair’s (2009) study, while it showed a detrimental effect in the study by Kassin and Fong (1999). Methodological differences in participant samples or in stimuli (suspect interviews in actual theft cases in the former, interviews after a mock crime in the latter study) might explain the divergent outcomes.
Is Training Equally Effective for Lie and Truth Accuracy?
Surprisingly, trainings improved only lie accuracy but not truth accuracy (except for verbal content trainings, which were more successful with classifying true stories correctly). To understand this finding, the purpose of training has to be taken into account, which turned out to be an important moderator variable.
When judges were trained to focus on the truth (e.g., using credibility criteria, such as CBCA, which are usually positively associated with veracity; see Landry & Brigham, 1992), truth accuracy was increased; when trained with cues to deception (e.g., speech errors, or adaptors; see deTurck et al., 1997), there was no training effect for truth accuracy. As one cannot infer causal relationships from meta-analytic findings, more direct evidence for a potential response bias shift as a function of training purpose comes from Masip et al.’s (2009) fake training study. They trained participants in two experiments (PPWC design) either to detect deception (with nondiagnostic deception cues), or to detect the truth (with nondiagnostic truthfulness cues), or did not train them at all. Regardless of accuracy, a strong shift in response bias toward the respective direction of the trained cues was found, whereas no response bias shift was observed for untrained control participants. Consequently, the truth bias invoked by teaching verbal content truth criteria (as in the studies in this meta-analysis) usually is likely to result in a truth bias, and hence in a veracity effect (Levine et al., 1999). Unfortunately, it was not possible to test for response bias shifts in this meta-analysis due to missing information (about the truth-lie judgments regardless of accuracy) in most studies. Due to the fact that all content training studies reviewed here utilized truth criteria, in future studies and in training attempts, should be made to avoid such a truth bias shift.
In contrast, no moderating effect of purpose was found for lie accuracy, except for an outlier effect size by Levine et al. (2005, Exp. 4) that was excluded.
Comparison With Driskell’s Meta-Analytic Findings
In the introduction, we addressed several methodological issues in Driskell’s (2012) meta-analysis that may have affected his findings to be different from ours. To begin with, Driskell found a medium training effect in detection accuracy of d = 0.50 compared with a smaller d = 0.33 in this meta-analysis. This difference is probably due to three facts: First, Driskell calculated the weighted average of dependent training groups and treated them as if they were independent. This contradicts the assumption of independent data points in a meta-analysis (Lipsey & Wilson, 2001). We avoided this problem by averaging the individual effect sizes if more than one training group was applied, and by sorting these training groups into one of eight categories to calculate further sub-meta-analyses.
Secondly, our meta-analysis included more studies, both published and unpublished. Thirteen relevant studies (posttest only with control group design) conducted between 1981 and 2009 were not contained in Driskell’s meta-analysis. A separate meta-analysis of these 13 omitted studies yielded a nonsignificant training effect of d = 0.08 (p = .202). Because Driskell’s meta-analysis did not contain these studies, his weighted average effect size of d = 0.50 appears to overestimate the training effect. Furthermore, we analyzed eight additional training studies implementing other experimental designs.
Third, Driskell included only published studies, which is likely to lead to a publication bias, especially when we think of our results that unpublished studies revealed a smaller training effect than published studies.
Despite these differences, there is an interesting feature of Driskell’s review our analyses could not address. He sorted the trained cues according to DePaulo et al.’s (2003) analytical approach. This analysis showed that training programs might be more effective if certain deception cues were included (e.g., cues reflecting more tension, discrepancy, fewer details, fewer illustrators, or phrase repetitions).
Methodological Implications
Reporting standards
There were various shortcomings regarding the reporting of important independent and dependent variables. To evaluate the differential effectiveness of specific training characteristics, their detailed documentation is necessary, which many studies failed to do. To facilitate planning, analyzing, replicating, and comparing training studies in the future, we outline several methodological recommendations.
Most importantly, training studies should report not only overall detection accuracy but also separately lie and truth accuracy rates. In order to investigate the relation between response bias, training, purpose of the training (see Masip et al., 2009), and training effects, means and standard deviations for lie and truth judgments in addition to detection accuracy, lie and truth accuracy are necessary. Signal detection theory (Green & Swets, 1966), as suggested by Meissner and Kassin (2002), Sporer (2004), and Masip et al. (2009), should be utilized to differentiate training effects from response bias.
Researchers should draw on a theoretical framework to specify hypotheses and to design training interventions and their components. To understand and evaluate the effectiveness of these components, the very content of a training program and the specific cues should always be described, especially for multichannel programs or combinations of different training strategies. Without these details, the chances to replicate training success are practically impossible. Information about the training procedure (intensity, duration, group size, trainer presence, etc.) should always be described.
Experimental design issues
With regard to experimental designs (see Table 1), we make several methodological suggestions. Although most training studies were designed with the POWC, Campbell and Stanley (1963) cautioned researchers about the fact that the experimental and control groups may not be equal before treatment. They further recommended always randomly assigning participants to the conditions. Using a pretest could establish group equivalence before interventions. With the OGPP, the pretest-posttest changes may have been due to a training effect, but could also have been produced by other change-producing events (history), physiological or psychological processes such as fatigue or boredom (maturation), or to the effect of testing itself.
The most extensive and time-consuming PPWC was utilized in six studies. This design controls for many alternative explanations and allows for a better understanding of the underlying mechanisms (for an excellent discussion of program evaluation research, in particular, process and outcome evaluation, see Rossi, Lipsey, & Freeman, 2009).
Whenever researchers decide to train professionals, they should include a control group of lay persons. If only police officers were trained without a pretest (e.g., Köhnken, 1987; Vrij, 1994), or without a control group of lay persons, we do not know how accurate these officers were without training, or whether the professional groups’ detection accuracy differs compared with the ability of lay persons. When only professional groups are compared before and after training, we do not know whether the pretest itself sensitized them to become better, or if lay persons may have performed better (see Shadish, Cook, & Campbell, 2002).
A specific issue in deception research is the question whether a sender provides both a truthful and a deceptive account (within-participants design), or only one account (between-participants design). Surprisingly, our results showed no differences regarding training effectiveness.
Another deception specific question is whether researchers should or should not inform their participants about the lie/truth base rates of senders’ stories. Detection accuracy was higher for trained compared with control judges in studies with base rate information. Because base rates are rarely known in real life, using 50-50 base rates as in most studies may jeopardize ecological validity of findings when different base rates are likely for certain types of lies.
Problems of ecological validity: sender motivation
Last but not least, a prevailing problem of all deception studies is the lack of negative consequences to senders in cases of detection (Miller & Stiff, 1993). The question arises whether money or the awareness that a mock crime was staged motivates participants in an experiment sufficiently to be comparable with suspects in police interrogations, defendants in the courtroom, or other high stake situations such as business or political negotiations, or in personal relationship contexts.
Although the moderator of sender motivation across all studies did not show any differences, there were simply too few studies with high sender motivation to draw any firm conclusions. When looking at studies focusing on nonverbal cues only, effect sizes were larger when sender motivation was medium (gu = 0.451) than with no motivation (gu = 0.011). For verbal content cues trainings, the two studies that used high motivation material yielded nonsignificantly larger effect sizes (gu = 0.895) than the five no motivation studies (gu = 0.590). This could be interpreted as evidence for a motivational impairment effect, but other differences between the small sets of studies could also be responsible for the (lack of) differences.
Perhaps, researchers should attempt to apply paradigms in which senders are motivated by the opportunity to escape mild punishment (within ethical limits) in case of detection, rather than being motivated by money or through a mock crime. For example, researchers could give participants money first for taking part in the experiment, but tell them that they have to pay back large portions if their lies are detected. For applications in criminal justice contexts, researchers might also use corroborated cases of perjury, or of true versus false alibis.
Practical Implications
On the basis of the present meta-analytic results, we venture some recommendations for conducting training programs to maximize training effects.
Content of the training
Because training programs including verbal content cues (such as CBCA, RM, or ARJS) led to highest training effects, we recommend the use of these cues in future training programs. Cue selection should be based on effect sizes from past studies, not on vote-counting (as in Masip et al., 2005; Vrij, 2005, 2008). Because some of the training effects and the cues used may be domain specific, trainings should take that into account when selecting cues.
As most verbal content training studies utilized truth criteria, attempts should be made to avoid a response bias toward the truth. Perhaps, using feedback in addition to verbal content cues might be worth exploring.
Presentation format
A training program should include written instructions about the training content—either on its own or in combination with a (video) lecture session. Surprisingly, if participants were trained via a (video) lecture session only, the training was not effective at all. This could be due to the opportunity for participants to reread instructions and internalize the training content at their own pace and return to any section for clarification.
Use of examples
Trainees should practice their abilities with examples from different senders, although we did not find an advantage for using examples per se. Trainees should learn to become more familiar with the cues and their coding/rating with different types of accounts from different contexts. Also, practice has been demonstrated to improve reliability of coding (Küpper & Sporer, 1995).
Duration and number of training sessions
The tendency that longer training sessions are more effective than shorter ones leads us to recommend a minimum length of 60 minutes or more, depending on content and use of examples.
Even when short-term training effects could be demonstrated, long-lasting training effects should be investigated using follow-up posttests with different delay intervals to capture long-lasting training effects. We recommend multiple training sessions (e.g., Akehurst et al., 2004) for professionals such as forensic psychologists, police officers, or judges to ensure that the training content will be retained and refreshed (for general guidelines on how to conceptualize training programs, see Docan-Morgan, 2007).
Counteracting biases of professional groups
As outlined earlier, some professional groups tend to have a lie bias (e.g., Meissner & Kassin, 2002). Therefore, training these professionals with verbal content cues related to the truth may counteract their lie bias.
Furthermore, professionals who have been involved in the practice of detection of deception for years might be somewhat reluctant to accept training contents offered by psychologists, particularly when the stimulus materials appear to lack face validity. For example, police officers might be “out of practice at being taught” (Akehurst et al., 2004, p. 888) and hence show difficulties learning a comprehensive credibility assessment method, which may contradict some of their personal on the job experience.
In general, we suggest that a training program should be customized to the specific needs, level of knowledge, and expertise of law enforcement personnel (see also Docan-Morgan, 2007).
Limitations
In the following, we address four potential limitations that should be kept in mind when interpreting the results of this meta-analysis.
First, when looking at mean effect sizes, one should never do this without taking into account their variance. For any meta-analysis, different subclasses of persons, training programs, outcomes, settings, or times can lead to large heterogeneity (Matt & Cook, 2009). As we observed large heterogeneity, especially for overall detection accuracy and truth accuracy, we addressed this issue by conducting several moderator analyses. (We also calculated random effects models that yielded comparable conclusions, available from the authors.)
Second, conducting several moderator variable analyses by blocking studies into different subgroups (as is done in many meta-analyses) may lead to a confounding of moderator variables, which poses a threat to generalized inferences (Matt & Cook, 2009; Pigott, 2012). In the present meta-analysis, many moderator variables were at least partially confounded with each other. Therefore, we had inspected cross tables of moderators and their intercorrelations to assure a sufficient number of studies in each subgroup for tests to approach independence (analogous to orthogonality of contrasts in ANOVA). Meta-regression analyses may have been a better solution to this problem (Pigott, 2012), but the limited number of studies made us decide against this solution.
Third, our moderator analysis yielded a publication bias (Lipsey & Wilson, 1993; Sporer & Cohn, 2011) despite our attempts to avoid such a bias by including almost 30% unpublished studies. All authors were contacted and asked for further (unpublished or submitted) experimental training studies in order to counteract publication bias before meta-analytic syntheses were conducted.
Fourth, all training studies were laboratory experiments in which independent variables were varied and manipulated. Because the ground truth in real world settings cannot be established with certainty, it is a challenge for researchers to create and evaluate training programs with real life events (e.g., witness or suspect statements).
Conclusions
Although training studies were quite heterogeneous with respect to their effect size, content, and operationalization, we found a small to medium training effect for overall detection accuracy and lie accuracy, but not for truth accuracy. Truth accuracy was only improved if verbal content cues to detect the truth were utilized, although this result should be interpreted with caution, because it could be due to a shift in response bias toward correctly detecting the truth. Training with verbal content cues yielded the highest training effect, whereas training with nonverbal cues, paraverbal cues, or feedback resulted in quite small or nonsignificant training effects. Therefore, researchers and practioners should not base their trainings on these unreliable cues but focus on verbal content training.
Footnotes
Appendix A
Appendix B
Appendix C
Acknowledgements
Grateful thanks are due to those researchers of primary studies who took the effort to respond to our inquiries as well as to reviewers of previous versions of this article for their fruitful and inspiring comments and suggestions. The authors also wish to thank Dr. Iris Blandón-Gitlin for her insightful comments on a previous version of the article.
Declaration of Conflicting Interests
The authors declared no potential conflicts of interest with respect to the research, authorship, and/or publication of this article.
Funding
The authors received no financial support for the research, authorship, and/or publication of this article.