
Abstract
The primary aim of this study is to determine the extent to which the consideration of strengths enhances the predictive validity of risk assessment protocols applied to correctional populations. Data from the Service Planning Instrument (SPIn) Pre-Screen were analyzed for 3,656 adult offenders bound by provincial supervision across Alberta, Canada. The predictive validity of the screening instrument was equivalent across gender and Aboriginal status (areas under the curve [AUCs] = .75-.77). Hierarchical logistic regression revealed significant main effects for risk and strength subtotals in predicting new offenses over 18 months for the overall sample, indicating that the inclusion of strengths adds uniquely to the prediction of recidivism. The overall model yielded a significant Risk Score × Strength Score interaction, illustrating that high strength scores are particularly effective in attenuating recidivism among higher risk cases. Rather than limit their consideration to case management contexts, results support the integration of strengths into quantitative assessments of criminal risk.
Keywords
In an effort to reduce recidivism rates, correctional psychologists have traditionally been guided by a deficit-based framework that prioritizes the identification of risk factors and the targeting of criminogenic needs (e.g., criminal attitudes, poor family functioning, antisocial peers). In review, the core principles underlying contemporary correctional assessment and intervention are operationalized through the risk, need, and responsivity (RNR) model (Andrews & Bonta, 2010; Andrews et al., 1990). Beyond ensuring a proportional relationship between treatment intensity and one’s level of risk (risk principle), RNR proponents posit that effective correctional treatment should prioritize dynamic risk factors (criminogenic needs) or individual-level deficits that evidence the strongest empirical relationship to recidivism (need principle).
Along with socio-demographic factors such as gender, race, and social class, individual-level characteristics such as intelligence and personal strengths are conceptualized as responsivity factors under the RNR model. Although they are said to merit consideration in program delivery so as to optimize treatment efficacy, they are not explicitly factored into risk assessment protocols (Andrews & Bonta, 2010; Andrews, Bonta, & Wormith, 2006). Some have argued that strengths have limited utility because they are simply the inverse of risk factors or the absence of risk altogether (e.g., Baird, 2009). Although the identification of strengths is sometimes encouraged in some risk assessment settings for case management purposes, these items are not quantitatively tabulated into overall risk scores, nor do they determine correctional decisions around offender classification.
Despite traditional protocol, complementing the study of static and dynamic risk factors with the study of strengths is compatible with several theoretical perspectives. From a general standpoint, this framework aligns itself well with Seligman’s (2002) movement toward positive psychology—that is, shifting from the study of psychopathology to the study of an individual’s skills, strengths, virtues, and enhancement of well-being. Moreover, a focus on strengths is compatible with the study of resilience in health and developmental psychology; the latter entails the identification of factors that serve to inoculate otherwise high-risk individuals against the onset or development of negative health or behavioral outcomes (Rutter, Giller, & Hagell, 1998).
Interest in the exploration of strengths has since begun to infuse criminology and correctional psychology. In an effort to forecast future delinquency, developmental criminologists encourage the consideration of both risk and strength factors along the developmental trajectory (e.g., Farrington, 2003). Notably, in an effort to understand the mechanisms underlying one’s transition out of crime, the literature on criminal desistance actively supports the identification of strengths in the form of external circumstances (e.g., prosocial bonds), personal qualities (e.g., academic ability), or internal processes (e.g., optimism regarding one’s ability to lead a prosocial life; Burnett & McNeill, 2005; Maruna, 2001; Serin & Lloyd, 2009).
Certain research camps also prioritize strengths enhancement in treatment contexts. Ward et al., for instance, advocate placing more explicit emphasis on the structuring and attainment of prosocial goals through the Good Lives Model of offender rehabilitation (Ward & Brown, 2004; Ward, Yates, & Willis, 2012). Similarly, feminist scholars advocate a holistic approach to the treatment of female offenders, specifically recommending that programming aims to enhance skills and competencies (Covington & Bloom, 2007; Hannah-Moffat & Shaw, 2001; Morton & Leslie, 2005; Van Dieten, 2006; van Wormer, 2010). For example, Moving On (Van Dieten, 2006) is an intervention program designed specifically for justice-involved women. Grounded in relational theory (i.e., emphasizing human connectedness as a basic motive), the program integrates strengths-based and cognitive behavioral intervention strategies. The primary goal is to assist women in mobilizing and developing personal and social resources that are apt to attenuate risk of future criminal behavior (e.g., honing coping strategies, forging community connections, fostering healthy relationships, etc.). A recent evaluation suggested that in contrast to a traditional probation group, a matched sample of 300 women who participated in the Moving On program demonstrated significant reductions in recidivism at 6-, 12-, and 30-months follow-up (Gehring, Van Voorhis, & Bell, 2010).
Strengths: Reconciling Definitions
Relative to the study of risk factors in correctional psychology, there is a dearth of research on the range of strengths that may buffer the onset or thwart the progression of antisocial behavior. Of the extant literature, there are inconsistencies in the very manner in which strengths are termed, conceptualized, and measured. Both colloquially and throughout published research, a “protective factor” is often broadly and simply applied to denote a negative correlate of an undesirable outcome (e.g., Borum, Bartel, & Forth, 2006). In contrast to this inclusive interpretation, the authors prefer to use the definition originally adopted in the study of resilience; that is, a genuine protective factor refers to a variable that interacts with one or more risk factors to reduce the probability of a negative outcome (Masten, 2001). According to the latter conceptualization, individual variables or a combination thereof are protective if and only if they yield a statistical interaction (or moderating effect) with one’s overall level of risk (Rutter et al., 1998). Consistent with the definition applied in the literature on desistance, a protective factor is not the polar opposite of a risk factor, nor does it constitute the absence of risk; rather, a protective factor can exist concurrently with a series of risk factors, and account for variability in outcome among an otherwise high-risk group of individuals (Laub, Nagin, & Sampson, 1998; Sampson & Laub, 2005).
To summarize, we apply the label strength as an umbrella term to broadly denote a positive or prosocial facet of an individual’s life that, on the basis of face validity, is intuitively apt to buffer risk of criminal outcome. The term promotive factor is used to define a variable that evidences a negative correlation with recidivism across all levels of risk (e.g., Farrington, 2003). Finally, a protective effect is said to occur when a variable (or combinations thereof) attenuates criminal outcome in higher risk groups, but exerts significantly lesser impact in lower risk groups (e.g., Sampson & Laub, 2005).
Why Consider Strengths?
The pioneering study of Kauai youth by Werner (2005) heralded the concept of “protective factors” in buffering the effect of adverse childhood circumstances. Specifically, her research illustrated how the presence of strengths in disadvantaged youths is capable of reducing the impact of adversarial factors on adult outcomes, including criminal justice involvement. The 40-year longitudinal study followed a total of 698 participants from birth. Approximately 30% of the cohort (n = 210) experienced multiple risk factors in childhood including poverty, pre- or perinatal complications, family discord, and parental psychopathology. Not surprisingly, two thirds of these at-risk youths experienced negative outcomes by adolescence including learning and behavioral problems, delinquency records, and mental health issues. However, the remaining one third of the disadvantaged youths exhibited a resilient pattern in the face of early risk markers and became well-adjusted adults. Specifically, this subgroup achieved educational milestones, maintained steady employment, created a secure family structure, and remained free of criminal justice involvement. Their achievements in the areas of education and employment matched or even exceeded those of their counterparts with socially and economically privileged backgrounds.
Ultimately, Werner (2005) determined that a number of individual-, family-, and community-level protective factors distinguished these resilient youths from their high-risk counterparts who experienced negative outcomes. The key strengths identified among the former were refined problem-solving skills and high self-efficacy. Additional strengths characterizing resilient youths were relational in nature and consisted of close emotional bonds with at least one competent “surrogate” caregiver (e.g., grandparent, aunt/uncle, etc.), and a prosocial network within the greater community to offer emotional support in times of crisis (e.g., involvement in a church group).
The Werner (2005) study is a palpable illustration of the co-existence of risks and strengths within an individual, both components exerting an impact on one’s ultimate likelihood of experiencing a negative outcome. The literature on criminal desistance confirms this notion and clearly suggests that the consideration of strengths offers unique information that cannot be inferred from the measurement of risk and need factors alone. Namely, there is evidence to suggest that pathways toward crime desistance are distinct from pathways toward crime initiation. As such, it follows that the former involve more than the simple remediation of deficits or criminogenic needs (Kosterman et al., 2005; Laub et al., 1998; Stouthamer-Loeber, Wei, Loeber, & Masten, 2004). More specifically, standard criminogenic needs linked to antisocial conduct have been shown to wane in predictive power over an offender’s life course, and extinction of those risk factors does not fully account for eventual desistance (Lloyd, 2007). This finding is particularly important, as it implies that adopting a concurrent strengths-based approach may actually complement traditional risk assessment protocols by adding incremental validity to the prediction of criminal outcome.
Focusing primarily on adult offender populations, strengths or “protective factors” commonly identified in desistance research include marital commitment (Horney, Osgood, & Marshall, 1995) and attachment to employment goals (Blokland & Nieuwbeerta, 2005), both of which are associated with decreases in criminal activity among otherwise high-risk groups. Although marriage and gainful employment represent external circumstances, recent research has also identified certain cognitive processes that underlie a cessation or attenuation of criminal activity—these include self-efficacy regarding one’s ability to desist from crime, beliefs supportive of desistance and unsupportive of crime, and the ability to identify factors integral to leading a prosocial life (Lloyd, 2007; Serin & Lloyd, 2009). Although such factors are termed “protective” in the literature, the methodologies used in the aforecited investigations render it impossible to ascertain whether statistically, these factors are simply promotive (i.e., negatively correlated with outcome) or additionally protective (i.e., yield a statistical interaction with risk level). Namely, no attempt was made to study the relationship of strengths to negative outcome across different levels of risk.
Although the empirical study of strengths and their role in risk assessment is relatively nascent, there is some preliminary yet compelling evidence from juvenile justice studies to suggest that promotive factors contribute incrementally over and above risk/needs to the prediction of recidivism. Beyond demonstrating that risk/need and strength subscores are each individually predictive of recidivism, further research suggests that strengths offer unique information in risk assessment contexts. Based on a sample of adolescent males, Lodewijks et al. found that total “protective” scores (i.e., promotive scores, by current definitions) on the Structured Assessment of Violence Risk in Youth (SAVRY; Borum et al., 2006) improved the accuracy of the tool over total risk scores with respect to predicting institutional aggression against persons (Lodewijks, Doreleijers, de Ruiter, & Borum, 2008). Jones (2011) similarly found that the aggregate promotive score on the Youth Assessment and Screening Instrument (YASI; Orbis Partners, 2000) enhanced the accuracy of the tool beyond the overall risk score in predicting new convictions over a 2-year period with a New York State sample of young female probationers.
Recently, strengths-based assessment protocols adhering to the structured professional judgment (SPJ) approach have been introduced either as adjuncts to extant risk/needs measures in the assessment of future violence (e.g., Structured Assessment of Protective Factors [SAPROF]; De Vogel, De Ruiter, Bouman, & De Vries Robbe, 2009) or as a clinical guide to generate discussion around dynamic strengths and vulnerabilities (Short-Term Assessment of Risk and Treatability [START]; Webster, Martin, Brink, Nicholls, & Desmarais, 2009). Although both of these instruments have been shown to predict the absence of violence among adult forensic psychiatric populations (e.g., Abidin et al., 2013; Wilson, Desmarais, Nicholls, & Brink, 2010), only the SAPROF has demonstrated incremental validity over and above the Historical, Clinical, Risk Management–20 (HCR-20; Webster, Douglas, Eaves, & Hart, 1997), a widely adopted SPJ risk/needs tool (Abidin et al., 2013). Despite such promising results, particularly in the case of the SAPROF, it should be noted that in practice, any quantification of strengths by SPJ tools are simply used to guide practitioners in their final clinical judgment.
Current Study
Ultimately, quantifying the effects of strengths may help to increase the predictive accuracy of risk assessment tools and have important implications for supervision practices. To the authors’ knowledge, there exists only one peer-reviewed study to specifically examine the incremental contribution of strengths in risk assessment contexts with a juvenile justice sample (i.e., Lodewijks et al., 2008). There is a virtual absence of literature on the relative predictive role of strengths over and above risk/needs in forecasting general recidivism among adult offender populations. Furthermore, it is unclear whether strengths will exert a similar impact across gender and ethnicity.
The current research features the Pre-Screen version of the Service Planning Instrument (SPIn; Orbis Partners, 2003). A risk assessment tool implemented in a number of jurisdictions and correctional service organizations, this protocol is administered to both male and female adult offenders under correctional supervision in community and custodial settings. Relative to most mainstream risk/needs assessment tools, the SPIn is relatively unique in its construction. Theoretically and empirically derived, the protocol is a stand-alone comprehensive measure featuring a series of risks, needs, and strengths.
At the item level, strengths are specifically quantified for personal and social resources, skills, and positive attitudes. This is contrasted with the approach adopted by the Level of Service/Case Management Inventory (LS/CMI; Andrews, Bonta, & Wormith, 2004), where strengths are incorporated as dichotomies at the domain level to indicate whether any strengths are globally present for a given domain (without a numerical score). Again, the calculation of strength scores in the SPIn also varies from the use of strengths components in SPJ models. SPIn users score most strength items using Likert-type scales that can be summed to produce both domain totals and an overall strength score used to determine offender classification. Just as scales are used to quantify the level of individual needs in most assessment protocols, SPIn additionally assesses the levels of identifiable strengths across a range of items. By ascribing a quantitative score to strengths, it becomes possible to empirically determine whether these add incremental value to the prediction of recidivism. Accordingly, the current research seeks to answer the following questions:
What is the predictive validity and utility of SPIn risk (i.e., a combination of risk/needs) and strength scores (and resultant classifications) across gender and Aboriginal status? The SPIn was constructed on the basis of theory and empiricism grounded in mainstream correctional literature (i.e., Andrews & Bonta, 2010). The preponderance of this research suggests that overall, “gender-neutral” instruments similar to the SPIn predict recidivism with an equal degree of accuracy across demographic groups (Andrews et al., 2012; Jones, 2011; Olver, Stockdale, & Wormith, 2009; Rettinger & Andrews, 2010). As such, parity is also expected of the SPIn when comparing levels of predictive accuracy across gender and Aboriginal status.
Will the quantitative inclusion of strengths (i.e., promotive factors) enhance the predictive validity of the SPIn while controlling for the aggregate risk/needs score? According to the desistance literature, strengths are conceptualized as distinct and unique from risk, providing additional information that cannot be extracted from the consideration of risk/needs alone (e.g., Stouthamer-Loeber et al., 2004). Based on the preliminary findings reported by Lodewijks et al. (2008) that strengths offer an incremental contribution to risk assessment in juvenile justice contexts, it is hypothesized that similar results will emerge with the SPIn Pre-Screen.
Do the strengths included on the SPIn Pre-Screen collectively yield a protective effect? That is, will high strength scores buffer criminal outcome to a significantly greater extent in high-risk compared with low-risk cases? The exploration of genuine protective effects in criminal risk assessment research is relatively novel. Given the definitional discrepancies in the literature, the extent to which a collection of factors is promotive (i.e., negatively correlated with recidivism outcome) or genuinely protective with respect to buffering criminal outcome (i.e., additionally yields a statistical interaction with risk level) is currently unclear. As such, the question of whether a veritable protective effect will emerge is exploratory.
Method
Sample
The current sample was drawn from a pool of 18,674 SPIn (Orbis Partners, 2003) Pre-Screen assessments completed across Alberta, Canada, between January 2009 and May 2011. Setting an 18-month follow-up inclusion criterion, the final sample comprised 694 female and 2,962 male adult offenders serving community sentences.
The sample’s mean age at intake was 33.47 years (SD = 11.39, range = 17.60-87.90). Participants were predominantly White (67.0%; n = 2,002 males and 446 females) and Aboriginal (17.4%; n = 460 males and 175 females), followed by Black (Caribbean or African descent; 3.7%), Asian (2.9%), East Indian (2.5%), and other (6.6%). In terms of legal history, 53.4% had been convicted of previous offenses and 35.5% had been incarcerated at least once. Disaggregating by offense type, more than half the sample (53.9%) had a current or previous conviction for the commission of a violent crime, 37.5% for a property offense, 18.1% for a drug-related crime, and 4.6% for a sex offense.
Measure: The SPIn
The SPIn was designed to fulfill both assessment and case management functions in adult offender populations under community supervision and in custody. The Full Assessment version, used for service planning primarily with medium- and high-risk cases, includes 90 items tapping risks, needs, and strengths across 11 domains: criminal history, response to supervision, aggression/violence, substance abuse, social influences, family, employment, attitudes, social/cognitive skills, stability, and mental health.
Also featuring a breadth of risks (criminogenic static factors), needs (criminogenic dynamic factors), and strengths, the SPIn Pre-Screen comprises a 35-item subset of those items contained in the Full Assessment and is used for initial triage and classification purposes. As such, the Pre-Screen is most relevant to evaluating predictive validity. Importantly, the SPIn Pre-Screen is comprised of 11 strengths and 39 risks and needs (see Appendix A for a complete list). As mentioned above, the SPIn is available in both Pre-Screen and Full Assessment form. In each case, the protocol is scored on the basis of a semi-structured interview and a systematic review of collateral sources including police files, correctional services records, mental health reports, and any other relevant documentation.
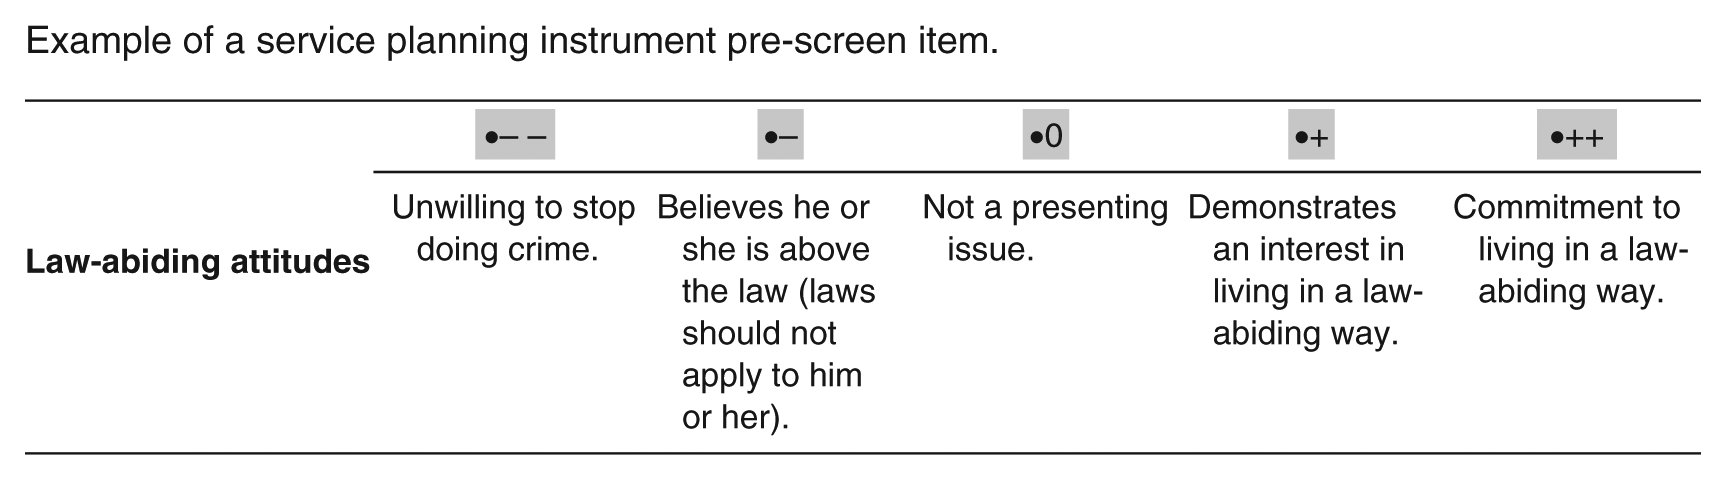
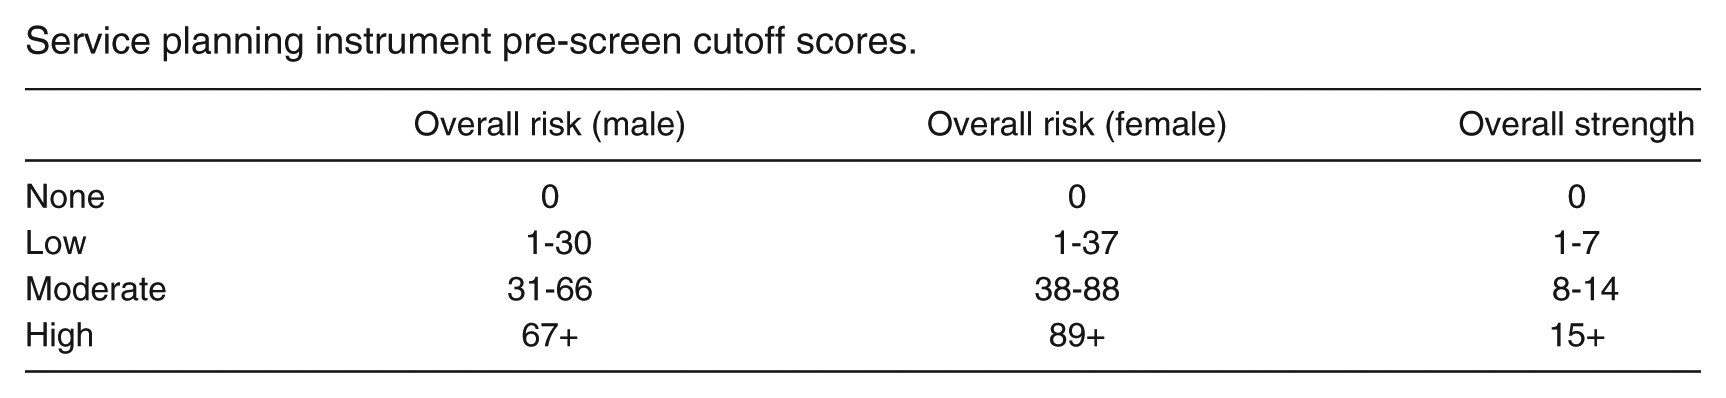
Individual items featured on the SPIn Full Assessment and Pre-Screen are scored on Likert-type scales, comprising up to six response options to maximize the sensitivity of the measure and enhance its capacity to quantify incremental change (see example in Appendix B). Pre-Screen items are weighted according to both empirical and theoretical considerations, after which they are summed to produce a total risk score (based on static and dynamic items) and a total strength score. On this basis, an offender can be classified as low, moderate, or high on both risk and strength scales. For example, one could conceivably be classified as not only high-risk but also high-strength. Available in Appendix C, cutoff scores for each category differ by gender. Determined from a preliminary recidivism study based on a 6-month follow-up period, cutoffs were set in accordance with the distribution of data across risk and strength categories so as to maximize the separation of recidivism rates across low, moderate, and high categories. The department of the Alberta Justice and Solicitor General provided Orbis Partners with a data file containing records on all new instances of arrest, offense types, and admissions to custody.
Results
Over a fixed 18-month follow-up period, 19.9% of the overall sample was re-arrested for the commission of a new offense. Table 1 presents a more detailed disaggregation of recidivism rates by gender and ethnicity (Aboriginal vs. non-Aboriginal) as defined by new offenses, new violent offenses, new convictions, and new convictions for violent offenses. Across all forms of recidivism, male rates significantly exceed those of females, and Aboriginal offender rates significantly exceed those of non-Aboriginal offenders.
Recidivism Rates Across Gender and Aboriginal Status
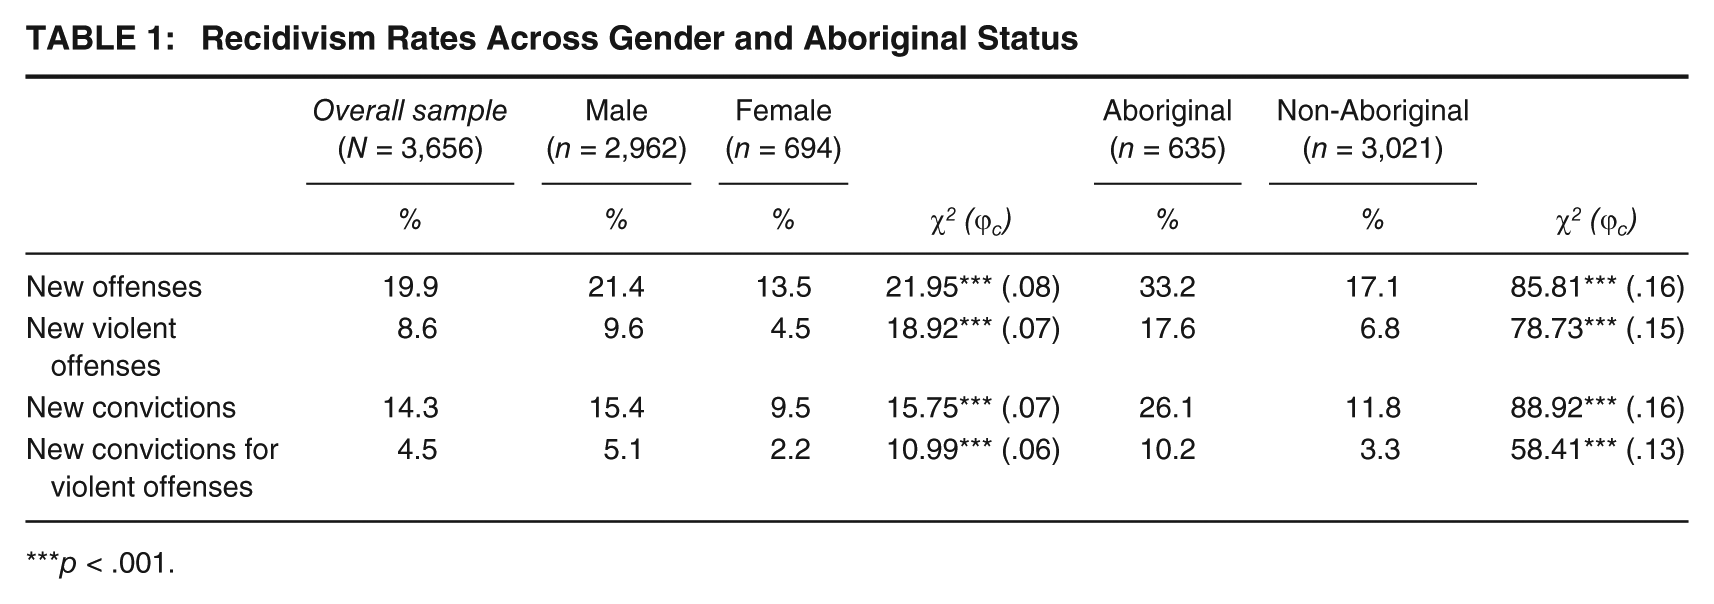
p < .001.
As shown in Table 2, the average total risk score for males (M = 36.22) is significantly higher than that of females, M = 31.94, t(1069.11) = 3.78, p < .001, d = .16, whereas the average total strength total score is statistically equivalent across gender. On disaggregating the sample by ethnicity, Aboriginal offenders attained a significantly higher mean risk score (M = 49.35) than did non-Aboriginal offenders, M = 32.47, t(959.13) = 13.25, p < .001, d = .60, and a significantly lower strength score, M = 9.10 versus 11.15, t(3654) = −9.16, p < .001, d = .41.
Mean Risk and Strength Scores Disaggregated by Gender and Aboriginal Status
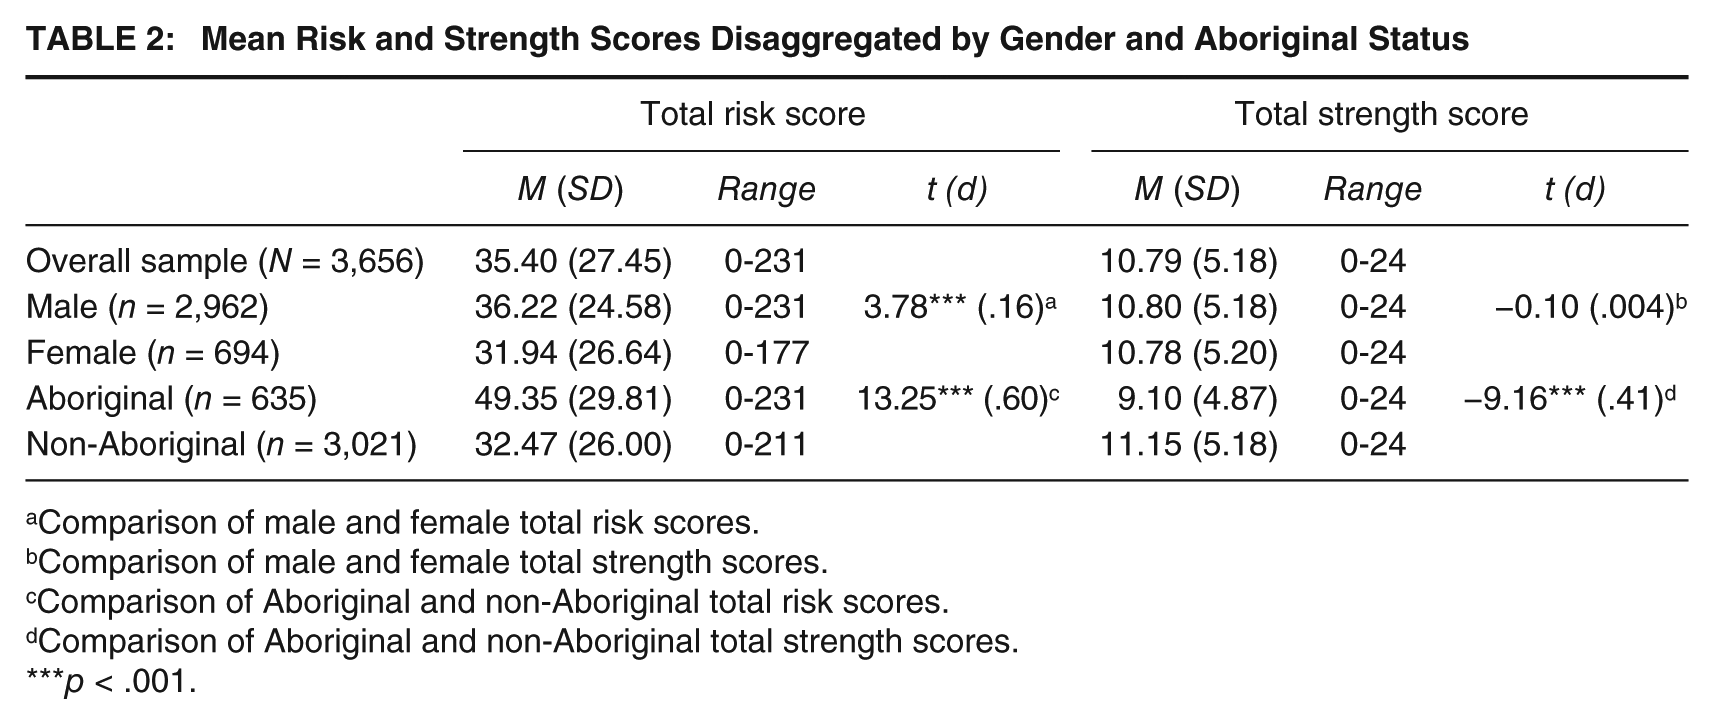
Comparison of male and female total risk scores.
Comparison of male and female total strength scores.
Comparison of Aboriginal and non-Aboriginal total risk scores.
Comparison of Aboriginal and non-Aboriginal total strength scores.
p < .001.
Table 3 illustrates significant increases in recidivism rates defined by new offenses over 18 months across risk classifications for all subsamples (e.g., 8.6%, 26.9%, 54.4% for low, moderate, and high categories, respectively; χ2(2) = 512.49, p < . 001, ϕc = .37). 1 Given recommended adjustments in categorical cutoffs so as to prevent the over-classification of female offenders, the proportions of male and female recidivists within each risk category are statistically equivalent according to results of chi-square tests presented in Table 3. However, consistent with the literature (e.g., Rugge, 2006), Aboriginal re-offense rates are significantly higher than those of non-Aboriginal offenders across all risk categories.
Comparing Rates of New Offenses Over 18 Months by Gender and Aboriginal Status According to SPIn Pre-Screen Risk and Strength Categories
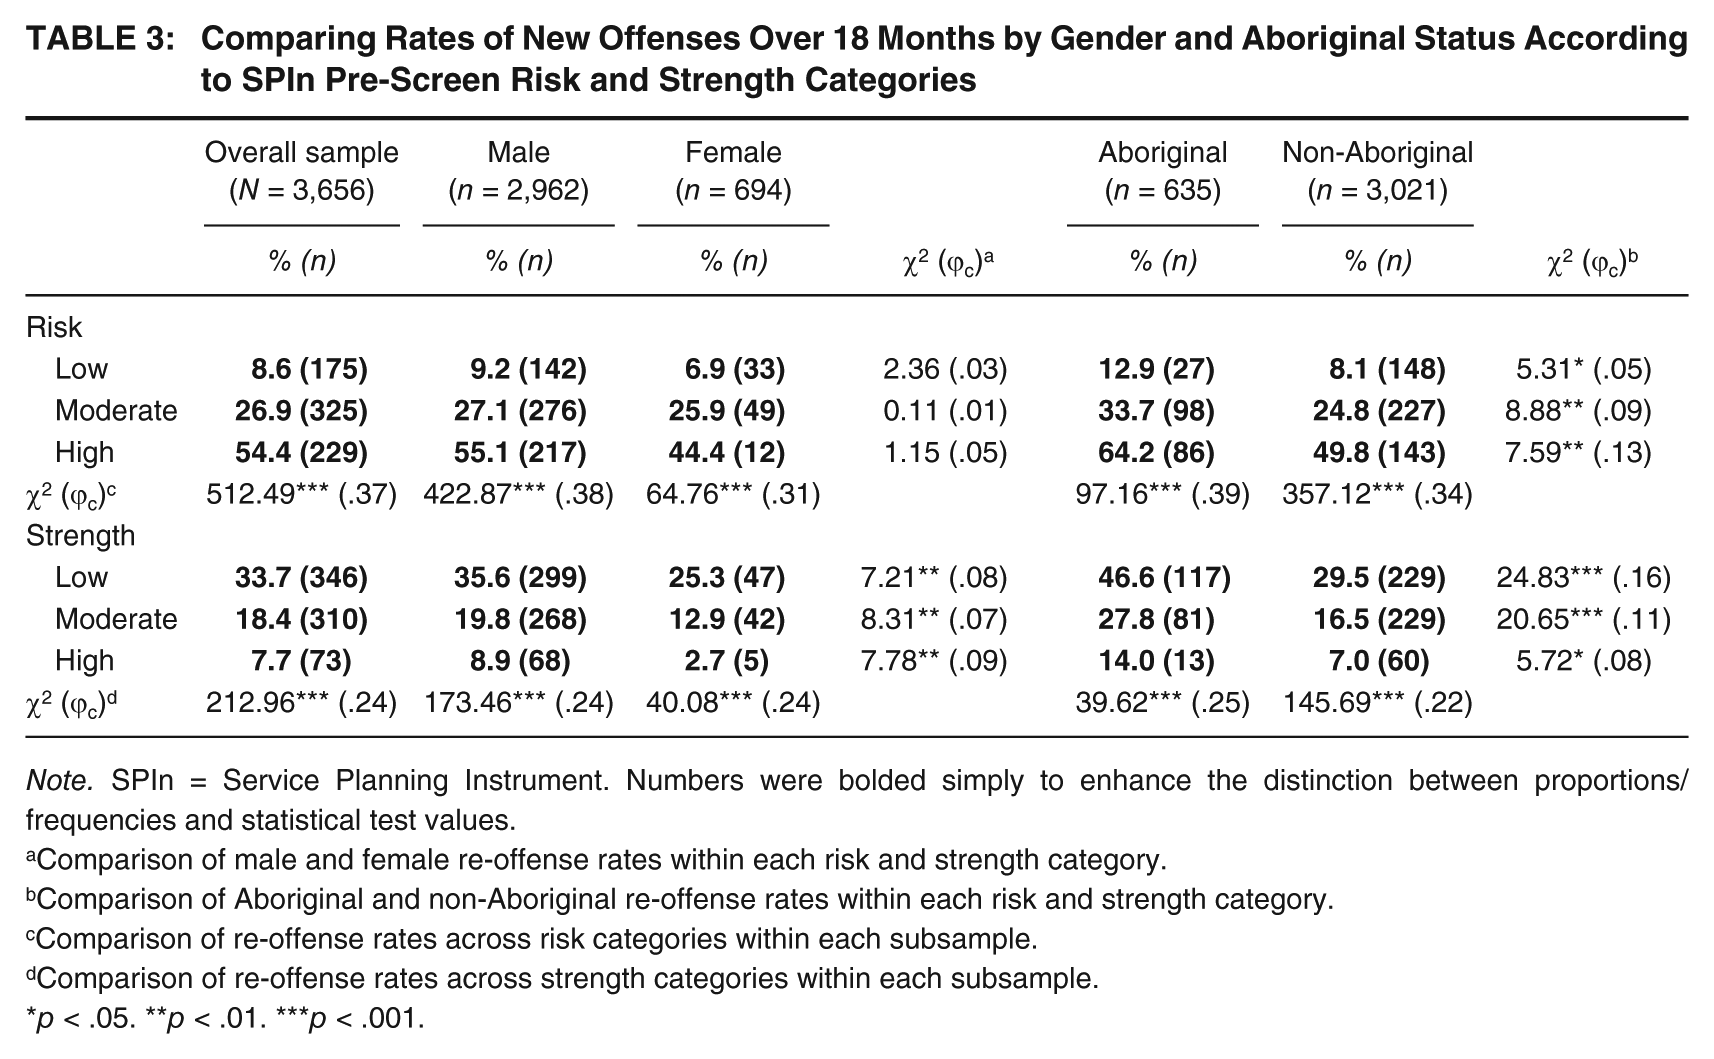
Note. SPIn = Service Planning Instrument. Numbers were bolded simply to enhance the distinction between proportions/frequencies and statistical test values.
Comparison of male and female re-offense rates within each risk and strength category.
Comparison of Aboriginal and non-Aboriginal re-offense rates within each risk and strength category.
Comparison of re-offense rates across risk categories within each subsample.
Comparison of re-offense rates across strength categories within each subsample.
p < .05. **p < .01. ***p < .001.
The bottom portion of Table 3 reveals a significant decrease in recidivism rates across strength classifications for all subsamples (e.g., 33.7%, 18.4%, 7.7% for low-, moderate-, and high-strength categories, respectively; χ2(2) = 212.96, p < . 001, ϕc = .24). Within a given strength category, recidivism rates are significantly higher for males compared with females and significantly higher for Aboriginal compared with non-Aboriginal offenders.
Predictive Validity of SPIn Pre-Screen
The predictive validity of the assessment tool was determined by entering total risk scores and total strength scores into direct entry logistic regression models to yield predicted probabilities of dichotomous group membership (i.e., recidivist vs. non-recidivist). The latter were then subject to receiver operating characteristic (ROC) analysis, where the area under the curve (AUC) represents an index of predictive accuracy unbiased by recidivism base rate (Rice & Harris, 2005). 2 Predictive validity measures for the SPIn Pre-Screen vis-à-vis the overall sample and demographic subgroups are given in Table 4. Overall, the SPIn Pre-Screen predicted new offenses over 18 months with a high degree of accuracy (AUC = .77). Notably, no statistically significant differences exist in the tool’s predictive accuracy across gender and ethnicity.
Predictive Accuracy of SPIn Pre-Screen for Overall Sample and Demographic Subgroups
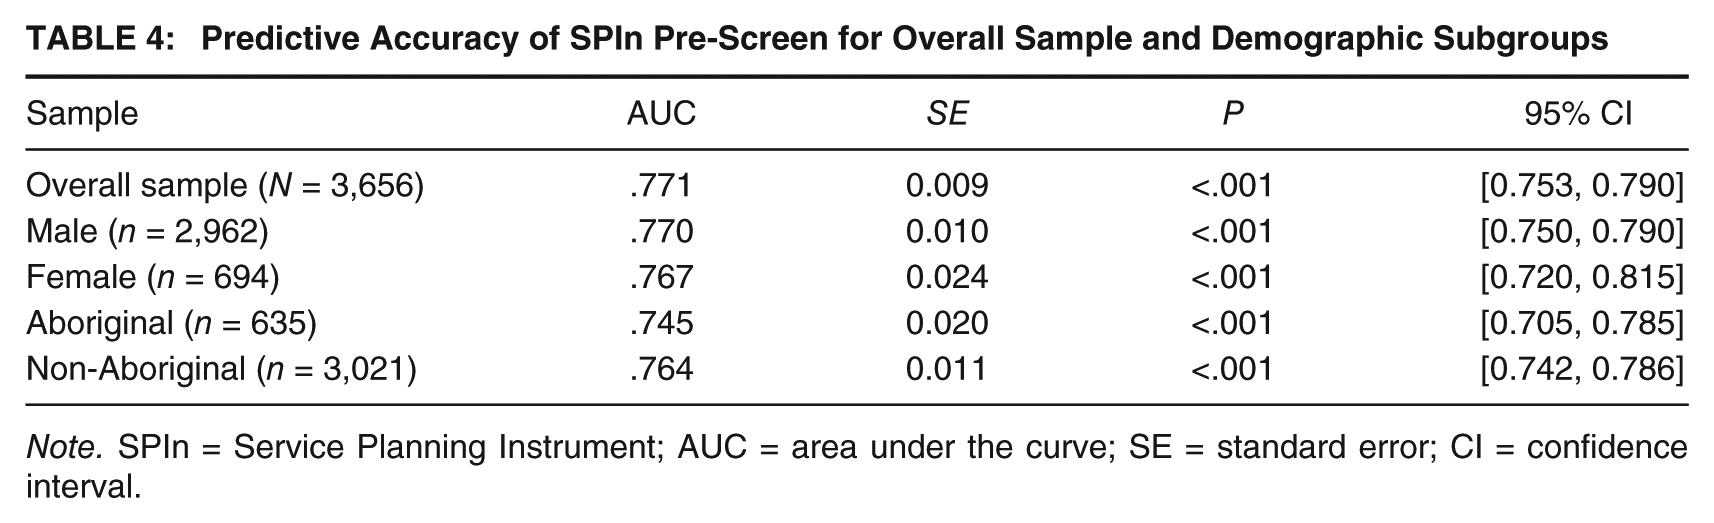
Note. SPIn = Service Planning Instrument; AUC = area under the curve; SE = standard error; CI = confidence interval.
Examining the Impact of Strengths
To examine potential promotive and protective effects, hierarchical logistic regression was performed, comparing a full model containing a Risk Total × Strength Total interaction term to a correspondent main-effects model (see Table 5). When considering the overall sample, significant main effects were observed for both risk and strength aggregate scores (Risk Total: χ2 = 33.46, p < .001; odds ratio [OR] = 1.02; Strength Total: χ2 = 40.85, p < .001, OR = 0.89). Given the negative correlation between the aggregate strength score and new offenses, a promotive effect was identified and strengths were shown to offer incremental validity over the simple inclusion of risks and needs. 3
Testing for Promotive and Protective Effects: Results of Hierarchical Logistic Regression Analyses Across Gender and Aboriginal Status
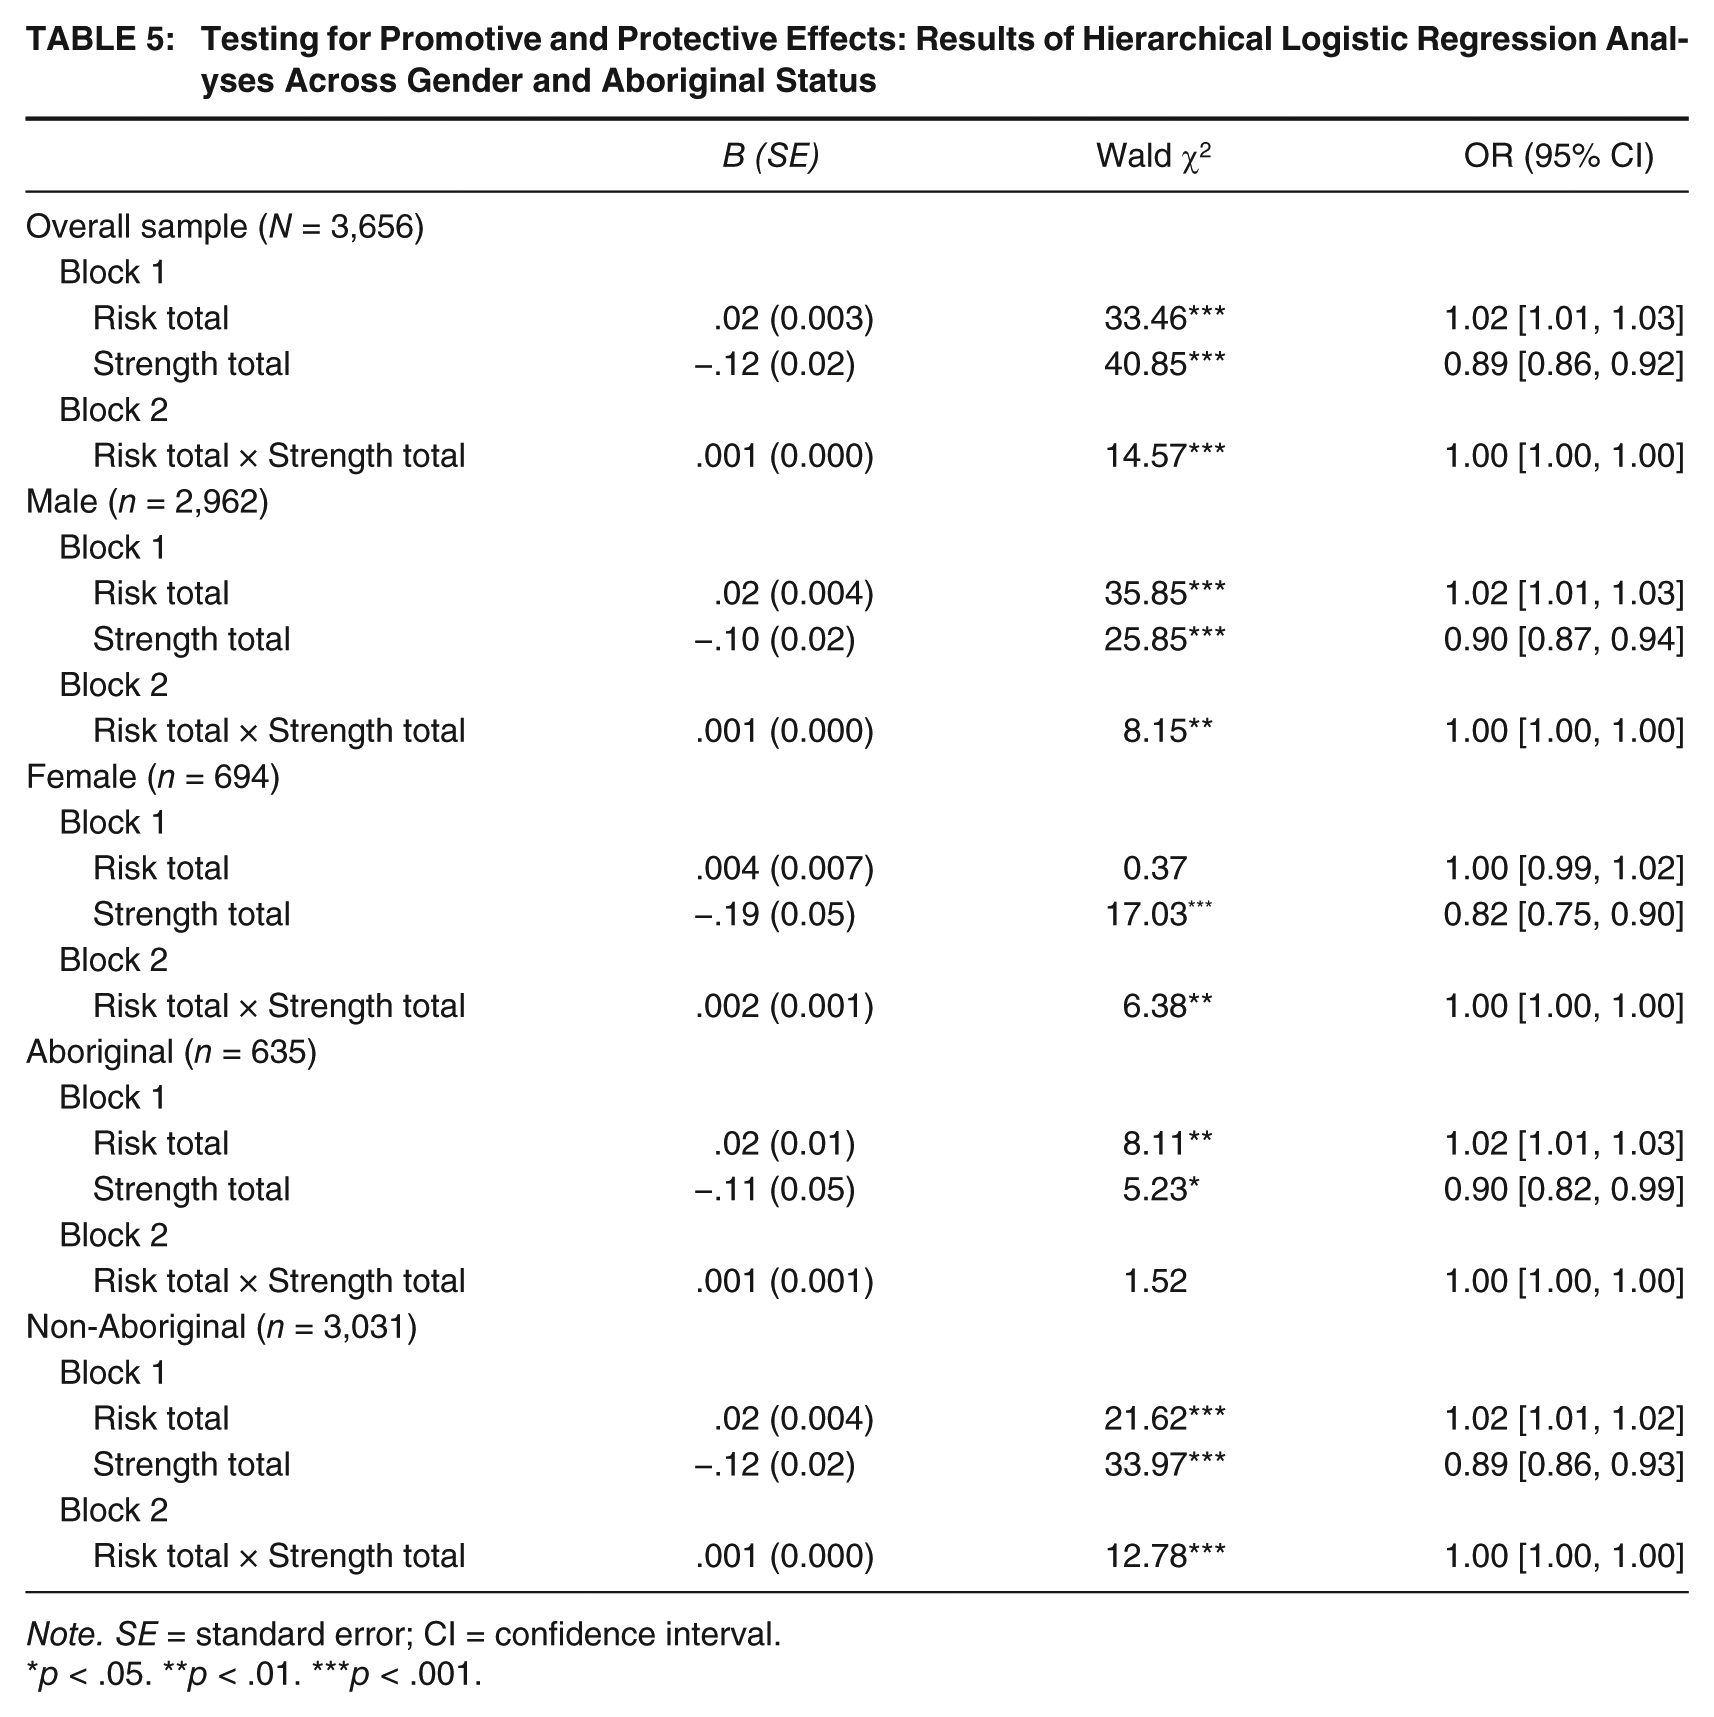
Note. SE = standard error; CI = confidence interval.
p < .05. **p < .01. ***p < .001.
Importantly, the Risk Total × Strength Total interaction term was statistically significant (χ2 = 14.57, p < .001, OR = 1.001), thus indicative of a protective effect. In other words, strengths featured on the SPIn Pre-Screen collectively moderate the relationship between risk and recidivism outcome. Figure 1 presents recidivism rates by risk and strength categories based on a dichotomization of the two measures via median split. 4 As illustrated, high strength (i.e., protective) scores are particularly effective in attenuating recidivism rates among higher risk cases.
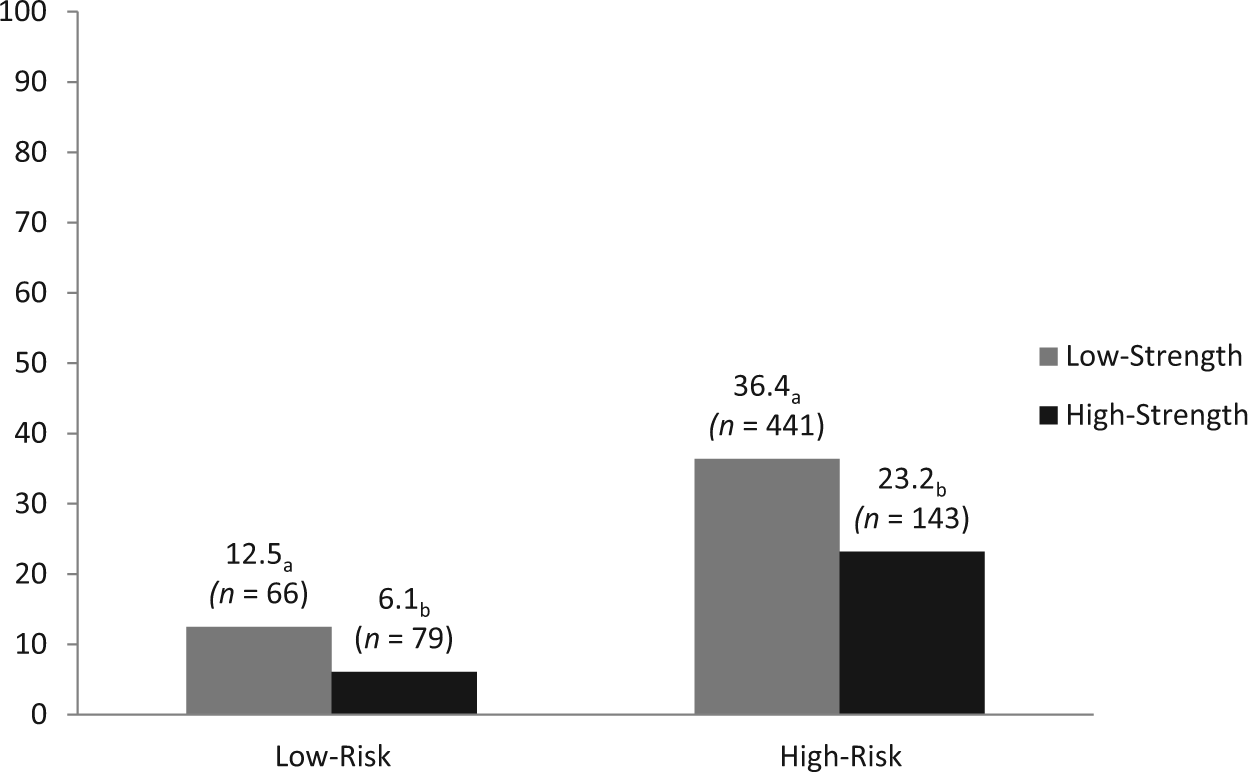
Rate of new offenses (%) over 18 months by risk and strength categories (N = 3,656)
Promotive and protective effects were additionally explored on subsamples disaggregated by gender and Aboriginal status. Table 5 presents results of this series of hierarchical logistic regression analyses. Promotive effects were evident across all subsamples; that is, the incremental validity of strengths was demonstrated among male, female, Aboriginal, and non-Aboriginal offender groups. Interestingly, among female offenders, the risk score becomes non-significant when the strength score is entered into the model. In turn, protective effects evidenced by significant Risk Total × Strength Total interactions were replicated across all groups save for the subsample of Aboriginal offenders.
Discussion
An efficient assessment and service planning tool incorporating a series of criminogenic risks, needs, and strengths, the SPIn Pre-Screen demonstrates excellent predictive utility evidenced by the significant increase and decrease in recidivism rates across risk and strength categories (8.6%, 26.9%, and 54.4% for low-, moderate-, and high-risk, respectively; 33.7%, 18.4%, and 7.7% for low-, moderate-, and high-strength, respectively). These expected patterns of recidivism emerging from the classification scheme hold across gender and Aboriginal status.
In terms of overall levels of predictive validity, the SPIn Pre-Screen predicted new offenses over an 18-month period with a high degree of accuracy (AUC = .77). In practical terms, an AUC of .77 indicates the probability that a randomly selected recidivist will have a higher overall risk score than a randomly selected non-recidivist. Notably, based on aggregate scores, no statistically significant differences exist in the tool’s level of predictive accuracy when comparing male, female, Aboriginal, and non-Aboriginal offenders.
The SPIn Pre-Screen and its Full Assessment counterpart are unique among available assessment tools in their quantitative inclusion of strengths. Based on the overall sample of probationers, results of the current investigation demonstrated that both the SPIn Pre-Screen’s aggregate risk score and aggregate strength score independently predicted recidivism and importantly, that the aggregate strength score offered incremental validity over and above the risk score. Moreover, a genuine protective effect was evidenced by the statistical interaction between risk and strength scores. Specifically, high strength scores buffered recidivism to a significantly greater degree among high-risk cases relative to low-risk cases. Although a genuine protective effect was not yielded among Aboriginal offenders, a statistical interaction between strength and risk levels was identified among women, men, and non-Aboriginal offenders.
The Inclusion of Strengths in Risk Assessment Protocols
From a theoretical perspective, results of this study first and foremost illustrate that risk and strength factors co-exist in relative combinations within an individual, collectively influencing criminal outcome. Given evidence that strengths are not simply the inverse or absence of risk, the quantitative inclusion of strengths in risk assessment is a worthwhile endeavor that is apt to enhance both predictive and case management functions. The emergence of a genuine protective effect across the aggregated sample further supports the importance of strengths-based assessment and intervention—particularly among higher risk cases.
Despite the importance of adopting a consistent terminology and clearly operationalizing constructs of interest in the literature, the distinction between “promotive” and “protective” factors may be less consequential in practical, real-world contexts. Is it actually necessary for a factor (or combination thereof) to produce a significant interaction with risk level to be noteworthy in assessment and treatment? Whether strengths buffer risk to a greater extent among high-risk groups or equally across all levels of risk, the risk principle would dictate that we should still focus our most intensive treatment efforts on the highest risk cases. Moreover, interactions or genuine protective effects in regression are often difficult to detect due to limited statistical power (as may have been the case among Aboriginal offenders, the smallest offender subgroup). It is important to note that the absence of a statistical interaction does not negate the importance of the overall findings that strengths collectively demonstrate a unique and incremental relationship to outcome.
Apart from the predictive utility of strengths demonstrated here (both in terms of promotive and protective components), restructuring the assessment process to additionally gage the positive facets of an individual’s life provides an important advantage within the everyday context of case management. Anecdotally, correctional practitioners who have supplemented risk/needs assessment protocols with the assessment of strengths have reported positively on how the latter enhances case planning activities (Jones, Brown, & Van Dieten, 2013). Namely, strengths assessment complements a number of approaches aimed at building rapport with the offender and enhancing motivation (e.g., Motivational Interviewing; Miller & Rose, 2009).
Rather than limit feedback to offenders on risks, deficits, problems, and challenges, when case managers systematically identify strengths as part of a formal assessment process, they are in a position to additionally provide feedback to offenders on their personal and social strengths. Moreover, by beginning a case planning discussion about an individual offender’s strengths, the case manager is more likely to invite openness to a discussion about challenges (i.e., specific criminogenic needs) that must be addressed in the context of intervention. In turn, a greater collaborative process is achieved between the case manager and the offender in developing the case plan. However, unless strengths are formally incorporated into the assessment process, most case managers are unlikely to discover the full benefits of adopting a strengths-based approach. Ultimately, correctional researchers and practitioners need to expend at least as much time and energy identifying offender strengths as they spend identifying their deficits. Based on a growing body of literature including the current study, it is the joint consideration of risk/needs and strengths in the assessment process that provides a comprehensive foundation for correctional decision making and case management.
Demographic Specificity Versus Demographic Neutrality
As do most other risk assessment tools of its generation, the SPIn Pre-Screen corrects for the recidivism by gender base rate disparity and guards against female over-classification by customizing cutoffs for women. Resultantly, the proportions of male and female recidivists within each classification level are statistically equivalent as per the results presented in Table 3. The SPIn’s equivalent levels of predictive validity for male, female, Aboriginal, and non-Aboriginal offenders confirm the findings of mainstream theorists who advocate the use of a universal assessment tool across gender and ethnicity for classification purposes (e.g., Andrews et al., 2012; Gendreau, Little, & Goggin, 1996; Olver et al., 2009). However, these findings do not rule out the importance of gender-based factors in the arena of needs (and strengths) assessment.
Some Canadian and American research fails to support the applicability of risk assessment tools developed on aggregate samples to ethnic minorities—namely, indigenous populations (Blanchette & Taylor, 2007; Holsinger, Lowenkamp, & Latessa, 2006). Such scholars continue to express concern that traditional risk/needs assessment tools developed largely on White samples are deficient in cultural sensitivity, thus eroding their predictive value. Despite these protests, the current investigation supports the alternate body of research suggesting that based on aggregate scores, risk assessment tools developed on normative, majority samples can successfully predict re-offending among ethnic minorities (Gutierrez, Wilson, Rugge, & Bonta, 2013; Olver et al., 2009; Schwalbe, 2009; Snowden, Gray, & Taylor, 2010; Wilson & Gutierrez, 2014). Indeed, the predictive accuracy of the SPIn Pre-Screen for Aboriginal and non-Aboriginal offenders was statistically equivalent (i.e., AUC = .75 vs. .76, respectively). These findings, however, do not preclude the need to further explore how existing tools can be further enhanced to maximize gender and cultural responsiveness.
Limitations and Future Research
Notwithstanding evidence in support of demographic neutrality in the risk assessment domain, feminist scholars maintain that “gender-neutral” tools fail to capture criminogenic needs (and/or strengths) that may be particularly salient or specific to justice-involved girls and women, the consideration of which may be necessary for the equitable processing of this growing demography (e.g., trauma, mental health needs, self-esteem, quality of relationship with intimate partners and dependent children, etc; Blanchette & Brown, 2006; Van Voorhis, Wright, Salisbury, & Bauman, 2010). Although the current investigation was limited to the SPIn Pre-Screen, data from the SPIn Full Assessment may be helpful in exploring some of these issues. Further research is recommended to hone gender-responsive strategies and to determine the extent to which these will reliably produce empirical and practical gains beyond the application of currently adopted gender-neutral tools.
Cultivating a greater understanding of how risk and strength factors interact to predict criminal outcome is germane to the development of more effective risk assessment protocols and to the appropriate delivery of correctional services. Future research would benefit from identifying the relative predictive effects of specific intervention targets—that is, individual risk/need and strength domains—as a function of gender. In addition, the impact of culture on strengths merits further investigation (Vaughn, Salas-Wright, DeLisi, & Maynard, 2014), as does the study of simultaneously intersecting identities of gender and culture/ethnicity.
Conclusion
Beyond predicting new offenses over an 18-month period with a high degree of accuracy across gender and Aboriginal status (AUC = .77 for the overall sample), the SPIn Pre-Screen’s aggregate strength score offered incremental validity over and above the risk score. Moreover, a genuine protective effect was observed overall, whereby high strength scores buffered recidivism to a significantly greater degree among high-risk relative to low-risk cases. Results of this investigation support the integration of strengths into quantitative assessments of criminal risk for the purpose of optimizing assessment accuracy and guiding treatment efforts.
Footnotes
Appendix A
Appendix B
Example of a service planning instrument pre-screen item.
| •– – | •– | •0 | •+ | •++ | |
|---|---|---|---|---|---|
|
|
Unwilling to stop doing crime. | Believes he or she is above the law (laws should not apply to him or her). | Not a presenting issue. | Demonstrates an interest in living in a law-abiding way. | Commitment to living in a law-abiding way. |
Appendix C
Service planning instrument pre-screen cutoff scores.
| Overall risk (male) | Overall risk (female) | Overall strength | |
|---|---|---|---|
| None | 0 | 0 | 0 |
| Low | 1-30 | 1-37 | 1-7 |
| Moderate | 31-66 | 38-88 | 8-14 |
| High | 67+ | 89+ | 15+ |
Use of this data set for research purposes was approved by Alberta Justice and Solicitor General.