
Abstract
There has been no prior research comparing risk factors for categories of convicted individuals (C-types: life-course-persistent; adolescence-limited; late-onset) compared with the corresponding categories of individuals who self-reported offending (SR-types). This article examines the extent to which these convicted and self-reported categories of individuals overlap, and explores childhood risk factors that predict categories of C-types and SR-types. Criminal career information about individuals involved in the Cambridge Study in Delinquent Development (CSDD) is used; 25 childhood factors were analyzed. C-types and SR-types were more problematic than both official and SR nonoffenders. Life-course persisters, adolescence-limited offenders, and nonoffenders overlapped in official records and self-reports, but late-onset offenders did not. C-types were significantly similar to SR-types in childhood risk factors; only a few differences were found. The differences between C-types and SR-types might be better conceptualized as quantitative rather than qualitative. Implications for prevention and intervention are discussed.
The main aim of this article is to investigate childhood risk factors for different categories of individuals who are involved in offending, based on either convictions or self-reported offending. The categories of individuals who are involved in offending are life-course persistent (LCP), adolescence-limited (AL), and late-onset (LO). A great deal is known about childhood risk factors for offending in general, but most of this knowledge is based on official record measures of offending. Little is known about childhood risk factors for these categories of individuals, and again this knowledge is mostly based on official record measures. For the first time, this article presents information about childhood risk factors not only for these categories of individuals but also based on convictions compared with self-reports.
Several developmental and life-course theories predict that childhood risk factors will lead to offending (for reviews of these theories, see Farrington, 2005b). For example, the Integrated Cognitive Antisocial Potential (ICAP) theory (Farrington, 2005a, 2019c) predicts that low family income and low school attainment will tend to lead to offending because children who experience these problems find it hard to achieve their goals (e.g., desires for material goods, status among peers) legitimately. It predicts that convicted parents and problematic siblings will tend to lead to offending, because they act as antisocial models. It predicts that poor parental supervision and disrupted families will tend to lead to offending because these factors will interfere with attachment and socialization processes. These kinds of childhood risk factors for offending in general have been verified in numerous longitudinal studies (Farrington, 2015b).
Moffitt (1993) first proposed that it was important to distinguish between LCP and AL individuals. She argued that most of the established childhood risk factors for offending (e.g., poor parenting, disrupted families, poverty, low socioeconomic status) predicted LCP offending. In contrast, the offending of AL individuals was caused by peer influence and by the gap between what they wanted (e.g., money and status) and what they could obtain. To include all individuals who offend, it is important to add the category of LO individuals to Moffitt’s categories. There have been very few studies on childhood risk factors for LO individuals, but Zara and Farrington (2009, 2010) found that the most important factors were high nervousness and having few friends.
Jolliffe et al. (2017b) carried out a systematic review of early risk factors for LCP, AL, and LO individuals. They found little evidence that specific risk factors predicted specific types of offending categories. LCP individuals had the most risk factors, AL individuals had fewer risk factors, and LO individuals had the fewest. They concluded that these categories differed more in degree than in kind. However, they only found seven longitudinal studies that yielded relevant information when these categories were defined according to ages of onset and desistance. Clearly, more research is needed on this important topic.
As mentioned, most research on childhood risk factors for offending is based on official records, such as convictions. It might be expected that whether a person gets convicted would depend not only on their offending behavior but also on police and court processes that may be biased. West and Farrington (1977) found that, even after equating boys on levels of self-reported offending, their probability of conviction was greater if they had a convicted father. It might be expected that the relation between family, child-rearing, and socioeconomic risk factors and convictions might be exaggerated by official biases. In contrast, whether a person self-reports an offense would depend not only on their offending behavior but also on their willingness to admit or conceal. Little is known about risk factors for this willingness, but it might be related to individual factors such as daring, dishonesty, and impulsivity. Therefore, we might expect that the relationship between individual risk factors and self-reported offending might be exaggerated by this bias. Clearly, we could be most confident about the importance of a childhood risk factor if it predicted both convictions and self-reported offending.
Few researchers have compared childhood risk factors for official versus self-reported offending. Farrington (1979) investigated predictors of juvenile convictions, controlling for juvenile self-reported delinquency, and predictors of juvenile self-reported delinquency, controlling for juvenile convictions. He found that most childhood risk factors (including a convicted parent, daring, and poor child-rearing) were more strongly related to convictions, whereas high extraversion, poor parental supervision, and low socioeconomic status were more strongly related to self-reported offending. As mentioned, this article aims to explore childhood risk factors for LCP, AL, and LO individuals, compared with individuals who do not offend (NO), according to convictions (C-types) versus self-reported offending (SR-types).
The major questions addressed in our study are as follows:
To what extent are C-types similar to SR-types?
What childhood factors predict C-types and SR-types?
This study allows for a better comprehension of criminal career findings by comparing official records with self-reports, and investigates to what extent these findings are similar or different. To the extent that findings are similar, we can be more confident of the following:
1. They reflect offending behavior rather than biases that are specific to a particular method of measurement (official records or self-reports).
2. They are influenced by childhood risk factors that are shown to impact upon people’s lives independently of whether their criminal involvement is official or unofficial. For instance, understanding whether self-reported life-course-persistent individuals (SR-LCP) are affected by similar childhood risk factors as convicted life-course-persistent individuals (C-LCP) can have implications for early prevention and intervention.
3. They reflect the similarity in the kind of risk factors involved.
To the extent that findings are different, we aim to
4. Identify where the differences lie. For instance, some factors may be more likely to affect official offending (e.g., having a convicted parent or a problematic sibling may predict C-types more strongly because the police and courts might selectively arrest persons from known criminal families, and find them guilty). Other factors may be more likely to affect self-reported offending. For instance, daring, dishonesty, or extraversion might predict SR-types more strongly as these types of individuals may be more willing to admit their offenses.
5. Understand the differences and explain them. Convictions reflect official processing as well as offending, whereas self-reports reflect the willingness to admit as well as offending.
Method
Sample
Criminal career information from individuals involved in the Cambridge Study in Delinquent Development (CSDD) is used in this study. To meet all the ethical standards, we followed all possible procedures to ensure confidentiality of the data. The CSDD was approved by the Home Office, and by the Ethics Committee of the Institute of Psychiatry, London University.
The CSDD is a prospective longitudinal survey of the development of offending and antisocial behavior of 411 London boys from age 8 (in 1961) onward. At the time they were first contacted in 1961–1962, the CSDD boys were all living in a South London area. Most boys were born in 1953. Both parents and children have been interviewed. The CSDD sample was not a probability sample drawn from a population, but rather a complete population of boys of that age in that area at that time. The vast majority of the sample (n = 399 boys) was chosen by taking all the boys who were then aged 8 to 9 and on the registers of six state primary schools within a 1 mile radius of a research office which had been established. Another 12 boys from a local school for children with special educational needs were included in the sample, in an attempt to make it more representative of the population of boys living in the area.
Most of the boys (357, or 87%) were of British origin. Of the remaining 54 boys, 12 had at least one parent of West Indian (usually) or African origin. Of the remaining 42 boys of non-British origin, 14 had at least one parent from the North or South of Ireland, 12 had parents from Cyprus, and the other 16 boys had at least one parent from another Western country (Farrington, 2003). On the basis of their fathers’ occupations when they were aged 8, 94% of the boys could be described as working-class (categories III, IV, or V on the Registrar General’s scale, describing skilled, semi-skilled, or unskilled manual workers), in comparison with the national figure of 78% at that time. The majority of the boys were living in conventional two-parent families; at age 8 to 9, only 6% of the boys had no operative father and only 1% had no operative mother (Piquero et al., 2007).
The CSDD males have been interviewed 9 times, at ages 8, 10, 14, 16, 18, 21, 25, 32, and 48. At all ages, except 21 and 25, the aim was to interview all the males who were still alive, and it was always possible to interview a high proportion: 405 (99%) at age 14, 399 (97%) at age 16, 389 (95%) at age 18, 378 (94%) at age 32, and 365 (93%) at age 48. At age 48, 17 males had died, five could not be traced, and 24 refused, which meant that 365 of 394 who were still alive were interviewed (Farrington, 2019b; Farrington et al., 2009).
Risk Factors
Twenty-five childhood risk factors, measured at ages 8 to 10 and divided into five categories of life development (personality, attainment, behavioral, familial, and socioeconomic), were analyzed. These are the most important risk factors measured in the CSDD, and their significance has been demonstrated in many studies (Farrington, 1995, 2003; Murray & Farrington, 2005; Zara & Farrington, 2013, 2016).
Nervousness of the boy and number of friends of the boy were rated by psychiatric social workers based on interviews with parents. Neuroticism and extraversion of the boy were based on the New Junior Maudsley Inventory (Furneaux & Gibson, 1966) administered at age 10. Low junior school attainment was measured by arithmetic, English, and verbal reasoning tests at age 10. Nonverbal IQ (intelligence quotient; 90 or less was considered a low IQ) was measured by Raven’s Progressive Matrices test. Verbal IQ was measured by word comprehension, sentence reading, and mechanical reading tests. Daring was based on teachers’ and parents’ ratings of the boy’s propensity to take risks in traffic and exploring.
The boys’ parents provided details about such things as family income, large family size (four or more siblings), poor housing (dilapidated or neglected interiors), and their degree of supervision of the boy. Parental attitude reflected cruel, passive or neglecting attitudes, and harsh or erratic discipline by mothers and fathers. A disrupted family measured separation from parents for causes other than death or hospitalization. The convicted parent variable was created by establishing whether either the boy’s mother or father (or both parents) had a criminal record, up to when the boy was age 10. In estimating the criminal convictions of parents, only offenses routinely recorded in the Criminal Record Office (CRO) were counted, and convictions by both juvenile and adult courts were included (for a detailed description of these risk factors in the CSDD, see West & Farrington, 1973).
Criminal Record Searches of the Males
The criminal records of the CSDD males have been searched repeatedly 1 up to age 61, and their self-reported offending was measured up to age 48. The criminal record searches were carried out in the central CRO 2 or National Identification Service (NIS) 3 at Scotland Yard in London, from 1964 to 1994. From 1995, all convictions were recorded on the Police National Computer (PNC). Further searches of criminal records of the males took place in 2002 and 2004 in the PNC, and later in 2011 (Farrington et al., 2013). The most recent PNC search was completed in April, 2017, when it is likely that all offenses committed up to the end of August, 2016, would have been recorded. Therefore, information is now available about all offenses committed up to age 61.99 (i.e., up to just before the 62nd birthday; Farrington, 2019a, 2019b).
Little is known about C-types defined according to criminal career duration. The availability of longitudinal data allows for a more realistic definition of C-LCP, convicted adolescence-limited (C-AL), convicted late-onset (C-LO), and nonoffending (C-NO). The C-types were established by a priori criteria based on the scientific literature (Jolliffe et al., 2017a; Moffitt, 2018) and based on previous research on the CSDD. The CSDD data reflect a follow-up of more than 40 years, which warrants methodological soundness and external validity, being one of the few studies in the world which provides data from both official and SR sources over such a long period of time (Jolliffe et al., 2016).
In the CSDD, 178 males were convicted up to age 61 (44% of 409 at risk) with a total of 947 offenses, including 57 cautions (Farrington, 2019a, 2019b). Convictions were only counted if they were for “standard list 4 ” (more serious) offenses. The number of males at risk of conviction decreased from 409 at age 10 to 358 at age 61, because of death and emigration. Up to age 60, 34 males died (of the entire sample of 411), of whom 24 were convicted. The mean age of death of the CSDD men was 43.38 (SD = 13.08). In addition, 23 males were known to have emigrated permanently up to age 48, of whom four were convicted.
Because our original intent was to provide a replication to the fullest extent possible of the reality of the CSDD official criminal careers in the life-course, 5 we relied on the following classification scheme: C-LCP had a first conviction up to age 20 and a last conviction at age 30 or later; C-AL had a first conviction before age 20 and no conviction at age 30 or later; C-LO had a first conviction at age 21 or later; and C-NO did not have any conviction at any age in their life course. These categories were mutually exclusive and exhaustive.
Self-Reported Offending
Self-reported offending was measured at ages 14, 18, 32, and 48 (Farrington, 2019a, 2019b; Farrington et al., 2014). The males were given a series of cards with different types of offenses written on them, and they were asked to indicate whether they had ever committed each offense by placing the card either on a pile that had “yes” or “no” written on it. When the answer was “yes,” they were asked to specify how many offenses had been committed in the last year and in the previous 5 years. The offenses were burglary, theft of vehicles, theft from vehicles, shoplifting, theft from machines, assault, drugs, and vandalism. Each male was scored according to the number of these eight offenses that he admitted at each age.
To identify a CSDD male as an SR individual, a conservative procedure was employed. The first step was based on the admissions by each male of the eight offenses at each of the ages. Those who scored 5 or more admissions (of 8), at ages 14 and 18, were considered SR individuals in those age groups; those who scored 2 or more admissions (of 6), at ages 32 and 48, were considered SR individuals in those age groups. 6 The cut-off points for the SR categories were based on the “worst” quartile scores of the convicted group only. Researchers were unaware of the males’ criminal careers when they were assessing the SR data. To allocate the SR individuals in each of the offending categories (SR-LCP, self-reported adolescence-limited [SR-AL], self-reported late-onset [SR-LO], and self-reported nonoffending [SR-NO]), those who had high scores at both age ranges (14–18 and 32–48) were considered SR-LCP; those who had high scores only at ages 14 to 18 were considered SR-AL; those who had high scores only at ages 32 to 48 were considered SR-LO; and those who had low scores in both age ranges were considered SR-NO.
Analytic Strategy
Most childhood risk factors and outcomes in this study were dichotomized into the “worst” quarter versus the remainder. This cut-off point was decided a priori based on the types of variables analyzed, and supported by previous research findings using the CSDD data (Farrington et al., 2016) and other longitudinal data (LeBlanc & Frechette, 1989; Loeber et al., 1999).
Despite some controversies regarding overartificial categorization versus continuous variables, some supportive work on employing dichotomization is available (Agresti, 2002). For instance, when an explanatory variable has a nonlinear relation with the outcome measure, as is the case for many explanatory variables versus offending (Farrington et al., 2016), dichotomization provides no misleading values, as would be the case with product–moment correlations; nonlinear relationships would cause misleading low values of r. Also, r values based on a three-category variable such as family income could not be compared with r values based on a continuous variable such as IQ. 7
According to Farrington and Loeber (2000), dichotomization is useful because it produces meaningful findings that are easily communicated to policy makers and practitioners. It also simplifies the presentation of results, makes it possible to compare the predictive strengths of variables, and equalizes the sensitivity of their measurement. Measures of effect size should reflect the relative importance of the explanatory variables, and not the way in which they were measured. Furthermore, the dichotomization of explanatory variables fosters a “risk factor” approach to the explanation and prediction of offending, and encourages the identification of individuals who are particularly vulnerable or resilient because they possess several risk factors, and who may specifically benefit from specialized prevention efforts (Farrington & Loeber, 2000). Individuals are rather more interesting than variables. The odds ratio (OR) is the best measure of strength of association between dichotomous variables, and it was chosen for this study. It is easily understandable as the increase in the odds (risk) of an outcome is associated with the presence of the risk factor under examination.
A series of stepwise logistic regressions was carried out in this study. Logistic regression is a multivariate statistical technique that yields regression coefficients that indicate the probability of a specific outcome variable of interest occurring (e.g., being a C-type individual) according to whether a predictor (e.g., impulsivity, poor housing, physical neglect, etc.) is statistically important once other predictors are controlled (Menard, 1995).
Results
The CSDD sample was composed of 54 C-LCP (13.8%), 76 C-AL (19.4%), 42 C-LO (10.7%), and 220 C-NO (56.1%). Nineteen men were not included because they died or emigrated abroad permanently, and were not at risk from age 30. The official criminal careers of the C-LCP, C-AL, and C-LO individuals differed. Table 1 shows the age at the first and last offense, the average number of offenses committed, the average duration of the criminal career, the percentage of incarcerated individuals, and the average time served in incarceration. For instance, C-LCP had a criminal career that spanned over 30 years on average, and an average of almost 10 convictions. C-AL had short criminal careers before emerging adulthood, and an average of four offenses. C-LO had an average career duration of 4 years, and an average of two convicted offenses.
Criminal Careers of the Convicted Individuals
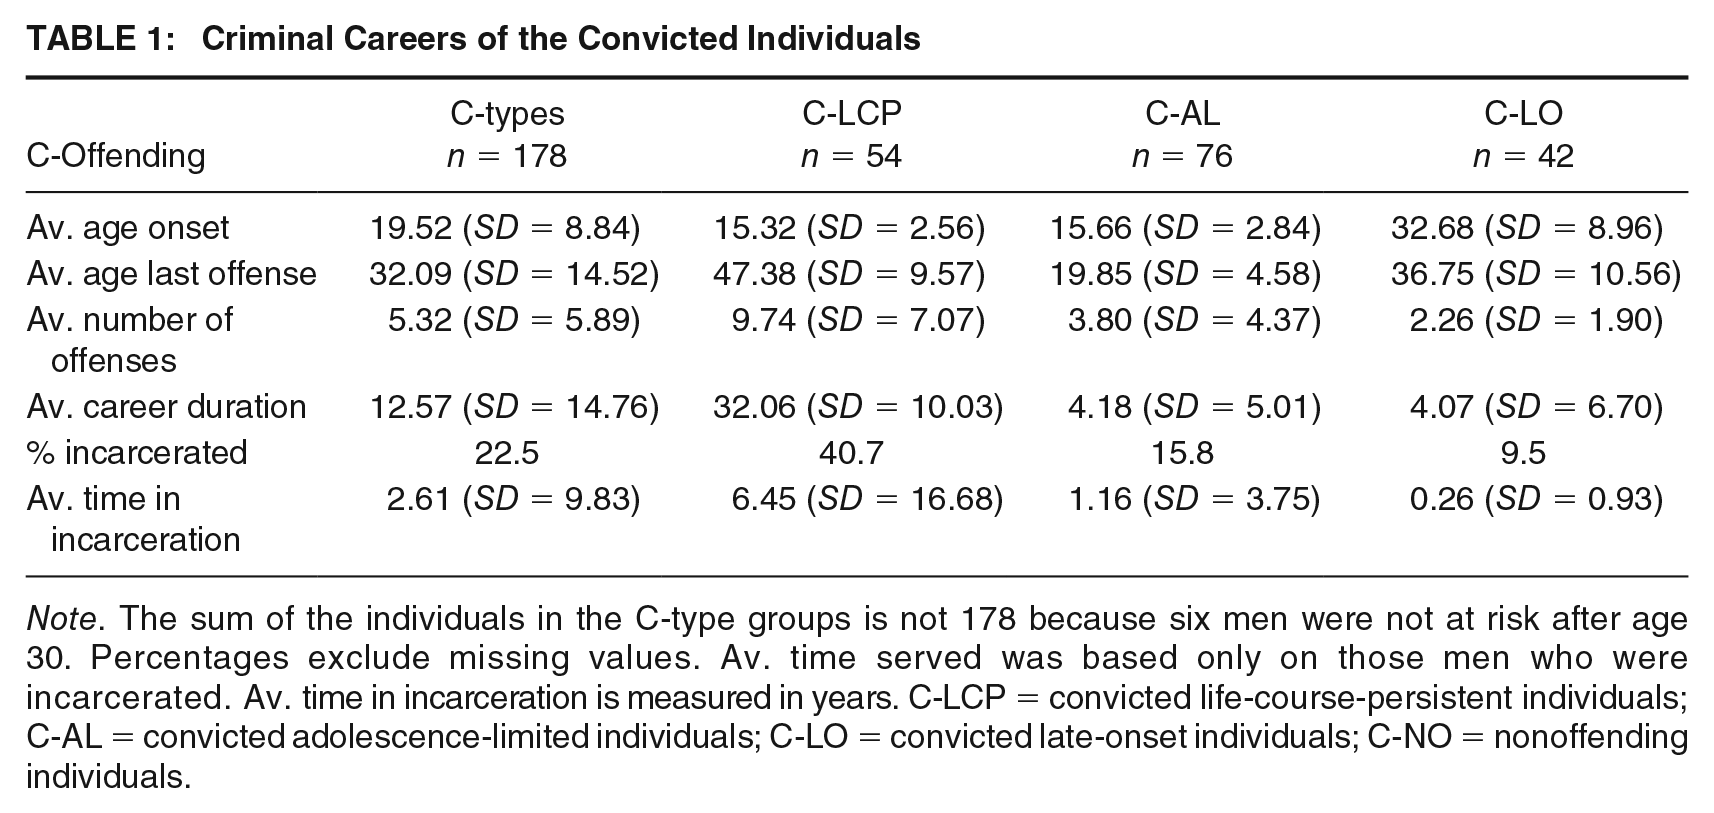
Note. The sum of the individuals in the C-type groups is not 178 because six men were not at risk after age 30. Percentages exclude missing values. Av. time served was based only on those men who were incarcerated. Av. time in incarceration is measured in years. C-LCP = convicted life-course-persistent individuals; C-AL = convicted adolescence-limited individuals; C-LO = convicted late-onset individuals; C-NO = nonoffending individuals.
For the SR-types, the composition of categories was as follows: 56 SR-LCP (14.8%), 81 SR-AL (21.4%), 26 SR-LO (6.9%), and 216 SR-NO (57.0%). Thirty-two men were not interviewed at one or more ages. On average, the SR-types admitted nearly six types of SR offenses between ages 14 and 18 years and on average two types of SR offenses between ages 32 and 48 years. Table 2 shows the average number of SR offenses in both age ranges for all SR-types.
SR-Offending by SR-Types of Individuals
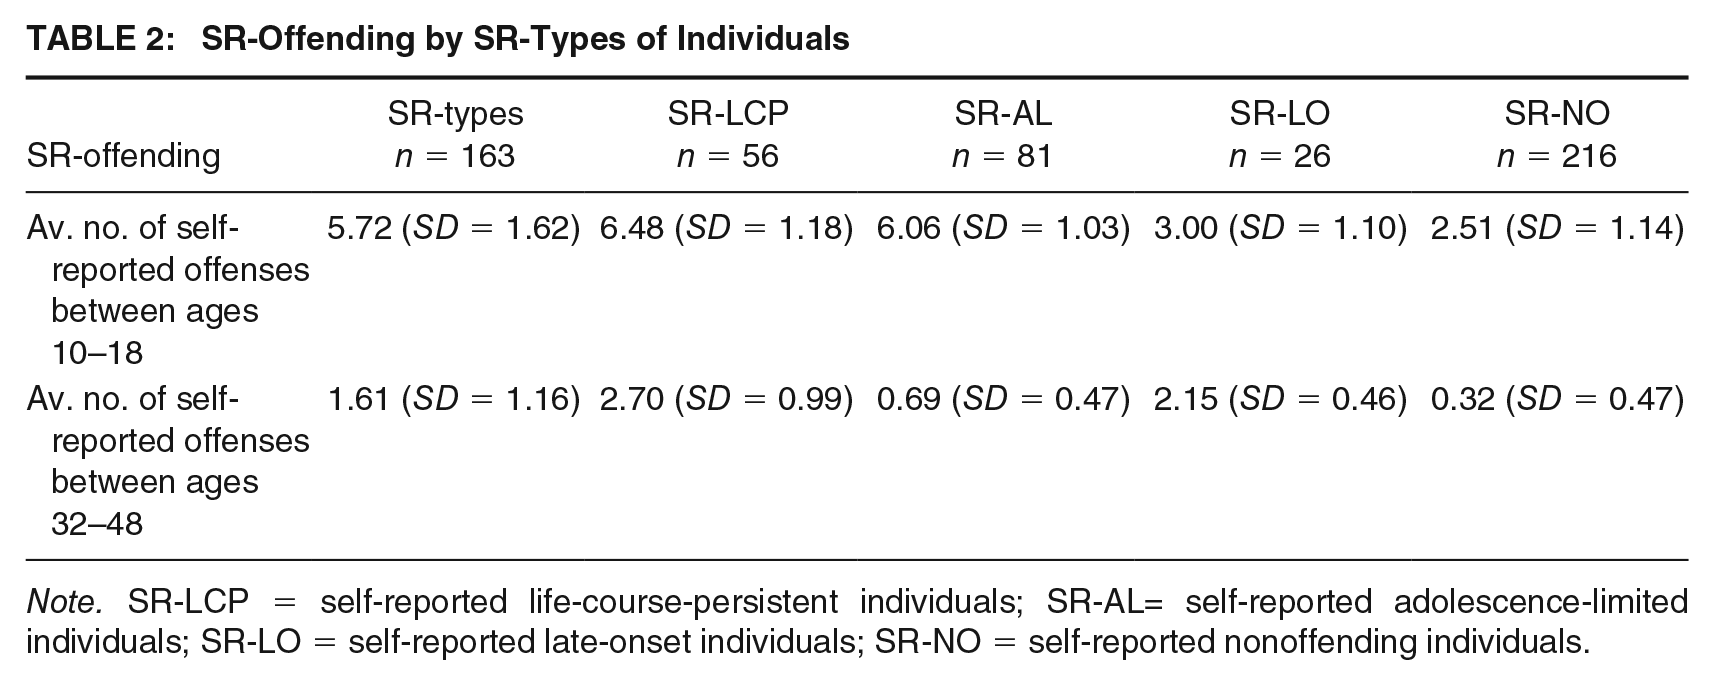
Note. SR-LCP = self-reported life-course-persistent individuals; SR-AL= self-reported adolescence-limited individuals; SR-LO = self-reported late-onset individuals; SR-NO = self-reported nonoffending individuals.
Table 3 shows the overlap between C-types and SR-types. To determine the extent to which a specific cell within the table significantly differed from the expected frequency, the adjusted standardized residual (ASR) was calculated. 8 ASR values indicate how many standard deviations above or below the expected count an observed count is, and signify the importance of the cell to the chi-square value (Agresti, 2007). The ASR differs from similar tests of this nature in that it takes into account the overall size of the sample and gives a good indication of how much the observed count differs from the expected count (Farrington et al., 1988). 9 A statistically significant ASR reflects an individual cell that is significantly different from chance expectation. The results of these tests are presented in Table 3.
Overlap of C-Types and SR-Types
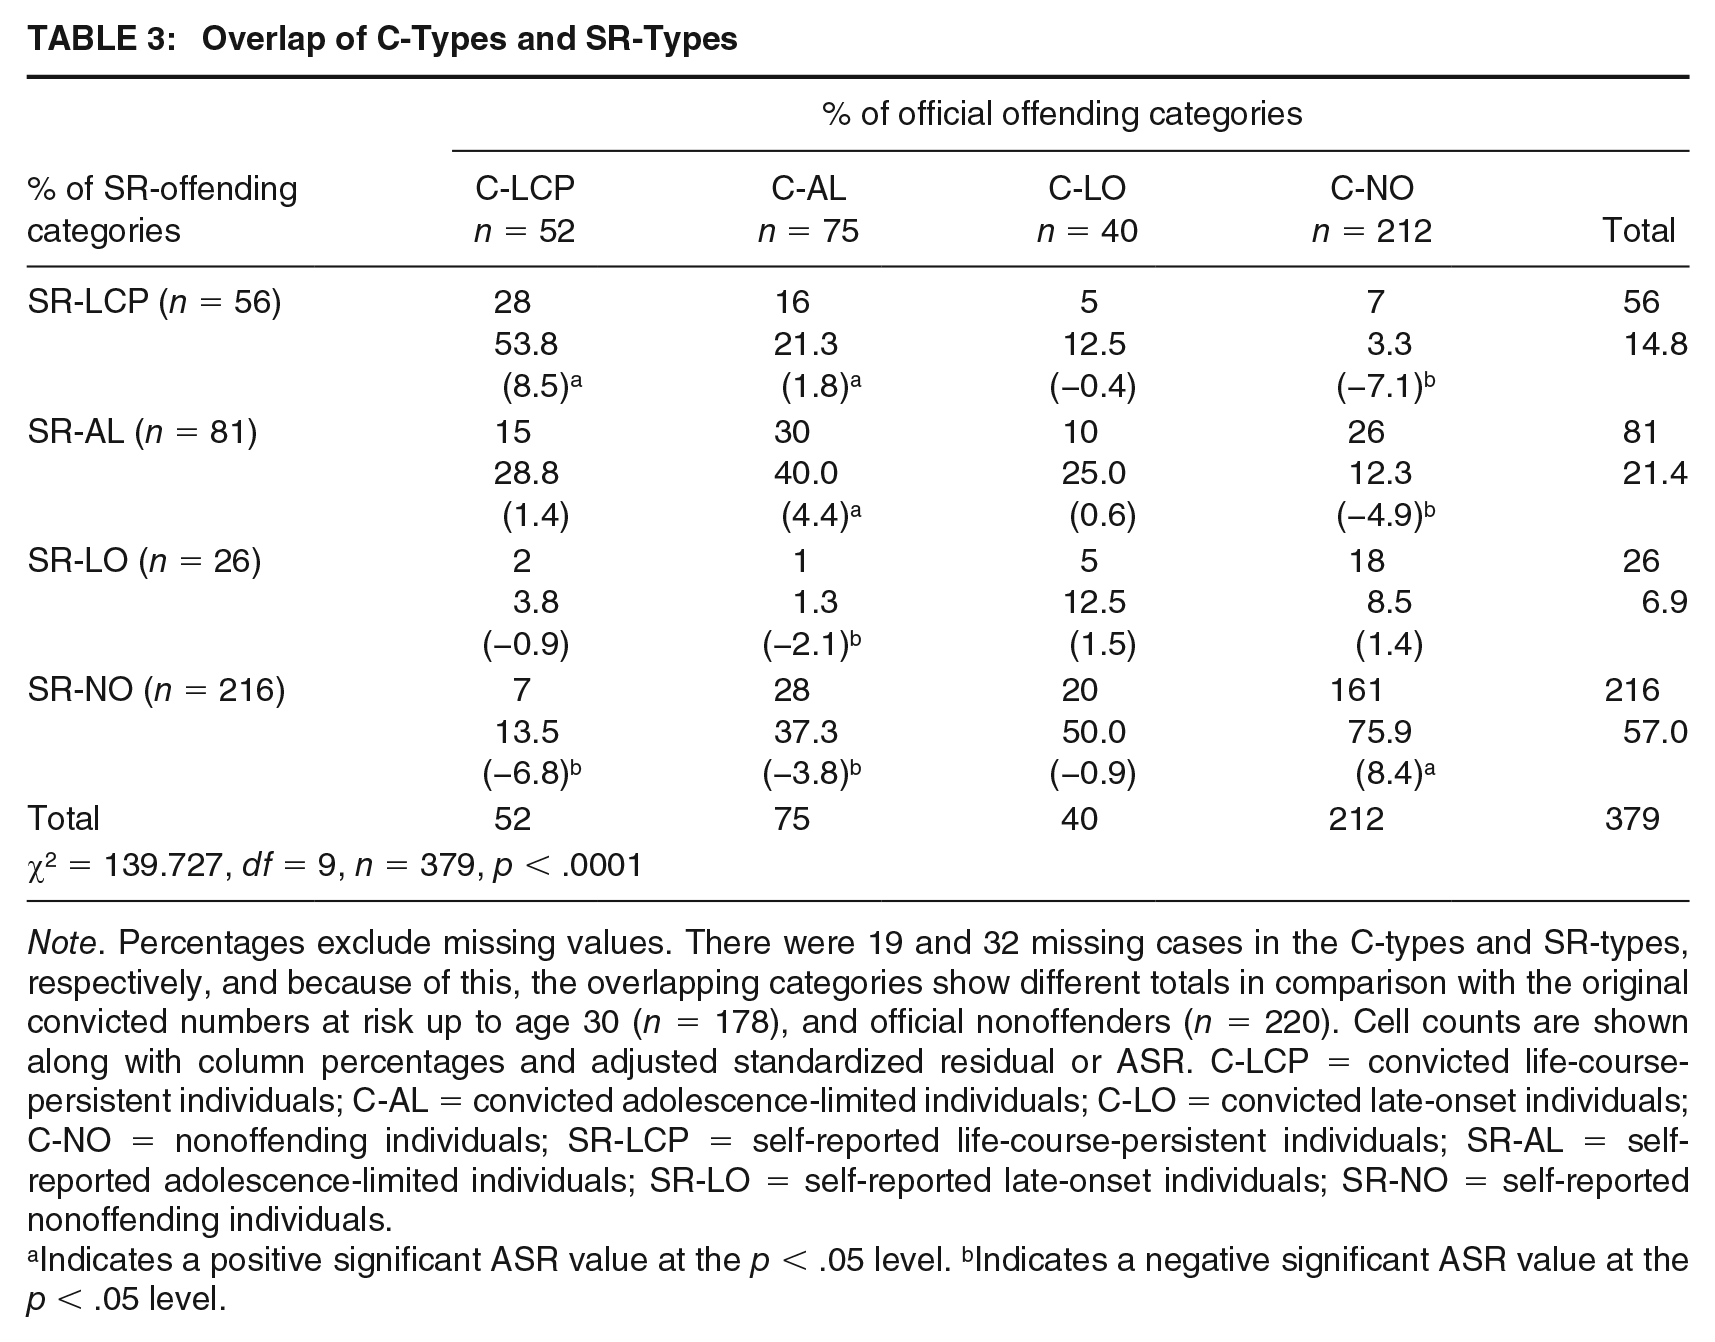
Note. Percentages exclude missing values. There were 19 and 32 missing cases in the C-types and SR-types, respectively, and because of this, the overlapping categories show different totals in comparison with the original convicted numbers at risk up to age 30 (n = 178), and official nonoffenders (n = 220). Cell counts are shown along with column percentages and adjusted standardized residual or ASR. C-LCP = convicted life-course-persistent individuals; C-AL = convicted adolescence-limited individuals; C-LO = convicted late-onset individuals; C-NO = nonoffending individuals; SR-LCP = self-reported life-course-persistent individuals; SR-AL = self-reported adolescence-limited individuals; SR-LO = self-reported late-onset individuals; SR-NO = self-reported nonoffending individuals.
Indicates a positive significant ASR value at the p < .05 level. bIndicates a negative significant ASR value at the p < .05 level.
The χ2 test indicates a strong and statistically significant relationship between the four C-types and the four SR-types (χ2 = 139.727, df = 9, n = 379, p < .001). C-LCP significantly overlapped with SR-LCP (ASR = +8.5, p < .001). C-LCP were negatively related to SR-NO (ASR = −6.8, p < .001). C-AL significantly overlapped with SR-AL (ASR = +4.4, p < .001) and were negatively related to SR-NO (ASR = −3.8, p < .001) and SR-LO (ASR = −2.1, p = .021). C-AL also overlapped with SR-LCP, but it was not significant (ASR = +1.8, p = .058). C-LO did not overlap significantly with any SR category. C-NO significantly overlapped with SR-NO (ASR = +8.4, p < .001) and were negatively related to SR-LCP (ASR = −7.1, p < .001) and SR-AL (ASR = −4.9, p < .001).
Childhood Risk Factors
As shown in Table 4, the 25 childhood risk factors discriminated similarly between C-types and SR-types. As expected, all C-types and SR-types were more problematic than C-NO and SR-NO, who came from the least problematic backgrounds, and were rather similar. C-LCP were predicted by 20 of the 25 risk factors, and SR-LCP were predicted by 17 of the 25 risk factors. For instance, C-LCP were more likely to be daring (p < .001), dishonest (p = .005), difficult to discipline (p < .001), and troublesome (p < .001), in comparison with C-NO. Moreover, C-LCP had poor school attainment records (p = .004), tended to come from multiproblematic families (e.g., a disrupted family, p < .001), and had problematic social backgrounds (e.g., large family size, p < .001). These risk factors were also significant for SR-LCP in comparison with SR-NO.
Childhood Predictors of C-Types and SR-Types
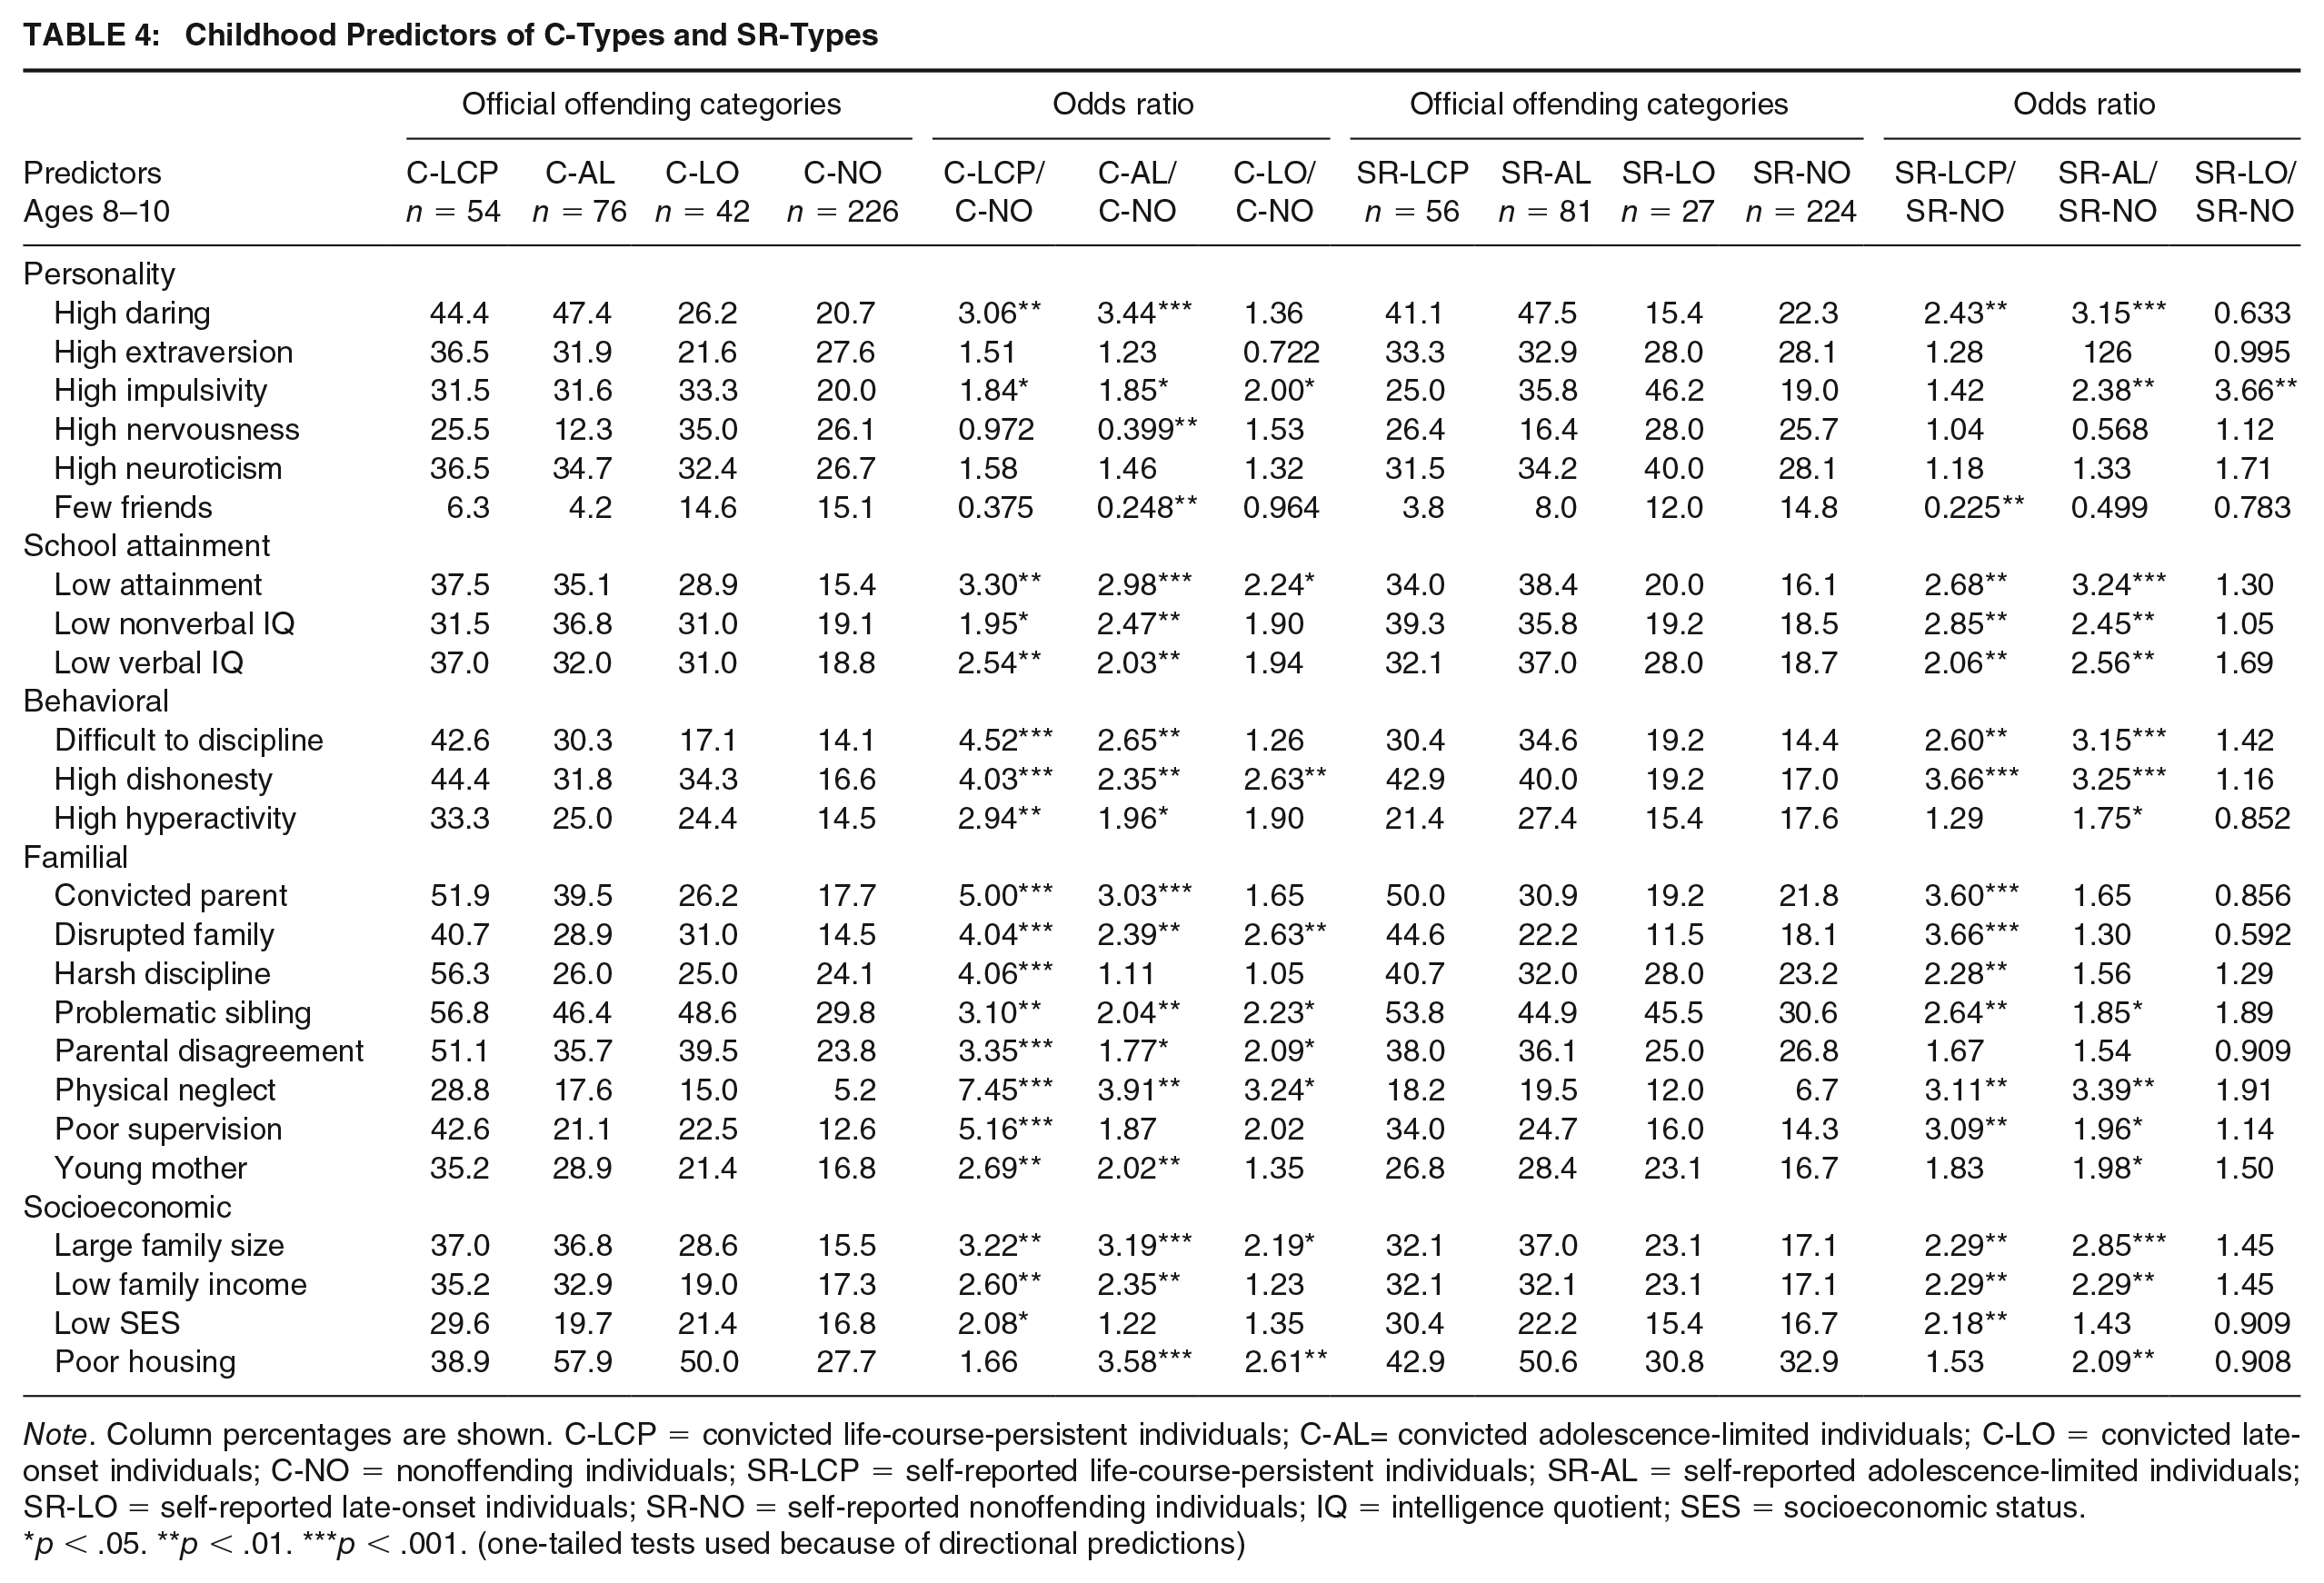
Note. Column percentages are shown. C-LCP = convicted life-course-persistent individuals; C-AL= convicted adolescence-limited individuals; C-LO = convicted late-onset individuals; C-NO = nonoffending individuals; SR-LCP = self-reported life-course-persistent individuals; SR-AL = self-reported adolescence-limited individuals; SR-LO = self-reported late-onset individuals; SR-NO = self-reported nonoffending individuals; IQ = intelligence quotient; SES = socioeconomic status.
p < .05. **p < .01. ***p < .001. (one-tailed tests used because of directional predictions)
C-AL and SR-AL were predicted by 20 of the 25 risk factors. In comparison with C-AL, C-NO were more likely to be nervous (p = .010) and to have few friends (p = .009), whereas C-AL were significantly more likely to be daring (p < .001), dishonest (p = .008), difficult to discipline (p = .002), and troublesome (p < .001). The family and social backgrounds of C-AL and SR-AL were significantly multiproblematic.
C-LO and SR-LO were more similar to C-NO and SR-NO. For C-LO, nine risk factors, such as high impulsivity (p = .048), low school attainment (p = .041), and being physically neglected (p = .035), were significant, along with other factors such as high dishonesty (p = .017), coming from a disrupted family (p = .012), and poor housing (p = .005). For SR-LO, only high impulsivity emerged as a significant risk factor to differentiate them from SR-NO (p = .003).
Predictive Multivariate Analyses
A series of stepwise logistic regressions were then carried out to assess the extent to which C-types and SR-types could be predicted from age 8 to 10 on the basis of childhood risk factors. Only risk factors that had significant OR values (see Table 4) were included as predictors in these analyses. Table 5 shows the independent predictors of C-types and SR-types, along with multicollinearity diagnostics. Compared with C-NO, C-LCP were predicted by a convicted parent (OR = 5.62), high dishonesty (OR = 3.97), low school attainment (OR = 3.68), and problematic siblings (OR = 2.67) (see Table 5(a)). C-AL tended to come from poor housing (OR = 3.19), were more daring (OR = 2.29), had lower school attainment (OR = 3.03), had a disrupted family (OR = 3.12), and were more dishonest (OR = 2.56) in comparison with C-NO, who were more likely to have few friends (OR = 0.14). Few friends might have acted as a protective factor against antisocial peer pressure in adolescence. Only one childhood risk factor independently predicted C-LO compared with C-NO: poor housing (OR = 2.61). This supports the assumption that C-LO were not noticeably different in their behavior at age 8 to 10 from C-NO.
Stepwise Logistic Regressions Predicting C-Types and SR-Types
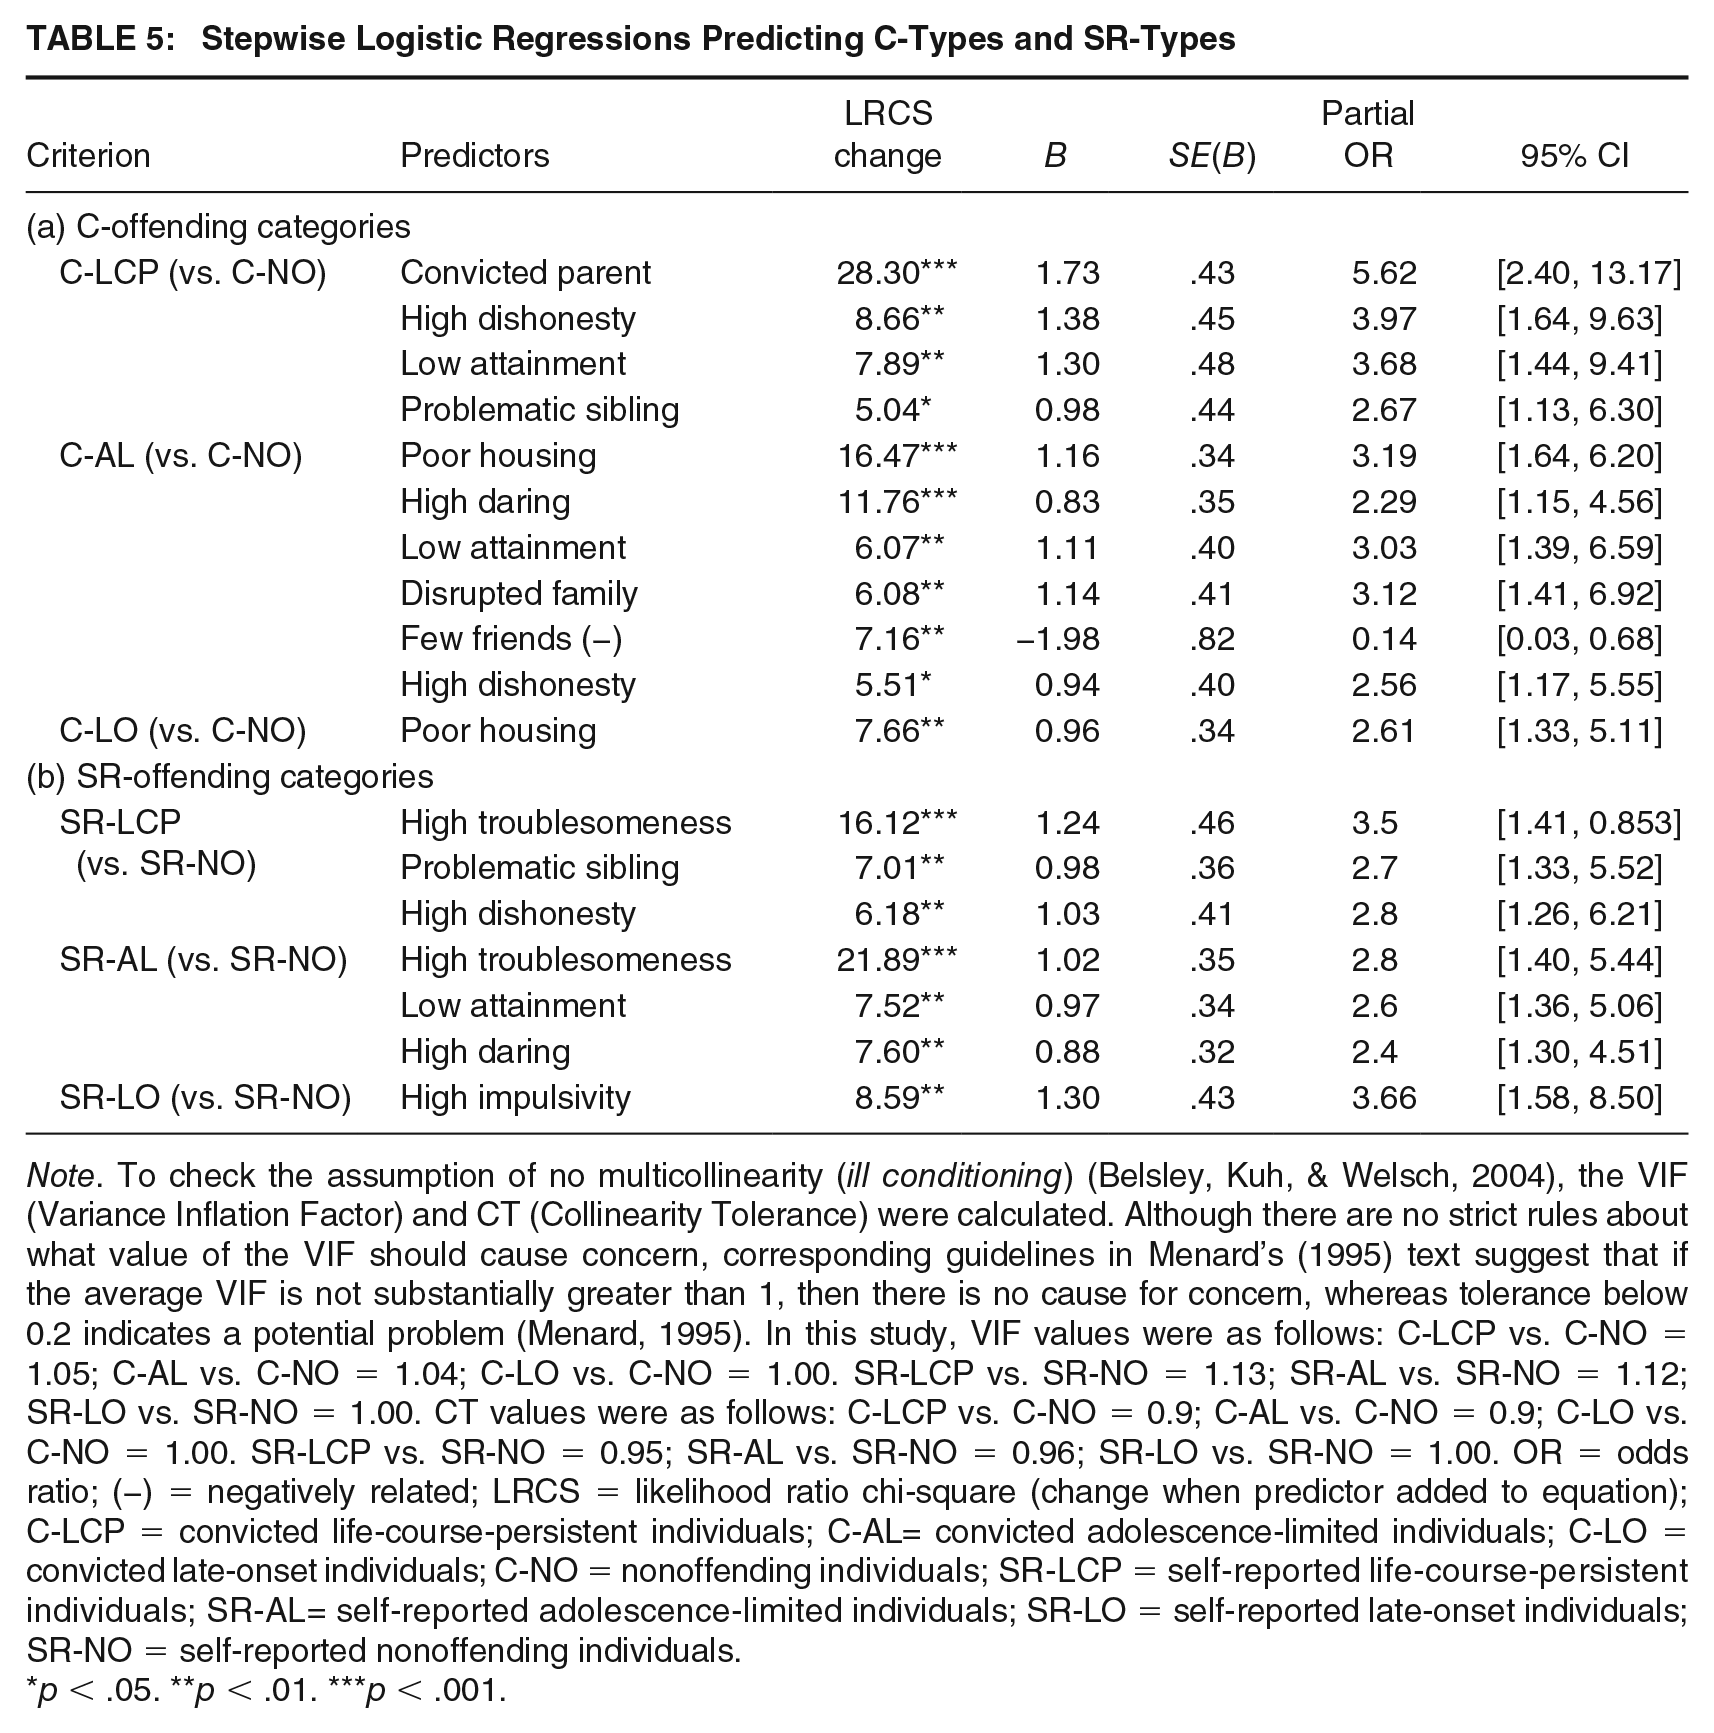
Note. To check the assumption of no multicollinearity (ill conditioning) (Belsley, Kuh, & Welsch, 2004), the VIF (Variance Inflation Factor) and CT (Collinearity Tolerance) were calculated. Although there are no strict rules about what value of the VIF should cause concern, corresponding guidelines in Menard’s (1995) text suggest that if the average VIF is not substantially greater than 1, then there is no cause for concern, whereas tolerance below 0.2 indicates a potential problem (Menard, 1995). In this study, VIF values were as follows: C-LCP vs. C-NO = 1.05; C-AL vs. C-NO = 1.04; C-LO vs. C-NO = 1.00. SR-LCP vs. SR-NO = 1.13; SR-AL vs. SR-NO = 1.12; SR-LO vs. SR-NO = 1.00. CT values were as follows: C-LCP vs. C-NO = 0.9; C-AL vs. C-NO = 0.9; C-LO vs. C-NO = 1.00. SR-LCP vs. SR-NO = 0.95; SR-AL vs. SR-NO = 0.96; SR-LO vs. SR-NO = 1.00. OR = odds ratio; (−) = negatively related; LRCS = likelihood ratio chi-square (change when predictor added to equation); C-LCP = convicted life-course-persistent individuals; C-AL= convicted adolescence-limited individuals; C-LO = convicted late-onset individuals; C-NO = nonoffending individuals; SR-LCP = self-reported life-course-persistent individuals; SR-AL= self-reported adolescence-limited individuals; SR-LO = self-reported late-onset individuals; SR-NO = self-reported nonoffending individuals.
p < .05. **p < .01. ***p < .001.
For comparison, the strongest independent predictors of SR-LCP versus SR-NO, SR-AL versus SR-NO, and SR-LO versus SR-NO are shown in Table 5(b). Troublesomeness (OR = 3.47), problematic siblings (OR = 2.71), and high dishonesty (OR = 2.80) were significant predictors when comparing SR-LCP and SR-NO. Compared with SR-NO, SR-AL were predicted by troublesomeness (OR = 2.76), low school attainment (OR = 2.63), and high daring (OR = 2.42). Compared with SR-NO, SR-LO were predicted by high impulsivity (OR = 3.66).
Discussion
To What Extent are C-types Similar or Different to SR-Types?
These findings suggest that similar childhood risk factors predict C-types and SR-types offending. C-types and SR-types are likely to suffer most from similar family conditions (e.g., convicted parent, problematic siblings, or poor housing) in childhood, and similar individual characteristics (e.g., high impulsivity, high daring, or troublesomeness) are likely to hinder their social adjustment in similar ways. Official records and self-reports tended to identify the same people as the most persistent offenders, and the same people as the most prosocial ones. Other researchers have found similar results (Huizinga & Elliott, 1986; Loeber et al., 2008; Prinzie et al., 2008).
More than half (53.8%) of C-LCP overlapped with SR-LCP, whereas 28.8% of C-LCP were SR-AL. Individuals who persisted in offending seemed to have come to terms with their criminal careers: They admitted LCP offending either because it would be difficult to deny what was already known officially or because they would not gain any advantage in being untruthful in recounting their offending. Nearly half (40%) of C-AL overlapped with SR-AL, whereas 37.3% had low involvement in SR-offending. Their denials might have been an attempt to avoid experiencing social shame for what they had done.
Unexpectedly, C-LO did not significantly overlap with SR-LO. This might be related to an attempt to appear to be respectable adults (Tangney et al., 2011). As expected, 75.9% of C-NO overlapped with SR-NO, whereas 12.3% of C-NO admitted SR-AL offending, and 3.3% of C-NO admitted SR-LCP offending. As psychological studies (Moffitt, 1993; Moffitt et al., 2002) suggest, refraining entirely from antisocial behavior in adolescence is unusual or unlikely. Hence, it was expected that there would be C-NO who admitted some involvement in offending, but minor enough to be normative. Nevertheless, none of them were ever convicted.
Although much research has been done on risk factors for C-types (Jolliffe et al., 2017b), very little was known about risk factors for SR-types. The present study showed that official and self-reported offending produced similar results in identifying LCP and AL individuals versus individuals who did not offend. The results were different for LO because their self-reports did not significantly overlap with the official records. Therefore, conclusions about risk factors for C-types should be similar to conclusions based on SR-types. These findings are in line with findings by West and Farrington (1973, 1977) in their early studies, and with findings by Farrington (2003) after 40 years of the CSDD, in indicating that officially convicted males are not substantially different from those identified as the most criminal based on their own confidential admissions.
To What Extent Do Childhood Factors Influence Both C-Types and SR-Types?
When risk factors for C-types were directly compared with risk factors for SR-types, few differences were found. The differences might be better conceptualized as quantitative as opposed to qualitative, insofar as the differences observed were more in degree rather than in kind. While C-LCP and SR-LCP, and C-AL and SR-AL were characterized by more early risk conditions than C-NO and SR-NO, the magnitude of risks was less evident when comparing C-LO and SR-LO with C-NO and SR-NO. LO individuals were the least problematic and were similar to NO individuals earlier in life, both psychologically and behaviorally. However, they manifested some forms of dishonesty and low school attainment early in life and were significantly impulsive. More studies are necessary to investigate further the risk processes that encourage LO offending.
Implications for Public Policy
We think that this research has the potential to advance crime prevention policy and practice for at least three reasons. First, it is important to identify, at an early stage, different categories of individuals who are likely to offend. Clearly, the most resources, in regard to prevention and intervention, should be devoted to children who are likely to develop into LCP offending. It could be a waste of scarce and valuable resources to target AL individuals, who will desist naturally in the absence of any specific intervention. However, it would be desirable also to devote resources to preventing the development of LO offending.
Prevention and intervention should be targeted on individuals who are truly going to develop into LCP or LO offending, and not just on individuals who are likely to be convicted. As we have argued, whether a person gets convicted depends not only on their own behavior but on the response of police and courts. It is important to target individuals who are identified both by convictions and by self-reports. Fortunately, most of the childhood risk factors for LCP offending are identified by both measures, increasing our confidence that they predict LCP offending behavior rather than any biasing factors. They could form the basis of a risk–needs assessment instrument for children aged 6 to 11 who become known to the police, based on the successful Early Assessment Risk Lists (Farrington & Koegl, 2015). However, only high impulsivity was identified as a significant childhood risk factor for LO based on both measures. There are many well-validated methods of targeting key childhood risk factors (Farrington, 2015a). For example, high impulsivity can be targeted by cognitive-behavioral child skills training (e.g., Augimeri et al., 2011). Poor parental supervision can be targeted by parent management training (e.g., Sanders, 2011), and nurse home visitation (e.g., Olds et al., 1998). Low school achievement can be targeted by preschool intellectual enrichment programs (e.g., Schweinhart et al., 1993). All important risk factors can be targeted in a comprehensive and wide-ranging prevention program such as Communities that Care (Fagan et al., 2019).
Second, it is very important to identify and prevent LCP offending in particular because these offenders cause the most damage to society. The finding that individuals who become official offenders are likely to be affected by similar early factors to those that affect self-reported offenders is encouraging because it helps policymakers to plan interventions based on people. Being apprehended by the authorities becomes secondary to the knowledge of the primary effects that early life maladjustments have upon people’s social functioning, as other studies have shown (Zara & Farrington, 2019).
Third, behavior is much more unstable than people (Caspi & Moffitt, 1993). Hence, changing behavior is one thing; helping people to change their life requires an integrated developmental and social prevention approach (Homel, 2017; Zara & Farrington, 2016) that is practically sustainable across targeted populations and settings (Weisburd et al., 2017). Studies like this one could encourage a shift from Type 1 (applying the results of basic research to the development and testing of new prevention initiatives) to Type 2 (population-level impacts) translation, aimed at social and organizational reforms (Spoth et al., 2013).
These findings should also be interpreted according to the principles of intervention of the RNR model (Andrews & Bonta, 2010). The level of intervention should be adjusted to the individual’s level of risk of reoffending, which is usually assessed by the official criminal career (C-type offending; the risk principle). The level of intervention ought to focus on those problematic circumstances and criminogenic risk factors that upset the adjustment of individuals to life and that contribute to their actual criminal career (SR-type offending combined with C-type offending; the need principle). As these principles are important in designing personalized interventions, according to the individual’s cognitive resources and learning style, it follows that, for intervention to be more effective, it ought to offer coordinated professional responses to move away from the “one-size fits all” approach (the responsivity principle).
Limitations of the Study and Further Perspectives
This study is not without limitations. It provides information on a sample of working-class British males born in 1953. The extent that these findings might be generalized to the middle classes, to females, to people from different ethnic origins and living in different countries, and to people born in contemporary times remains to be explored. Moreover, this study did not specifically focus on whether certain types of offenses were more or less likely to be admitted or denied. It would be desirable to investigate this further because it could advance knowledge about the decision-making of individuals who may rationalize their offenses and minimize their severity, and about how they may decide which offenses to dismiss, to admit, to deny, or to forget.
Some methodological choices could be seen as a limit in this study. We are certainly aware of and appreciate alternative methodologies and strategies to construct offender groups, particularly semiparametric group-based trajectory models (Jennings & Reingle, 2012; Nagin, 2005; Piquero, 2008). Future research should consider using group-based trajectory models in an effort to identify SR-types and evaluate the extent to which the present classification scheme agrees with those produced from group-based trajectory models. Moreover, the dichotomization of the variables could raise some concerns over the risk of losing significant information about individual offenders. As Kraemer and colleagues (2004) stated, “no matter how adamant a researcher might be about using dimensional diagnoses as outcome measures, researchers have to make decisions that require them to use a categorical approach” to risk levels, to diagnosis, and especially to intervention (p. 20). It would not be scientifically sound, ethically acceptable, and financially sustainable to include in a treatment program individuals who are unlikely to gain any potential benefit from the treatment. Despite its limitations, this study presents the first analysis of types of individuals according to official records versus self-reports, and the first comparative study of childhood risk factors for different categories of individuals who offend.
Footnotes
Authors’ Note:
For funding the Cambridge Study in Delinquent Development (CSDD), the authors are very grateful to the Home Office, UK; the Department of Health, UK; the Department for Education, UK; the Rayne foundation, UK; the Barrow Cadbury Trust, UK; and the Smith-Richardson Foundation. For carrying out criminal record searches, they are very grateful to Gwen Gundry in the 1960s and 1970s, Lynda Morley in the 1980s, Sandra Lambert in the 1990s, Debbie Wilson in the 2000s, Owen Thomas in 2011–2012, and Lisa Robinson in 2017. They are also very grateful to the four anonymous reviewers for their critical and insightful feedback on an earlier version of this article.