
Abstract
This study aims to briefly compose a well-known tool, Youth Level of Service/Case Management Inventory, and to obtain findings on the efficient use of tools. We hypothesize that sparse modeling can identify item combinations with high predictive validity. Using follow-up data on 516 justice-impacted youths (age range = 13-19 years) in Japanese juvenile classification homes, this study obtains area under the curves (AUCs) of 0.71 and 0.72 for seven- and eight-variable models itemized using LASSO and Elastic Net, respectively, as machine learning methods. Analysis demonstrates that the brief version using sparse modeling insignificantly differed from original version, although its AUC values were slightly lower, supporting the hypothesis. Through the effort to incorporate many types of risk factors into the tool, the use of sparse modeling to extract combinations of items with high predictive power for recidivism could lead to the creation of a user-friendly, item-count scale tool for forensic settings.
Keywords
Assessing the risk of recidivism of justice-impacted persons is difficult and poses a high risk, because justice-impacted persons not only affect public safety but also freedom, including decisions about whom to incarcerate or hospitalize (Viljoen & Vincent, 2020). A comprehensive assessment should consider the offense, personal circumstances, and attitudes and beliefs of the young person. This can provide a clear indication for the types of intervention required to help a young person lead a law-abiding life (Youth Justice Board, 2006). Therefore, risk assessment in the sphere of criminal justice refers to a wide range of activities, including the collection of information and formulation of treatment plans to understand the criminality of the subject and provide treatment guidelines, although assessing how likely the subject is to reoffend is a core element here. This is because the RNR principle (Bonta & Andrews, 2023), which is the dominant evidence-based treatment theory today, calls for matching the intensity of treatment with respect to the high risk of reoffending and treating for the risk factors within the individual that increase the risk of reoffending, in terms of the risk principle for the former and the need principle for the latter. Therefore, the need for high accuracy in recidivism prediction assessment has emerged; after years of research, scholars have found that recidivism prediction in the form of checklists yields better predictive performance than clinician prediction (Desmarais et al., 2016; Grove et al., 2000; Howell et al., 2014; Wertz et al., 2023). The standard today for assessing recidivism risk employs a risk assessment tool structured as a checklist format.
Since the early attempts of Burgess (1928), scholars have continually improved risk assessment tools for data analysis and theoretical aspects. Burgess (1928) conducted item selection by crosstabulation. This method constructs a tool by accumulating items for which the recidivism rate of individuals who fell under a category is higher than those who did not. For example, it is determined whether the subject commits crimes habitually or nonhabitually, and the recidivism rate is calculated. If a factor (item) is applicable, and its recidivism rate is higher than that of the overall population, a positive score is added. Depending on whether the given recidivism rate is higher than the overall rate and the degree of discrepancy, an integer of 0, 1, or 2 is assigned, and the total score is calculated. This method is widely used because recidivism risk measurement using crosstabulation is simple and easy to analyze. As an early endeavor to introduce risk assessment tools to the public sector, the Statistical Information on Recidivism scale of the Correctional Bureau of Canada (SIR; Nuffield, 1982, 1989) was structured using this method, as well as other well-known tools such as the Level of Service/Case Management Inventory (LS/CMI; Andrews et al., 2000) and the Youth Level of Service/Case Management Inventory (YLS/CMI; Hoge & Andrews, 2002). Item selection by crosstabulation is not only easy to understand but also demonstrates sufficient predictive accuracy for practical use (Bonta et al., 1996). Nonetheless, using a multivariate analysis method that considers the relationships among multiple items of the tool is more favorable due to the existence of a correlation structure between items. Using classical linear regression models is inappropriate for statistical modeling with item selection because the dependent variable is a dichotomous one with or without recidivism. In the 1990s, computing resources became capable of calculating large amounts of data, making it easy to perform multivariate analyses. Following this trend, the Offender Group Reconviction Scale for England and Wales (OGRS) was developed using logistic regression analysis (Copas & Marshall, 1998). Around this time, recidivism studies used survival analysis (Gruenewald & West, 1989).
In the 21st century, the development of machine learning, frequently called artificial intelligence (AI), has taken dramatic steps forward. This development has had breakthrough impacts on pattern recognition, reinforcement learning, and natural language processing, which were previously difficult to implement on computers. Machine learning has also been used to measure the risk of recidivism (Ghasemi et al., 2021; Lin et al., 2020; Salo et al., 2019; Ting et al., 2018). Machine learning can be applied to various data structures and can be easily applied to predict recidivism. Binary dependent variables, those with and without recidivism, can also be handled. A further advantage of machine learning for creating predictive models of recidivism is that it allows for several independent variables or inputs. Candidates for risk assessment tool items are wide-ranging, including the risk factors of a criminogenic nature (dynamic and static risks), theoretical variables derived from various criminogenic theories (e.g., bond or contact with delinquent culture), and demographic variables (e.g., age and gender), in addition to the type of the crime and manner of offense. In many machine learning models, large numbers of variables can be simultaneously fed into the model as input. Regarding how to process information on a large amount of input independent variables, machine learning approaches show a twofold split. One regards how information about several variables is handled directly in machine learning models to form predictive information on recidivism. These are neural networks, often referred to as deep learning, and improved methods of decision tree algorithms called random forests (Breiman, 2001), and gradient boosting trees. Neural network-based recidivism prediction models include a risk assessment tool, Structured Assessment Violent Risk for Youth (SAVRY; Borum et al., 2002), produced by Tolan et al. (2019) using Catalan juvenile data; a random forests-based model by Ozkan et al. (2020) for studies using data on justice-impacted youths who committed sexual offenses in Florida; a model used by Berk (2017) for justice-impacted persons at the Pennsylvania Board of Probation and Parole; the Gradient Boosting Tree (GBT) based model used by Tollenaar and Van Der Heijden (2019) for justice-impacted persons using data from the Netherlands and North Carolina; and a model used by Mori et al. (2024) for Ministry of Justice Case Assessment (MJCA) tool for justice-impacted youths in Japan. These models have shown some improvement in their ability to predict recidivism, by drawing information from all the independent variables that are fed in simultaneously. On the contrary, machine learning methods called LASSO (Tibshirani, 1996) and Elastic Net use a linear regression model to estimate the coefficients of variables that have little effect on predicting recidivism to zero for a large number of independent variables simultaneously entered, which is called shrinkage estimation and constructs a recidivism prediction model with a small number of selected variables. Hamilton et al. (2019) used LASSO and Elastic Net to reconstruct a youth risk assessment tool in Washington State, USA, and confirmed its usefulness. The current study examines the effectiveness of this method of shrinkage estimation with LASSO and Elastic Net for selecting items for the risk assessment tool. The study will be conducted by creating a shortened version of a well-known tool, YLS/CMI.
When creating a new risk assessment tool or modifying an existing one, item selection is essential. For example, in the development of the Japanese MJCA, 87 candidate items were initially presented that were assumed to predict recidivism drawing on criminological theoretical variables and psychological observations in criminal delinquency forensic settings, although item selection was conducted using linear regression models and nonparametric tests to extract variables related to recidivism. Thus, the number of items was reduced, and 52 items were eventually selected (Mori et al., 2024). The degree to which each item is associated with recidivism will remain unclear until the final data analysis; therefore, a large number of candidate items are required to create a risk assessment tool before the analysis.
During item selection for a risk assessment tool, the problem of combinatorial explosions emerged in the composition of a multivariate model that attempts to extract the best combination of items from multiple ones. For instance, in a typical linear regression model, the linear predictor is given p variables. The YLS/CMI comprises 42 items; thus p = 42. How then can we incorporate or omit any variable into and from the model to identify a combination that can achieve optimal recidivism prediction? If number of variables is three, after an exhaustive search, the number of combinations is 23, equal to eight models. For as few as eight combinations, it is easy to evaluate all eight models using an index such as the Akaike Information Criterion (AIC). However, this combination explodes with the increase in the number of variables. The YLS/CMI contains 42 variables, resulting in 242 = 4,398,046,511,104 models. Today’s computers can calculate this amount, although it eventually unmanageable if the number of variables increases to 100 or 200. For variable selection in this context, scholars have used a stepwise method in which variables are added or omitted according to statistical significance or AIC. Nonetheless, evidently, the stepwise method does not search for all combinations of variables and presents no guarantee that the results will be optimized.
LASSO and Elastic Net are types of sparse modeling and are considered machine learning methods, which constrains parameters when estimating regression coefficients. This feature enables variable selection by estimating several parameters reduced to zero. As parameter estimation is based on the least-squares method or maximum likelihood estimation with the addition of a constraint term, it differs from the stepwise method in that it is an optimization. In this study, we tested the usefulness of LASSO and Elastic Net, which can identify combinations of items with high predictive validity for recidivism risk. This test is performed by composing a brief version of the YLS/CMI. Selecting items for a tool is an essential process when developing or improving a tool, and the method for item selection directly influences predictive validity, which is the most important function of a tool. Therefore, investigating effective and efficient methods for item selection is meaningful. In addition, creating a brief version of a tool and comparing with the full version are important, because it adds flexibility and variation to the use of the tool for criminal forensic settings and expands its utility and applicability.
Usefulness of the Brief Version of a Tool and Way to Compose It
This study examines the item selection capability of sparse modeling using LASSO and Elastic Net to create a shortened version of the YLS/CMI. The advantages of the brief version are as follows. The use of the full version requires detailed interviews and a close examination of criminal records, making the use of the full version time consuming and labor intensive (Cooke et al., 1999). The reduction of items will decrease the time and effort involved in assessment as well as errors in rating (Cuervo & Villanueva, 2018). Thus, a brief version that saves time and effort in screening to determine the need for assessment would be beneficial (Chu et al., 2014; Hoge & Andrews, 2009). The brief version is a condensed one of the factors that lead to recidivism. Therefore, using brief version in screening, insight can be easily gained regarding important factors that best predict future offenses (Campbell et al., 2014).
Moreover, the full version of the tool is extensive in what it assesses, which may make it difficult to obtain all the information required for the tool if an assessment must be done urgently. Using them may be difficult in cases of domestic or parental violence, in which an urgent risk assessment is essential for deciding whether or not to separate the youth from parents (Villanueva et al., 2020). In the study of Campbell et al. (2014), the implementation of an abbreviated version cut the time taken to process justice-impacted persons in court by more than half, allowing for quicker identification of juveniles who are less likely to reoffend when selecting probationers. Furthermore, in the long run, these shortened versions of the tool can help reduce long-term costs for court staff and probation officers. Criminal justice agencies typically suffer personnel and time shortages; thus, an abbreviated version of the tool is useful for meeting these requirements.
However, the use of the shortened version does not entail that the full version is not required. There are some good reasons for the creation of original full version. The development of risk assessment tools has passed from the second generation, where tools consisted solely of static risk factors, to the third generation, which began to incorporate dynamic risk factors (Andrews et al., 2006). To prevent reoffending, risk assessment tools need to assess factors that target treatment. The shortened version is likely inadequate for developing treatment guidelines because of limited accessible areas. The shortened and full versions each have advantages and disadvantages, and it is important to distinguish between the two. Nevertheless, the shortened version, as noted above, has greater advantages.
Two methods can be used for creating a brief version: (1) focus on items from the theoretical perspective and (2) select items from the statistical perspective such as predictive validity. In practice, considering which of the two approaches to use includes the practicality of the tool in the field. First, we focus on developing a theoretical perspective for the abbreviated version of the tool. The earliest brief version of the YLS/CMI was the screening version (YLS/CMI: SV) with eight items by Hoge and Andrews (2009), the developers of the original version. The YLS/CMI comprises eight domains called the Central Eight (Bonta & Andrews, 2023), and the shortened version comprises one item from each domain. Two items extracted from the Family Environment/Parenting and Attitudes/Orientation domains were rated using a 4-point Likert-type scale, and six items extracted from the six other domains were rated using dichotomous responses. It was theory based as it was designed to encompass eight different areas related to recidivism. This version was composed by theory, although predictive validity was also confirmed. Van de Ven (2004) examined the psychometric properties of the YLS/CMI: SV on a Canadian sample and found that the scores were significantly associated with future crimes, correlations with predictive outcome measures ranged from 0.16 for new violent convictions to 0.31 for new charges which confirms the predictive validity of the brief version of the tool.
In a recent instance of a theoretically shortened version of the scale without relying on statistical analysis, Cuervo and Villanueva (2018) transformed the scores for each YLS/CMI domain into Likert scale as follows for the brief version. This screened version was created by simplifying the calculation of each risk factor in each of the eight domains and simplifying the scoring method rather than removing the items themselves. This simplification does not involve optimizing the prediction of recidivism through statistical processing. This is based on the idea that risk assessment is possible even if the information possessed by individual risk factors is diluted, as long as the number of risk factors is not reduced. Cuervo and Villanueva (2018) did not use statistical analysis to compose the brief version, although they tested predictive validity using area under the curve (AUC); the AUC for YLS/CMI brief version for a Spanish sample is 0.78, sufficient for predicting recidivism The brief version of Cuervo and Villanueva (2018) is similar to the full version in terms of predictive ability. The AUCs of other studies for the full version of the YLS/CMI are 0.62, 0.75, 0.64, 0.76, and 0.64 for samples in the United States (Onifade et al., 2008), Canada (Peterson-Badali et al., 2015), the United Kingdom (Rennie & Dolan, 2010), Japan (Mori et al, 2017), and Singapore (Chu et al., 2015), respectively.
Second, we focus on developing a statistical perspective for the brief version of the tool. Campbell et al. (2014) created a brief version using statistical methods instead of theoretical perspective and calculated the AUC for each item in a US sample and selected 10 items, which reached significance at the 5% level. The associations between the different YLS/CMI items and recidivism were determined by measuring the AUC; all items with significant AUC were collected to form a shortened version of the instrument. The AUC based on the total score for this brief version was 0.67. Villanueva et al. (2020) also used statistical methods to select items and produce a brief version. Using odds ratio and stepwise logistic regression analysis for a Spanish sample, they selected six items from the YLS/CMI and simultaneously added one protective factor item to create a seven-item version, whose AUC was as high as 0.83. Nonetheless, this AUC value was obtained using the data used for item selection to validate prediction accuracy, which may have resulted in overfitting. These previous studies indicate that, compared with the full version, the brief version of the YLS/CMI exhibits comparable prediction performance, and given the merits of the brief version, the creation of a brief version is meaningful.
Cross-Cultural Issues and Hypothesis
The YLS/CMI was developed in North America, and this raises the question of its applicability in a cross-cultural context, such as the present sample in Japan, where Takahashi et al. (2013) found an AUC = 0.72 for the predictive validity of recidivism, indicating that its application to the sample is sufficiently valid. However, the prevalence of substance abuse in the Japanese population is low as compared to the North American population. Thus, cross-culturally, although it has predictive validity as a tool, the prevalence and thresholds for each of the sub-risk domains may exhibit cultural differences, and in such cases, a particular risk domain may not act as a significant predictor. Therefore, in this study, the prevalence of different risk domains was considered, and the validity of risk domains associated with cultural differences was examined in the analysis.
This study was conducted to test the effectiveness of the LASSO and Elastic Net machine learning methods for selecting items for a risk assessment tool. This testing will be conducted by creating a shortened version of YLS/CMI. We hypothesize that sparse modeling using LASSO or Elastic Net can identify item combinations related to recidivism risk with high predictive validity.
Method
Sample and Procedure
Data were collected from 516 Japanese justice-impacted youths at juvenile classification homes (JCHs; male: n = 443, mean age = 16.8 years, SD = 1.51, age range = 13-19 years; female: n = 73, mean age = 16.4 years, SD = 1.53, age range = 14-19 years). Data were divided randomly into training dataset (n = 258, mean age = 16.7 years, SD = 1.49, age range = 13-19 years) and testing dataset (n = 258, mean age = 16.9 years, SD = 1.55, age range = 13-19 years). The training dataset was used to compose a model for predicting recidivism, whereas the testing dataset was used to evaluate the predictive validity of the composed model. This approach is considered for the following reasons. This is because using the training dataset to assess model performance creates an overfitting problem, where the predictive power is unjustifiably high.
In Japan, juvenile protection proceedings are initiated when a juvenile aged less than 20 years commits a crime, different from adult criminal court proceedings. Under the Japanese juvenile justice system, all cases of juvenile delinquency are referred to the Family Court. If a judge determines that a detailed investigation of the character of the juvenile is necessary for rehabilitation, then the juvenile is sent to a residential facility called JCH to undergo evaluation. The JCH functions as a prehearing assessment center and a detention institution for those awaiting hearing (Takahashi et al., 2013). An assessment procedure at JCH, which is known as classification, is conducted. The objective is to identify qualitative and environmental problems that may have influenced the juvenile’s behavior and to provide appropriate remedial measures based on professional knowledge, medical skills, psychology, pedagogy, and sociology. JCH notifies the Family Court of the results of the assessment. The final decision of the Family Court includes two major dispositions, namely, sending the juvenile to a reformatory (to undergo correctional education in an institution) and placing the juvenile on probation (to remain at home and constitute within the community under the guidance of a probation office). Another disposition is to submit the case to the same criminal court procedures as adults aged more than 20 years. Dispositions are mainly based on the seriousness of the case and the likelihood of recidivism. Generally, the assessments were performed upon admission to JCH. During a period of commitment at JCH, a Japanese Ministry of Justice psychologist and a Family Court investigator conducted the YLS/CMI assessment. Data were collected with the permission of the Japanese Ministry of Justice and the Japanese Family Court. For ethical considerations, data were anonymized and unrecoverable, and no personal data were collected. Ethical approval of the study was obtained from the university of the first author.
Measures
Outcome
Recidivism was defined as reentry to JCH; when a youth who has left JCH reoffends, based on the decision of the Family Court, the youth is admitted back to JCH if the criminal case has some seriousness and the judge decides that a detailed investigation of the youth’s characteristics is necessary for rehabilitation. Whether or not the juvenile returned to JCH was indicated using a dichotomous scale (1: recidivism, 0: no recidivism). Information on recidivism was collected from official records. The mean follow-up time was 574.5 days and the study found that 106 of 512 individuals were readmitted to JCH, which produces an overall recidivism rate of 20.7%.
Youth Level of Service/Case Management Inventory
The YLS/CMI (Hoge & Andrews, 2002) is one of the most well-known risk assessment tools for justice-impacted youths (Chu et al., 2015; Onifade et al., 2008; Takahashi et al., 2013; Villanueva et al., 2020). It consists of 42 items, each of which is dichotomous (1: presence; 0: absence), and the score is calculated by summing each value of the items. Moreover, the items are divided into eight domains, namely, (1) Prior and Current Offenses/Dispositions (four items), (2) Family Circumstances/Parenting (six items), (3) Education/Employment (seven items), (4) Peer Relations (four items), (5) Substance Abuse (four items), (6) Leisure/Recreation (three items), (7) Personality/Behavior (seven items), and (8) Attitudes/Orientation (five items). Within a domain, each item is assigned a sequence of alphabetic characters, and each item can be identified by combining a domain number and alphabetic characters. For instance, 5b indicates that this item is the second item in (5) Substance Abuse domain. The 42 items of the YLS/CMI used in this study are from the risk and needs assessment section and do not include protective factors or other noncriminogenic needs.
The JCH psychological specialist or a Family Court investigator assessed and scored the YLS/CMI during incarceration of the participant at the JCH. For items 5b, 5c, 5d, and 5e (Substance Abuse), the positive rate for nonrecidivists was greater than that for recidivists: 5b: nonrecidivists: 7/410 (1.7%), recidivists: 0/106 (0.0%); 5c: nonrecidivists: 4/410 (1.0%), recidivists: 1/106 (0.9%); 5d: nonrecidivists: 5/410 (1.2%), recidivists: 1/106 (0.9%); 5e: nonrecidivists: 4/410 (1.0%), recidivists: 0/106 (0.0%). Therefore, we excluded these four items from analysis and use 38 items from the YLS/CMI. Japanese justice-impacted youths are less likely to abuse drugs (Matsuura, 2015; Takahashi et al., 2013), and juveniles with severe substance abuse tend to be sent to a medical protection system rather than the juvenile justice system, which may result in less readmissions to the JCH.
The YLS/CMI was managed by Multi Health System, and for rights reasons, item details are not given in this article. Although no details are given in this article, items can be identified by the name of the area and an alphanumeric designator (e.g., 3a, 5b). The combination of numbers and alphabetic characters allows items to be identified, enabling researchers who require these data to purchase an YLS/CMI from Multi Health System and check its contents against the item numbers listed in this article.
Analytic Strategy
To avoid overfitting, we first compose a brief version of the YLS/CMI by item selection using the training dataset (n = 258). Next, the composed brief version model is applied to the testing dataset (n = 258) to test the predictive validity of the tool for recidivism.
The authors used LASSO, Elastic Net, and the stepwise method to compose the model through item selection. In this study, to use a binary variable such as recidivism as the dependent variable, we used LASSO and Elastic Net for logistic regression analysis. For the most basic classical linear regression models, LASSO and Elastic Net are estimated by imposing the L1 and L2 norms of the β coefficients as constrains when the least-squares method is adopted to estimate the parameters. This constraint can be attached not only to least-squares method in classical linear regression but also to the likelihood function used in logistic regression analysis to estimate parameters using the maximum likelihood method.
To assess the predictive accuracy of these models, a logistic regression model was tested using scores from a simple sum of YLS/CMI 38 variables, which was used in this study as the dependent variable. The original version of the YLS/CMI included 42 items; however, in this study, as shown above, the items relating to drug use were reduced by four items in that area, resulting in 38 items being analyzed, as there are few Japanese who fall into this category. As the 38-item total score model means that all the information from the YLS/CMI is used, this total score model can serve as a benchmark for assessing the predictive performance of a shortened version of the tool with fewer items. If the shortened version of the model produced by LASSO and Elastic Net has a predictive validity similar to the 38-item model, then it is termed that the shortened version is effective.
The study used the AUC to measure the predictive validity on recidivism, which takes values from 0 to 1.0 with 0.5 being the chance level. The higher the value is, the more accurate the prediction will be. The hypothesis is supported if the results demonstrate that the brief version obtained through LASSO and the Elastic Net model presents a comparable predictive performance to the model using information on the 38 items.
Results
Descriptive Statistics
In Japan, if a justice-impacted youth in JCH is considered to be highly delinquent as a result of an assessment at JCH, the judge sends him or her to a juvenile training school, an institutional treatment. The results of this treatment choice may influence the prediction of recidivism. Supplemental Table S1 (available in the online version of this article) provides training and testing data of the number of people who returned to the community immediately after leaving JCH versus those who returned to the community after being detained at a juvenile training school, which performs correctional education. A chi-square test showed no significant difference between the training and testing data.
Theft crimes accounted for 30% of the total, followed by assault, which was the second most common. The low number of drug offenses is a characteristic of juvenile crime in Japan. Females commit fewer assaults than males. Supplemental Table S2 (available in the online version of this article) provides the number of types of crimes where youths were originally convicted.
One-way ANOVA of the difference between the means of the scores of the males and females showed that male youths are significantly less common than female youths in the (2) Family Circumstances/Parenting domain. The (5) Substance Abuse domain had low scores for males and females. Supplemental Table S3 (available in the online version of this article) provides the mean YLS/CMI score for each of the eight domains.
Supplemental Table S4 (available in the online version of this article) presents the basic statistics for the extracted items using the LASSO, Elastic Net, and stepwise method. The items indicated in Supplemental Table S4 only relate to items selected using either the Lasso, Elastic Net, or stepwise methods. No items were selected in the areas of (1) Prior and Current Offenses/Dispositions, (4) Peer Relations, or (8) Attitudes/Orientation. With the exception of items 3d, 5a, and 7a, the mean scores on the items for being a recidivist were significantly higher than the mean scores on the items for being a nonrecidivist.
The total score of the 38 YLS/CMI items was calculated as a benchmark model for evaluating the performance of the brief version of YLS/CMI. The mean and SD of the total 38-item score were 11.7 and 6.0, respectively. The predictive ability of this total score for recidivism was AUC = 0.77, 95% confidence interval, CI [0.70-0.84]. A brief version of the model with a value lower than AUC = 0.77 would have poorer predictive performance than the full version.
The aim of this study was to test the effectiveness of machine learning methods such as LASSO, Elastic Net, and others in selecting items for creating risk assessment tools, and therefore, we did not perform gender moderation. This was validated through the creation of a shortened version of the tool: the original YLS/CMI created items without distinction between men and women, and the shortened version created in an earlier study was not analyzed in terms of gender differences in item selection. Furthermore, in this data analysis, there were no significant differences between men and women in their scale scores in domains other than (2) Family Circumstances/Parenting, so we do not believe that the effect was significant.
Model Evaluation After Item Selection
The original YLS/CMI has 42 items. Our Japanese data had a small rate of testing positive in four items within the area of substance abuse. In general, Japanese juvenile delinquents tend to have fewer drug offenses. Therefore, four items in the substance abuse domain were excluded from our analysis, resulting in effective analysis of 38 items. In this section, we used three methods: logistic regression with LASSO, logistic regression with Elastic Net, and logistic regression with a stepwise approach. The stepwise method was adopted for modeling because it is an often-used method in logistic regression analysis for item selection, forming an older method contrasting with machine learning. The item variables from sparse modeling are done using shrinkage estimation with LASSO and Elastic Net. In shrinkage estimation, several parameters become zero when estimating regression parameters appear in the model; it is different from the stepwise method. We performed item selection and evaluated predictive validity using the composed shortened model. Supplemental Figure S2 (available in the online version of this article) depicts the solution path of LASSO using the training dataset. Each line corresponds to a regression coefficient, and the process of the shrinkage estimation of the parameters as λ on the horizontal axis increases using LASSO, because the vertical axis served as the value of the regression coefficient. Supplemental Figure S1 (available in the online version of this article) illustrates the process of searching for the optimal point of predictive power for recidivism through cross-validation. The λ that minimizes the binomial deviation in the training dataset specifies the model that optimizes recidivism prediction in the training dataset.
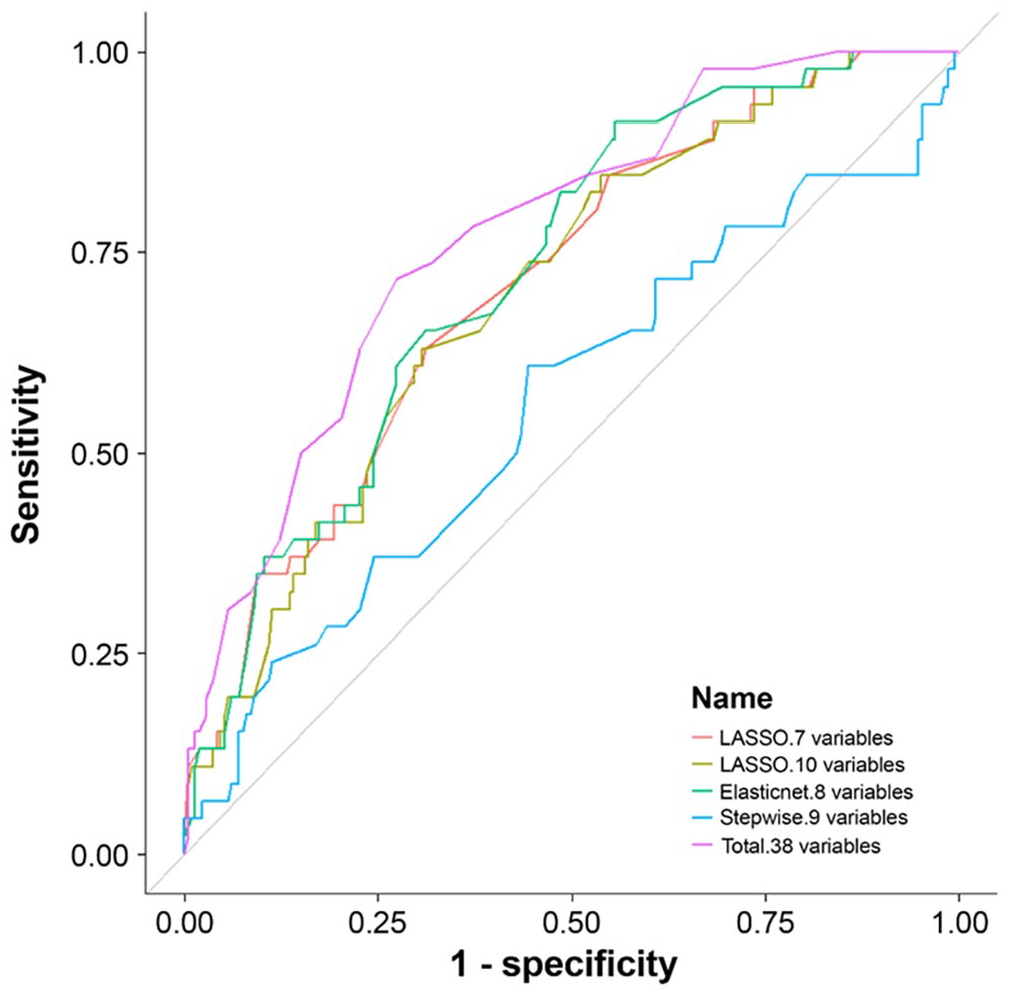
Applying the abovementioned process of analysis, Table 1 presents the regression coefficients for each item-selected models and the predictive performance of each model. Supplemental Table S5 (available in the online version of this article) lists the final items that were retained and their AUC. Figure 1 illustrates the receiver operating characteristic (ROC) curves for each model, in which the ROC curves nearing the upper left indicate better prediction performance. The area between the ROC curve and the diagonal line is the AUC. Using the method with LASSO, seven variables were selected with a λ of 0.038 that produced the most predictive model calculated by cross-validation. This model yielded AUC = 0.71, 95% CI [0.67-0.80]. Although the benchmark AUC for the score model of the 38-item YLS/CMI was 0.77, indicating that the seven-variable model was less predictive than the benchmark, no significant difference was found between the seven-variable model and the score model of the 38-item YLS/CMI (Z = −1.67, p = .09; DeLong et al., 1988).
Selected Items and AUCs for Stepwise, LASSO, and Elastic Net
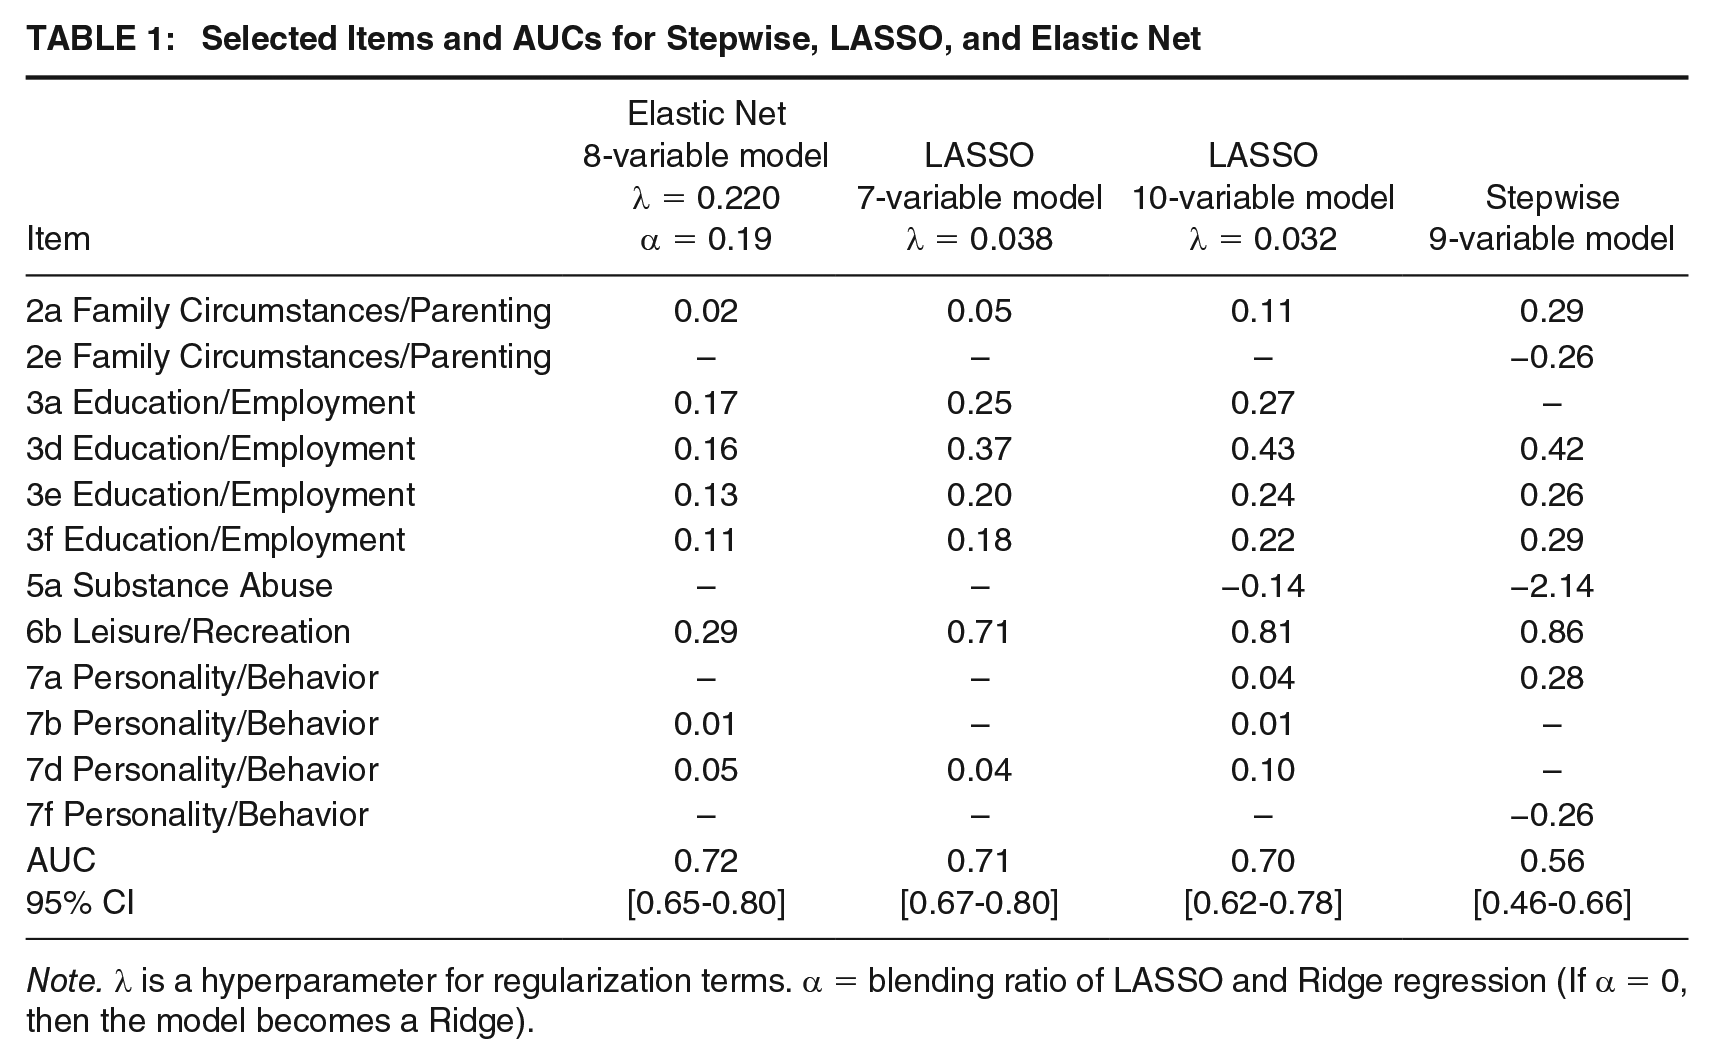
Note. λ is a hyperparameter for regularization terms. α = blending ratio of LASSO and Ridge regression (If α = 0, then the model becomes a Ridge).
ROC Curves for Each Prediction Model (n = 258)
In our analysis using LASSO, we selected the seven-variable model as the optimal model. However, practical needs may occasionally require a model with several additional variables for a brief version. In such cases, the number of variables can be increased by slightly reducing λ. A slightly smaller value of λ = 0.032 and looser constraints resulted in a 10-variable model (AUC: 0.70, 95% CI [0.62-0.78]). The 10-variable model was slightly less predictive than the 7-variable model and significantly lower than the AUC of the 38 YLS/CMI items (Z = −1.93, p < .05). By increasing the number of variables included in the model from 7 to 10, the model allows for a more detailed characterization of the subject’s risk factors when used in a forensic setting.
The AUC for the eight-variable model using Elastic Net (hyperparameters: λ = 0.220, α = 0.19) was 0.72 (95% CI [0.65-0.80]). This AUC was slightly lower than the 38-item YLS/CMI total score but was the highest among the simplified versions produced here. The study observed no significant difference between the AUCs of the 38-item YLS/CMI and eight-variable model using Elastic Net (Z = 1.51, p = .13). Among the brief versions with sparse modeling, no significant difference was observed between the AUCs of the 10-variable model using LASSO and the 8-variable model using Elastic Net (Z = 1.24, p = .21).
The AUC for the nine-variable model using the stepwise method was 0.56 (95% CI [0.46-0.66]), which is the lowest. The 95% CI included a chance level of 0.5, which results in a nonsignificant AUC. The stepwise method is a variable selection method previously used in linear regression models. The stepwise approach leaves nine variables in Table 1, and the AUC is significantly inferior to that produced by shrinkage estimation methods, such as LASSO. Here, the item selection ability of machine learning methods with sparse models is strong.
Discussion
In this study, we tested whether sparse modeling could identify combinations of items with high predictive validity while attempting to construct a shortened version of the YLS/CMI. We also sought to gain insight into the more efficient use of risk assessment tools. Analysis demonstrated that the brief version obtained through sparse modelings with seven-variable LASSO model and the eight-variable Elastic Net model did not differ significantly from the full version, although the AUC values of the brief versions were slightly lower than those of the full version numerically. Thus, the hypothesis that sparse modeling using LASSO and Elastic Net can identify item combinations with high predictive validity for recidivism risk was supported. Among the LASSO 7-variable, LASSO 10-variable, and Elastic Net 8-variable models, the Elastic Net 8-variable model showed the best forecasting performance with a reduced number of variables. Due to its superiority in item selection, Elastic Net 8-variable model should be considered the first choice.
On the statistical side, Campbell et al. (2014) and Villanueva et al. (2020) used statistical methods to select items that significantly predicted recidivism, creating brief versions that had comparable predictive performance to the full versions, although significantly reducing the assessment time. In Hoge and Andrews’s (2009) study, where one item from each of the eight domains of the YLS/CMI was selected to create a screening version in a completely deliberate manner, statistical validity may not be adequately assured. In this respect, the superiority of our approach is that it allows for model selection while retaining flexibility in item selection and guaranteeing statistical predictions.
In this study, item selection and modeling were based on predictive accuracy for recidivism. This was because the tool was considered accurate for predicting recidivism with respect to its use in determining the subject’s disposition, and so on, and in terms of matching treatment intensity and recidivism risk with reference to the risk principle of the RNR principle (Bonta & Andrews, 2023).
However, while saving time and effort may be desirable in certain cases (Chu et al., 2014; Hoge & Andrews, 2009), it does not necessarily mean that the fewer items the better, as long as the ability to predict recidivism can be ensured. If we are to embody the need principle within the RNR principles (Bonta & Andrews, 2023), we will need to assess a wide range of risk domains with regard to setting treatment goals, and the tool will then require a commensurate number of items.
When developing a new risk assessment tool to measure the risk of recidivism, numerous candidate items must be collected and selected to predict reoffense. When developing a brief version of a risk assessment tool, selecting items from the original version is also necessary. The use of sparse modeling, as demonstrated by this study, enables efficient and effective task execution. In contrast, the predictive power of the model composed using the stepwise method for recidivism was significantly lower than those of the other models. This result indicates that the models composed using the stepwise method are not beneficial for forecasting. In contrast to sparse modeling, such as LASSO, stepwise methods lack the implication of seeking an optimal solution. Although a large number of variable combinations are possible, the models explored through the stepwise method only explore a limited subset of all combinations, such that the chance of extracting models with good predictive performance for recidivism may be small. The model produced by LASSO and Elastic Net demonstrates sufficient predictive power among the brief models. There is less need to use stepwise methods for variable selection today, as sparse modeling is an easy technique to implement.
In this study, no significant difference was observed between the AUC values of the seven-variable model using LASSO and the eight-variable model using Elastic Net and the AUC values of the YLS/CMI total 38-item score model. In other words, increasing the number of variables from 7 or 8 up to 38 in the risk assessment tool will not significantly improve the predictive power of recidivism. Moreover, in the LASSO model, increasing the number of variables from 7 to 10 relatively reduced predictive power. These results are counterintuitive, because the YLS/CMI items are considered criminogenic risk factors. Based on the analysis, the study infers that increasing the number of items of the risk assessment tool does not necessarily lead to an increase in predictive power, and that a large increase in the number of items does not lead to a large increase in predictive power. Recently, Fazel et al. (2022) conducted a meta-analysis of risk assessment tools and found AUC values of 0.64 for Level of Service Inventry Revised (LSI-R; Andrews & Bonta, 1995), 0.62 for Psychopathy Check List Revised (PCL-R; Hare, 2003), and 0.73 for the Post Conviction Risk Assessment (Johnson et al., 2011). Moreover, in Olver et al.’s (2009) review, the range of AUCs for YLS/CMI in the studies examined was from 0.5 to 0.79. These AUC values do not greatly differ from the brief version of this study’s YLS/CMI (AUC = 0.70-0.72). These results also indicate that, in terms of the predictive accuracy of risk assessment tools, where there is a well-developed predictive model that has a small number of items, adding more and more theoretically valid items does not improve its predictive ability much. If this is the case, it is sufficient to assess some items using a simplified version of the tool; however, it is necessary only to predict reoffending. Furthermore, apart from the reduction in effort, there are other advantages to using the simplified version of the tool. Assessing the full version of a risk assessment tool requires significant information to assess several items across a wide range of areas. If there is a situation where an assessment must be made in the field based only on the available documentation, it may be assumed that the necessary information is not available. In these cases, the simplified version can be used to predict recidivism with a reasonable degree of accuracy, so long as information is not available on a few items. The brief version can also be useful in interviews in forensic settings, when information about the interviewee has been omitted or when investigating the retrospective risk of the youth from stored records, which are typically limited in terms of information.
The result that a shortened version of a limited-item assessment ensures a certain degree of accuracy in predicting reoffense does not necessarily mean that the full version is redundant or unnecessary. A comprehensive assessment must consider complex factors such as the nature of the offense, personal circumstances, and the youth’s attitudes and beliefs (Youth Justice Board, 2006). When formulating a treatment plan on the dynamic risk factors that should be considered to prevent justice-impacted youths from reoffending, a risk assessment tool with extremely few items is considered to cause a malfunction. The number of items required for the risk assessment tool will depend on the forensic setting. In this regard, in sparse modeling with LASSO and Elastic Net, the number of items employed in the model can be adjusted by varying the hyperparameter λ. Notably, sparse modeling has high applicability, because it can be flexibly adapted to the configuration of risk assessment tools according to the identified needs.
LASSO and Elastic Net are called sparse modeling in machine learning, a method of shrinkage estimation, which selects a few variables from a large number. In contrast, other machine learning methods include deep learning and random forests, in which several variables are input in batches and trained to make predictions. Neural networks and random forests are approaches that do not reduce the number of variables that may be used for prediction; instead, they integrate information from a large number of variables to improve predictive power. For instance, Ghasemi et al. (2021) improved the prediction accuracy of LS/CMI, which is the adult version of the YLS/CMI, using a machine learning technique called random forests. The method employed by Ghasemi et al. (2021) uses information from all variables to improve prediction accuracy instead of selecting and narrowing down the variables to be used. Naturally, if the primary concern is to ensure as much accuracy as possible, there is a rationale for collecting large amounts of information and using neural networks and random forests. Therefore, methods such as random forests and neural networks, integrating all information to predict recidivism, are also profitable for opportunity learning. However, the greater the number of items for assessment, the greater will be practitioners’ efforts in using the tool for practical purposes. It could also identify and weigh predictive items without considering the theoretical understanding of criminal behavior when machine learning approach was used (Wormith, 2017). In light of these considerations the use of sparse modeling is also promising in that it contributes to the composition of a risk assessment tool that is theoretically and practically satisfactory, while carefully selecting the items required to predict reoffending.
The current study used sparse modeling to compose brief versions of the YLS/CMI while ensuring its predictive validity. The performance of the proposed model was assessed using data that were not used to create the model to avoid overfitting, and the predictive validity of the tool presents generalizability to an unknown sample, which is a strength of this study. However, this study has limitations. First, the data on recidivism define recidivism as reentry into JCH for juveniles younger than 20 years. Therefore, the prediction of recidivism is limited to that committed by the applicable justice-impacted youths. Using the brief version of the model to predict recidivism after the justice-impacted youths turn 20 can be described as an extrapolation, which reduces the statistical validity of the prediction. In forensic practice, considering recidivism after the age of 20 years is desirable; if such a need appears, then collecting and analyzing data on recidivism after the age of 20 years will be necessary for criminal proceedings, which is far from the framework of juvenile justice.
Second, this study focused on the statistical validity of the brief version of the YLS/CMI. Item selection based only on statistical validity using recidivism as an external criterion may make it difficult to construct an adequate model for content validity in crime and delinquency forensic settings. The brief version of the model obtained by sparse modeling displayed adequate predictive validity but excluded any items from the fifth domain of the YLS/CMI. When developing a treatment plan to prevent reoffending, using a tool that covers the all eight domains, if possible, is desirable. The YLS/CMI: SV (Hoge & Andrews, 2009) is composed of a brief version of one item from each of the eight domains for theoretical reasons; this approach can also be considered. In addition to statistical considerations, theoretical considerations and practical circumstances should be considered when selecting items for abridged versions that will be suitable for use in the real world.
Third, recently, machine learning has been noted for its potential to raise social justice and ethical issues on people the marginalized or disadvantaged for social, economic, or political reasons. The forensic adoption of deep learning algorithms, a subfield of AI, is progressing, and concerns have arisen regarding the impact of AI biases and discrimination on patient health (Ueda et al., 2024). Machine learning is a technology that learns from data to make predictions and decisions. However, if the data used for learning are biased, the results will also reflect that bias. In this study, the variables were selected within the items of a completed and widely used tool, YLS/CMI, and the nature of the selection was not at high risk for this bias or unfairness. This is because the variables remaining after the selection had been identified as risk factors for reoffending in criminological research for many years. While this study avoided the problem of bias because it tested the effectiveness of sparse modeling in item selection by creating a shortened version of an existing tool, this feature of machine learning, which allows a large number of variables to be fed into it and select variables effective in predicting reoffending, could evoke the problem of bias. In addition to the items in the tool, machine learning allows for the input of a large number of available variables, such as gender, age, race, education, and economic status, to build a model oriented solely toward increasing predictive power. The combination of item selection in such cases should be treated with caution, as it may include bias against the marginal group, as there are no built-in mechanisms to avoid bias or inequity.
Despite these limitations, this study is notable for indicating the usefulness of LASSO and Elastic Net as methods that can extract a small number of combinations to create a model that can predict recidivism without significantly reducing the accuracy of recidivism prediction. The implication of this study is that the fact that a small number of items do not significantly reduce prediction accuracy conversely suggests that a large increase in the number of items does not significantly improve the accuracy of recidivism prediction. In terms of improving the accuracy of recidivism prediction, the study infers that the risk assessment tool created by collecting several criminogenic risk factors presents certain limitations. In this situation, an item selection process with sparse modeling would improve the ability of the recidivism prediction tool. Villanueva et al. (2020) composed a brief version of the YLS/CMI by adding new protective factor items than performing item selection. In such cases, item selection is a core technology, and the superior item selection capabilities of LASSO and Elastic Net, as demonstrated in this study, pose great potential for application. The next step will involve practical application of the shortened version in the criminal justice field. In this case, it will be necessary to apply the methods of this study to a larger sample at the site where it is to be applied and to examine the model’s predictive validity. In this case, it is advisable to select items by adjusting hyperparameters, considering the need for assessment in the field relative to which items should remain in the shortened version. In the use of the shortened version, if the tool is commercially available, as in the case of YLS/CMI, it may be necessary to purchase the full version of the tool and check only the items used in the shortened version.
If the composed, abbreviated version of the tool is continuously used in judicial offending forensic practice, data from the field will accumulate, and these data can be used for training, thereby allowing the model to be updated. Updating this model may enable the tool to flexibly respond to the changes in social conditions and other factors over time. In addition, parameter estimation may gain stability if the sample size of the training data is increased. However, larger data samples may not lead to ever-increasing improvements in the ability to predict recidivism. In recent years there has been a call for risk assessment tools to incorporate factors such as neurobiological measures (Zijlmans et al., 2021), changes during probation and other in-social treatments (Stone et al., 2021), gender-specific needs (Van Voorhis et al., 2010), type and severity of offense, local realities (Hamilton et al., 2019), as well as traditional risk factors for crime. In the process of incorporating many types of risk factors into the tool, using sparse modeling to extract combinations of items with high predictive power for recidivism could create a user-friendly, item-count scale tool in judicial offending forensic settings that could improve the predictive power of traditional risk assessment tools.
Supplemental Material
sj-docx-1-cjb-10.1177_00938548241297280 – Supplemental material for Selecting Items to Compose a Brief Version of the Youth Level of Service/Case Management Inventory Using Machine Learning, Sparse Modeling
Supplemental material, sj-docx-1-cjb-10.1177_00938548241297280 for Selecting Items to Compose a Brief Version of the Youth Level of Service/Case Management Inventory Using Machine Learning, Sparse Modeling by Takemi Mori and Yoshikazu Shimada in Criminal Justice and Behavior
Footnotes
Authors’ Note:
This work was supported by JSPS KAKENHI (grant number JP20K03452). There are no conflicts of interest to disclose.
Author Contributions
Takemi Mori: Conceived and designed the analysis; Involved in data collection; Contributed data/analysis tools; Performed the analysis; Wrote the paper.
Yoshikazu Shimada: Involved in data collection; Contributed data/analysis tools; Wrote the paper.
Data Availability
The datasets generated and analyzed during this study are not publicly available because the data were collected with permission from the Japanese Ministry of Justice and Family Court for our study, and we have not received permission to make the data public.
Ethics Approval
Ethical approval of this study was obtained from the Konan Women’s University (approval number: 2021040).
Supplemental Material
References
Supplementary Material
Please find the following supplemental material available below.
For Open Access articles published under a Creative Commons License, all supplemental material carries the same license as the article it is associated with.
For non-Open Access articles published, all supplemental material carries a non-exclusive license, and permission requests for re-use of supplemental material or any part of supplemental material shall be sent directly to the copyright owner as specified in the copyright notice associated with the article.