
Abstract
This study evaluates the interrater reliability and predictive validity of a relatively new risk assessment tool designed for use in forensic outpatient populations, the Forensic Outpatient Risk Assessment and Evaluation (FORE). Data were collected from two samples: the first comprising 80 outpatients to assess interrater reliability between therapist–student and student–student rater pairs, and the second consisting of N = 1,268 patients for predictive validity analysis. Interrater reliability was generally good for static factors. The dynamic factors displayed more variability, with intraclass correlation coefficient values ranging from poor to good. The results demonstrated a good predictive validity for general recidivism (area under the curve = .72). The overall calibration was good (expected/observed [E/O] index = .98), although the lower predicted risk levels were overestimated and the higher levels underestimated. The overall findings suggest that FORE is a useful tool for forensic risk assessment, though further research into the psychometric qualities of the FORE is required.
Introduction
Risk assessment is fundamental to forensic outpatient treatment, enabling practitioners to evaluate recidivism risk and inform treatment planning (Bonta & Andrews, 2024; Klinger et al., 2020). Globally, over 400 risk assessment instruments are currently in use across forensic settings (Singh et al., 2014), with tools such as the HCR (historical, clinical, risk management)-20 (Webster et al., 1997) and level of service instruments (Andrews & Bonta, 1997; Andrews et al., 2004) being most widely adopted. These instruments typically combine static historical factors with dynamic changeable factors, allowing practitioners to assess both baseline risk and treatment targets within structured professional judgment (SPJ) or actuarial frameworks (Webster et al., 1997).
In the Netherlands, forensic outpatient treatment represents the dominant correctional response. Between 2013 and 2017, 49% of all convicted individuals (N = 29,666) received mandatory outpatient treatment, compared with 8% receiving inpatient treatment, 15% a combination of detention and treatment, and 28% imprisonment (Drieschner & Tollenaar, 2021). Patients enter this system through two pathways: voluntary referral by general practitioners or court-mandated treatment supervised by probation services. Treatment follows the risk–need–responsivity (RNR) model (Bonta & Andrews, 2024), targeting criminogenic needs such as impulsivity, substance abuse, and antisocial attitudes through cognitive-behavioral interventions. The intensity and duration of treatment are adjusted based on assessed recidivism risk.
This large outpatient population creates substantial demands for efficient, reliable risk assessment. Unlike smaller forensic populations where consensus-based assessments by multiple professionals are feasible (De Vogel & de Ruiter, 2004), the scale of Dutch outpatient services necessitates single-assessor evaluations with biannual routine monitoring. This context places particular emphasis on interrater reliability and sensitivity to change, psychometric properties essential for both quality assurance and treatment evaluation.
The Need for a Standardized Dutch Forensic Outpatient Tool
In 2015, the Dutch Ministry of Safety and Justice commissioned the development or selection of a standardized risk assessment instrument for forensic outpatient services. This initiative responded to significant heterogeneity in assessment practices. An inventory by Van Horn, Eisenberg, and Uzieblo (2016) identified 22 distinct risk assessment instruments in use across Dutch forensic outpatient centers, including Dutch translations of the Level of Service Inventory—Revised (LSI-R, Lammers & Philipse, 2003), HCR-20 (Philipse et al., 2000), Short-Term Assessment of Risk and Treatability (START, Lam et al., 2009), B-SAFER (De Ruiter, 2009), and Static-99 (Van Beek et al., 2001).
The Ministry specified five requirements for an optimal instrument: (1) psychometric quality superior or equivalent to existing tools, (2) efficiency: maximum 25 items administrable within 30 minutes to enable biannual routine monitoring, (3) prediction target: general recidivism (any new offense) within 12 months, (4) sensitivity to change: 5-point scales for risk factors and overall risk classification to detect treatment progress, and (5) broad applicability: suitability across offense types (violent, sexual, property, and domestic violence) without requiring offense-specific versions.
Evaluation of existing instruments revealed none fully met these criteria. While several tools demonstrated acceptable psychometric properties in Dutch samples-LSI-R item-level interrater reliability ranged from weak to excellent (.44 ≤ intraclass correlation coefficient [ICC] ≤ .96; Lammers & Philipse, 2003), Static-99 showed strong overall reliability (ICC = .85; Smid et al., 2014), and START demonstrated moderate predictive validity (area under the curve [AUC] = .70; Troquete et al., 2015), each had significant limitations.
The LSI-R’s 54 items proved too time-consuming for routine biannual monitoring, requiring 45 to 60 minutes per assessment. The HCR-20V3, revised in 2013 with input from Dutch researchers, offered strong theoretical grounding and SPJ methodology, but its 3-point item scoring (absent/possibly present/present) limited sensitivity to change, a critical requirement for treatment monitoring (De Vet et al., 2011). The START, designed for short-term risk assessment in psychiatric settings, focused on imminent rather than 12-month risk. Offense-specific tools like the Static-99 (sexual offenses) and B-SAFER (domestic violence) could not be applied across the heterogeneous outpatient population, which includes individuals convicted of property crimes, violence, sexual offenses, and domestic violence in varying proportions.
Critically, the diversity of instruments hindered systematic outcome comparison across treatment providers, a priority for the Ministry’s quality assurance and funding allocation decisions. Combining these practical and psychometric limitations, the Ministry concluded that developing a new instrument tailored specifically to Dutch forensic outpatient requirements would better serve the field than mandating adoption of an existing tool with partial fit. Thus, the FORE was developed not to replace well-validated tools in other settings, but to fill a specific gap in Dutch large-scale forensic outpatient care under strict efficiency and monitoring requirements.
Development of the FORE
The Forensic Outpatient Risk Assessment and Evaluation (FORE; Van Horn, Eisenberg, Bouman, Van den Hanenberg, & Bogaerts, et al., 2016) was developed through a comprehensive multimethod study conducted between 2013 and 2016 across multiple Dutch forensic outpatient centers. This process included: (1) a metaanalysis of recidivism predictors in Dutch samples (Van Horn, Bogaerts, et al., 2016), (2) secondary analyses of existing risk assessment data from 2,500+ outpatients (Van Horn, Eisenberg, Bouman, Van den Hanenberg, Van der Put, & Bogaerts, 2016), and (3) a prospective field study validating candidate risk factors (Eisenberg et al., 2020).
The development study confirmed that the “Central Eight” risk factors identified in North American research (Andrews & Bonta, 1997), criminal history, antisocial personality, antisocial attitudes, antisocial associates, substance abuse, family/marital problems, school/work problems, and lack of prosocial leisure, predicted recidivism in Dutch forensic outpatients (AUCs ranging from .62 to .71). In addition, financial problems emerged as a significant predictor specific to the Dutch context (AUC = .68), likely reflecting the relationship between debt and property crime in a country with comprehensive social welfare but also high living costs.
The resulting FORE comprises 17 risk factors: six static historical factors and 11 dynamic changeable factors (see Method section for complete item descriptions). Each item is scored on a 5-point scale (0 = no problems/potential protective factor; 4 = severe problems related to criminal behavior) based on structured indicators. The FORE generates two risk predictions: (1) an actuarial classification (very low to very high risk) derived from static factor scores with corresponding empirically derived recidivism probabilities, and (2) an SPJ rating (0-5 scale) that combines static and dynamic factors with clinical judgment to adjust risk level based on individual circumstances.
This dual-prediction structure operationalizes both the RNR model and the Good Lives Model (GLM; Andrews et al., 2011; Ward & Stewart, 2003). The RNR model emphasizes reducing risk by targeting criminogenic needs (high FORE scores), while the GLM focuses on building strengths and protective factors (low FORE scores representing competencies). By scoring the full range from protective to problematic functioning, the FORE supports both deficit-focused intervention planning and strengths-based case formulation. Notably, the developmental study found that protective factors did not improve prediction beyond the absence of risk factors (Van Horn, Bogaerts, et al., 2016); however, low scores may serve as responsivity factors, individual characteristics like stable housing or strong social support that enhance treatment engagement and completion.
Formative Measurement Structure and Psychometric Implications
Risk assessment instruments have a formative rather than reflective measurement structure (De Vet et al., 2011). In reflective models, items are interchangeable indicators of an underlying latent construct (e.g., depression symptoms reflecting depressive disorder). In formative models, items are distinct causal contributors that define the construct (e.g., risk factors causing recidivism). Each FORE risk factor captures a unique aspect of recidivism risk, criminal history, substance abuse, and employment problems are not interchangeable but represent independent pathways to reoffending.
This formative structure has critical psychometric implications. Internal consistency (e.g., Cronbach’s α) is inappropriate for evaluating formative instruments because items are not expected to correlate highly; removing an item reduces construct coverage rather than measurement redundancy (Smits et al., 2018). Consequently, the primary psychometric concerns for risk assessment tools are (1) Interrater reliability: Can different assessors score the same construct consistently? High agreement indicates clear operational definitions and minimizes rater bias and (2) Predictive validity: Does the instrument accurately discriminate between individuals who will and will not reoffend? This directly tests whether the selected risk factors achieve the instrument’s purpose. These priorities guided the present validation study, with interrater reliability examined first due to its implications for implementation in a large-scale clinical population.
Interrater Reliability in Risk Assessment
Interrater reliability, the consistency with which different assessors rate the same construct, is essential for forensic risk assessment (De Vet et al., 2011; Shrout & Fleiss, 1979). Low reliability introduces subjective biases that compromise validity and undermine confidence in assessment outcomes. Three forms of rater bias are particularly relevant: (1) Confirmation bias: Selectively attending to information consistent with initial impressions (Nickerson, 1998); (2) Observer drift: Gradual, unintentional changes in how raters interpret and apply scoring criteria over time (Kazdin, 1977); and (3) Consensual observer drift: When raters within an organization develop shared scoring conventions that deviate from manual guidelines (Johnson & Bolstad, 1973).
Dutch studies of forensic risk assessment tools have revealed substantial variability in interrater reliability. A systematic review (Van Horn, Eisenberg, & Uzieblo, 2016) identified only nine studies (of 27 reliability studies) reporting actual interrater data, primarily for the LSI-R and Static-99 in inpatient settings (ICCs ranging from .68 to .90). Item-level agreement varied considerably: LSI-R items ranged from poor to excellent (.44 ≤ ICC ≤ .96; Lammers & Philipse, 2003), while B-SAFER items showed weak to good reliability (.21 ≤ ICC ≤ .74; De Ruiter, 2009).
Item complexity appears to influence reliability. The Static-99 demonstrates consistently strong agreement (overall ICC = .85; Smid et al., 2014), likely because its items assess concrete, countable information (number of prior convictions, age at first offense). Similarly, LSI-R items measuring discrete constructs (“Have you ever been fired from a job?”) show higher reliability than multifaceted items. In contrast, HCR-20 items requiring integration of multiple dimensions—such as “early maladjustment,” which encompasses both adverse childhood circumstances and the individual’s maladaptive responses—show more variable agreement (Fazel et al., 2022). These multifaceted items force raters to weigh and combine evidence from different domains into a single score, introducing subjective judgment that reduces consistency.
Given that several FORE dynamic factors assess complex constructs (e.g., “dysfunctional coping” integrates stress management, emotional regulation, and problem-solving skills), we anticipated moderate overall interrater reliability (.50 ≤ ICC ≤ .74), consistent with the mixed-complexity HCR-20 and LSI-R findings.
Predictive Validity in Risk Assessment
Predictive validity encompasses two components: discrimination and calibration (Pepe, 2003; Singh, 2013). Discrimination measures the instrument’s ability to distinguish between individuals who will and will not reoffend, typically quantified using the AUC. An AUC of .50 indicates chance performance, while 1.0 represents perfect prediction. Values of .56 to .64 reflect small effects, .64 to .71 moderate effects, and ≥ .71 large effects (Rice & Harris, 2005). Calibration assesses whether predicted risk probabilities match observed recidivism rates, for example, whether 40% of individuals classified as “high risk” actually reoffend. Calibration is typically evaluated using the E/O ratio, where 1.0 indicates perfect calibration, > 1.0 indicates overprediction, and < 1.0 indicates underprediction (Hanson, 2017).
Fazel et al.’s (2022) systematic review examined predictive validity of 11 widely-used risk tools across 36 studies (N > 597,000). In independent validation studies with samples exceeding 500 participants, discrimination was low to moderate (.57 ≤ AUC ≤ .73). The postconviction risk assessment (PCRA) achieved the highest discrimination (AUC = .73), while tools such as the Static-99 and LSI-R showed AUCs of .58 to .69. These differences may partly reflect methodological variations: PCRA studies defined recidivism as rearrest within 6 to 12 months (higher base rates), whereas LSI-R and Static-99 studies typically used reconviction over 2+ years (lower base rates). Longer follow-up periods and stricter recidivism definitions (conviction vs. arrest) reduce observed base rates, which can attenuate AUC values.
Importantly, calibration analyses remain rare in validation research. Fazel et al. (2022) noted that explicit calibration indices were reported in fewer than 15% of reviewed studies, limiting comprehensive evaluation of predictive performance. This gap is particularly problematic for clinical decision-making, as poor calibration can lead to systematic overintervention or underintervention despite acceptable discrimination.
Study Aims and Hypotheses
This study evaluates the interrater reliability and predictive validity of the FORE in Dutch forensic outpatients. We address two research questions:
This study contributes to the sparse literature on forensic outpatient risk assessment by providing the first comprehensive psychometric evaluation of a tool designed specifically for this population. In addition, by including both discrimination and calibration analyses, we address a critical gap in validation research that typically focuses exclusively on AUC values (Fazel et al., 2022). Finally, examining interrater reliability across rater types (therapists vs. students) provides practical guidance for implementation in settings where student interns or less experienced staff contribute to assessment processes.
Method
Study Settings
This multisite study was conducted across five Dutch forensic outpatient treatment centers. Adults who entered treatment between March and December 2017 were eligible for inclusion. In the Netherlands, adults may enter forensic outpatient care either voluntarily—typically following referral by a general practitioner—or through a court mandate, in which case treatment is monitored by the probation service. Treatment programs are primarily cognitive-behavioral in nature and guided by the RNR model (Bonta & Andrews, 2024). Intensity and duration are adjusted to the individual’s recidivism risk (risk principle), treatment content targets criminogenic needs such as aggression regulation or coping deficits (need principle), and interventions are tailored to the client’s abilities and characteristics (responsivity principle).
During intake, patients undergo a standard diagnostic screening to determine treatment eligibility. Exclusion criteria included the presence of active psychosis—these patients were referred to general or specialized forensic psychiatric care—and severe substance dependence requiring detoxification before participation in outpatient treatment.
Samples
Two independent patient samples were analyzed: one for the interrater reliability study and one for the predictive validity analysis. Data sharing restrictions across institutions prevented the combination of the data sets for the predictive validity analysis. To protect confidentiality, treatment centers are not named; however, the total number of raters and patients is reported for transparency.
Interrater Reliability Patient Sample
The interrater sample comprised 80 patients drawn from five treatment centers. Of these, 71.2% were male (n = 57), 8.8% female (n = 7), and for 20.0% (n = 16), sex was not disclosed. Age data were available for 60 patients, with a mean of 39.7 years (SD = 12.6, range = 20-68).
Rater Pair Groups
Two types of rater pairs were compared: therapist–student and student–student. In the therapist–student pairs, a trained student acted as a second independent rater to reduce clinician workload. Previous findings on student raters are mixed. Douglas et al. (2003) reported comparable ratings between trained students and professionals, whereas De Vogel and De Ruiter (2004) noted that differences in clinical experience and familiarity with the forensic population may influence agreement. To explore this issue empirically, interrater reliability was assessed separately for student–student pairs. Consistent agreement across both groups would suggest that any discrepancies are attributable to the instrument itself rather than to differences in raters’ background or experience.
Therapist–Student Pairs
A total of 21 therapists and nine students independently rated the 80 patients. Therapists were experienced forensic professionals holding at least a master’s or postdoctoral degree in psychology or social sciences and a minimum of 2 years of clinical forensic experience. Students held either a bachelor’s degree in (forensic) psychology or a master’s degree in forensic social work. Both groups received formal training, an 8-hour workshop in risk assessment and in the reliable use of the FORE by one of the instrument’s developers. Prior to data collection, all raters completed two consensus-scoring sessions under supervision of a senior researcher to ensure consistent application of the scoring manual.
Student—Student Pairs
For a subsample of 42 patients, an additional student completed an independent FORE assessment, forming student–student pairs. These cases were drawn from the original therapist–student pool, allowing direct comparison of rater agreement between the two pair types.
Predictive Validity Patient Sample
For the predictive validity analysis, a sample of N = 1,268 was used, consisting of 87.2% men. Of the participants, 77% were born in the Netherlands and 22.7% outside the Netherlands. The cultural identity of the sample varied strongly from their parents’ birth country, their religion or any combination of these and were therefore not included in the analyses. The average age was 36.7 years (SD = 12.4; range 18-83). In terms of treatment, 52.1% of the group was referred for a violent and/or property offense, 37.1% for domestic violence and 10.9% for a sexual offense. The primary diagnosis of more than half of the patients (54%) was in the category disruptive, impulse-control, and conduct disorders, the second largest group were patients with a diagnosis in the category personality disorders (24.6%). Two other larger groups were patients with a neurodevelopmental disorder (7.6%) and paraphilic disorders (6.4%, see Supplemental Material for the complete table).
Measures
The Forensic Outpatient Risk Evaluation (FORE, Van Horn, Eisenberg, Bouman, Van den Hanenberg, & Bogaerts, et al., 2016) contains 17 risk factors (six static and 11 dynamic): age of first contact with police (S1), number of previous and current convictions (S2), diversity criminal behavior (S3), history of rule breaking behavior (S4), history of unstable education/employment (S5), history of substance abuse (S6), dysfunctional education/employment (D1), financial mismanagement (D2), delinquent social network (D3), limited leisure activities (D4), problematic (ex-)partner relationship (D5), unstable living situation (D6), substance abuse (D7), lack of impulse control (D8), dysfunctional coping (D9), antisocial attitude (D10), and rule-breaking behavior (D11).
Static risk items are assessed over the full past including the moment of the assessment and the dynamic risk items covering the past 6 months. Each item is described with indicators which are the anchors for the score on a 5-point Likert-type scale, from 0 to 4. The lowest score “0” indicates that the patient shows no problems in this area and the assessor could argue, in the individual case, that it serves as a protective factor. The highest score of “4” indicates severe problems, which are related to criminal behavior.
The sum score of the six static risk factors corresponds to an actuarial risk classification with a corresponding risk probability for a new conviction within 2 years of the risk assessment: very low risk (0-4, 9.3%), low (5-9, 23.5%), moderate (10-11, 35.3%), mild (12-16, 45.4%), and very high risk (17-24, 56.8%; Van Horn, Bogaerts, et al., 2016). This actuarial risk classification serves as a baseline risk. For the dynamics risk factors, no research data were available for an actuarial risk classification. Therefore, an SPJ of the risk of recidivism is based on an evaluation of both static and dynamic risk factors. The SPJ is given on a 5-point scale from very low risk to very high risk. The assessor may deviate from the baseline risk.
Interview Protocol
For the data collection, an interview protocol was written by the authors of the FORE. The interview protocol contained 52 questions corresponding with the 17 items of the FORE.
The FORE manual, the interview protocol, information concerning training options and the reports describing the development of the FORE are in Dutch and for free available on https://www.fare-ambulant.nl.
Outcome Variable
Recidivism was defined as a registration of a new offense in the judicial registration system of the Research and Documentation center (OBJD, Onderzoek-en Beleidsdatabase Justitiële Documentatie) for any offense or conviction. This database is a copy of the judicial documentation system (Justitiële Documentatie Systeem-JDS) and contains the current and historical judicial information of all Dutch citizens. Different to the JDS database, information in the OBJD is pseudonymized, all identifying information is removed or encrypted. Recidivism was dichotomized, recidivism (1) and no recidivism (0). The average follow-up time was 682.5 days (Range 552–849; SD = 78.695) between the risk assessment and end of the follow-up time July 4, 2019, the predefined minimum follow-up time was 1.5 years.
Procedure
All patients provided informed consent for participation and data use in the study. They were informed about the study’s aims and procedures both in writing and orally by their therapists. Participation was voluntary, with the option to withdraw consent during the study.
Procedure Interrater Patient Sample
To ensure the practical feasibility of the study and consistency in the method and the information used for the risk assessment with FORE, several steps were taken. Therapists conducted interviews with their patients using a standardized interview protocol to gather the necessary information (see Instruments). The second rater, a student, then used a recording of these interviews to perform their own scoring at the treatment center where they worked as an intern. The recordings were also used by the student–student rater pairs. The recordings of the risk assessment interviews were stored in a secure environment within the treatment center. Only the research group and the student raters had access to these recordings. The recordings were destroyed after the data collection was completed. The difference in information source between therapists and students may be relevant when interpreting interrater reliability results.
Therapists assessed patients using the FORE tool at various stages of treatment. For 93.5% of patients, the assessment took place at the start of treatment, while 4.3% were repeated assessments, and 2.2% were conducted at the end of treatment.
Procedure Predictive Validity Patient Sample
Data from this sample were drawn from routinely biannually conducted risk assessments (routine outcome monitoring, ROM) using the FORE tool during the diagnostic phase, with follow-ups every 4 months. The ROM battery includes several instruments, with FORE being one of them. Therapists use ROM results to monitor treatment progress and adjust treatment accordingly. For this study, only baseline assessment data were used.
Power Analysis
The sample size for the interrater reliability was determined with the sample size calculator (web) of Arifin (2020; see also Bujang & Baharum, 2017). The minimal acceptable reliability (ρ0) was set at ICC = .50 and the expected reliability (ρ1) at ICC = .75 (the average ICC of the reported ICC in the following studies: Bogaerts et al., 2018; Canton et al., 2004; Hildebrand et al., 2005; Rocque & Plummer-Beale, 2014; Schuringa et al., 2014; Van Horn et al., 2009). With two raters for each assessed patient, an alpha of .05 (one-tailed) and power (β) at .80, n = 45 patients are required for reliably calculating the ICC.
The necessary sample size for evaluating the predictive validity of the risk assessment tool was calculated based on assumptions about statistical power and effect size (Lu, 2021). The analysis aimed to detect an AUC of .75, which indicates moderate to strong discrimination between people who recidivate and people who do not recidivate. The null hypothesis assumed an AUC value of .50, reflecting no discriminative ability (i.e., the model performs no better than random chance). The prevalence of recidivism in the sample was set at 20%, meaning that people who recidivate constituted 20% of the total sample. This ratio corresponds to 11 persons who recidivated in a sample size of 54 cases. A type I error rate (α) of .05 was chosen, representing a 5% chance of rejecting the null hypothesis when it is true. Statistical power (1 − β) was set at 0.80, indicating an 80% chance of detecting an AUC value of .75 if it exists.
Using an receiver operator curve (ROC) curve sample size calculator (Lu, 2021; https://riskcalc.org/samplesize/), a minimum of 54 cases (11 reoffended and 43 did not) was determined necessary to achieve adequate power for detecting significant differences between predicted and observed outcomes. The selected sample size allows for robust conclusions about the predictive validity of the tool while minimizing the risk of type I and type II errors.
Analyses
Missing Data
For the interrater reliability analysis, raters could leave an item blank if there was insufficient information to score it, so that missing values were not imputed before the analysis. For the predictive validity data, missing values ranged from 0% to 1.1%, with the highest missing rate for D2 (Financial problems). Little’s missing completely at random (MCAR) test (Little, 1988) was used to assess whether the missing data were completely random, and despite the low percentages, the test yielded a significant result (p = .001). Given that Little’s MCAR test is sensitive to large sample sizes, which increases the likelihood of false positives (Hox, 2010), and since the missing data did not appear related to patient or rater-specific variables, the missing values were replaced using the expectation–maximization (EM) algorithm.
Interrater Reliability
The interrater reliability between the rater pairs (therapist–student and student–student) was determined with ICC (Koo & Li, 2016). It was a random selection of therapists and students; therefore, a two-way random model with absolute agreement was chosen. The single measures were reported because the FORE is developed for assessment by one assessor. The ICC was calculated at item level (6 static and 11 dynamic items) and for the SPJ of recidivism risk. For the interpretation of the results, the guidelines of Koo and Li (2016) were used: ICC < .50 is a poor interrater reliability; .50 ≤ ICC ≥ .74 moderate; .75 ≤ ICC ≥ .89 good; and an ICC ≥ .90 shows an excellent interrater reliability.
Predictive Validity
The predictive validity (discrimination ability) was analyzed using the ROC, which results in an AUC. The 17 FORE items, a total score, and the SPJ were included as predictors and recidivism (no/yes) as the external criterion. The AUC reflects the balance between the percentage of correctly predicted people who reoffended (sensitivity, true-positive rate [TPR]) and the percentage of people predicted to reoffend who did not (specificity, false-positive rate [FPR]). An AUC value ranges between 0 and 1, with 1 indicating perfect prediction and an AUC of .50 representing a chance prediction. The reference values are as follows: a small effect for .56 ≤ AUC > .64, a moderate effect for .64 ≤ AUC > .71, and a large effect for AUC ≥ .71 (Rice & Harris, 2005). In addition, the discriminatory power of the ROC prediction model was further refined using Harrell’s C-index (Harrell et al., 1982). Which accounts for variations in follow-up time and, like the AUC, produces a value between 0 and 1, with .50 indicating chance and 1 representing perfect prediction (Harrell et al., 1996). Due to its similarity to the AUC, the same reference values are applied (Helmus & Babchishin, 2017). A Bonferroni correction was applied to control for the increased risk of type I error when conducting multiple comparisons. With 17 FORE items, a total score, and the SPJ under consideration, the adjusted α-value for the ROC analyses was set at p = .003 (p = .05/19).
Calibration
The E/O index was used as a measure of calibration. The E/O index specifically measures calibration by comparing counts of expected and observed events (Hanson, 2017). Perfect calibration is indicated by an E/O index of 1. An E/O index > 1 indicates that the model is predicting more people who reoffended than are observed (overprediction), whereas an E/O index < 1 indicates that the model is predicting more people who reoffend than are actually observed (underprediction). The formula used to calculate the E/O index is:

Because FORE data had not been collected before this study, the current FORE data set was randomly split in two data sets with an equal split for each FORE risk group (very low risk n = 36/35; low risk n = 137/138, moderate risk n = 266/266, high risk n = 159/159; very high risk n = 36/36). The first data set provided the expected events (E) and the second data set the observed events (O).
Ethical Approval
The study was approved by the Ethical board of the Tilburg University (EC-2017.36) and falls within the Dutch Data Protection Act (Dutch DPA) and other specific Dutch health care laws, which provides legal provisions on how to deal with the privacy of personal information within the context of, among others, mental health services. The Dutch DPA also includes that all patients always have the right to withdraw their previous consent, for the use of their information for research, during and after treatment.
Funding
A grant (call 2017-64) was provided by the Quality Forensic Care (Kwaliteit Forensische Zorg, KFZ), a Dutch organization who provides grants toward research and implementation of improvements for the field of Dutch forensic care.
Results
Interrater Reliability
Table 1 presents the ICC values for the two rater pairs: therapist–student (Npatients = 80) and student–student (Npatients = 42). The interrater reliability between therapists and students ranged from good to excellent for eight of 17 FORE items (47.1%), including all six static risk factors (S1 to S6) and two dynamic factors: Problematic (ex-)partner relationship (D5) and substance abuse (D7). For the remaining dynamic risk factors, interrater agreement was moderate for six items (35.3%) and low for three items (17.7%), specifically limited leisure time (D4), unstable living situation (D6), and rule-breaking behavior (D11). In addition, the agreement on the SPJ of recidivism risk was poor.
Intra-Class Correlation Coefficients (ICC) for Students and Therapists (N = 80), and Students (N = 42) on FORE Items
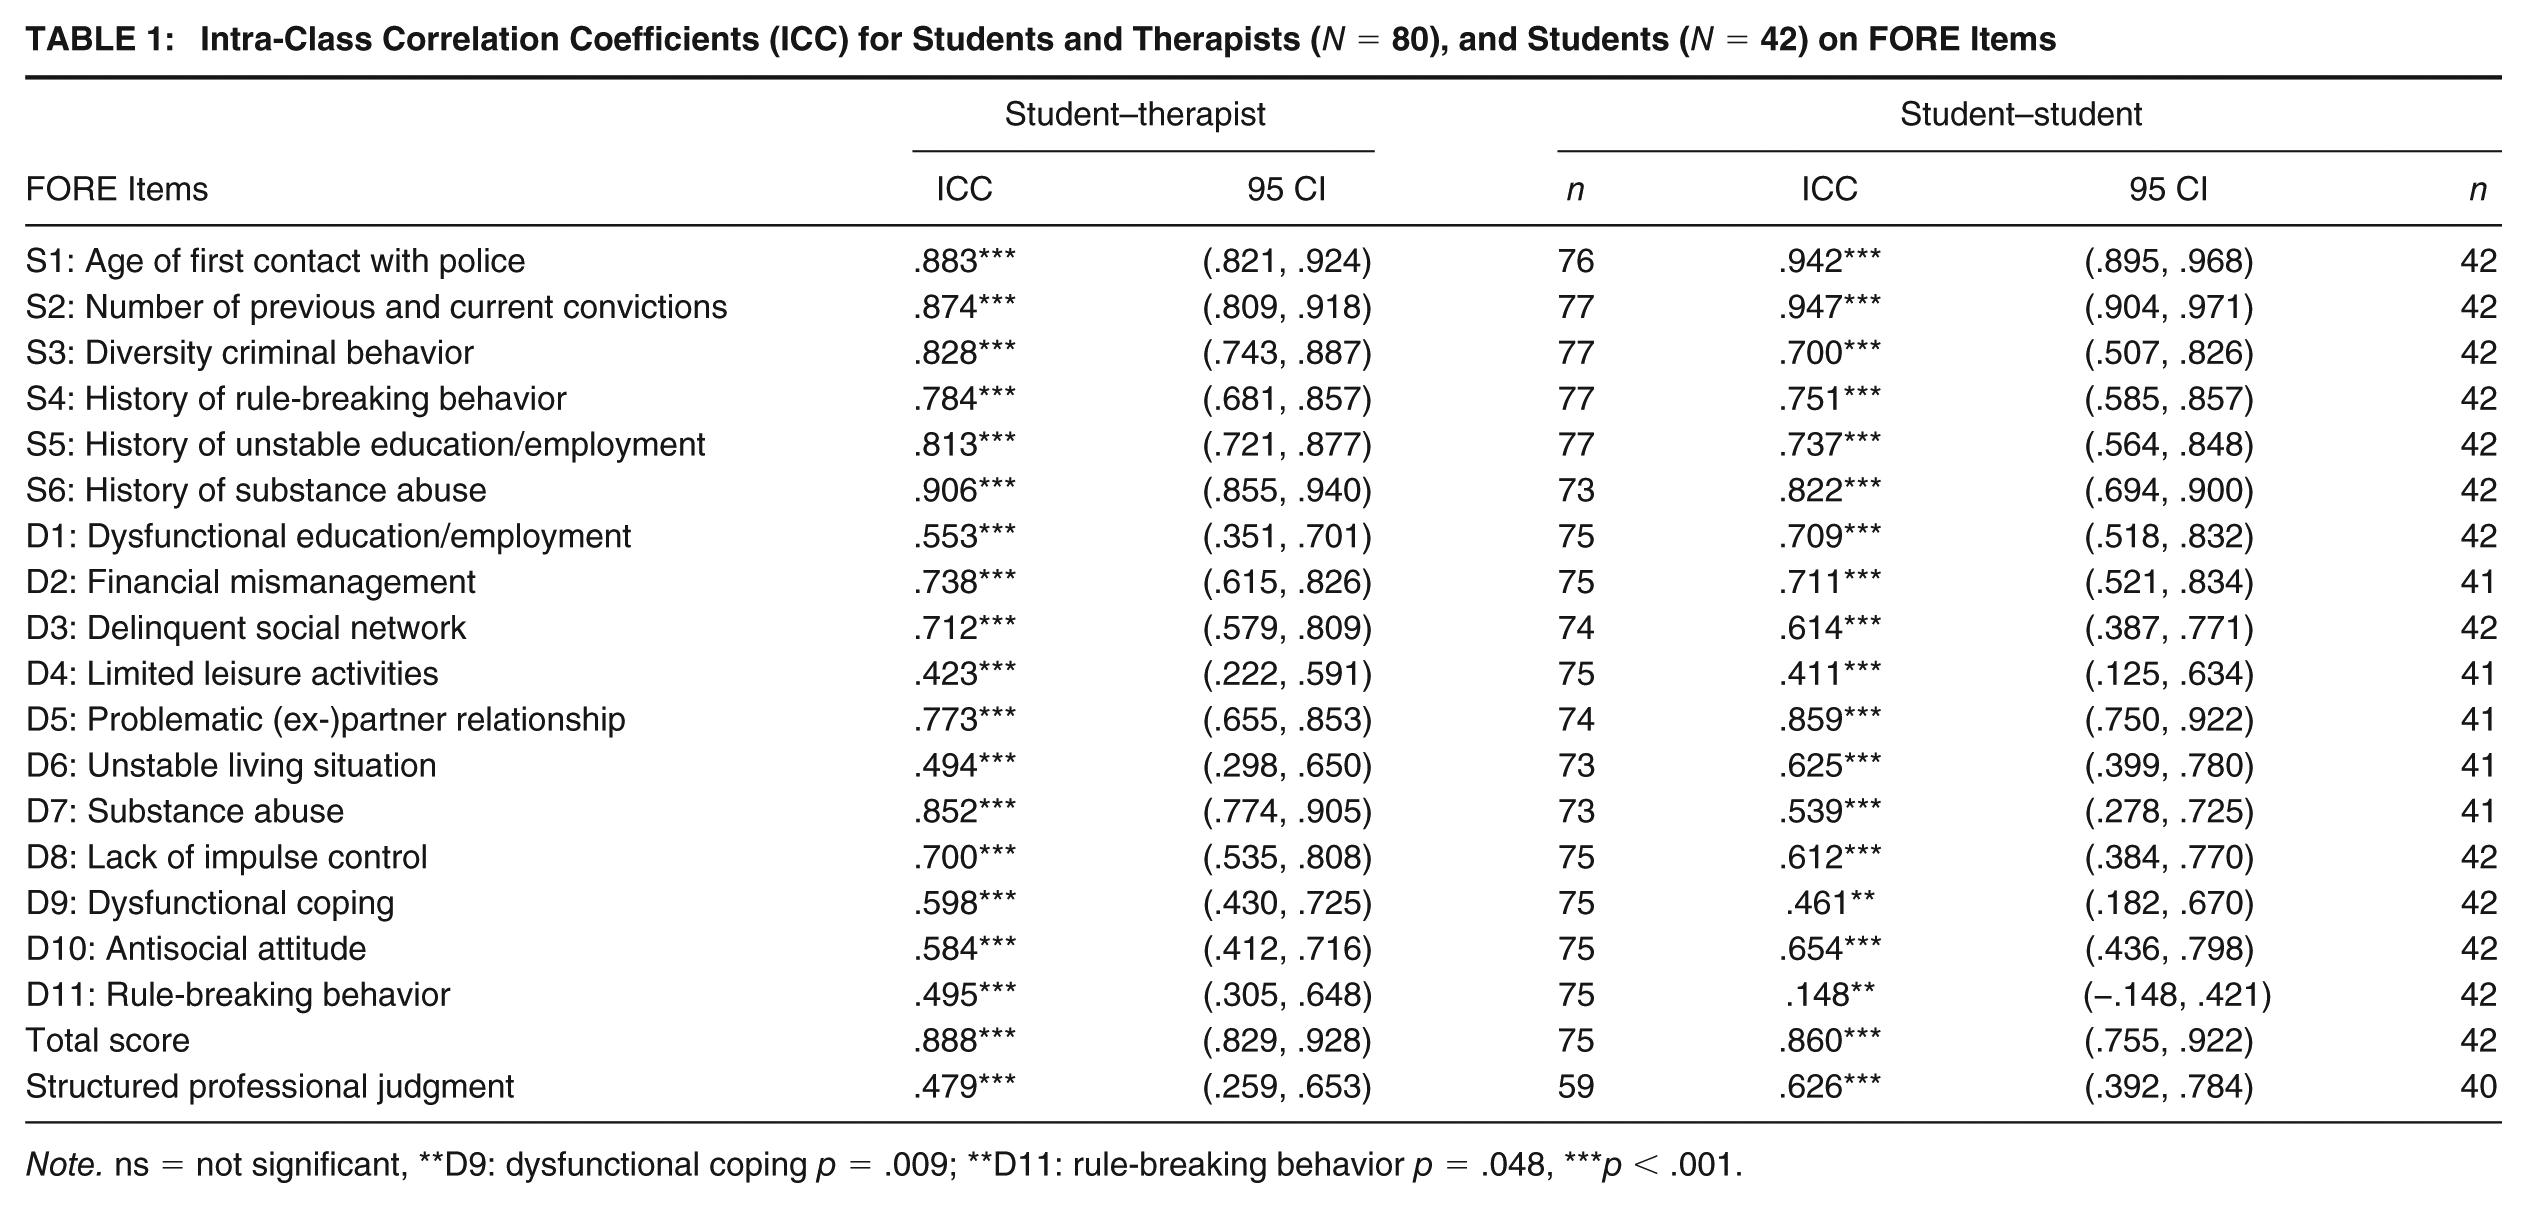
Note. ns = not significant, **D9: dysfunctional coping p = .009; **D11: rule-breaking behavior p = .048, ***p < .001.
The interrater reliability among students was good to excellent for five static risk factors (29.4%) and moderate for one static and eight dynamic risk factors (52.9%). However, they only reached a poor agreement on three dynamic risk factors: limited leisure time (D4), dysfunctional coping (D9), and rule-breaking behavior (D11). In contrast to the agreement between therapists and students, the students showed moderate agreement on the SPJ of recidivism risk.
Recidivism Rates
For the total sample (N = 1,268), the average follow-up time between the first FORE assessment and July 4, 2019 (end of the follow-up time) was 683 days (SD = 78.7; range = 552-849) and the percentage of people who recidivated was 17.1% (any type of recidivism).
Predictive Validity
The results of the ROC showed (see Table 2) a small-to-moderate predictive ability of the items (.58 ≥ AUC ≤ .68), except for items S2, number of previous and current convictions which predicted general recidivism good (AUC = .71, 95% confidence interval [CI] [.67., .74], p < .001) and D5, problematic (ex-)partner relationship had no predictive value (AUC = .50, 95% CI [.46, .55], p < .001). The total score of all FORE items had a good predictive value for general recidivism (AUC = .72, 95% CI [.68, .76], p < .001). The SPJ of recidivism risk yielded a moderate predictive validity (AUC = .68, 95% CI [.63, .73], p < .001), with a sensitivity and specificity for the moderate risk prediction of, respectively, TPR = .931 and FPR = .158. For the other four risk categories, the sensitivity and specificity were, respectively, low-risk category: TPR = 1.00 and FPR = .014; high-risk category: TPR = .556 and FPR = .511; and for the very-high-risk category: TPR = .139 and FPR = .892.
Area Under the Curve (AUC) and Harrell’s C (C-index) of FORE-Items, Total Score, and SPJ (N = 1,268)
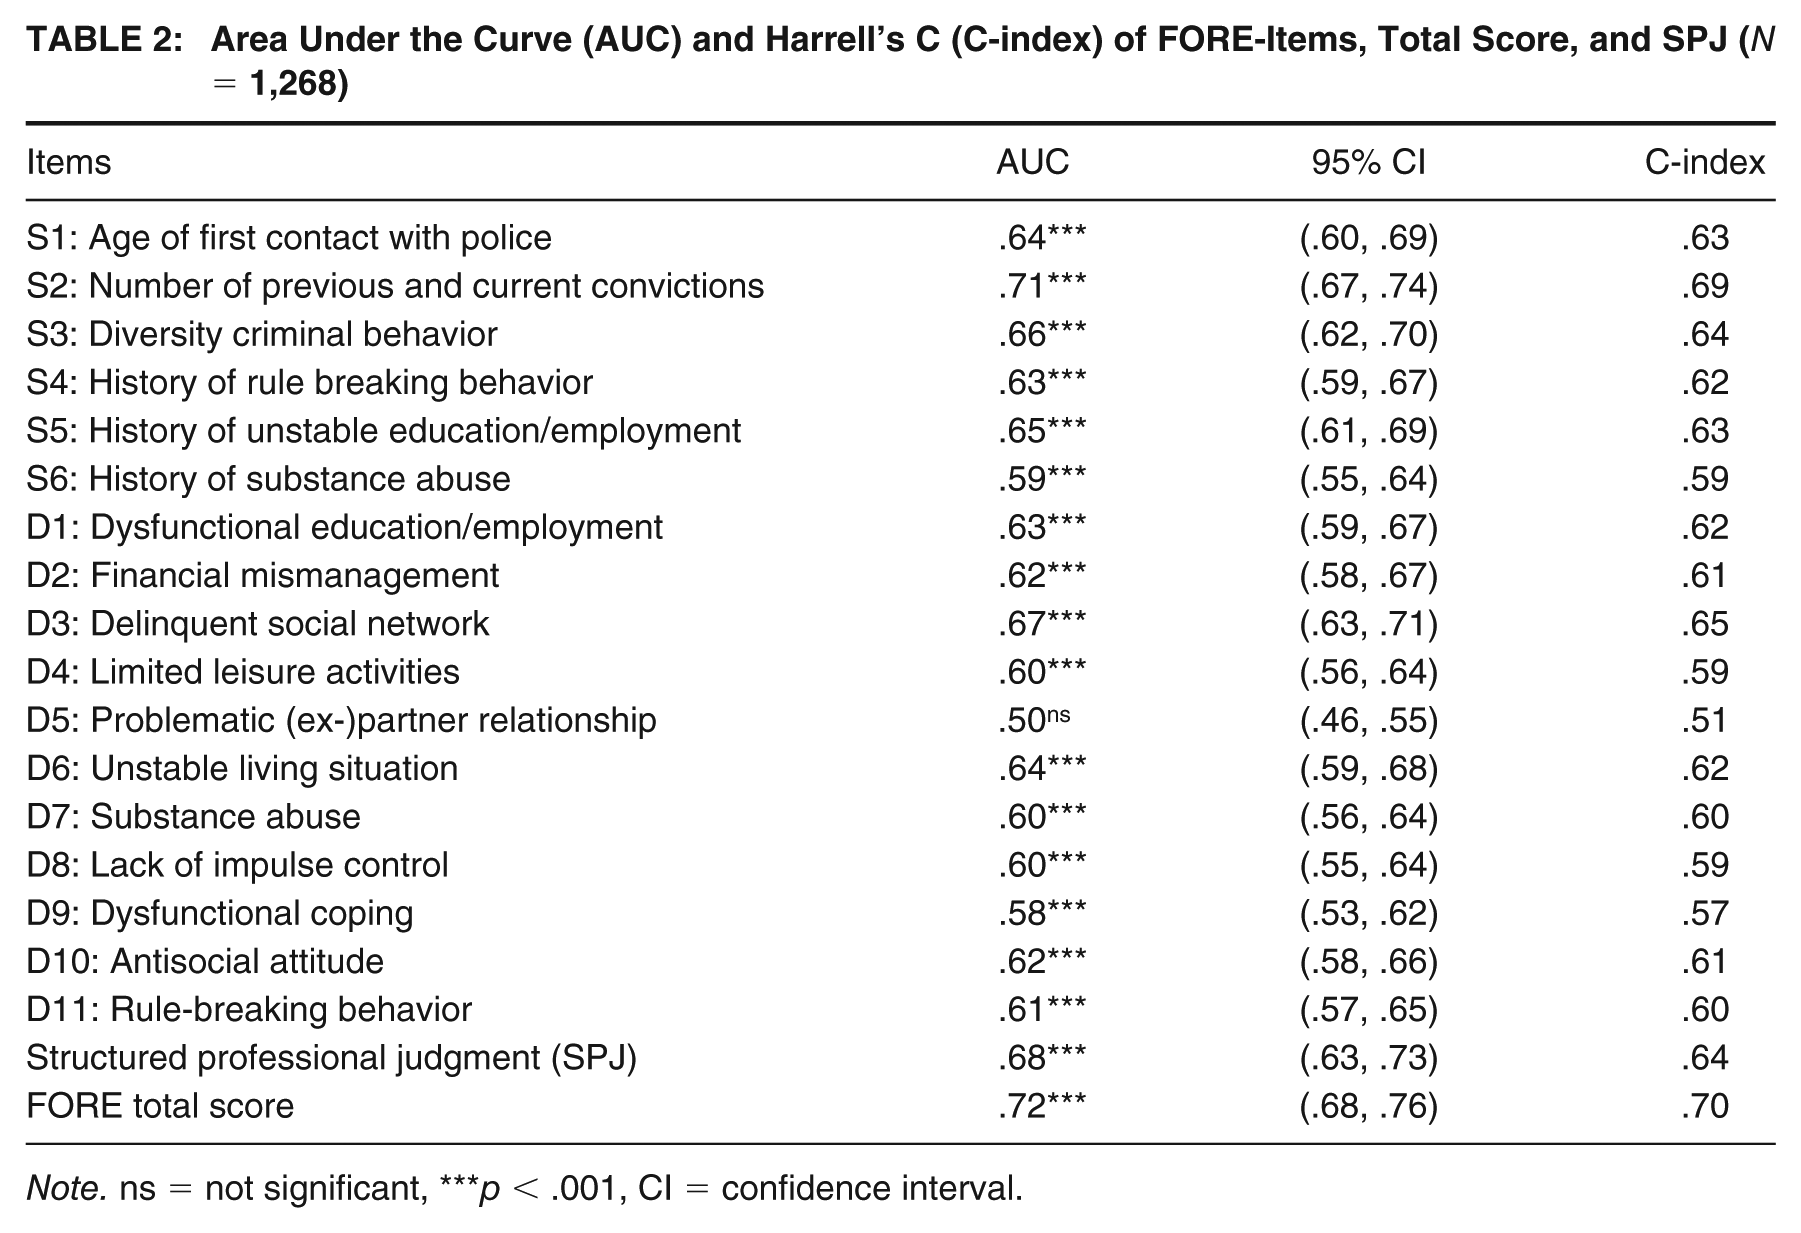
Note. ns = not significant, ***p < .001, CI = confidence interval.
Harrell’s C, in which the variation in follow-up time was taken into consideration, shows a minor correction in the predictive ability. In general, Harrell’s C differed between –.04 and .01 from the AUC values. All items had a small effect size except S3, diversity criminal behavior and D3, delinquent social network had a moderate effect size. The effect size of the actuarial risk classification and the SPJ both decreased but remained moderate predictors of general recidivism.
Calibration
Table 3 shows that the overall E/O ratio is 0.98, very close to perfect calibration (1.0). However, calibration varies by risk level: for example, in the very-high-risk category, the FORE underpredicted recidivism (E/O = 0.56), whereas in the moderate risk category, recidivism was overpredicted (E/O = 1.23).
Calibration of the Structured Professional Judgment of Recidivism Risk With the FORE, Based on a Test Sample (E, n = 634) and Calibration Sample (O, n = 634)
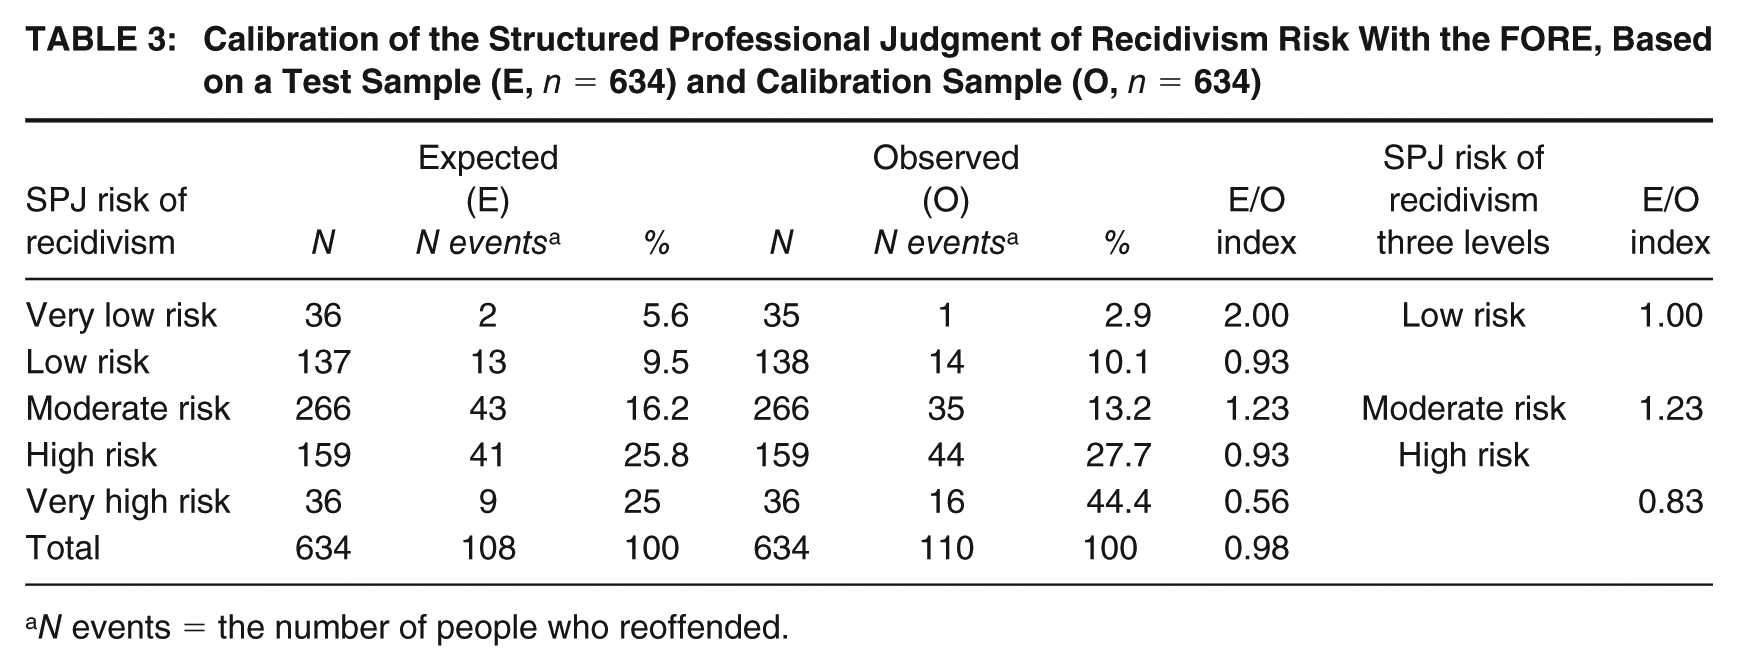
N events = the number of people who reoffended.
Discussion
This study provides the first comprehensive psychometric evaluation of the FORE, a tool developed specifically for Dutch forensic outpatient populations. We examined interrater reliability across therapist–student and student–student pairs (N = 80) and predictive validity in a large clinical sample (N = 1,268). The FORE showed good reliability for static risk factors, more variable reliability for dynamic ones, and overall good predictive performance (AUC = .72) with acceptable internal calibration (E/O = .98). Taken together, these results suggest that the FORE offers a solid foundation for structured risk assessment in forensic outpatient care, though several methodological and conceptual refinements are needed.
Interrater Reliability
Static factors demonstrated good to excellent reliability (ICC = .78-.90) across both rater types, confirming that clear, objective items, such as age at first police contact and number of convictions, can be scored consistently regardless of experience level. This pattern aligns with previous findings for tools like the Static-99 (Smid et al., 2014) and countable items on the LSI-R (Lammers & Philipse, 2003). It supports the use of the FORE’s actuarial baseline as a reliable core for clinical decision-making.
Dynamic factors, by contrast, showed substantial variability (ICC = .41-.86). Items with concrete behavioral indicators (e.g., problematic partner relationship and substance abuse) showed higher agreement, whereas those requiring synthesis of multiple psychological components (e.g., dysfunctional coping and limited leisure activities) produced lower reliability. This pattern is consistent across risk assessment instruments: items requiring integration of multifaceted constructs, such as the HCR-20’s “early maladjustment,” consistently show lower reliability than discrete, observable factors (Fazel et al., 2022). Such items demand subjective judgment and may invite bias when scoring guidelines lack clear behavioral anchors (De Vet et al., 2011). Refining the manual to include clearer definitions, examples, and scoring rubrics could substantially enhance reliability.
Contrary to expectations, student–student pairs did not consistently outperform therapist–student pairs. This likely reflects information asymmetry: therapists who conducted the interviews had access to nonverbal cues unavailable to students scoring recordings. Observational data, such as facial expressions or tone, can influence ratings of empathy or insight (Denault et al., 2023). Moreover, inexperienced raters may adhere rigidly to instructions yet struggle to integrate ambiguous information, leading to missing data or inconsistent scoring (Powis et al., 2019). These findings highlight the need for standardized training and consistent access to information across raters. Where possible, consensus scoring by two trained raters is advisable for high-stakes decisions.
The SPJ component revealed only moderate reliability (ICC = .48 for therapist–student and .63 for student–student). This suggests that the current FORE manual provides insufficient structure for combining static and dynamic scores into a final risk classification. Without explicit rules for weighting factors or resolving conflicts, SPJ judgments risk reverting to unstructured clinical impressions, the very biases structured tools seek to avoid. Targeted training and clearer decision guidelines are needed to strengthen this component.
Predictive Validity
The FORE’s overall predictive validity was good (AUC = .72), comparable with that of established instruments like the LSI-R, LS/CMI, and HCR-20 V3 (Douglas et al., 2003; Fazel et al., 2022). Static factors, particularly the number of convictions (AUC = .71), were the strongest predictors, consistent with decades of evidence identifying criminal history as the most robust recidivism indicator (Andrews & Bonta, 1997; Bonta & Andrews, 2024).
Dynamic factors added modest incremental value, with delinquent social network performing best (AUC = .68) and others, such as problematic (ex-)partner relationship, showing limited overall validity (AUC = .50). This pattern, static factors outperforming dynamic factors, is neither unexpected nor problematic. Dynamic factors capture changeable current states rather than stable historical risk exposure, and metaanalyses consistently show they contribute only modestly to prediction at single time points (Hanson & Morton-Bourgon, 2009). Their primary value lies in treatment planning and progress monitoring rather than baseline risk prediction. The limited validity of problematic (ex-)partner relationship likely reflects its offense-specific relevance: it is highly informative for intimate partner violence cases but less applicable to people who have committed different types of offenses. It may function as a key risk factor within intimate partner violence subgroups, which were not analyzed separately here. Future studies should conduct subgroup analyses to examine such context-specific effects.
The SPJ classification underperformed relative to the actuarial total score (AUC = .68 vs. .72). Low SPJ reliability likely attenuated its predictive accuracy. Furthermore, if the SPJ primarily incorporates dynamic factors to adjust the actuarial baseline, but dynamic factors show limited incremental prediction, the SPJ cannot improve upon actuarial scoring. Consequently, actuarial scoring currently offers a more robust and objective basis for risk classification, while dynamic factors should primarily guide individualized treatment targets and progress monitoring. In line with the findings of Wertz et al. (2022), the combination of SPJ and actuarial risk classification based on all FORE risk factors may yield the strongest prediction of recidivism.
Calibration
Internal calibration analysis yielded an E/O ratio of .98, indicating close correspondence between predicted and observed recidivism across risk levels. However, the FORE tended to overestimate risk in the very low and moderate categories and underestimate it in the high and very high categories. These deviations likely reflect small sample sizes in the extremes, ceiling effects, and possible treatment or supervision impacts. Importantly, our analysis used split-sample comparisons within one data set rather than external validation. This assesses internal consistency of risk classification but not true calibration. True external calibration requires comparing FORE classifications from a development sample to recidivism rates in independent validation samples, which remains to be conducted.
Our 17.1% recidivism rate is substantially lower than typical North American forensic samples (30%-40%). This may reflect the Dutch criminal justice context with comprehensive social services and less punitive sanctioning, broader recidivism definitions including minor offenses, sample composition favoring lower-base-rate offense types, or treatment effects. Cross-national validation is needed to establish whether FORE performance generalizes beyond the Dutch context.
Limitations and Future Directions
Several limitations constrain interpretation. First, unequal access to observational data between therapists and students confounds interrater reliability results. Standardized vignette studies, where all raters score identical case materials, are essential to isolate instrument-related variance. Second, predictive validity data came from a single treatment center, limiting generalizability. Multisite replication across diverse outpatient contexts is necessary. Third, cultural validity remains unknown: 23% of clients were born outside the Netherlands, but country of birth inadequately captures cultural background, which encompasses acculturation level, ethnic identity, language use, and generational status, variables we did not measure. Future work should examine differential item functioning and cross-cultural predictive bias using appropriate cultural measures. Fourth, dynamic factors were assessed only once at intake; repeated assessments could reveal whether score changes predict recidivism reduction. Finally, the SPJ’s poor performance underscores the need for experimental evaluation of structured override rules and enhanced rater training.
Clinical Implications
The FORE demonstrates sufficient psychometric quality for use in Dutch forensic outpatient care, with important qualifications. Actuarial risk classification should currently guide case prioritization and supervision decisions, while dynamic factors should be used primarily for treatment planning and monitoring. SPJ judgments should be treated as supplementary until reliability and structure improve. Clearer scoring guidance, ongoing rater training, and regular calibration checks will enhance consistency and accuracy. Moreover, consensus scoring is recommended for complex cases, and cultural consultation should be considered when assessing clients from diverse backgrounds.
In sum, the FORE represents a significant step toward standardized, evidence-based risk assessment in Dutch forensic outpatient practice. Its dual function, predicting risk through static factors and guiding treatment through dynamic ones, aligns with the RNR model. Continued refinement of dynamic items, SPJ procedures, and calibration across populations will further strengthen its clinical utility and fairness in diverse forensic contexts.
Supplemental Material
sj-docx-1-cjb-10.1177_00938548261455730 – Supplemental material for The Forensic Outpatient Risk Assessment and Evaluation (FORE): Examining Interrater Reliability and Predictive Validity in Dutch Forensic Outpatients
Supplemental material, sj-docx-1-cjb-10.1177_00938548261455730 for The Forensic Outpatient Risk Assessment and Evaluation (FORE): Examining Interrater Reliability and Predictive Validity in Dutch Forensic Outpatients by Mara J. Eisenberg, Joan E. van Horn, Claudia E. van der Put, Geert-Jan Stams and Jan Hendriks in Criminal Justice and Behavior
Footnotes
AUTHORS’ NOTE
A grant (call 2017-64) was provided by the Quality Forensic Care (Kwaliteit Forensische Zorg, KFZ), a Dutch organization who provides grants toward research and implementation of improvements for the field of Dutch forensic care. The authors declare that they have no known competing financial interests or personal relationships that could have appeared to influence the work reported in this paper. All authors approved the final version of the article for publication and agreed to be accountable for all aspects of the work and resolved any issues related to its accuracy or integrity.
Author Contributions
MJE made a significant contribution to the concept, design, acquisition, analysis and interpretation of data, drafted the article and revised it critically for important intellectual content. JEH made a significant contribution to the concept, design, acquisition, interpretation of data, drafted the article and revised it critically for important intellectual content. CEP made a significant contribution to the concept, and revised it critically for important intellectual content. GJJMS made a significant contribution to the concept, design and revised it critically for important intellectual content. JH made a significant contribution to the concept and revised it critically for important intellectual content.
References
Supplementary Material
Please find the following supplemental material available below.
For Open Access articles published under a Creative Commons License, all supplemental material carries the same license as the article it is associated with.
For non-Open Access articles published, all supplemental material carries a non-exclusive license, and permission requests for re-use of supplemental material or any part of supplemental material shall be sent directly to the copyright owner as specified in the copyright notice associated with the article.