
Abstract
Polymeric insulators have gained popularity since the last 30 years throughout the world. The main concern about them is variation in their performance with varying environments. Investigation of their performance by natural and artificial aging experiments is under the way by many researchers all over the world. The natural aging is usually short-term experiment ranging from few days to few years. The artificial aging is usually long-term investigation in lab that simulates the real service environment. However, first of all to develop the artificial aging schemes, natural aging to some extent is necessary. This article presents a part of research on polymeric insulators ongoing at the University of Engineering & Technology, Taxila, in which 2 different kinds of polymeric insulators were naturally aged in a period of 1 year. The materials used were the thermoplastic elastomeric and thermoset silicone rubber (SiR) insulators. They were aged in outdoor environment of Hattar, which is a heavily polluted industrial area of Pakistan. The actual 11 kV full-scale insulators were installed in open environment at a height of about 30 m. The samples were cut from the insulators and analyzed using visual observation, hydrophobicity classification, leakage current and Fourier transform infrared spectroscopy and scanning electron microscopy. The main aims of this aging were estimation of the useful life of these insulators under the environment studied and development of basis for multistress lab aging cycles. The results were also used to compare the performance of these two materials with each other.
Introduction
The silicone rubber (SiR) and thermoplastic elastomeric (TPE) are the two most commonly used materials nowadays for making polymeric composite insulators. These materials have very high surface resistance even under the intense environments ever encountered in the world. 1 Since these are organic materials like all other organic materials they age in any environment. This aging is not a problem if it follows some defined pattern or equation. The main problem is that this aging is not same in every environment. Due to this, the useful life of these insulators is not same in every environment. No straight forward procedure, method or equation exists, which can give the useful life for a given environment. The only option left behind is the real-time aging in a given environment and artificial aging in a laboratory.
The lab aging has the advantage over natural aging that the results can be achieved in short time by accelerating the process artificially. But in order to perform a realistic lab aging, at least a natural aging of some significant time is required. 2 –4
In this work, a natural aging of 1 year was performed in the open environment of Hattar which is a highly polluted industrial and commercial area of Pakistan.
The main aims of this aging were estimation of useful life of these insulators under the environment studied and development of basis for multistress lab aging cycles. The results are also correlated with each other to find out the relative performance of these two materials with respect to each other.
Methodology of study
The experiment was performed using a setup as shown in Figure 1. The stand shown in figure was installed in open environment at a height of 30 m above the ground. This height ensures no shade from any tree or building can block the sunlight and/or rain, which otherwise can hinder/alter the process of aging.
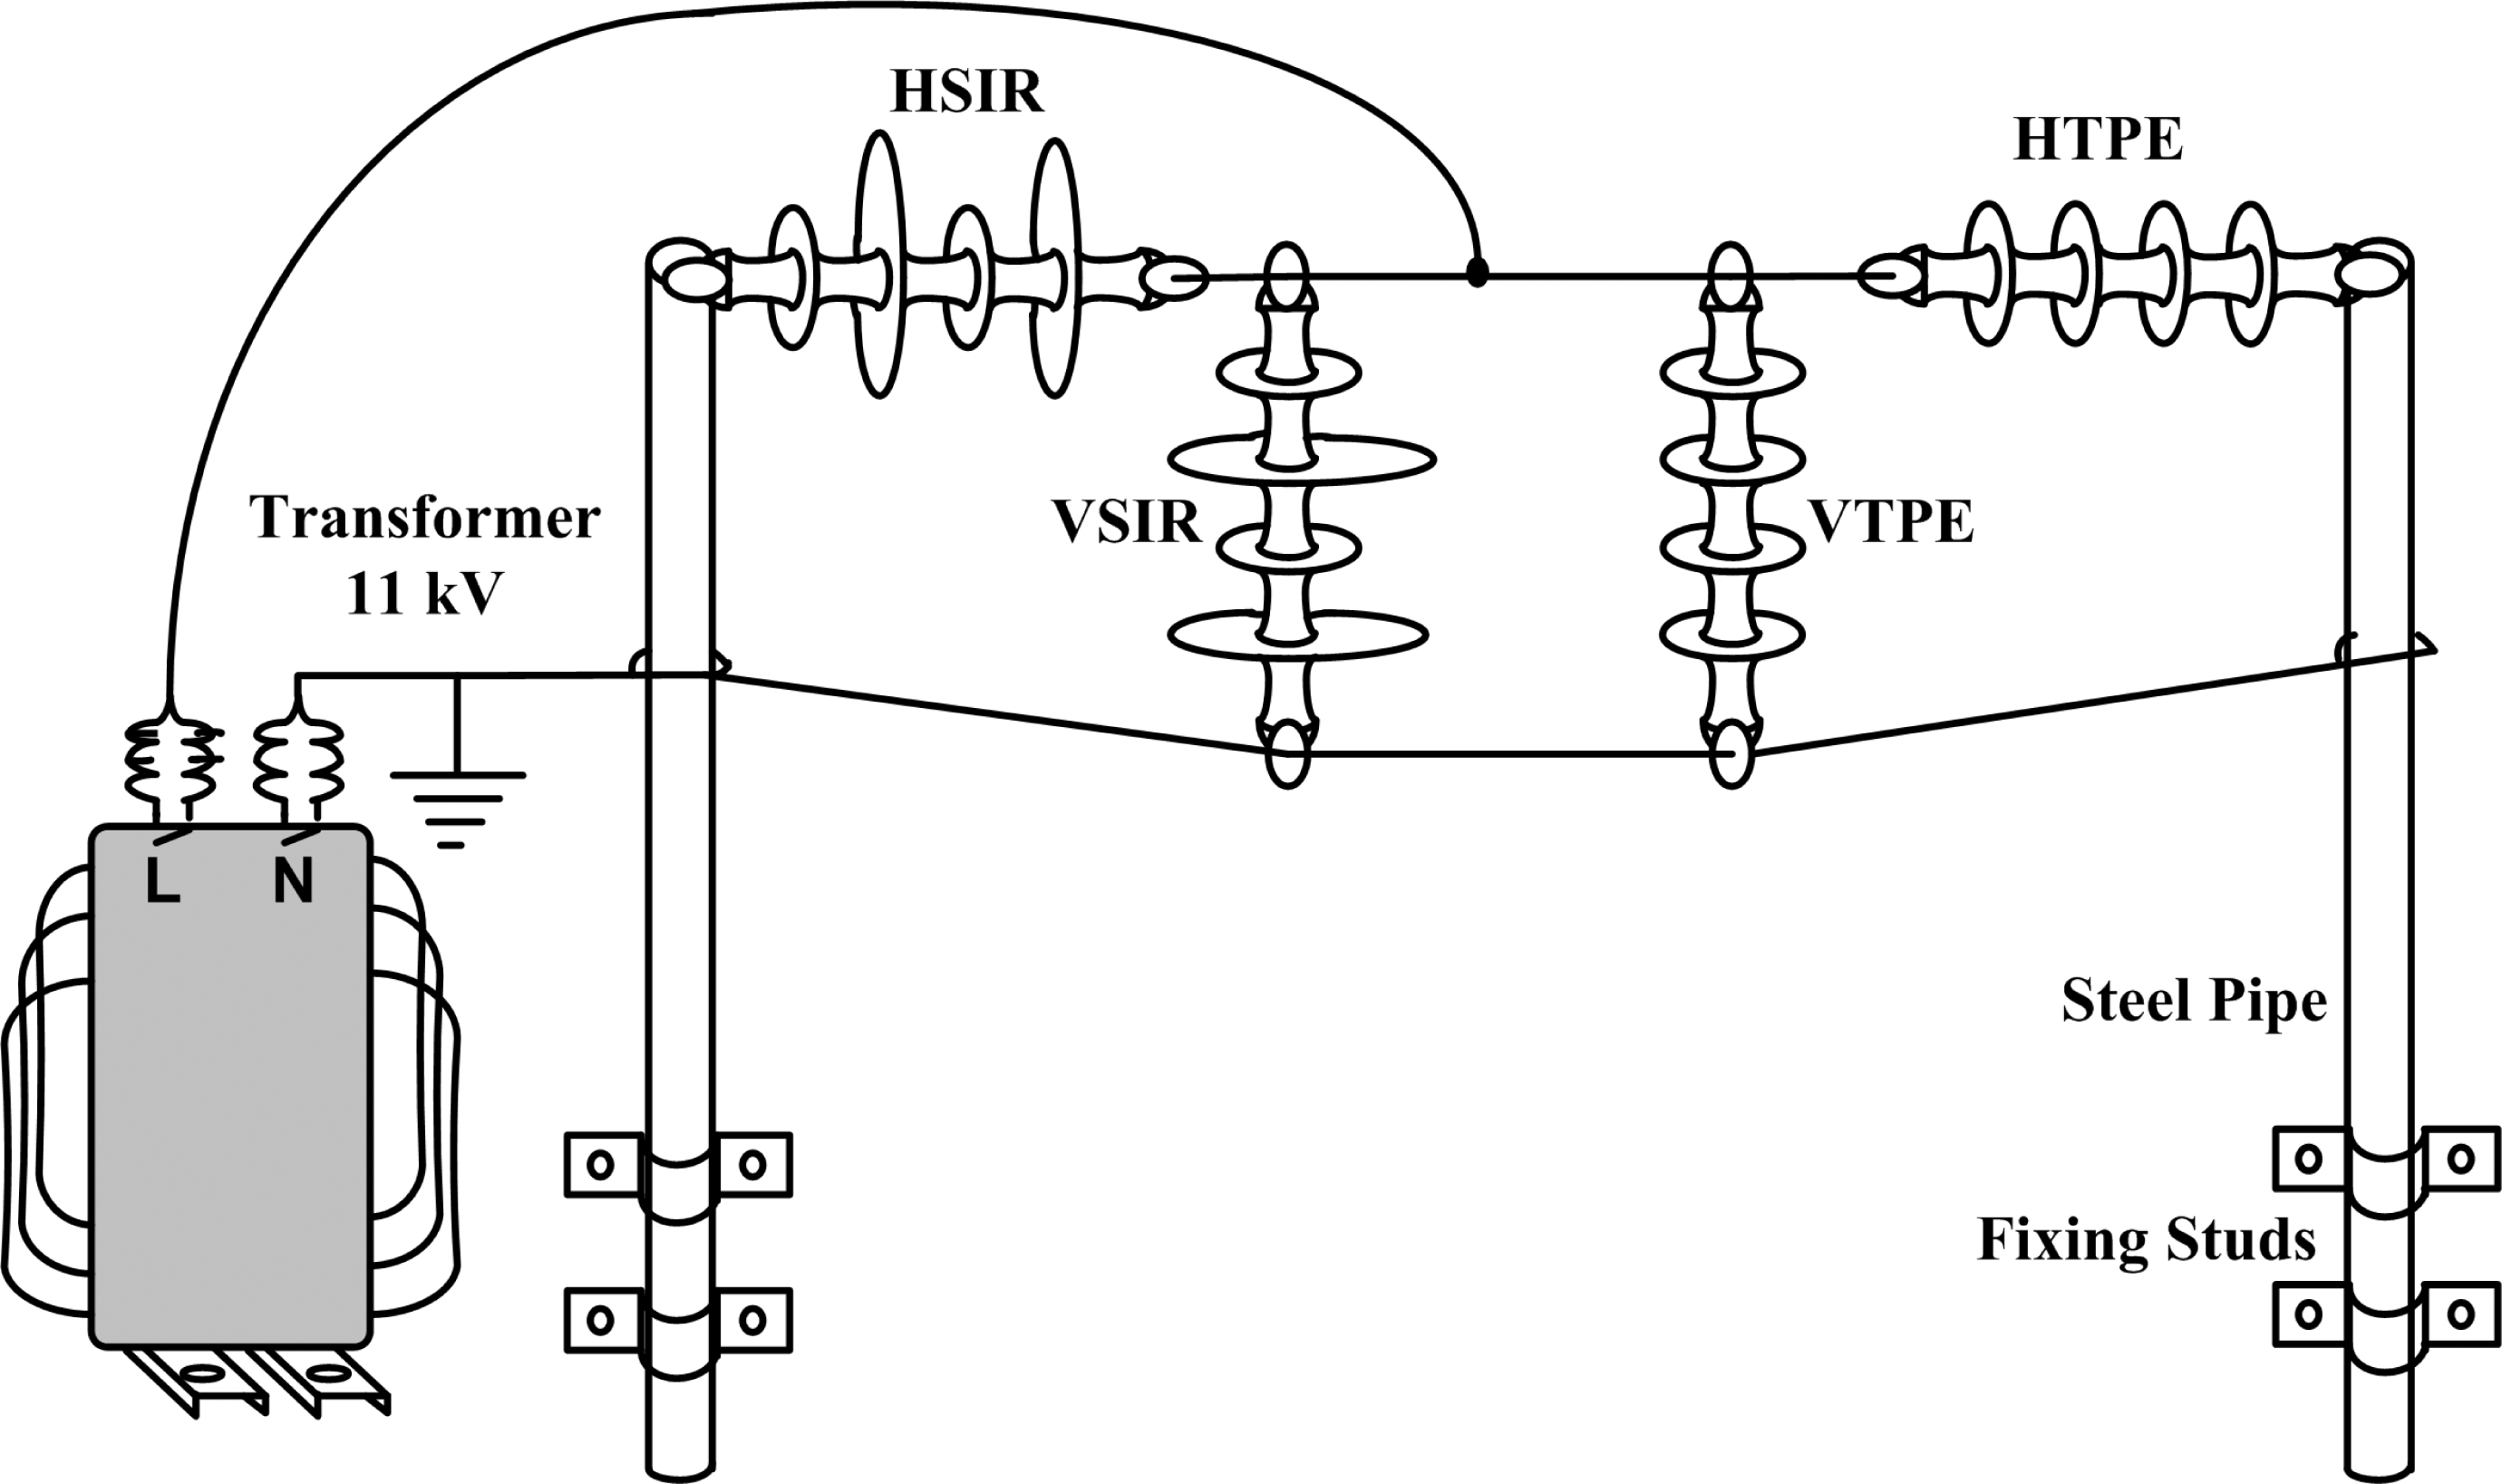
Schematic diagram of test setup used for aging of insulators.
Four full-scale insulators, two SiR and two TPE were installed in horizontal and vertical configurations. The insulators were energized using an 11 kV transformer. Samples were named as below:
HS: horizontal silicon rubber insulator.
VS: vertical silicon rubber insulator.
HT: horizontal thermoplastic elastomeric insulator.
VT: vertical thermoplastic elastomeric insulator.
Techniques of analyses
A brief overview of each of the techniques of analyses used in this study is given below.
Visual observation
Insulators were observed carefully at regular intervals. Any physical change/damage, end fittings corrosion, cracking, treeing, tracking, and so on were recorded at the intervals of 90 days.
Hydrophobicity classification
Hydrophobicity classification was done according to Swedish Transmission Research Institute (STRI) hydrophobicity classification guide. 5 Samples were sprayed with water for 30 sec from a distance of 1 ft and observed for matching hydrophobicity class at the intervals of 90 days.
To record and digitize the results of visual observation and hydrophobicity classification, a high-resolution digital camera was used.
Leakage current measurement
Leakage current was measured by direct method of measurement, details of which can be seen in Ref. 6. Leakage current was measured at intervals of 30 days for all four samples. Three readings were taken for each sample and averaged to get a mean value for that sample. The only mean value of results are shown and used in this article.
Fourier transform infrared spectroscopy
It is a material analysis technique that gives the absorption or transmission spectrum of samples at different wave numbers, ranging from 500 to 4000. Each wave number corresponds to a specific compound inside the material. 1
Absorption and transmission spectra are just reciprocal of each other, so any one of them can be used to estimate the state/degradation of a material. However, as the materials degrades the absorption spectrum values increase and transmission spectrum values decrease. So in order to interpret the degradation directly, the absorption spectrum is considered more useful. In this study absorption spectra were used for all Fourier transform infrared spectroscopy (FTIR) analyses.
To perform FTIR two cut samples were taken from each insulator, one from energized and other from dead end at an interval of 90 days.
Scanning electron microscopy
Scanning electron microscopy (SEM) gives a micro-magnified image of sample surface. Any change in physical and morphological properties of sample can be observed in SEM. 1
Results and discussions
Visual observation
Selected photographs of results of visual observation are shown in Figure 2.
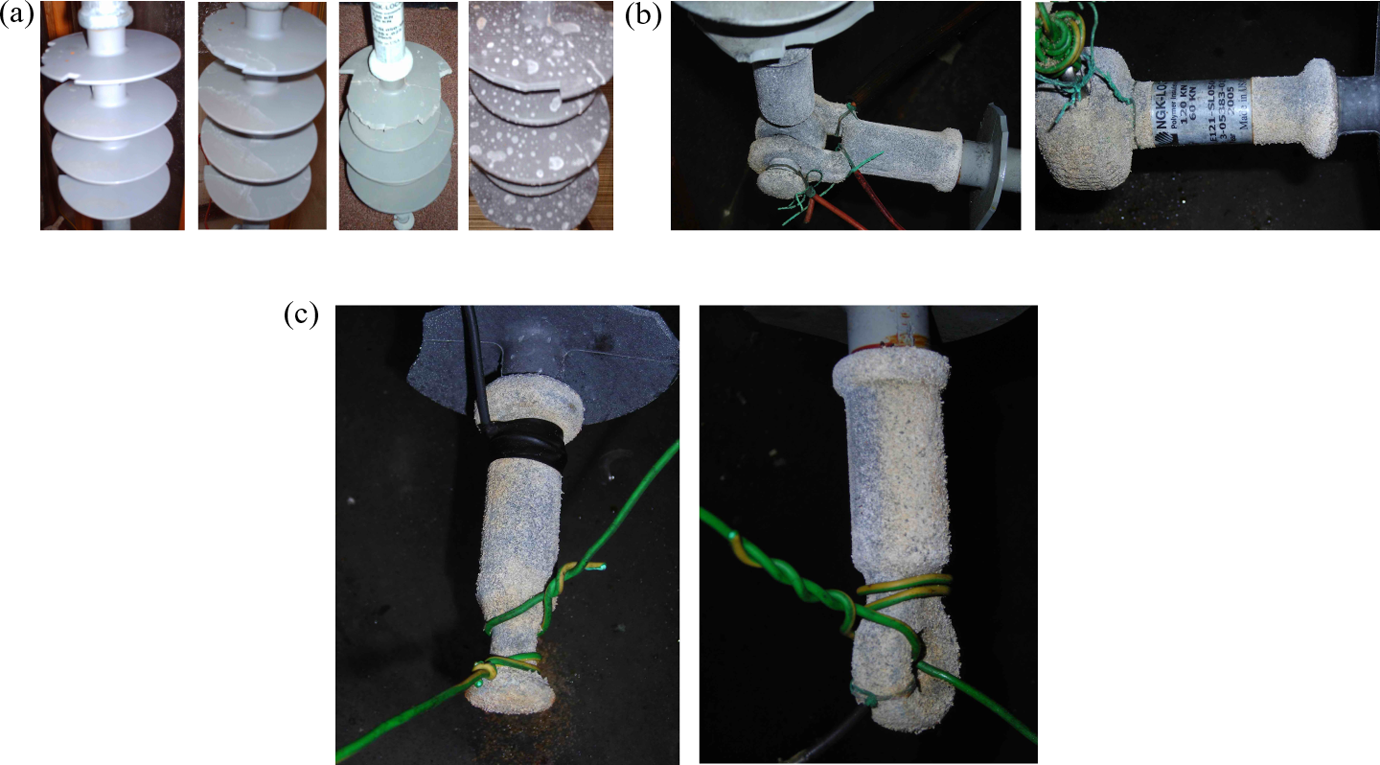
(a) Samples before installation and after removal from service, (b) corrosion of end fittings horizontal thermoplastic elastomeric insulator (HT) and vertical thermoplastic elastomeric insulator ([VT] left), horizontal silicon rubber insulator ([HS] right), (c) corrosion of end fittings vertical silicon rubber insulator ([VS] left) and VT (right).
Discoloration
Very slight discoloration sheds of HT sample was observed on one side as shown in Figure 2(a). The rest of the samples showed no signs of visible discoloration. However, all samples showed slight fading of original color, which is quite normal in polymeric insulators. 1 ,7,8
Tracking and cracking
No samples showed any signs of tracking, treeing or cracking.
Salt deposit
Of the all four samples, only VS showed severe salt deposit at the end of year. The other three samples remained fairly clean throughout the experiment.
Corrosion of end fittings
End fitting of all insulators shows severe surface roughness and corrosion but no rusting as shown in Figure 2(b and c). Energized ends of all samples show more corrosion as compared to dead ends which is very normal for all kinds of insulators. 2
Hydrophobicity
All the insulators maintained very good hydrophobicity near their energized ends, whereas they showed some loss of hydrophobicity near their dead ends as shown in Table 1. This behavior is very common for these kinds of insulators as stated by many authors earlier. 8–12 The reason for this is now well recognized that electric stress has important role in pulling out the low-molecular weight components from the bulk of polymeric insulators to their surface. These low-molecular weight components are responsible for maintaining the surface electrical resistance and hydrophobicity.
As the horizontal insulators are thoroughly washed by rain, they lose their hydrophobicity feature, but in this experiment all vertical insulators lost the hydrophobicity feature, and this behavior has been reported by many authors. 4 ,8,10,12 So it can be concluded that washing by rain has no permanent side effects on hydrophobicity and hence the surface resistance characteristics of polymeric insulators.
Hydrophobicity results according to STRI classification
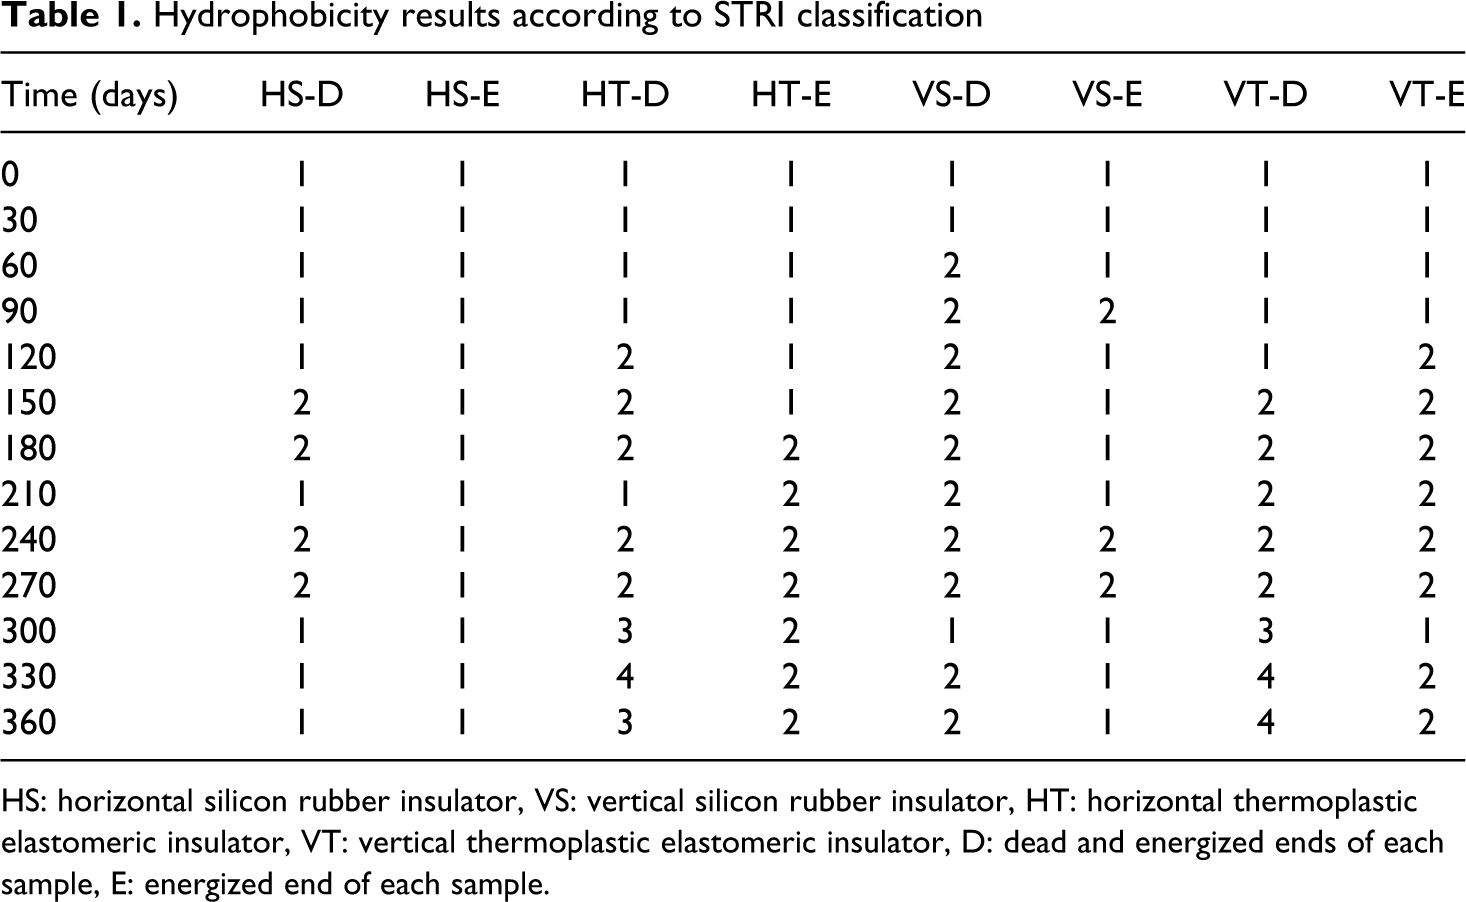
HS: horizontal silicon rubber insulator, VS: vertical silicon rubber insulator, HT: horizontal thermoplastic elastomeric insulator, VT: vertical thermoplastic elastomeric insulator, D: dead and energized ends of each sample, E: energized end of each sample.
Leakage current
A graph of leakage current values is shown in Figure 3. From the graph it is obvious that VT sample has highest values of leakage current, whereas VS sample has shown highest surface resistance. The leakage current suppression of SiR insulators is well known and proven. The leakage current values for TPE insulator are always high. However, in this complete experiment no insulator has crossed the safe limits of leakage currents as stated in Refs. 6 and 13.
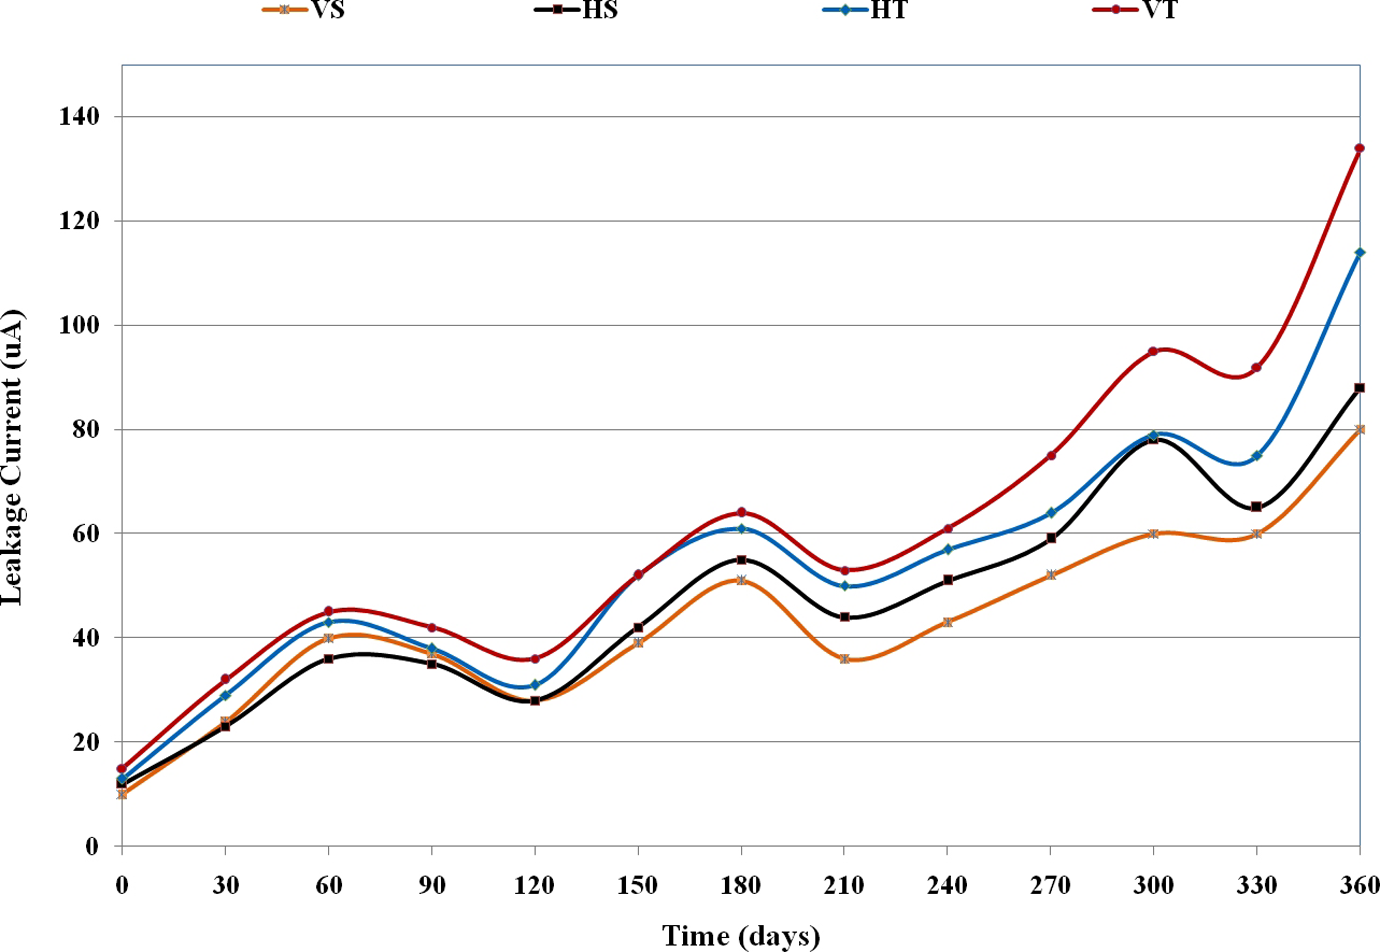
Leakage current values for all insulator samples.
The variation in leakage current values is very elastic for all samples. All samples show an increase in leakage current for about 2 months and then decreases for the next 2 months. Again the leakage current values increase followed by returning to lower values. This confirms that some internal degradation and recovery phenomena are occurring. This process is the transfer of low- and high-molecular weight components from the bulk of material to its surface and vice versa. This is very closely related to surface resistance. However, in every cycle of degradation recovery, the values do not return to the last lower limit. So the net result is increase in leakage current in a complex manner as reported by many authors. 2 ,3,7,8
Fourier transform infrared spectroscopy
The spectroscope was once calibrated at the start of experiment before taking the first spectrograph of virgin sample. Then for the rest of the experiment, its calibration was kept untouched so that relative errors of all spectrographs become negligible. A typical absorption spectrum obtained from FTIR is shown in Figure 4. This spectrum contains a lot of information, but to extract information there are different methods as stated by many authors. 1 ,2,7,8,10–12 The most commonly used method is to record the absorption values from the graph at functionally important wave numbers for all samples of all ages. The wave numbers corresponding to important functional groups of SiR and TPE materials are shown in Table 2. In this study, the values at all wave numbers were recorded from all graphs of all samples. The increase in absorption values with respect to wave numbers is shown in Table 2 and Figure 5(a–d).
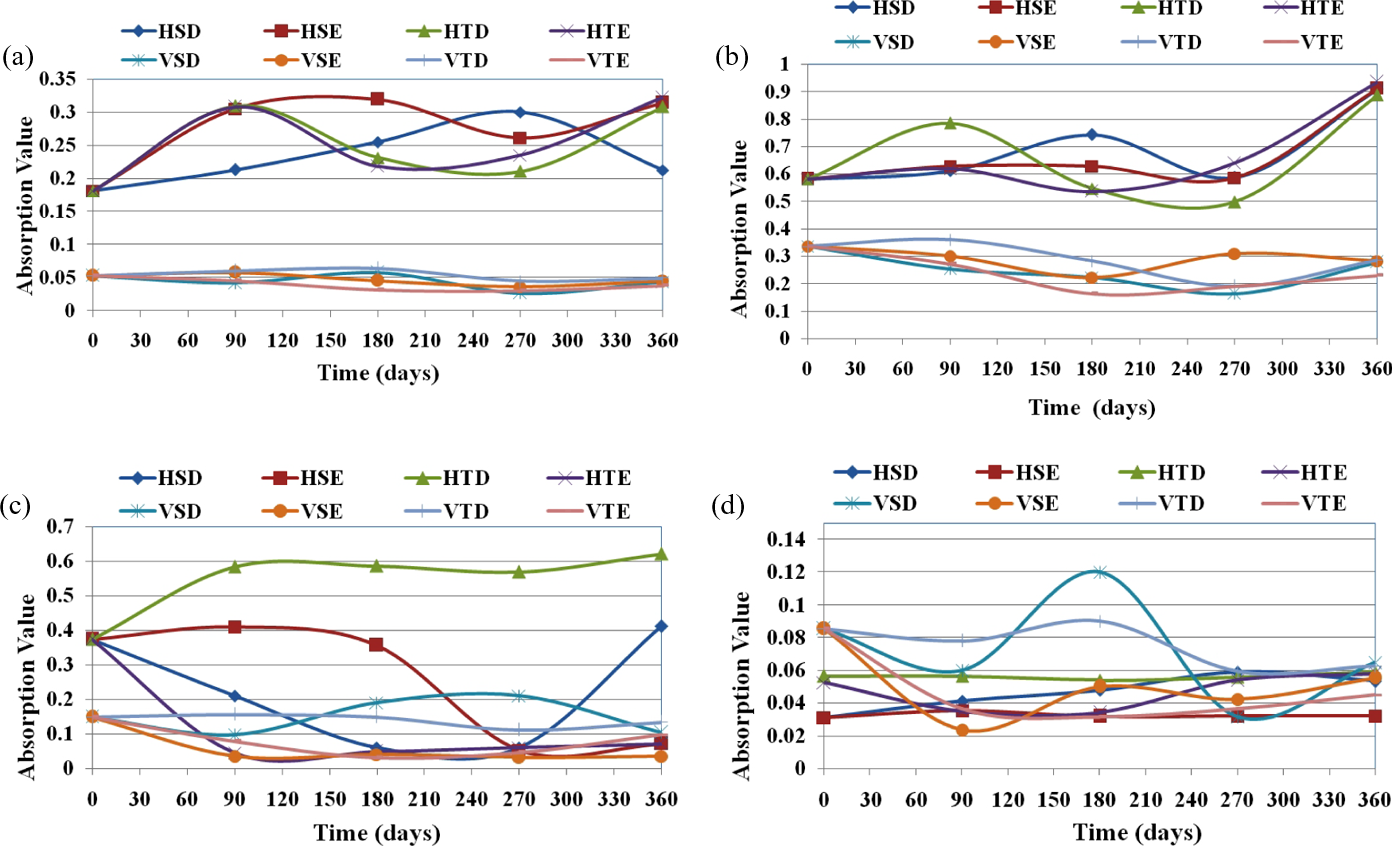
Variation in absorption with time at different wave numbers (a) 1008–1015, (b) 1240–1258, (c) 2917, and (d) 3525.
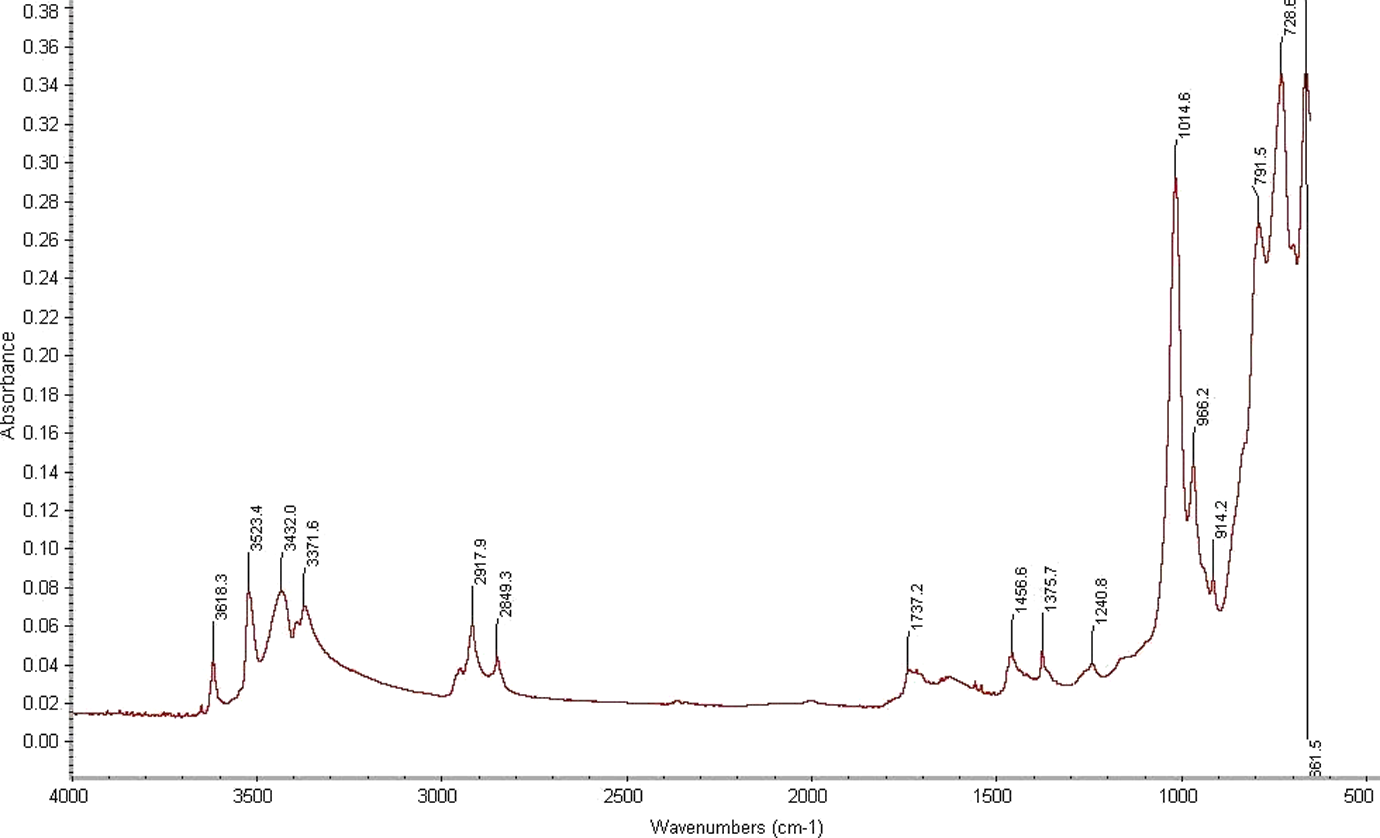
A typical Fourier transform infrared (FTIR) spectrograph.
Important functional groups of SiR and TPE insulators
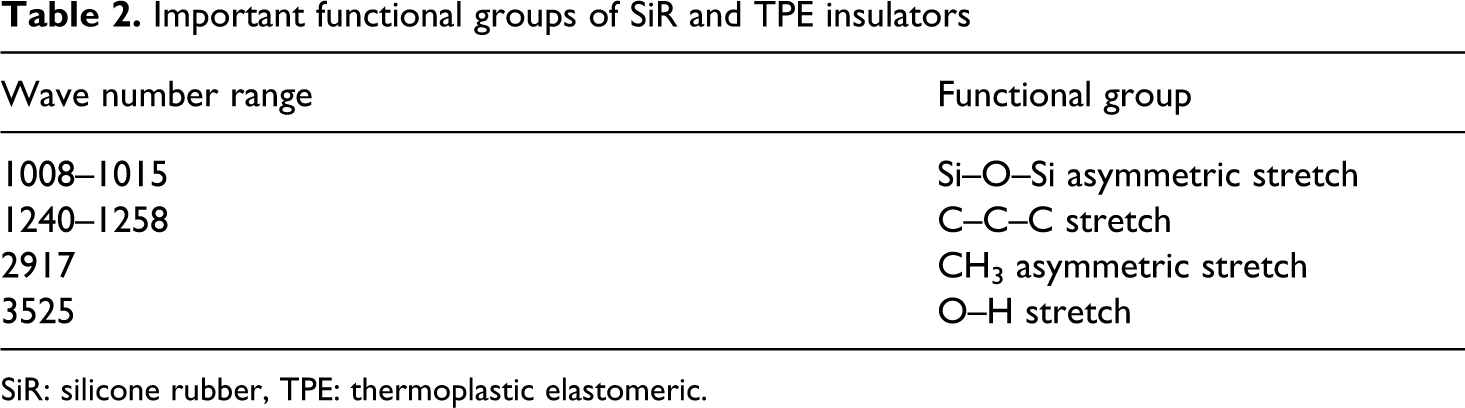
SiR: silicone rubber, TPE: thermoplastic elastomeric.
The FTIR spectroscope is a very sophisticated, costly and accurate analysis tool, so in order to arrive at the mean of a range of data, there is no need to take repeated spectrographs for a single sample. Also it was not needed because degradation analysis of any material is not directly based on the absolute value of absorption but on the percent change in absorption value as compared to the virgin sample of same material.
A total of 40 samples were analyzed by FTIR.
At wave numbers from 1008 to 1015 and 1240 to 1258, the SiR insulators have shown increase in absorption and hence high loss when compared to TPE insulators. The reason for loss of silanol and triple carbon bonds at these wave numbers in SiR materials is due to the presence of highly mobile low- and high-molecular weight chains. SiR materials lose the silanol groups from the surface due to this mobility but also preserve good hydrophobicity due to movement of low-molecular weight chains from inner bulk of material to the surface continuously. 9
In TPE materials, the ends of both long and short chain elastomers are bound to the hard thermoplastic segment so their movement from inner bulk of material to surface is not easy. Because of this the TPE insulators lose their hydrophobicity very early and do not recover it. So it can also be concluded that for TPE insulators the wave numbers 1008–1015 and 1240–1258 are not critical while estimating the life.
At wave number 2917, a mixed trend of increase in absorption values is seen both in SiR and TPE. However, at wave number 3525 which corresponds to OH stretch, the TPE insulators have shown increase in absorption values greater than SiR insulators. The obvious reason is that due to low water resistance of TPE insulators the OH stretch on the surface of material increases. This highlights the importance of this wave number for TPE insulators.
All samples have shown a cyclic increase and decrease in absorption values at all wave numbers to some extent. This again correlates with the result of all previous techniques of analyses where degradation/recovery phenomena were observed.
Chalking analysis
The surface chalking can be assessed taking the ratio of absorption values from FTIR spectra at wave number 1008–1015 cm−1 to that at 2917 cm−1. 7 , 8,14,15 This gives a value called chalking index. The chalking index for all samples was calculated and is shown in Figure 6.
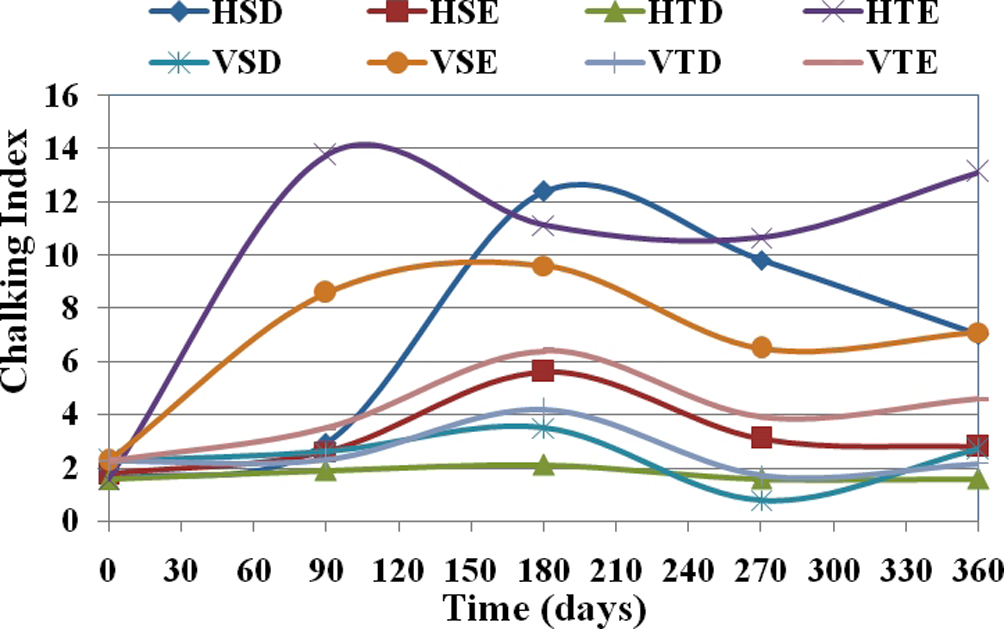
Chalking analysis of samples.
The chalking index of all samples have a starting value ranging from 1.5 to 2.5. This confirms that chalking indices of up to 3 or more are normal for polymeric insulators. 3 ,7,8,11,14,15 SiR insulators have high chalking index compared to the TPE insulators. Highest value was 14 for the vertical SiR insulator. However, no insulator shows any signs of visible chalking. So it can be safely concluded that even a chalking index of up to 15 does not affect the performance of polymeric insulators. Chalking index also shows increasing and decreasing values, again confirming the degradation/recovery phenomena.
Scanning electron microscopy
SEM images of virgin and 1 year aged samples from all insulators are shown in Figure 7. The sample VTPE has shown highest surface roughness and erosion. The VSIR samples have maintained excellent morphological properties. The results are in accordance with the results of all previous techniques where the VT sample shows the highest and the VS sample shows the lowest values of leakage current, hydrophobicity loss, and degradation.
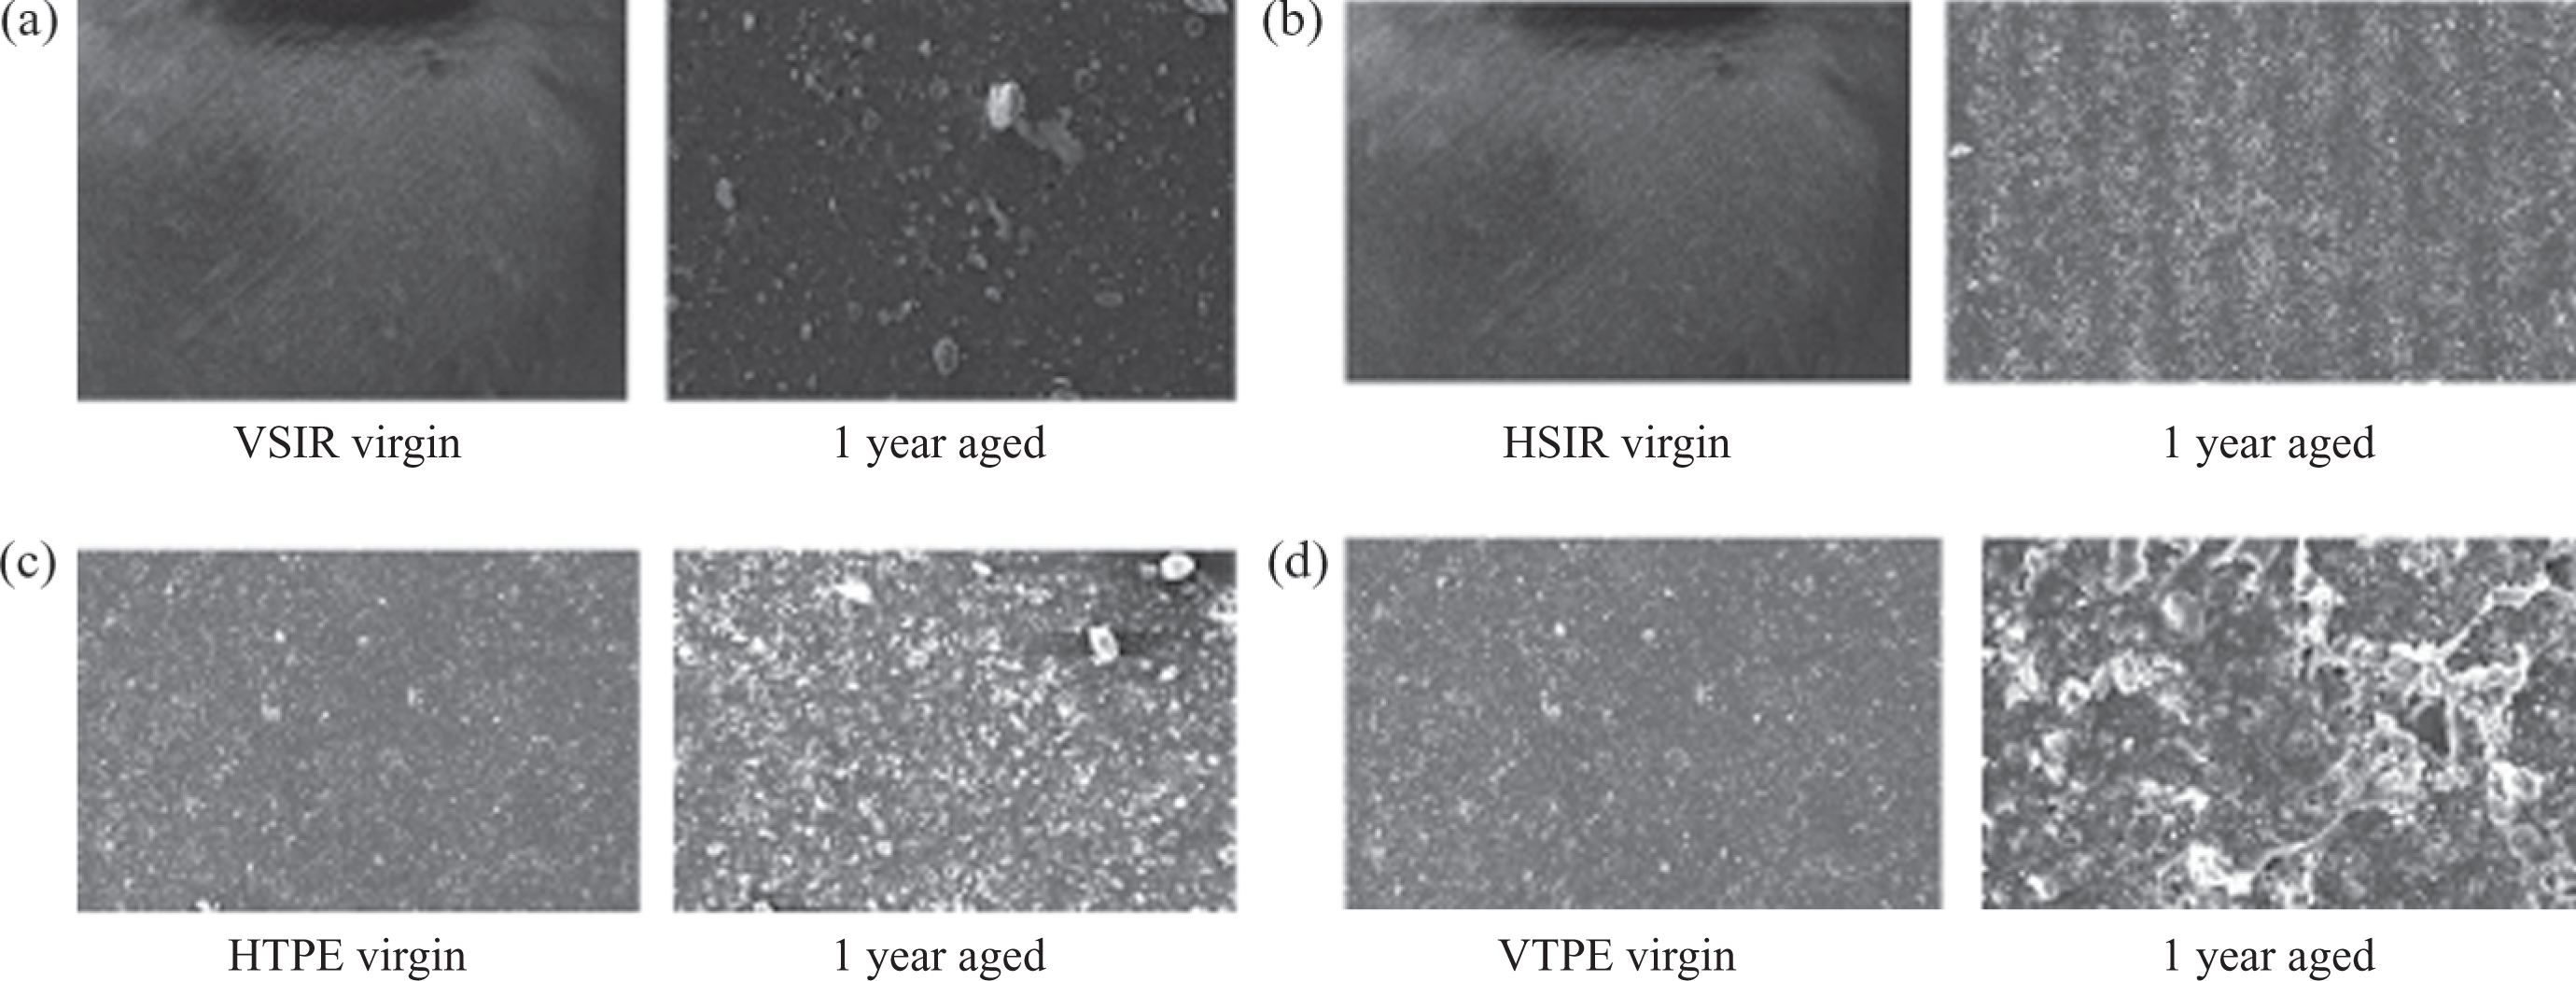
Scanning electron micrograph (SEM) of virgin and 1 year-aged samples.
Conclusion
The electrical insulation performance of SiR and TPE was investigated by energizing them in natural outdoor environment for 1 year. SiR insulators showed high salt and dust deposits compared to the very low salt deposit on TPE insulators. TPE insulators showed greater leakage current and loss of hydrophobicity compared to SiR insulators. The surface erosion was more in case of TPE insulators as shown by SEM. However, in spite of the high loss of hydrophobicity and high surface erosion, still the TPE insulators performed excellent during the whole year.
In general both types of insulators have performed excellent in the harsh environment that was used in this study. Also all horizontal insulator samples have shown more degradation than their vertical counterparts. From the results it can be concluded that SiR insulators are more suitable for low-pollution and high-humid environment as they preserve good hydrophobicity and surface resistance. Contrary to this, the TPE insulators are more suitable for high pollution and relatively dry environment as they do not trap dust and salt.16 A long-term study in natural or accelerated artificial setup is necessary to further investigate the useful life of both these materials in electrical insulation.
This research received no specific grant from any funding agency in the public, commercial, or not-for-profit sectors.