
Abstract
In this work, the morphology and crystallization behavior of polyamide 6 (PA6)/maleic anhydride-grafted-ethylene–propylene–diene rubber (MAH-g-EPDM)/high-density polyethylene (HDPE) blends with different ratios of the components were studied. In order to study the influence of both thermodynamics and kinetic factors, the interfacial tension between various polymer pairs was taken into account and two processing methods were used. Contact angle measurements and rheological relaxation time simulation were used to calculate the interfacial tension. It was found that because of the reaction between PA6 and MAH-g-EPDM, the value of interfacial tension of PA6/MAH-g-EPDM binary blends calculated by the contact angle measurement was not correct and the real value α = 0.97 mN m−1 was calculated by rheological relaxation time simulation. The two processing methods (one-step and two-step processing methods) led to different crystallization behaviors with different morphologies of the blends.
Introduction
Polymer blending has been widely used in industry as a versatile method to combine in a unique material, the properties of their components for specific applications, at a relatively low cost when compared with the development of a new polymer. 1 –9 It is well known that the properties of polymer blends are greatly influenced by the morphology that is developed during the mixing process. The research on the morphological structure and the relationship between structure and performance for binary polymer blends is very mature. But it is often difficult to achieve the effect desired by blending only two polymers. Therefore, in recent years, the study and development of blends formed by three or more components have attracted the attention of both the industrial and the academic world. 10 –24 Many studies have shown that the phase morphology of a blend of two polymers is influenced by the following factors: miscibility, interfacial tension, viscosity ratio, shear stress, and processing conditions. Likewise, the morphology of ternary blends is also influenced by thermodynamics and kinetic factors. 25,26
The properties of blends of crystallizable polymers greatly depend on their crystallization behavior. Therefore, studies concerning the crystallization behavior of polymer blends have attracted great interest from researchers in recent years. For polymorphic semicrystalline polymers, like polyamide 6 (PA6), the different crystalline structures formed during the cooling step and their stability strongly depend on the crystallization conditions, such as temperature and cooling rate, 27 shear rate, 28,29 humidity, 30 and pressure. 29 When a semicrystalline component (like PA6) was dispersed as a minor phase into a matrix of another component, multiple crystallization peaks at different degrees of supercooling were found for several immiscible blend systems, with the process referred to as “fractionated crystallization.” 31 Overviews of fractionated crystallization phenomena in a variety of immiscible polymer blends have been given by Frensch et al. 32 and Groeninckx et al. 33 They also gave an explanation that when the sample was subdivided into matrix/droplet phases, heterogeneous nucleation of the crystalline polymer in the droplets was restricted to the volume of the droplet and each droplet would crystallize according to the number and type of heterogeneities in it. When the droplet size was small enough, the number of droplets could exceed the number of heterogeneities that could normally promote crystallization as represented by the bulk crystallization temperature and homogeneous nucleation could occur in some droplets at lower temperature.
In the present study, the interfacial tension was calculated by different methods to study the influence of thermodynamics factors on the morphology formed during solidification in ternary blends. Two processing methods were used to discuss the influence of the kinetic factors on morphology formation. The crystallization behavior of the PA6 in the two types of PA6/maleic anhydride-grafted-ethylene–propylene–diene rubber (MAH-g-EPDM)/high-density polyethylene (HDPE) blends was studied. We have also studied the crystallization behavior of the HDPE component with the results described in our other work. 34
Experimental
Materials
PA6, with the trademark AKULON F136-C, was purchased from DSM (Heerlen, Netherlands). It had a melt index of 1.25 g/10 min and mass density of 1.168 g cm−3. EPDM grafted with MAH, with the trademark Bondyram® 7003, was purchased from Polyram (Israel), and it had a melt index of 6 g/10 min, mass density of 0.93 g cm−3 (ASTM D792), and MAH content of 0.7%. HDPE, with the trademark 6098, melt index of 0.8 g/10 min at 190°C and mass density of 0.95 g cm−3, was obtained from Qilu Petrochemical Company Ltd (Zibo, China).
Blending
PA6 was dried for 12 h at 80°C before blending so as to minimize the effects of moisture. All the blends were prepared using a CTE35 corotating twin-screw extruder from KEYA Company Ltd (China). Two processing methods were used to prepare the PA6/MAH-g-EPDM/HDPE blend. In the one-step processing method, the HDPE and MAH-g-EPDM were melt blended with PA6 directly at a temperature of 240°C. In the two-step processing method, the HDPE and MAH-g-EPDM were mixed first through the twin-screw extruder at 240°C and then the masterbatch was mixed with PA6 at a temperature of 240°C.
Contact angle measurements
Contact angles were measured in a sessile drop mold with a DSA100 (Krüss, Hamburg, Germany). PA6, MAH-g-EPDM, and HDPE samples were compression molded between clean silicon wafers at 240°C for 3 min and then cooled to 25°C under pressure for 1 min. Contact angles were measured with 3 μL drops of water and diiodomethane at 20°C being used.
Morphology observation
The morphology of all the blends was characterized by scanning electron microscopy (SEM). The samples were fractured cryogenically and then coated with gold. To obtain good contrast, all the ternary samples and some binary blends were etched with dimethylbenzene for 7 days to remove the MAH-g-EPDM phase before coating. Then, the fractured samples were observed in a SEM instrument (model INSPECT F, FEI, Hillsboro, Oregon, USA) at an acceleration voltage of 20 kV.
Characterization of crystallization behavior
The samples were studied by means of a TA Q20 differential scanning calorimeter (TA Instruments Co., New Castle, Delaware, USA). The temperature and heat flow scales were calibrated using the melting of high-purity indium and zinc samples before testing.
Nonisothermal crystallization
Samples of about 7 mg were heated to 240°C at a rate of 100°C min−1 under nitrogen atmosphere and maintained for 5 min to eliminate the thermal history. Then, the samples were cooled down to 40°C at a cooling rate of 10°C min−1 and reheated to 240°C at a heating rate of 10°C min−1. Both cooling and second heating curves were recorded for analysis.
Isothermal crystallization
The samples were heated to 240°C at a heating rate of 100°C min−1 under nitrogen atmosphere and maintained for 5 min to eliminate the thermal history; they were then cooled down at a cooling rate of 40°C min−1 to 200°C and maintained there for 30 min before cooling to room temperature.
Dynamic rheological test
Rheological characterization of the samples was carried out at 240°C on a rheometer (TA-AR2000ex, Rheometrics, Piscataway, New Jersey, USA) with a 25-mm parallel plate in a frequency range of 0.01–100 Hz. Strain sweep was carried out to determine the limit on the strain for linear viscoelastic response, and 3% strain was used. The testing sample disks with a thickness of 1.5 mm and diameter of 25 mm were prepared by compression molding at 240°C.
Results and discussion
Interfacial tension
To understand the formation of the different morphologies of the ternary blends, both thermodynamic and kinetic factors should be taken into account. For the thermodynamic factor, the interfacial tension should be considered first. Here, two different methods were used to calculate the interfacial tension between the different polymer pairs.
Calculation of the interfacial tension using the contact angle measurements for the binary blends
Figure 1 shows photographs of the contact angle measurements for different samples. Through the curve fitting to the edge of the droplet, the contact angles of different materials with water and diiodomethane were obtained asshown in Figure 2. The surface tension, dispersion, and polar components of the materials calculated using equations (1) and (2) 35 are listed in Table 1.
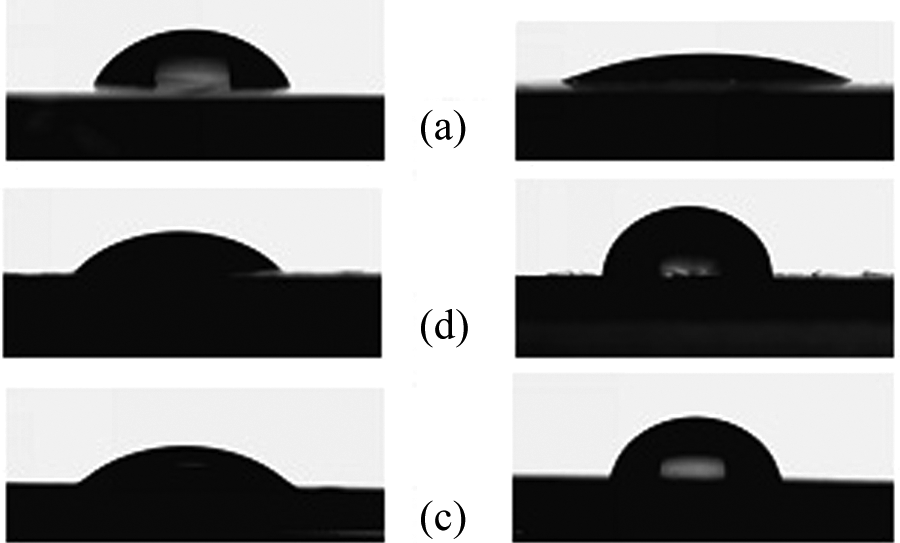
Photographs of the contact angle measurements for different samples. (a) PA6, (b) MAH-g-EPDM, and (c) HDPE (left: diiodomethane; right: water). PA6: polyamide 6; MAH: maleic anhydride; EPDM: ethylene–propylene–diene rubber; HDPE: high-density polyethylene.
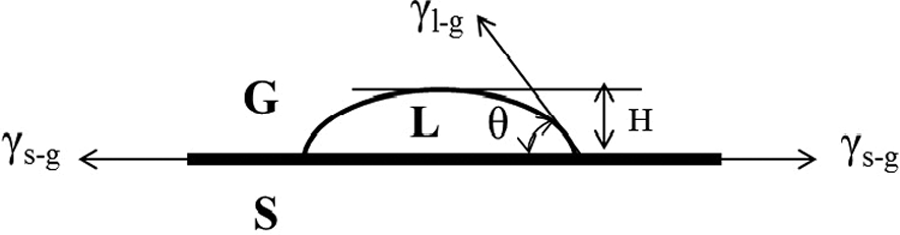
The schematic illustration of contact angle measurements.
Summary of contact angle and surface tension of different samples.
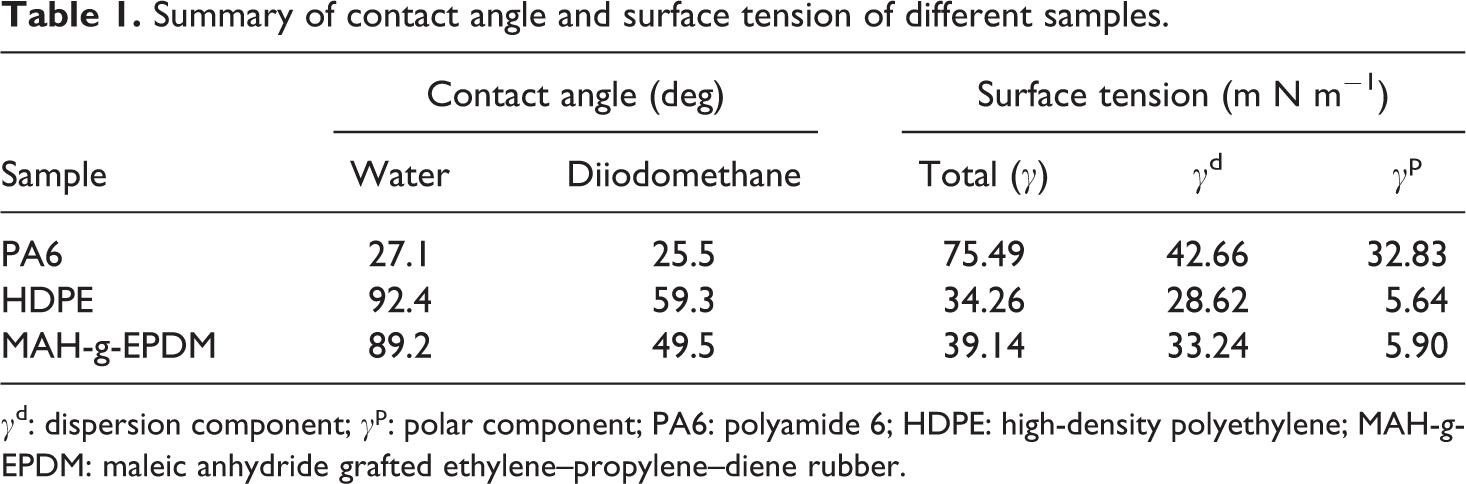
γd: dispersion component; γ p: polar component; PA6: polyamide 6; HDPE: high-density polyethylene; MAH-g-EPDM: maleic anhydride grafted ethylene–propylene–diene rubber.
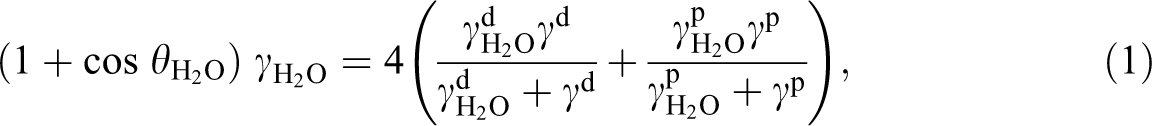
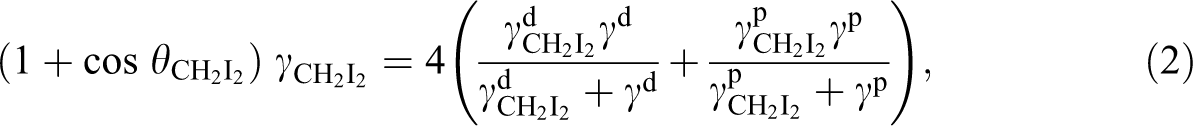
where γ is the surface tension, γ d is the dispersion component, γ p is the polar component, and θ is the contact angle with water or diiodomethane.
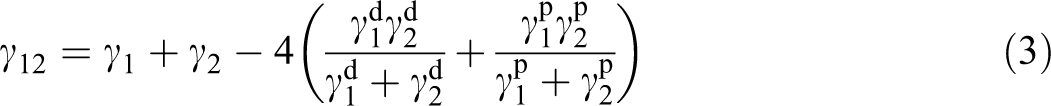
The interfacial tension of each binary blend can be calculated by the equation given by Wu (shown in equation (3)). 35 Here γ 12 is the interfacial tension between materials 1 and 2, and γ 1 and γ 2 are the surface tensions of the two contacting components in the blends. The calculated results are listed in Table 2.
Interfacial tension of each binary blend (calculated by the equation given by Wu).
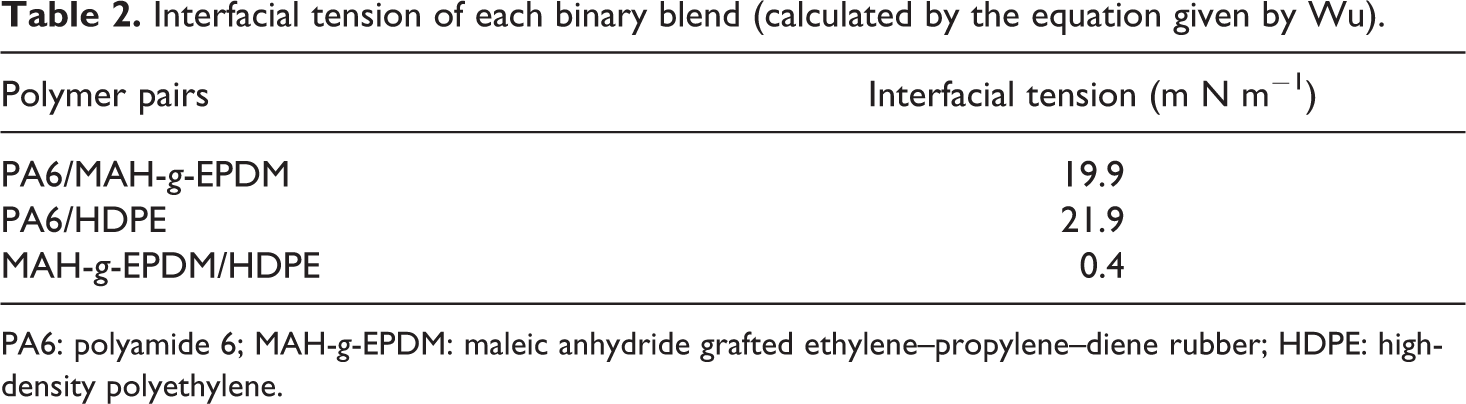
PA6: polyamide 6; MAH-g-EPDM: maleic anhydride grafted ethylene–propylene–diene rubber; HDPE: high-density polyethylene.
For a polymer binary blend, with the decreasing of the interfacial tension, the dispersed phase particle size will be reduced, the dispersed phase particle size distribution will become narrow, and the phase interface compatibility will be improved. As shown in Table 2, for the MAH-g-EPDM/HDPE blend, the calculated value of the interfacial tension was very low, that is, only 0.4 mN m−1, as a result of the presence of the ethylene chain segments in MAH-g-EPDM, which lead to the good compatibility with the HDPE and low interfacial tension. However, poor compatibility and high interfacial tension should exist between PA6/HDPE in their binary blend due to their different polymer chain structures. Moreover, as shown in Table 2, the interfacial tension value of the PA6/MAH-g-EPDM blend was also very high, which means poor compatibility. However, according to the SEM photographs (shown in Figure 3) of PA6/HDPE 85/15 and PA6/MAH-g-EPDM 85/15 blends, a different morphology was greatly seen. For the PA6/HDPE binary blend, a clear interface between matrix and dispersed phase was very evident, the dispersed phase particle sizes were very large and the particle size distribution was wide, which indicated the poor phase compatibility and was consistent with data of the interfacial tension. But, from Figure 3(b), for PA6/MAH-g-EPDM binary blend, there existed no obvious interface, even no dispersed phase could be seen, and the phase compatibility was good. That’s because of the reaction (shown in Figure 4) between the carboxyl group in MAH of MAH-g-EPDM and the amino end group in PA6, 26 which can reduce the interfacial tension and prevent the aggregation of the dispersed phase. 36 Thus, the interfacial tension, α = 19.9 mN m−1, for PA6/MAH-g-EPDM binary blend obtained from the contact angle measurements was not correct.
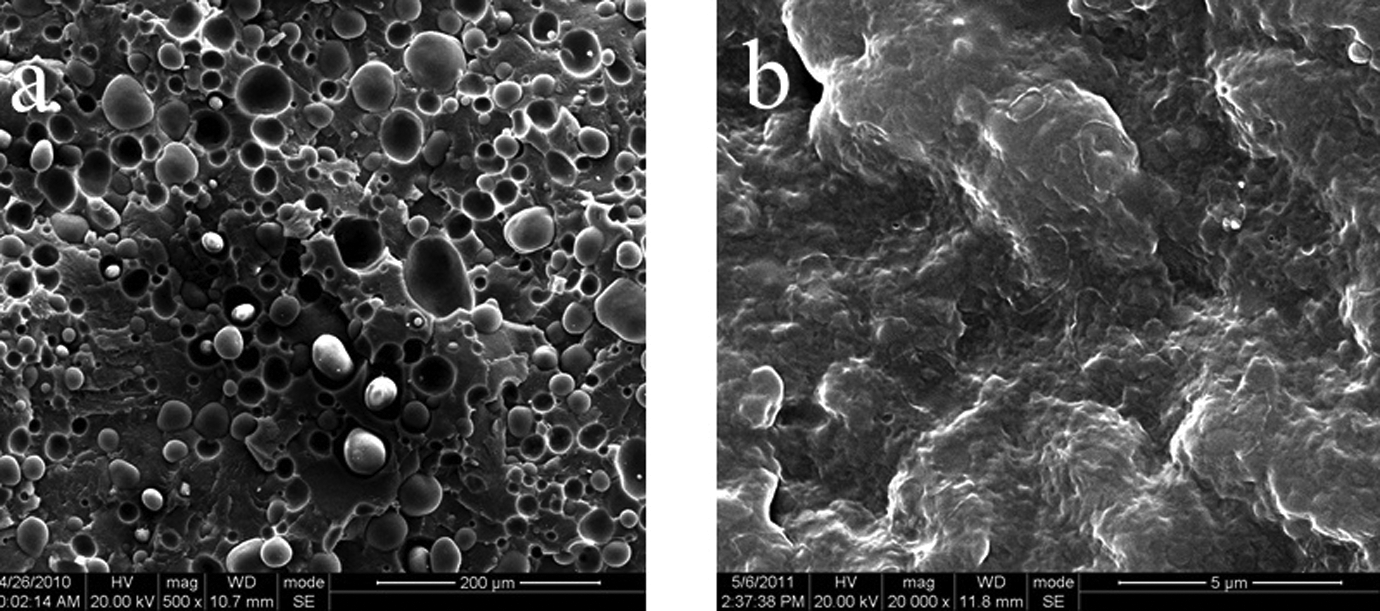
SEM photographs of the polymer binary blends (a) PA6/HDPE 85/15 and (b) PA6/MAH-g-EPDM 85/15. SEM: scanning electron microscopy; PA6: polyamide 6; HDPE: high-density polyethylene; MAH: maleic anhydride; EPDM: ethylene–propylene–diene rubber.
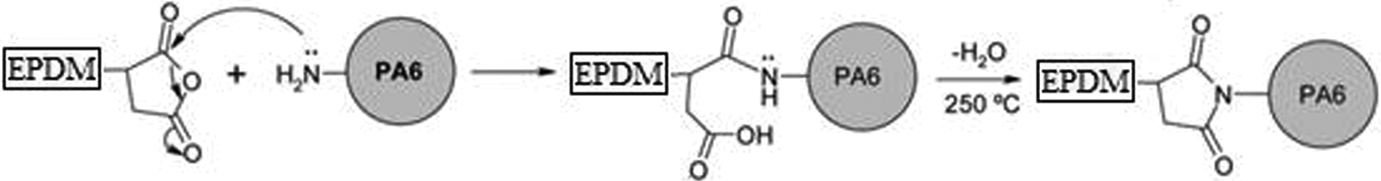
Schematic representation of interface grafting by reaction between a carboxyl group of MAH in MAH-g-EPDM and a polyamide amino end-group in PA6. MAH: maleic anhydride; EPDM: ethylene–propylene–diene rubber; PA6: polyamide 6.
Calculation of the interfacial tension using rheological relaxation time simulation for the PA6/MAH-g-EPDM binary blend
In order to overcome the deficiency of the contact angle measurement method, which does not take the reaction between the PA6 and MAH-g-EPDM into account, a rheological relaxation time simulation was used to calculate the interfacial tension for the PA6/MAH-g-EPDM binary blend.
In Gramespacher and Meissner’s 37 research, they observed that the relaxation spectrum of a blend can be considered as a sum of the relaxation spectra of the pure phases of the blends and an additional relaxation time that corresponds to the relaxation time of the shape of the dispersed droplets when sheared. Based on this observation, they developed a constitutive equation, following the work of Seung Jung and Schowalter 38 and using an empirical mixing rule. They obtained a series of equations for the storage and the loss moduli of the blend.


where,
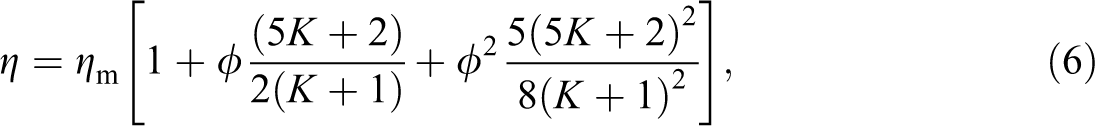


where η, η m, and η d are the Newtonian viscosities of the blend, matrix, and dispersed phase, respectively, K = η d/η m, α is the interfacial tension, R is the radius of the monodisperse inclusions of the theory, φ is the volume fraction of the dispersed phase, τ 1 and τ 2 are the characteristic relaxation time of the dispersed phase and the matrix, respectively, and τ 0 is the additional relaxation time from which we could calculate the interfacial tension using equation (9).
Figure 5 shows the relaxation spectra of the pure PA6, MAH-g-EPDM, and the PA6/MAH-g-EPDM binary blend. They were calculated using the nonlinear regression method that was available in the stress rheometer TA-AR2000ex software package from Rheometrics. 39 Comparing the relaxation spectra of the PA6/MAH-g-EPDM binary blend with those of the pure PA6 and MAH-g-EPDM spectra, it was found that there was a distinct, long relaxation process at 4.5 s, due to the relaxation behavior of the dispersed particles.
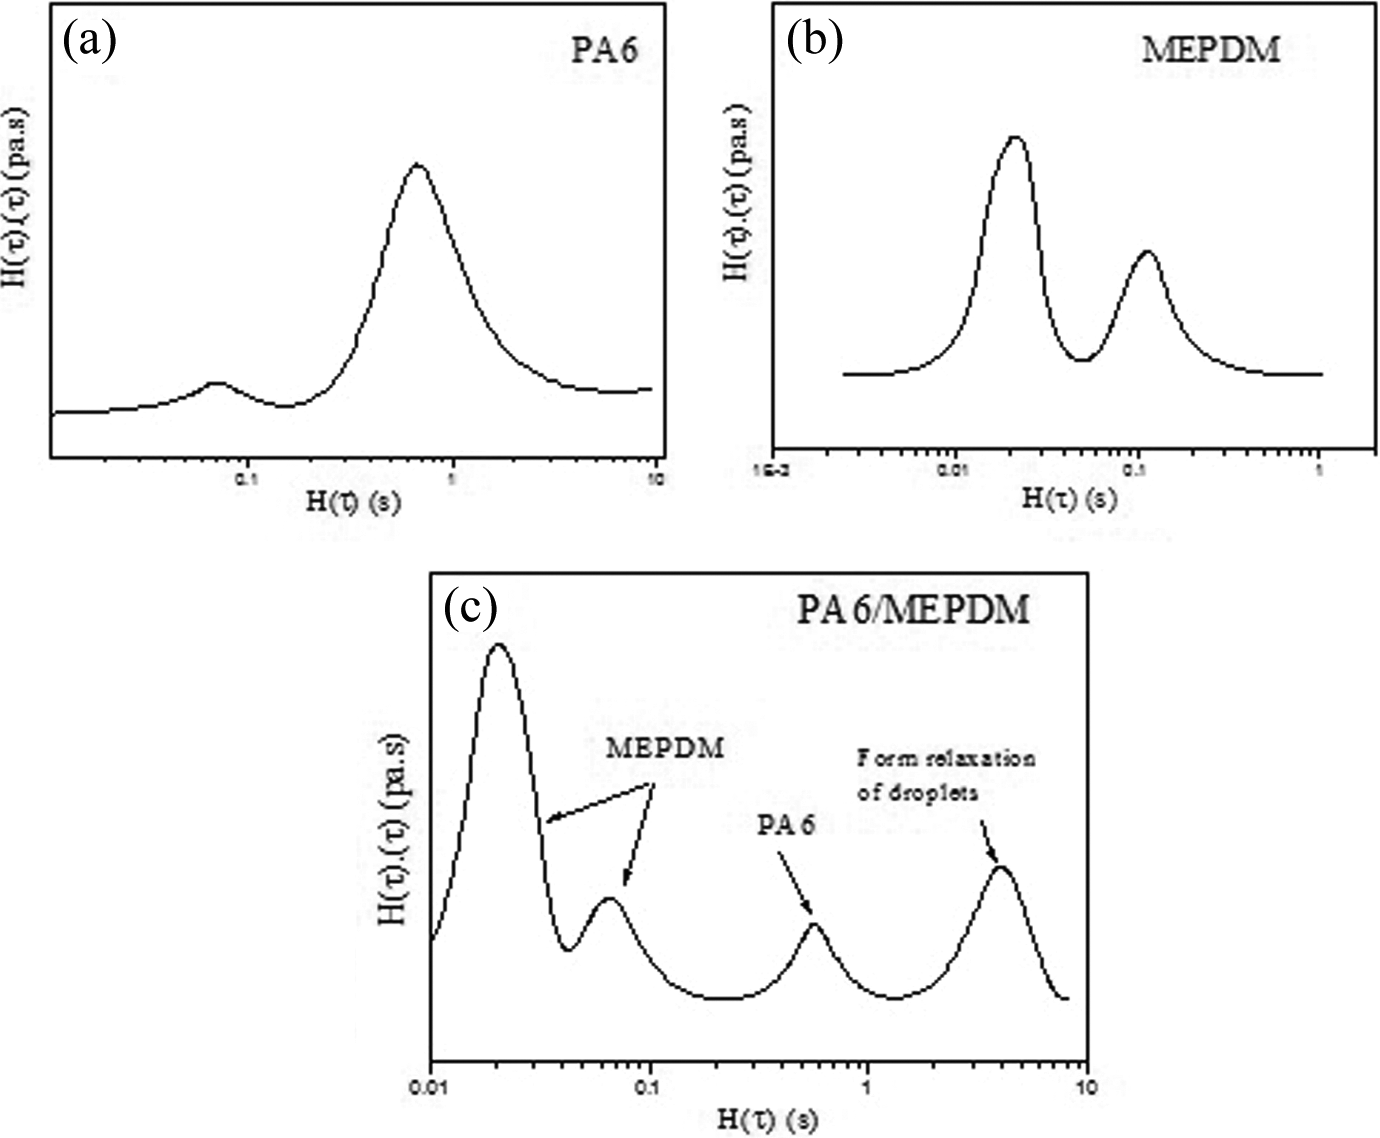
Relaxation spectra of pure PA6 (a), pure MEPDM (b), and PA6/MEPDM 85/15 blend (c). PA6: polyamide 6; MEPDM: maleated ethylene–propylene–diene rubber.
For the disperse phase and matrix Newtonian viscosity, we can fitt the complex viscosity curves obtained from the dynamic rheological test by the cross model (equation (10)), and the results were η m = 200 Pa·s and η d = 12,000 Pa·s.

Figure 6 shows the SEM micrograph and the measured particle size distribution of the PA6/MAH-g-EPDM 85/15 binary blend (etched). The dispersed particle sizes were all <1 μm and mostly between 0.3 μm and 0.6 μm, which suggests good compatibility between the matrix and the dispersed phase. Additionally, the average radius of the dispersed particles was obtained using equation (11), Rv = 0.39 μm.
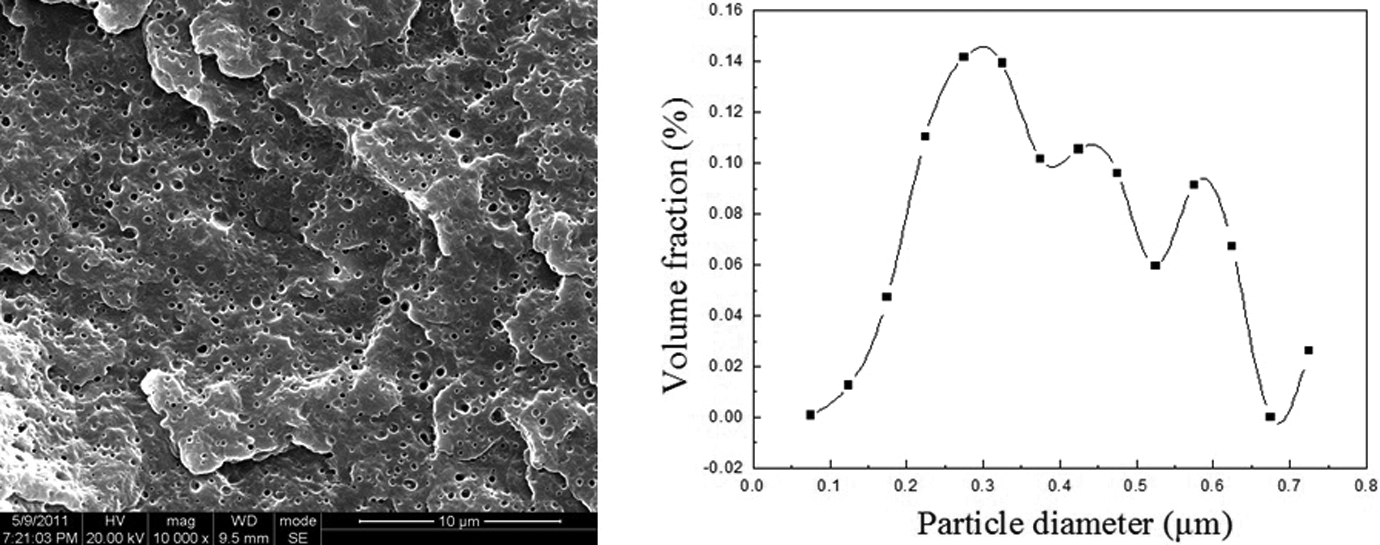
SEM photographs of the PA6/MAH-g-EPDM 85/15 binary blend and the particle size distributions by volume. SEM: scanning electron microscopy; PA6: polyamide 6; MAH: maleic anhydride; EPDM: ethylene–propylene–diene rubber.
where Ri is the radius of each dispersed droplet and Φi is the volume fraction of each dispersed droplet.
Through the above analysis, we obtained τ 0 = 4.5 s, Rv = 0.39 μm and the zero shear viscosity of the PA6 matrix η m = 200 Pa·s and the viscosity ratio K = 60. Then, using equation (9), the interfacial tension of PA6/MAH-g-EPDM could be calculated, the value was α = 0.97 mN m−1.
The morphology evolution of the PA6/MAH-g-EPDM/HDPE blend
According to Hobbs et al. 15 , it is possible to predict qualitatively the type of the phase morphology developed in a ternary immiscible polymer blend using the concept of the spreading coefficient as initially introduced by Harkin. 40 In a ternary blend of polymers A, B, and C (supposing A is the matrix), the spreading coefficient, λ CB can be defined as λ CB = α BA − α CA − α BC, where λ CB is the spreading coefficient of C over B and α BC is the interfacial tension between B and C. Here, when PA6 acts as the matrix, through the interfacial tension results, we can calculate the spreading coefficient using the Harkin’s equation, and Table 3 shows the results. Also according to Hobbs et al.’s work, when λ BC > 0 and λ CB < 0, the core–shell interaction which B encapsulate C must be the stable morphology. So, we can predict that the morphology of our ternary blend should be a core–shell structure, in which HDPE acts as the core and MAH-g-EPDM acts as the shell.
Spreading coefficients for PA6/MAH-g-EPDM/HDPE ternary blends: PA6 matrix; MAH-g-EPDM; and HDPE.
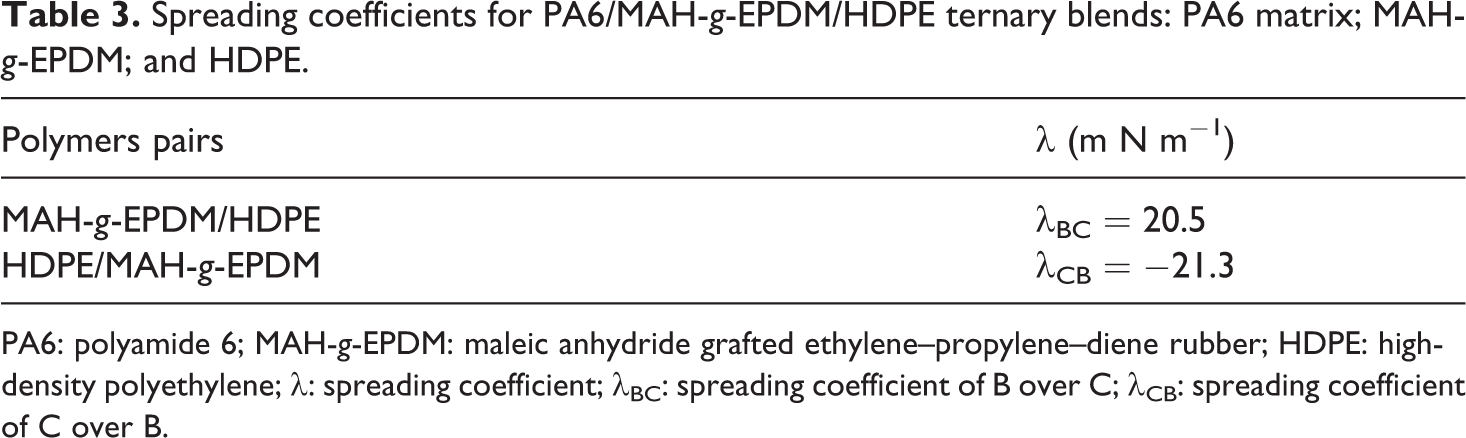
PA6: polyamide 6; MAH-g-EPDM: maleic anhydride grafted ethylene–propylene–diene rubber; HDPE: high-density polyethylene; λ: spreading coefficient; λ BC: spreading coefficient of B over C; λ CB: spreading coefficient of C over B.
But in order to study the morphology evolution of the ternary blend, some other kinetic factors like viscosity ratio, process method, mixing time, and so on should also be taken into consideration. The core–shell structure is the only thermodynamic steady state.
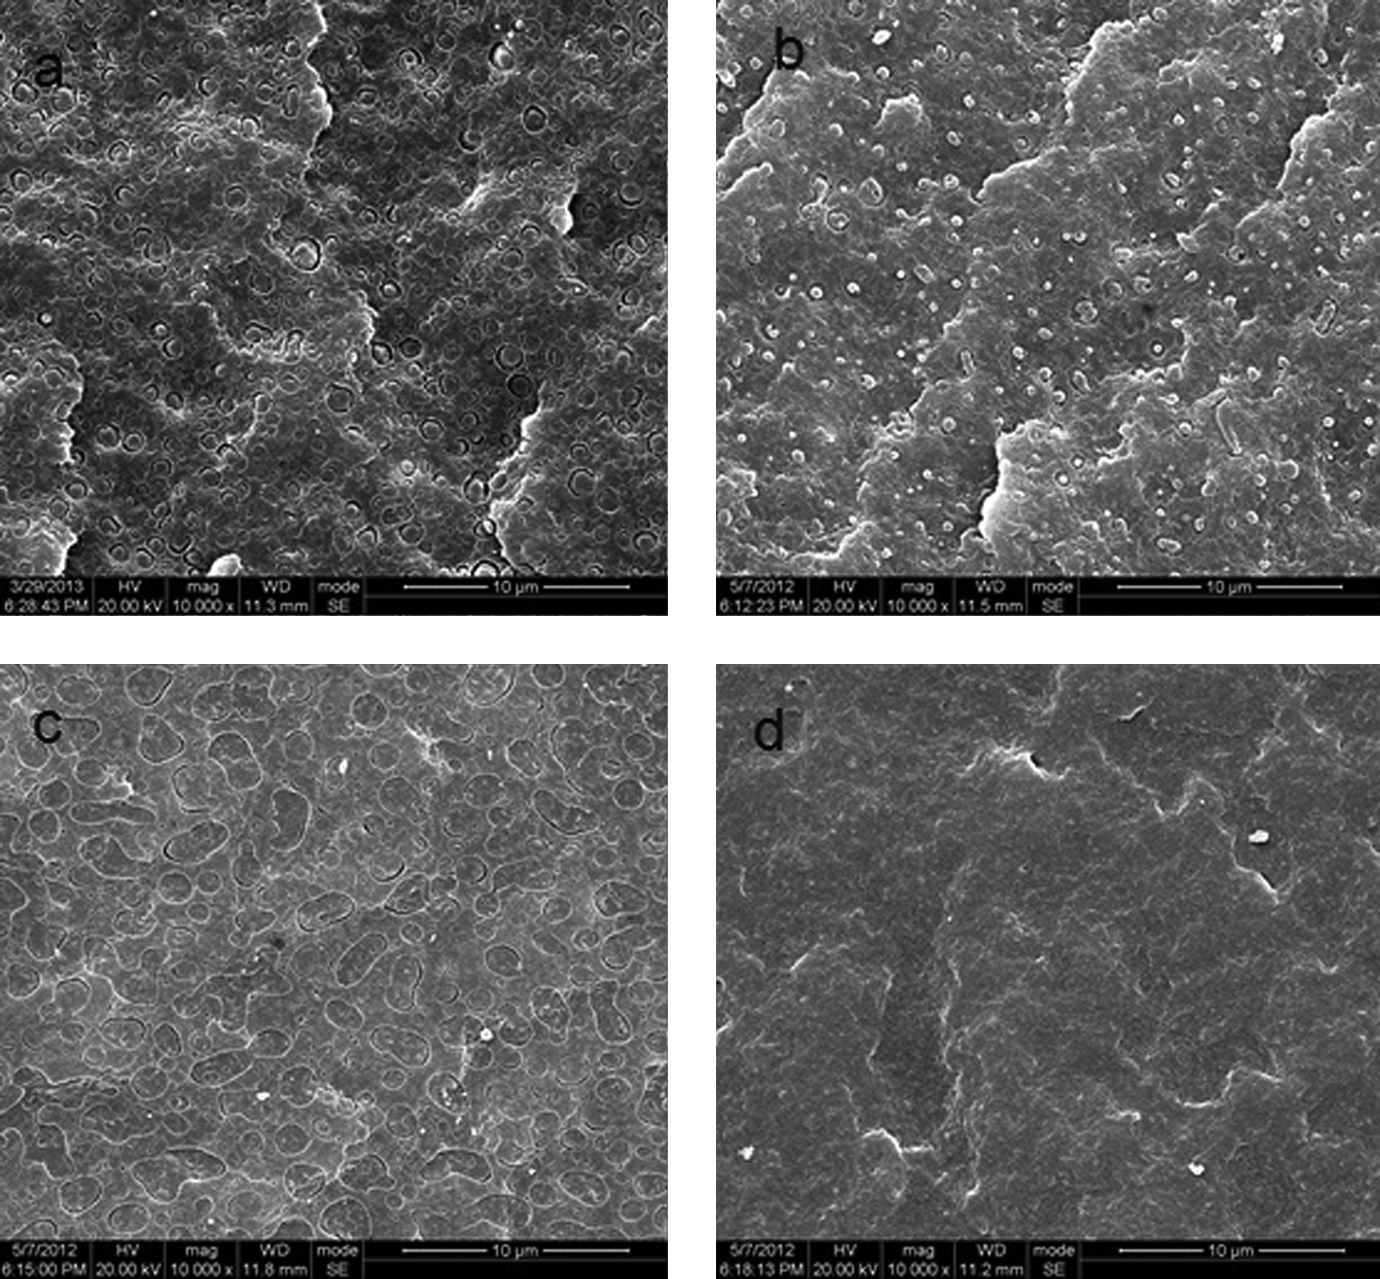
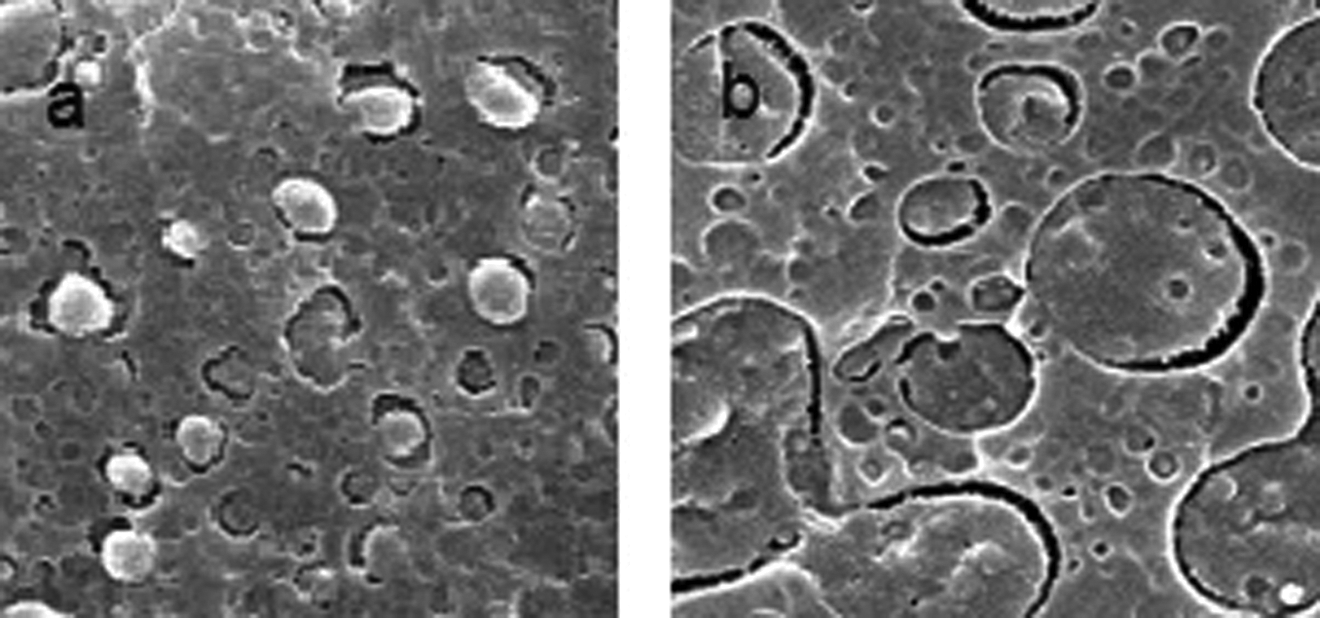
Figure 7 shows the actual morphology of the PA6/MAH-g-EPDM/HDPE blend prepared by the one-step processing method of different samples. As shown, a core–shell structure formed in the PA6/MAH-g-EPDM/HDPE 70/15/15 sample is in good agreement with the prediction results. When increasing the content of the HDPE and MAH-g-EPDM dispersed phase, the blends tended to form a multiple encapsulated structure. Figure 8(a) shows that the complex particles have a large MAH-g-EPDM shell that encapasulates some core–shell particles. Because of the reaction, some MAH-g-EPDM was not being removed and looked like fiber in the shell. What’s more, when further increasing the content of the dispersed phase, the 50PA6/25 MAH-g-EPDM/25HDPE sample tended to form a co-continuous structure (seen in Figure 8(b)). When the content of PA6 decreased to 40%, neither the core–shell particles nor the complex particles that had MAH-g-EPDM shells could be seen. That should be due to the phase inversion, where HDPE acted as the matrix and PA6 as dispersed particles as shown in Figure 7(d).
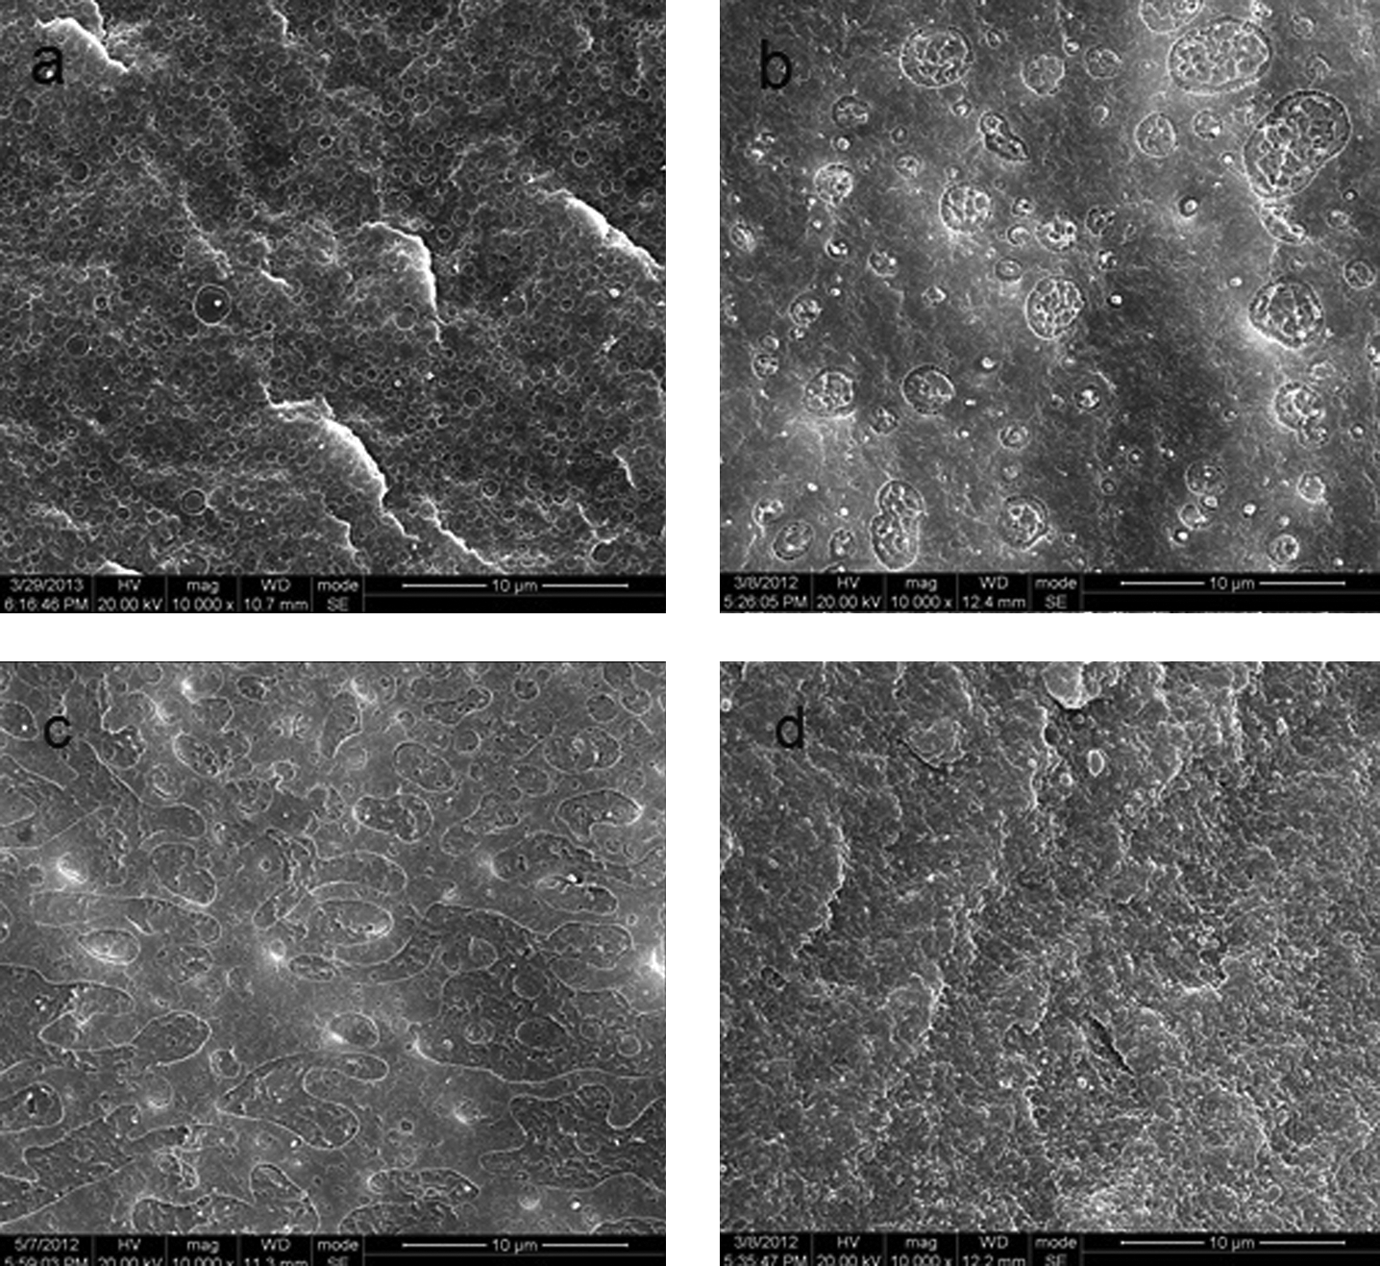
Morphology of the etched samples of the PA6/MEPDM/HDPE blend prepared by one-step processing method: (a) PA6/MEPDM/HDPE 70/15/15, (b) PA6/MEPDM/HDPE 60/20/20, (c) PA6/MEPDM/HDPE 50/25/25, and (d) PA6/MEPDM/HDPE 40/30/30. PA6: polyamide 6; MEPDM: maleated ethylene–propylene–diene rubber; HDPE: high-density polyethylene.
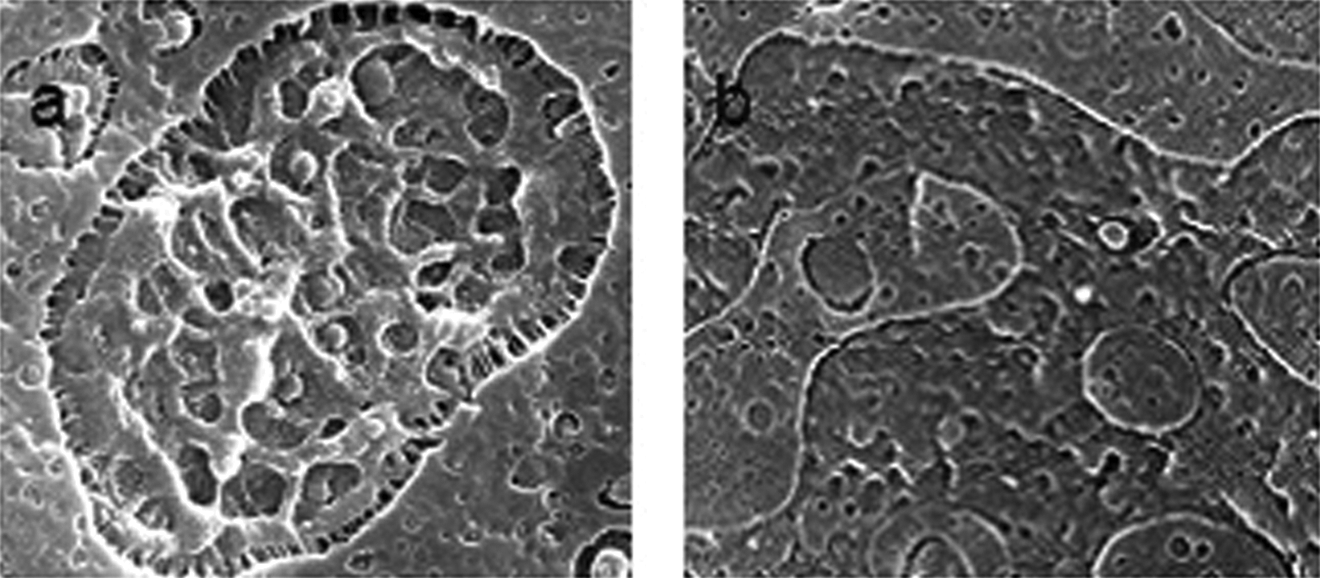
Magnified SEM photographs of the PA6/MEPDM/HDPE blend prepared by one-step processing method: (a) PA6/MEPDM/HDPE 60/20/20 and (b) PA6/MEPDM/HDPE 50/25/25. PA6: polyamide 6; MEPDM: maleated ethylene–propylene–diene rubber; HDPE: high-density polyethylene.
Figure 9 presents the morphology of the PA6/MAH-g-EPDM/HDPE blend prepared by the two-step processing method. The PA6/MAH-g-EPDM/HDPE 75/15/15 sample also formed a core–shell structure like the sample prepared by the one-step processing method. Compared with the PA6/MAH-g-EPDM/HDPE 60/20/20 sample prepared by the one-step processing method, no evident multiple encapsulated particles were discovered in the sample prepared by the two-step processing method (shown in Figure 10). It still tended to form the core–shell structure. Also, as shown in Figure 10, the PA6/MAH-g-EPDM/HDPE 50/25/25 sample did not present a co-continuous morphology structure. As the prediction suggested that the core–shell structure was the thermodynamic steady state for the PA6/MAH-g-EPDM/HDPE ternary blend when PA6 acted as the matrix. Because of the high viscosity of MAH-g-EPDM and the high content of the HDPE, it was difficult for the MAH-g-EPDM to encapsulate the HDPE in the one-step processing method. However, for the two-step processing method, HDPE and MAH-g-EPDM were melted first, and then the PA6 melt was mixed with the binary blend, which permitted the MAH-g-EPDM to much easily encapsulate the HDPE. As in the case of the PA6/MAH-g-EPDM/HDPE 40/30/30 sample prepared by the one-step processing method, in the same sample with the same proportion prepared by two-step processing method phase inversion occurred, but no obvious PA6 particles could be seen in the matrix, which suggested that it made the dispersed PA6 particles easier to distribute through two-step processing method.
Morphology of the PA6/MEPDM/HDPE blend prepared by two-step processing method: (a) PA6/MEPDM/HDPE 70/15/15, (b) PA6/MEPDM/HDPE 60/20/20, (c) PA6/MEPDM/HDPE 50/25/25, and (d) PA6/MEPDM/HDPE 40/30/30. PA6: polyamide 6; MEPDM: maleated ethylene–propylene–diene rubber; HDPE: high-density polyethylene.
Magnified SEM photographs of PA6/MEPDM/HDPE blend prepared by two-step processing method: (a) PA6/MEPDM/HDPE 60/20/20 and (b) PA6/MEPDM/HDPE 50/25/25. SEM: scanning electron microscopy; PA6: polyamide 6; MEPDM: maleated ethylene–propylene–diene rubber; HDPE: high-density polyethylene.
Crystallization of PA6 in PA6/maleated-EPDM/HDPE blends
As shown in Figure 11, the bulk crystallization temperatures (T c) of the virgin PA6, which had not been extruded, were obviously lower than the extruded samples. This effect has also been found by other authors and has been explained by a more ordered molecular arrangement that persists in the molten state due to the stabilizing effect of hydrogen bonding after melt extrusion of PA6. 41,42 The virgin material is thought to be disordered and to stay disordered in the molten state, again due to hydrogen bonding. 43
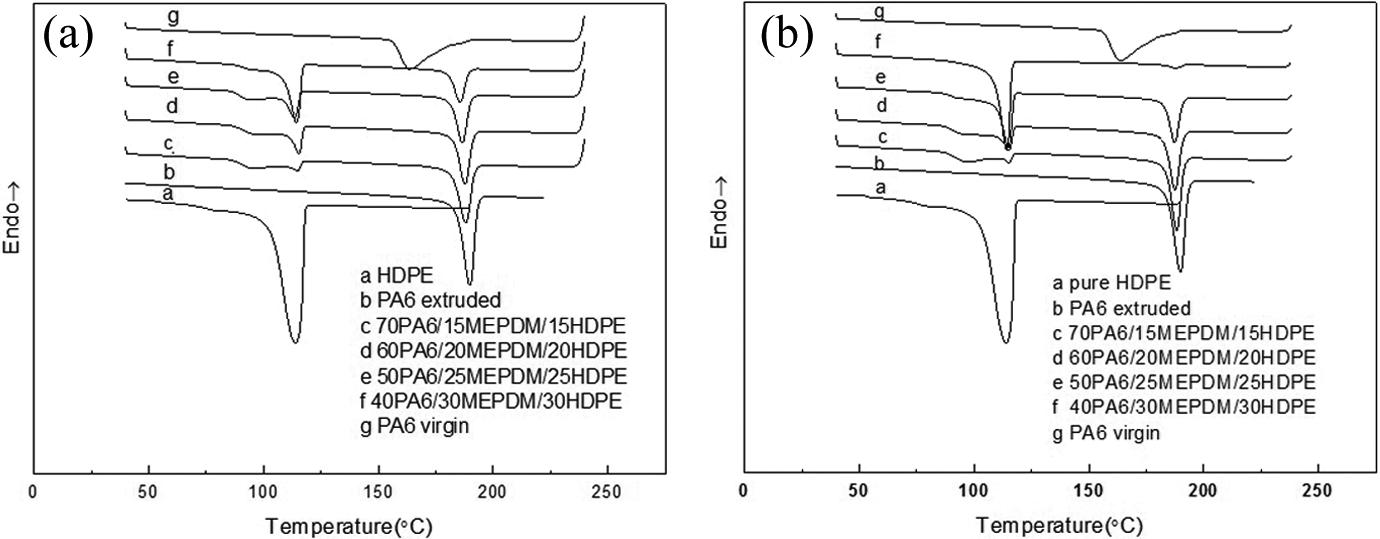
The nonisothermal crystallization curves of PA6/MEPDM/HDPE blends prepared by different processing method: (a) one-step processing method and (b) two-step processing method). PA6: polyamide 6; MEPDM: maleated ethylene–propylene–diene rubber; HDPE: high-density polyethylene.
The crystallization peak of PA6 almost disappeared in the PA6/MAH-g-EPDM/HDPE 40/30/30 sample prepared by the two-step method (Figure 11(b)). This phenomenon strongly depends on the morphology of the blend. When the sample was composed of a matrix/PA droplet phase morphology, heterogeneous nucleation of the crystallizable polymer (PA6 in this case) was restricted to the volume of the droplet. 44 If the dispersed particle was small enough and the concentration of particles was high enough, the crystallization behavior of some of the dispersed particles will be restricted. However, in the PA6/MAH-g-EPDM/HDPE 40/30/30 sample prepared by the one-step method, the crystallization behavior was not restricted (as shown in Figure 11(a)). It was consistent with the morphology in that in this blend PA6 particles could be seen clearly and the sizes were larger compared with the same sample prepared by the two-step method. Such a phenomenon could also be confirmed by the isothermal differential scanning calorimetry crystallization curves as shown in Figure 12; the PA6/EPDM/HDPE 40/30/30 sample prepared by the two-step method did not crystallize at 200°C whereas the PA6/EPDM/HDPE 40/30/30 sample prepared by the one-step method did crystallize.
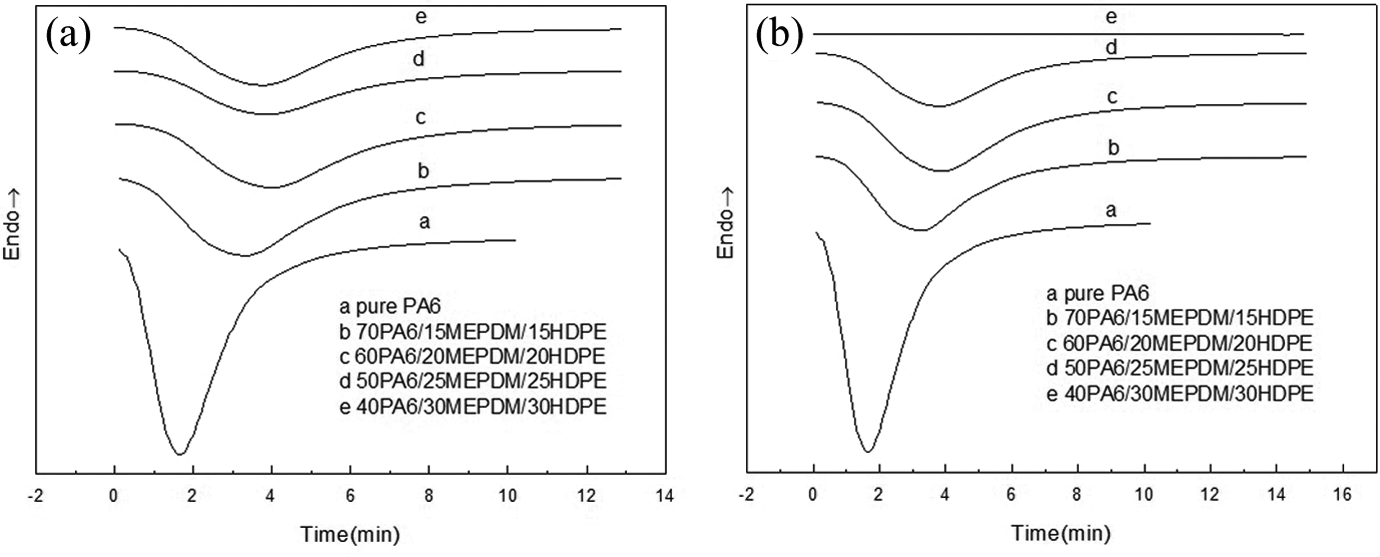
The isothermal DSC crystallization curves of different PA6/MEPDM/HDPE blends at 200°C (a) one-step processing method and (b) two-step processing method). DSC: differential scanning calorimetry; PA6: polyamide 6; MEPDM: maleated ethylene–propylene–diene rubber; HDPE: high-density polyethylene.
Conclusions
The morphology of the PA6/MAH-g-EPDM/HDPE blends and the crystallization of PA6 were studied in this work. The results showed that both thermodynamics and kinetic factors played an important role in the process of morphology evolution for the ternary blends. Through the calculation of the interfacial tension, it was predicted that the core–shell structure should be the thermodynamic steady state morphology. It was easier to maintain the thermodynamic steady state morphology by the two-step processing method than the one-step processing method. The different morphologies of the samples prepared by the different processing methods strongly influenced the crystallization behavior of the PA6 especially when PA6 acted as the dispersed phase.
Footnotes
Funding
The authors gratefully acknowledge financial support from the National Key Basic Research Program of China (973 Program, No. 2012CB025902) and the National Natural Science Foundation of China (Contract No. 51273219).