
Abstract
Citric acid (CA) was used as a grafted group onto polyurethane (PU) to form a CA-grafted PU series, with a control PU series containing free CA prepared for comparison. With an increase in the CA content, the enthalpy change during the melting increased for the PU and CPU series, and the glass transition temperature increased with the increase in CA content for the PU series but not for the CPU series. The tensile strengths of the PU series sharply increased with the CA content, whereas those of the CPU series did not. The PU series demonstrated better low-temperature flexibility and water permeability than the unmodified PU.
Introduction
Every year, over a million tons of citric acid (CA) are produced by fermentation to supply the industrial demand. Originally, CA was known as the energy-generating metabolic intermediate in the Krebs cycle or CA cycle in aerobic organisms. CA consists of three carboxyl groups and one hydroxyl group per molecule. Due to its distinct structure, CA is widely used as a pH-adjusting agent, a chelating agent for the removal of metal ions, and a flavoring and preservative in food and beverages. 1 CA is also the active ingredient in some bathroom and kitchen cleaning solutions. In addition to the broad industrial applications of CA, it has been used for building various smart materials. For example, CA has been used as a blood anticoagulant by inhibiting the calcium ion from starting the blood coagulation cascade mechanism. Therefore, CA has been incorporated into a polyurethane (PU) membrane for blood transporting applications. 2 CA is used as a cross-linking agent for cyclodextrin that could be applied for the removal of organic pollutants and heavy metals in water resources. 3 Carbon nanotubes (CNTs) functionalized with CA increased the platinum particle binding on CNTs and demonstrated better electrode performance. 4 The biomass surface was covalently modified with CA to capture the cationic dyes in a waste dye solution on the anionic side of CA and to improve the industrial wastewater purification efficiency. 5 The nontoxic and readily available CA could be applied to starch processing; the cross-linking of starch film by CA improved the tensile strength, thermal stability, and water stability. 6
Meanwhile, the polymer modification method via the grafting of functional groups has been used to improve certain properties, such as water compatibility, 7 flame retardation, 8 biocompatibility, 9 mechanical strength, or thermal stability. Instead of functional groups, simple side groups were grafted onto the polymer to modify the polymer properties. For example, modification of polyimide with bulky side group is known to prevent tight packing of polymeric chains and to improve the gas permeability and selectivity of the polymeric membrane. 10,11 Grafting a flexible unit onto an aromatic polyimide that was difficult to process due to low solubility has been used as a method to improve the processability and solubility in solvents. 12 Grafting of a nitrile group onto polyimide was reported to improve the adhesion of polyimide to copper. 13 The modification methods are advantageous in obtaining the target properties without significantly changing the intrinsic properties of polymers. Among the polymers, PU has been frequently selected as the polymer backbone because of its excellent mechanical properties, reproducible shape recovery, resistance to acids and bases, and high industrial demand in coatings and textiles. 14,15 Various modified PUs with grafted functional groups were reported. For example, a hydantoin group was grafted onto PU to impart a biocidal effect to the PU coating. 16 Mesogenic side groups were grafted to PU to synthesize the liquid crystalline PU. 17 PU was grafted with the poly(ethyleneglycol) side group to control the particle size and viscosity of aqueous PU dispersion. 18 The pendant triazene chromophore was grafted to PU to develop a photosensitive PU. 19 In this investigation, CA was used as the grafted functional group because the three carboxyl groups in CA may affect the molecular interactions between PUs and change its water compatibility and tensile properties. The PU surface grafting method has been reported in the literature 20 –24 and has been previously demonstrated in developing functionalized PUs; for example, PUs that exhibited flexibility at low temperatures 25 and pH sensitivity 26 were successfully developed. In this study, the grafting of CA onto PU, the effect of grafted CA on the physical properties (tensile strength and shape recovery) of PU, and the low-temperature flexibility and water permeability of the resulting PU compared with those of unmodified PU were investigated.
Experimental
Materials
Poly(tetramethylene ether)glycol (PTMG, number-average molecular weight approximately 2000 g mol−1; Sigma-Aldrich, St. Louis, Missouri, USA), 4,4′-methylenebis(phenyl isocyanate) (MDI; Junsei Chemical, Tokyo, Japan), and 1,4-butanediol (BD; Junsei Chemical, Japan) were dried overnight under high vacuum (13.3 Pa). CA (
Polymer synthesis
MDI (MDI-1, 5.00 g, 20.0 mmol) was added to PTMG (40.0 g, 20.0 mmol) in a 500-mL four-necked, beaker-type flask equipped with a mechanical stirrer, condenser, temperature-controlled heating mantle, and nitrogen purge. The mixture was allowed to react for 2 h at 50°C to produce the prepolymer. BD dissolved in 10 mL of DMF in the amount specified in Table 1 was added to the prepolymer. The mixture was allowed to react for 1 h. Then, MDI (MDI-2, 7.50 g, 30.0 mmol) was added to the reaction mixture, and the reaction continued for 1 h, during which 10 mL of DMF was slowly added via a dropping funnel to prevent a sudden increase in viscosity. MDI (MDI-3) of which the amount was increased in proportion to that of CA was subsequently added to the reaction mixture, and the reaction continued for 40 min. Next, as specified in Table 1, CA was dissolved in 10 mL of DMF and added to the reaction mixture. The reaction continued for 3 h. Then, the product was precipitated in distilled water (1.5 L) to terminate the polymerization. The product was cut into pieces and thoroughly washed with distilled water (1.5 L × 3) and ethanol (1 L × 2) under magnetic stirring to remove any remaining reactants. The final product was suction filtered and dried in an oven (60°C) for 3 days. The PU structure and CA grafting steps are shown in Figure 1. Mechanical and shape memory test samples were prepared by the solvent casting method. Specifically, a sample solution in DMF was filtered and slowly evaporated at 60°C for 60 h to obtain a sheet (0.5 mm thick). The film thickness was measured using a digital caliper (Mitutoyo CD-15CPX, Tokyo, Japan), and the average thickness of five points was recorded. Specimens were prepared from the sample sheet according to ASTM D638 standard. Two sample series were prepared, as follows: a PU series containing the grafted CA and a control PU (CPU) series in which CA was not grafted. To determine the carboxyl content of the PU series, a PU solution (1 g dissolved in 20 mL of DMF) was diluted with 10 mL of isopropanol and titrated with a 0.1 M NaOH solution (50/50, v/v, water/isopropanol) using a drop of phenolphthalein indicator in ethanol. The carboxyl content of the PU series (mmol g−1) was calculated as the average of five titrations.
Polymer composition.
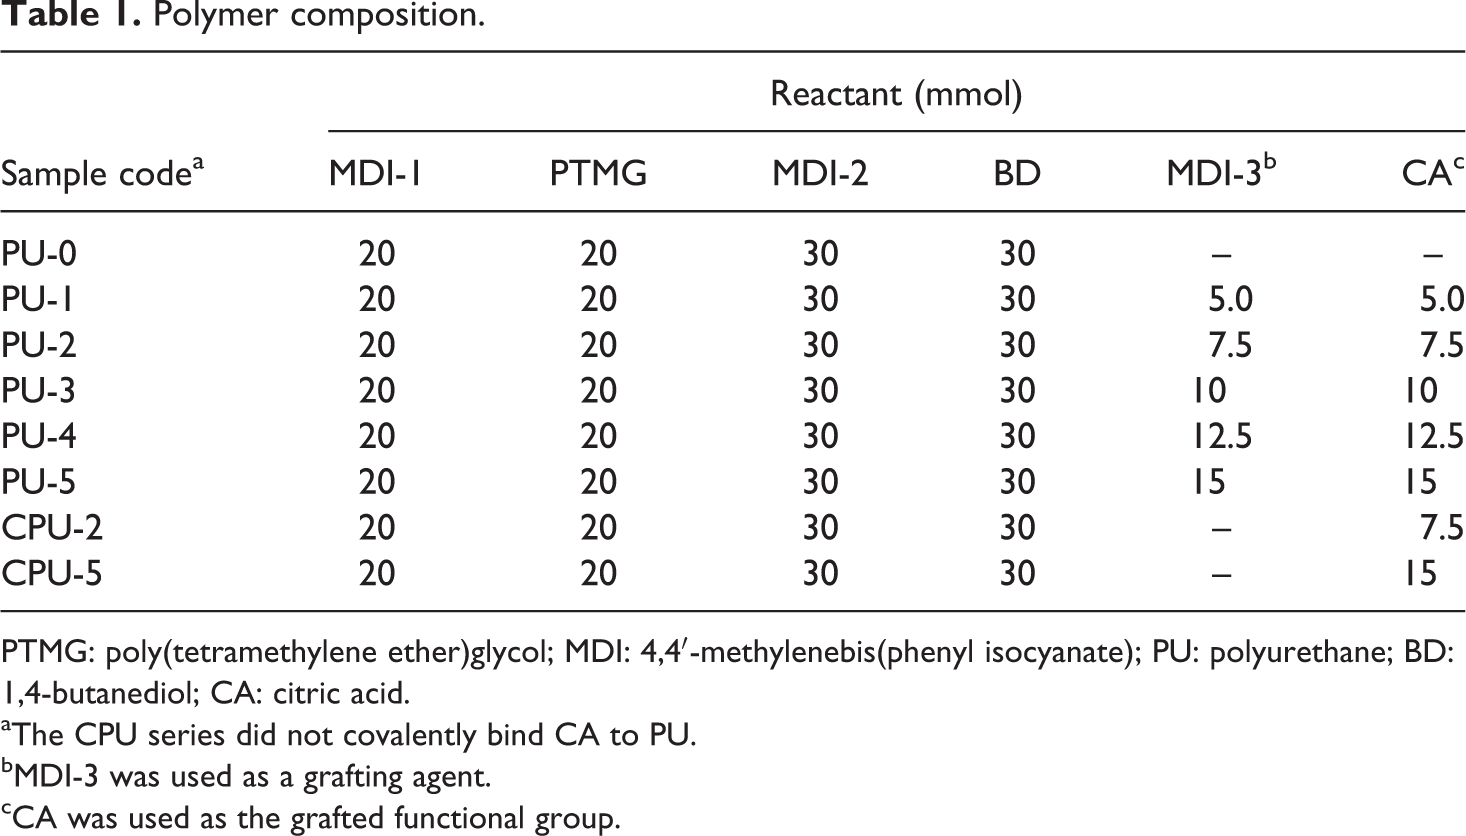
PTMG: poly(tetramethylene ether)glycol; MDI: 4,4′-methylenebis(phenyl isocyanate); PU: polyurethane; BD: 1,4-butanediol; CA: citric acid.
aThe CPU series did not covalently bind CA to PU.
bMDI-3 was used as a grafting agent.
cCA was used as the grafted functional group.
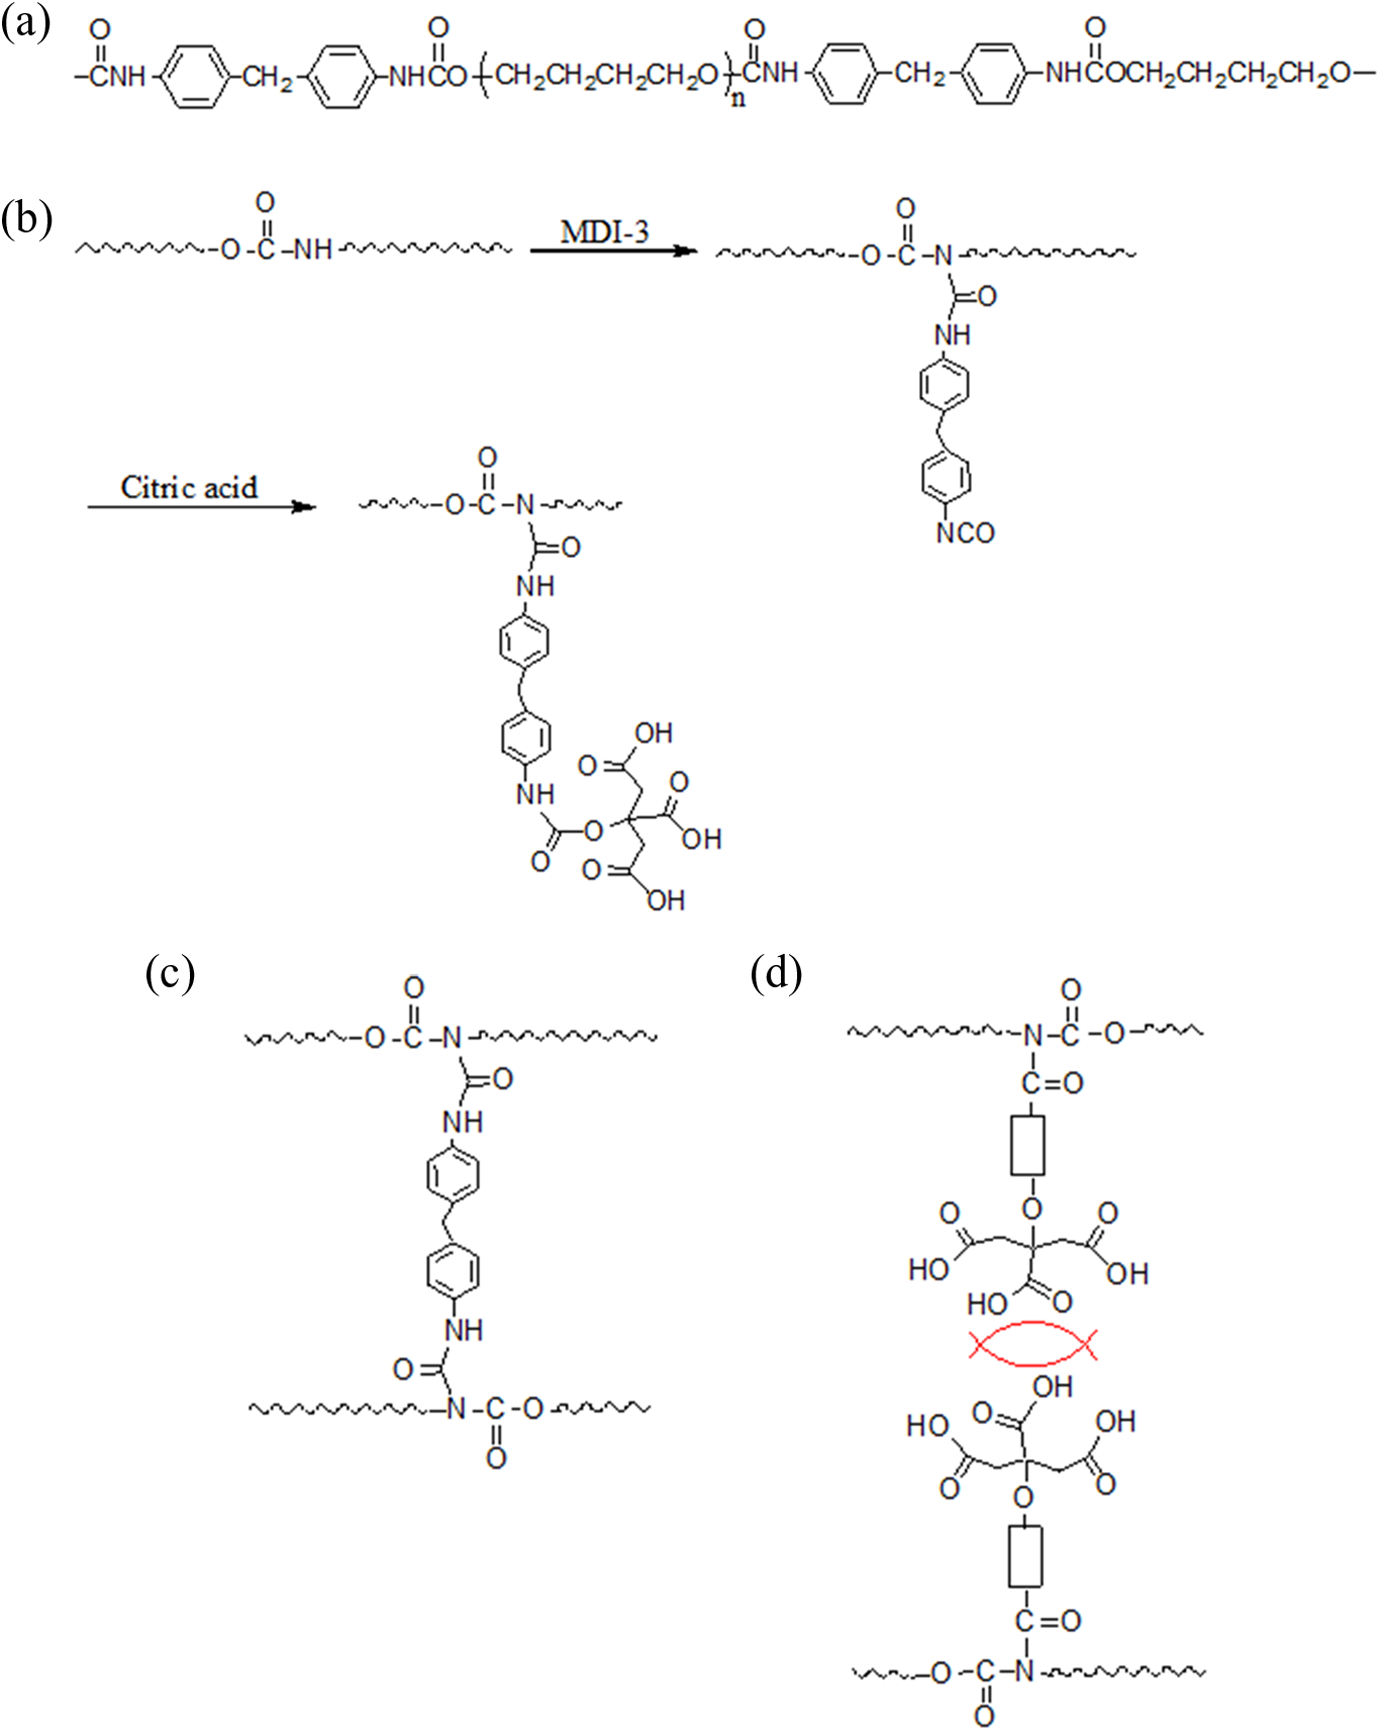
(a) Structure of unmodified PU, (b) grafting of CA onto PU, (c) cross-linking of PUs via MDI, and (d) repulsion between PUs by the grafted CAs. PU: polyurethane; CA: citric acid; MDI: 4,4′-methylenebis(phenyl isocyanate).
Cross-link density
A 20 × 20 × 1 mm3 specimen with a known sample weight (m 1) was allowed to swell in 50 mL of toluene in a closed-cap bottle for 24 h. The swollen weight of the specimen (m 2) was measured after quickly removing the adsorbed toluene from the polymer surface with a tissue. The swollen specimen was dried at room temperature for a week and then weighed to obtain the dry mass (m 3). The solvent volume (V s) in the swollen specimen was calculated using the weight difference between the swollen (m 2) and dry states (m 3) and the solvent density (0.8699 g cm−3) and was averaged over five swelling experiments. The volume of the dried polymer (V p) was calculated by dividing the polymer dry weight (m 1) by the polymer density. The volume fraction of the polymer in the swollen mass (v 1) was calculated as V p/(V s + V p). The derivation of the cross-link density is described in the Results and discussion section.
Spectroscopic, contact angle, and viscosity analysis
A Fourier transform infrared (FTIR) spectrophotometer (JASCO 300E, Tokyo, Japan) equipped with attenuated total reflectance was used to collect infrared spectra. For each sample, 25 scans were performed using a resolution of 4 cm−1 and a scan speed of 2 mm s−1. The absolute viscosity of the samples dissolved in the DMF was measured with a vibrating viscometer (AND SV-10, Tokyo, Japan) at 25°C and was calculated as the average of five tests at a concentration of 2 wt% (m/v). The contact angle of a water drop (2 µL) on the polymer surface was measured using the sessile drop method with a contact shape analyzer (Krűss DA 100, Hamburg, Germany) for 10 min.
Thermal analysis
A differential scanning calorimeter (DSC; TA Instruments DSC-Q20, New Castle, Delaware, USA) was used to obtain calorimetry data from the heating and cooling scans, which were performed at a rate of 10°C min−1 between −50°C and 250°C. The sample (5 mg) was heated to 250°C and cooled to −50°C after being held at 250°C for 5 min. The sample was heated again to 250°C at 10°C min−1 and monitored for phase transitions. The cooling scan was monitored at −10°C min−1 from 250°C to −50°C. The soft segment melting temperature (T m) and enthalpy change during the melting (ΔH m) were determined using the Platinum™ software included with the DSC instrument. A thermogravimetric analyzer (SEIKO TG/DTA 200, Chiba, Japan) was used to monitor the thermal decomposition behavior between 25°C and 600°C at a heating rate of 10°C min−1 and a nitrogen purge rate of 50 mL min−1. Dynamic mechanical analysis (DMA) was used to collect phase transition data at the lower temperatures. Specifically, a dynamic mechanical analyzer (Triton TTDMA, Lincolnshire, UK) was used to measure the storage and loss moduli in the tension mode between −150°C and 100°C at 10 Hz.
Tensile and shape memory tests
Tensile mechanical properties were measured according to the ASTM D638 standard at 25°C using 0.5-mm thick samples. The measurements were collected on a universal testing machine (UTM, LR10K, Lloyd Materials Testing, West Sussex, UK) using a 20-mm gauge length, 20 mm min−1 crosshead speed, and 0.5 kN load cell. A total of seven specimens were tested for each group; the average tensile properties of five specimens, excluding the high and low values, were reported in this work. The same UTM equipped with a temperature-controlled chamber was employed for the cyclic shape memory tests. A sample of length L 0 was drawn 100% to 2L 0 in a temperature-controlled chamber at 45°C in 2 min, and the sample was held at 45°C for 5 min. The upper grip was released after the specimen was cooled with liquid nitrogen to −25°C for 10 min, and then the shrunken length (L 1) of the sample was recorded in real time by the attached computer. The percent shape retention (%) was then calculated using equation (1). In the chamber, the specimen was heated to 45°C for 10 min, and the length (L 2) was subsequently recorded. The percent shape recovery (%) was then calculated using equation (2). The cyclic shape memory test was repeated four times for each sample.


Low-temperature flexibility and water vapor permeation
A low-temperature flexibility test was conducted in a temperature-controlled chamber of the UTM using a twisted sample frozen at −35°C for 3 h; the sample’s behavior was recorded by a video camera (SONY HDR-CX 550, Tokyo, Japan) installed close to the chamber window as the temperature was increased at 10°C min−1. The water vapor permeabilities (WVPs) of the polymer membranes were determined by the time transfer method, as follows 27,28 : a polymer film (0.2 mm thick) was placed over a dish containing distilled water. The water volume was adjusted to allow for an air gap between the water and polymer film. The contact area between the dish and the film was tightly sealed, and the permeated water vapor through the polymer membrane was monitored at 60°C by measuring the weight loss at 1 h intervals for 24 h. The WVP (g m−2 h−1) per unit membrane area per hour was calculated from the amount of permeated water.
Results and discussion
Synthesis and structure of PU
The PU chains were composed of hard (MDI) and soft (PTMG) segments; CA was grafted onto the hard segments to modify the surface properties of PU. The carbamate bonding in the hard segments provided the grafting sites for CA, and the procedure was performed, using an extra MDI, following the PU surface modification method reported in the literature. 20 –24 The CA grafting steps are shown in Figure 1(b) in which MDI-3 was used as a grafting agent between PU and CA. The control CPU series had the same composition as the PU series, but the CA in the CPU series was not grafted to PU. CA was selected as the grafted functional group to improve the water compatibility and to control molecular interactions between PUs because the CA, having three carboxyl groups in a molecule, can increase the surface polarity and reduce the molecular interactions via the electrostatic repulsion between carboxyl groups (Figure 1(d)). As shown in Table 1, the CA content gradually increased, together with the MDI-3 content, as the sample number for the PU series increased, and MDI-3 was absent in the control CPU series. The grafted carboxyl groups on the PU chains were quantitatively determined by acid–base titration, and the determined carboxyl contents agreed well with the theoretical values, which suggested that CA was nearly quantitatively grafted to PU (Figure 2).
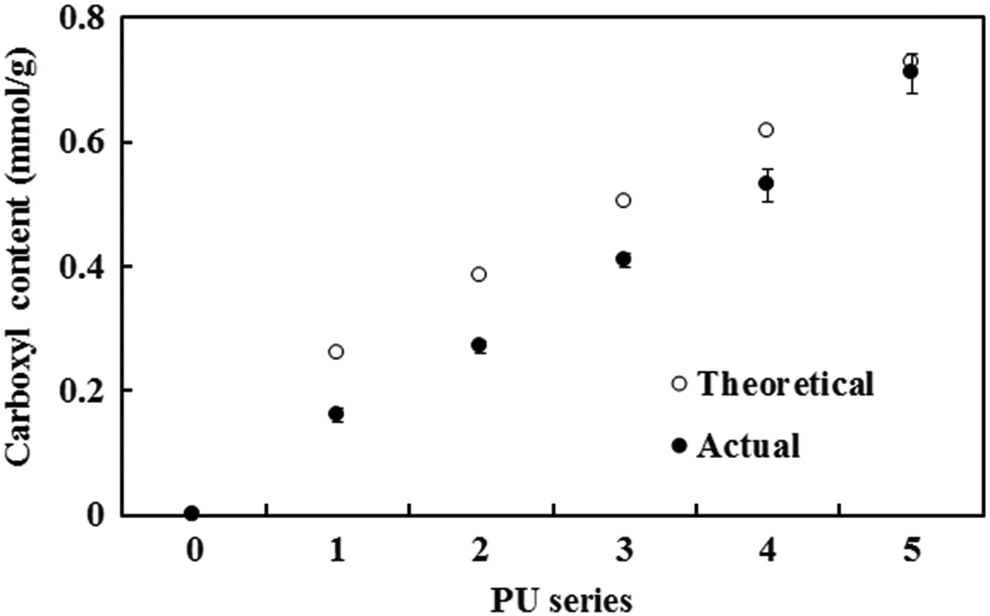
Titration of the carboxyl groups of the PU series. PU: polyurethane.
Cross-link density and viscosity
The cross-link density was determined by considering the swelling properties of the polymer in toluene, based on the inverse relationship between swelling and the degree of cross-linking. Specifically, the interaction parameter (χ) between toluene and PU was determined from the following expression 29 :

where δ 1 and δ 2 are the solubility parameters of solvent and polymer, respectively, V 1 is the solvent molar volume (106.3 cm3 mol−1), R is the gas constant (8.31 MPa·cm3 (K mol)−1), T is the absolute temperature (298 K), and χ is the interaction parameter.
The solubility parameters of toluene (δ 1) and PU (δ 2) were 18.2 and 20.5 (MPa)1/2, respectively. 30,31 The degree of cross-linking was calculated using the Flory–Rehner equation (4), as follows:

where v 2 is the volume fraction of the polymer in the swollen mass and n is the cross-link density.
The cross-link density of the PU series slightly increased with increasing CA content. However, the CPU series exhibited a lower cross-link density compared with that of the PU series (Figure 3). Some of the MDI-3 used for the grafting of CA onto PU may connect the PU chains, as shown in Figure 1(c), and lead to an increase in the cross-link density of the PU series, whereas the CPU series without MDI-3 did not yield a cross-link density as high as that in the PU series. The increase in the cross-link density of the PU series and the reduced cross-link density in the CPU series were related to the tensile mechanical properties discussed in the following section.
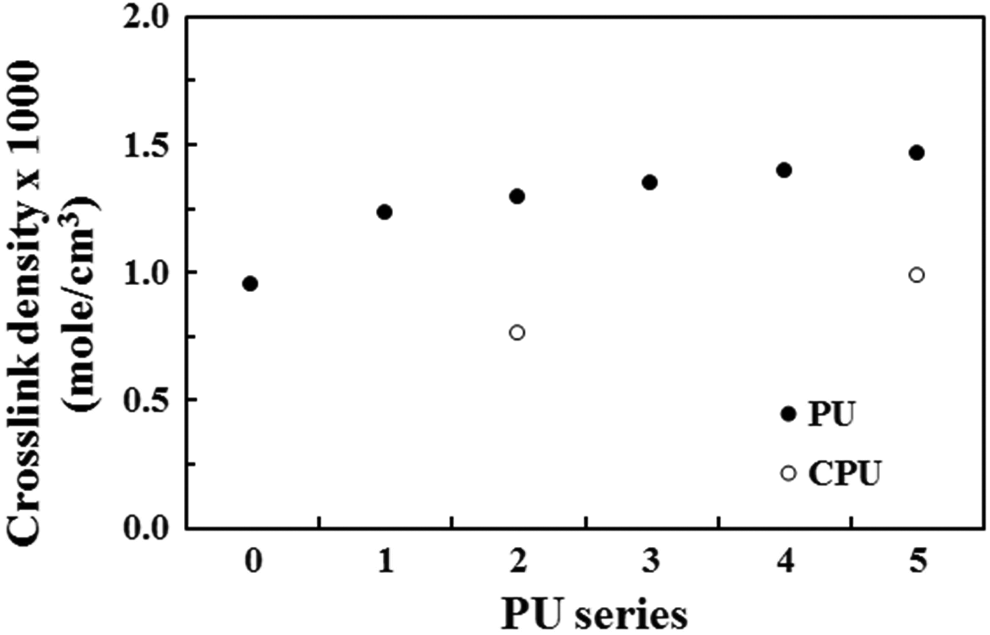
Cross-link density profile of the PU and CPU series. PU: polyurethane.
The viscosities of the PU and CPU series in DMF were measured to determine the effects of the grafted CA on the solution viscosity because the grafted CA may have affected the molecular movement of the PU chain over other PUs. The viscosity results exhibited trends similar to those of the cross-link density results because as the CA content increased, the PU series showed a notable increase, but the CPU series did not show an increase (Figure 4). The low viscosity of the CPU series observed at a high CA content suggested that the free CA did not drag the PU chain movement as much as the grafted CA. The solution viscosity of grafted polymers is known to be higher than that of unmodified polymers due to the increased friction resulting from grafted chains or groups. 18,32 The higher viscosity of the PU series compared with that of the CPU series was consistent with the literature results. Therefore, the viscosity results indicated that the friction induced by the grafted CA in the PU series resulted in an increased viscosity.
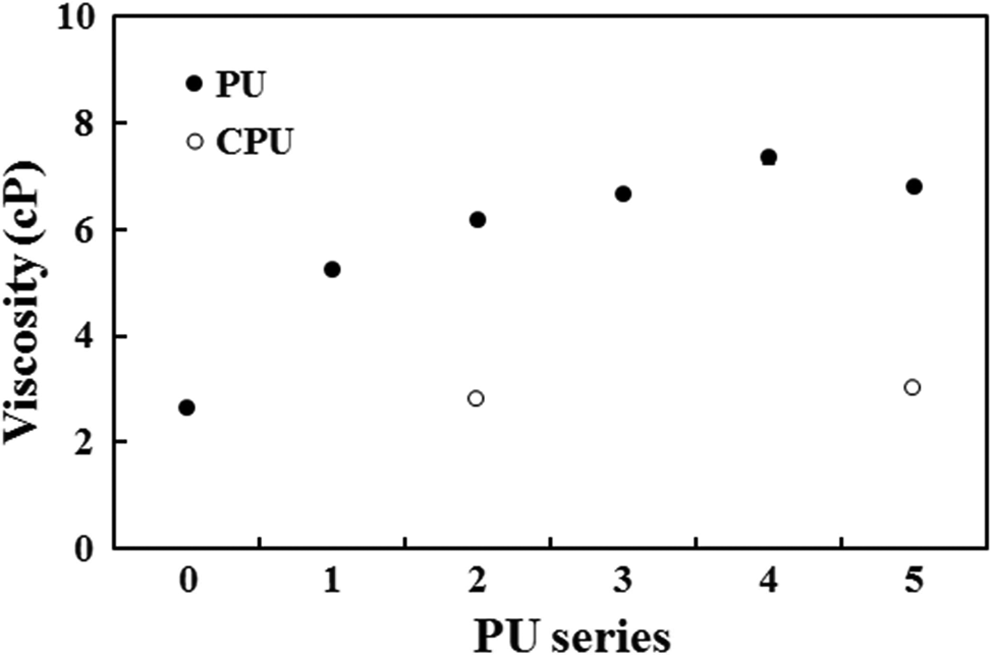
Viscosity profiles of the PU and CPU series. PU: polyurethane.
Contact angle
The contact angles of various water drops on polymer surfaces are compared in Figure 5. The water drops on PU-3 and PU-5 clearly reduced in size with time compared with the drops on PU-0, which suggested that the PU-3 and PU-5 surfaces became hydrophilic due to the carboxyl groups of the grafted CA. The contact angle decrease rate of PU-5 was slightly faster than that of PU-3 because of the increased CA content. The decreases in contact angles for PU-0, PU-3, PU-5, and CPU-5 are compared in Figure 5, which shows that the contact angle of CPU-5 was smaller than those of PU-3 and PU-5. Interestingly, the contact angle of CPU-5 decreased at a similar rate to that of PU-3 and PU-5. The blended CA in PU also improved the water compatibility of the PU surface as well as the grafted CA. Therefore, the contact angle results demonstrated that the carboxyl groups of CA, either grafted or not, significantly increased the water compatibility of the PU surface.
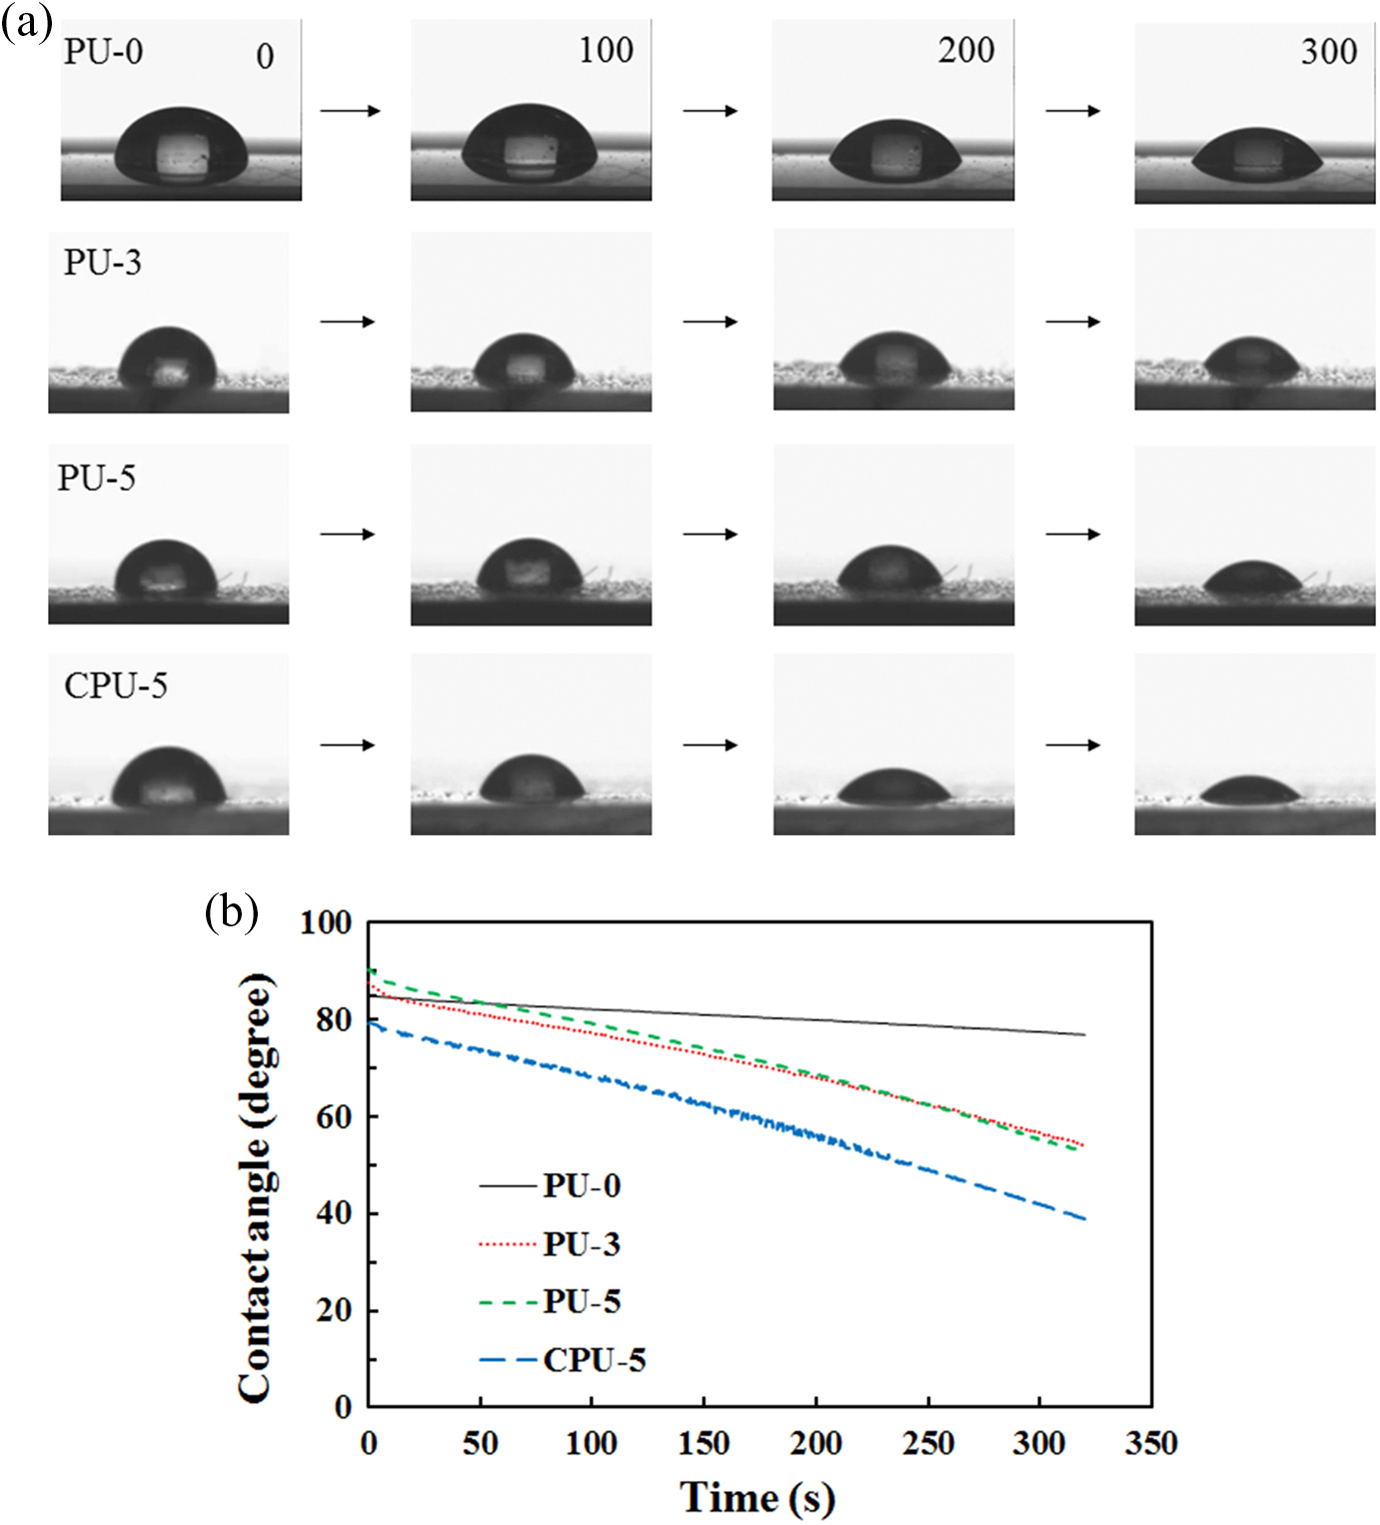
(a) Photographs showing changes in water drop shape on PU-0, PU-3, PU-5, and CPU-5 (the number indicates the elapsed time) and (b) contact angle profiles of PU-0, PU-3, PU-5, and CPU-5. PU: polyurethane.
IR and thermal analysis
The IR spectra exhibited peaks assigned to C–H bending at 1531 cm−1, aromatic C–C ring stretching at 1594 and 1411 cm−1, O–H bending at 1363 cm−1, C–N stretching at 1309 cm−1, and C–O stretching at 1218 cm−1 (Figure 6(a)). These peaks were observed for the PU and CPU series. The broad O–H stretching band of the CA carboxyl group from 2500 to 3500 cm−1 could be observed for PU-5 and CPU-5 due to the high CA content (Figure 6(b)). The free isocyanate peak at approximately 2350 cm−1 completely disappeared, suggesting that the grafting of CA onto PU was complete. The C=O stretching peaks at approximately 1700 and 1730 cm−1 were affected by the incorporation of CA and were used to analyze the intermolecular interactions, such as hydrogen bonding and dipole–dipole interactions, between the hard segments. The bonded carbonyl band (1700 cm−1) appeared at a lower wave number than the free carbonyl group band (1729 cm−1). 25,26 The relative intensities of the bonded and free carbonyl stretching vibrations were used to compare the degree of phase separation (DPS) among the different series of polymers, which indicated the change in the molecular interactions between the hard segments. The DPS was calculated using the equation DPS = A 1700/(A 1730 + A 1700), where A 1700 and A 1730 are the absorbances at 1700 and 1730 cm−1, respectively. The DPS of the PU and CPU series decreased from 56.5% for PU-0 to 51.7% for PU-3, 51.3% for PU-5, and 52.4% for CPU-5. The DPS results suggested that the molecular interactions between carbonyl groups were strongly affected by the CA.
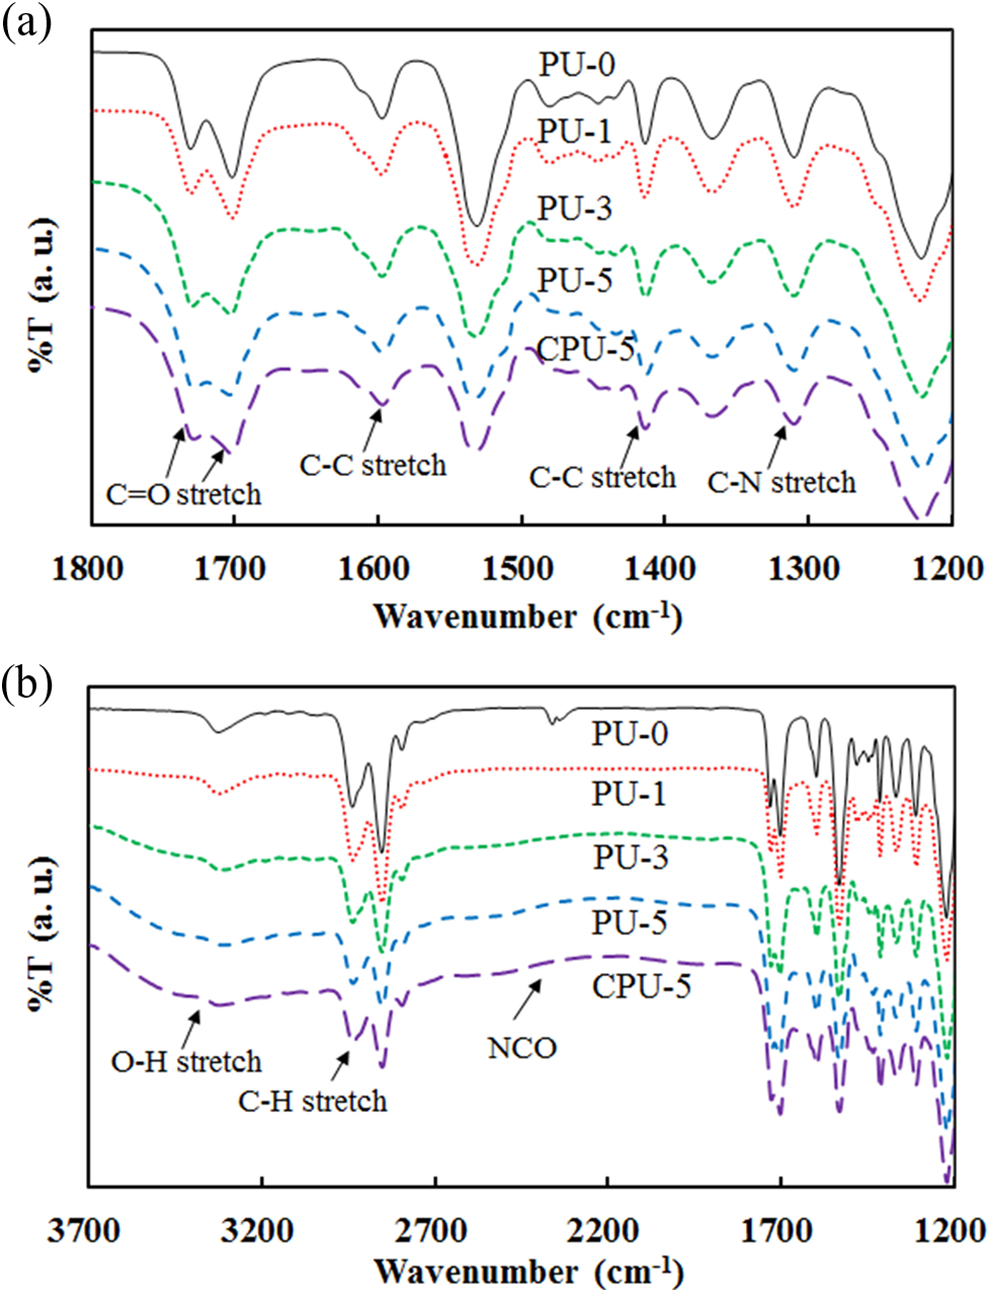
IR spectra of PU and CPU series in (a) narrow range and (b) wide range. IR: infra red; PU: polyurethane.
The soft segment T m of the PU and CPU series was measured by DSC. The soft segment melting peak was observed between 18°C and 22°C during the second heating scan (Figure 7). The T m and ΔH m of soft segment melting during the heating scan are listed in Table 2. The T m did not change appreciably due to the incorporation of CA into the PU and CPU series. For example, the T m only changed from 19.3°C for PU-0 to 19.6°C for PU-3, 21.8°C for PU-5, and 19.8°C for CPU-5. The ΔH m values for the PU and CPU series increased as the CA content increased compared with that of PU-0. The value of ΔH m changed from 22.3 J g−1 for PU-0 to 26.2 J g−1 for PU-3, 33.1 J g−1 for PU-5, and 32.4 J g−1 for CPU-5. The carboxyl groups of CA, whether grafted onto PU or not, could have hindered the soft segment melting of PU chains by electrostatic and steric interactions and increased the ΔH m. Therefore, the CA content had a significant effect on the soft segment melting of PU.
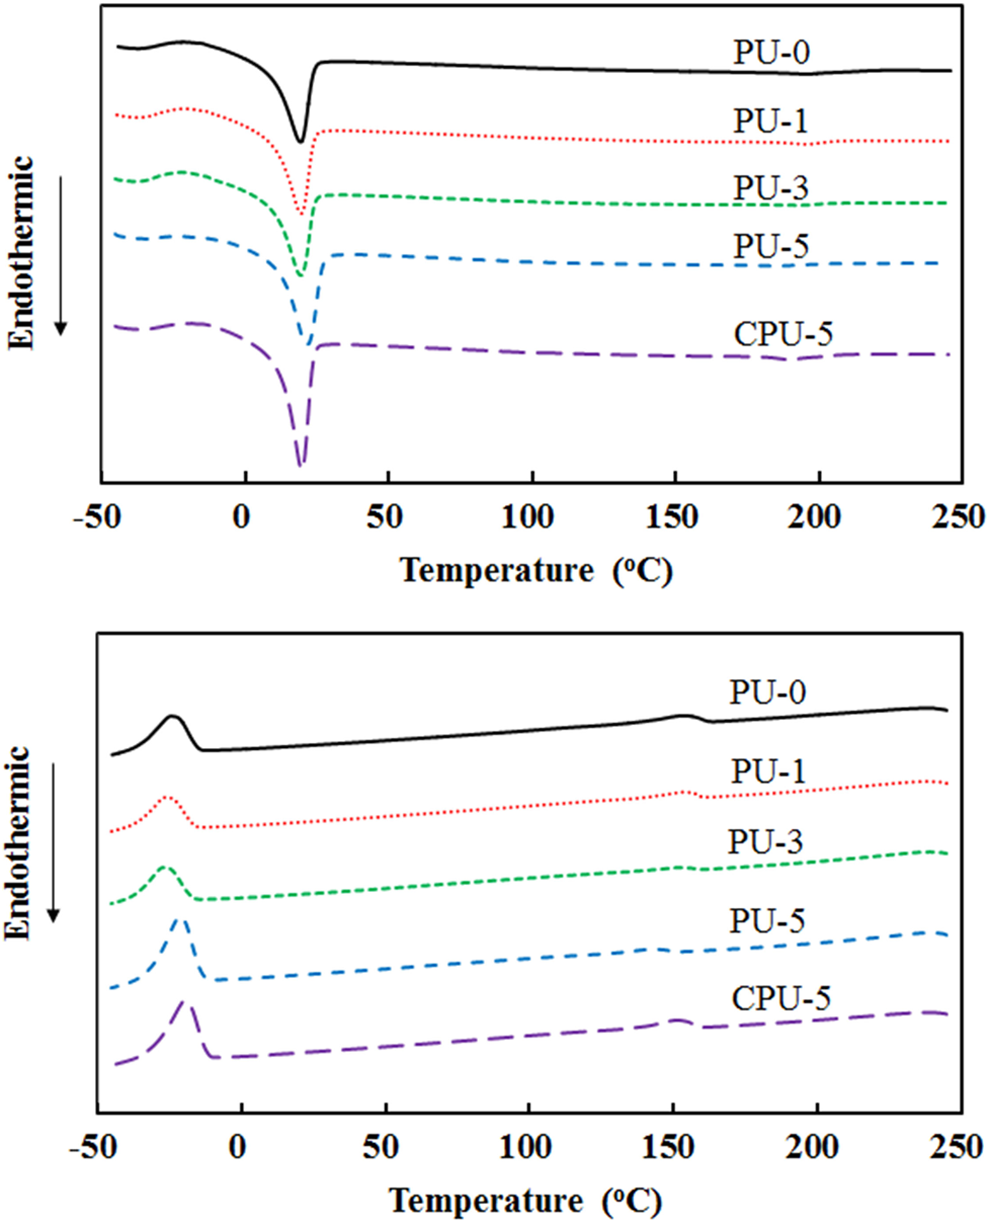
(a) Heating DSC thermograms and (b) cooling thermograms of PU and CPU series. DSC: differential scanning calorimeter; PU: polyurethane.
Comparison of soft segment thermal properties.
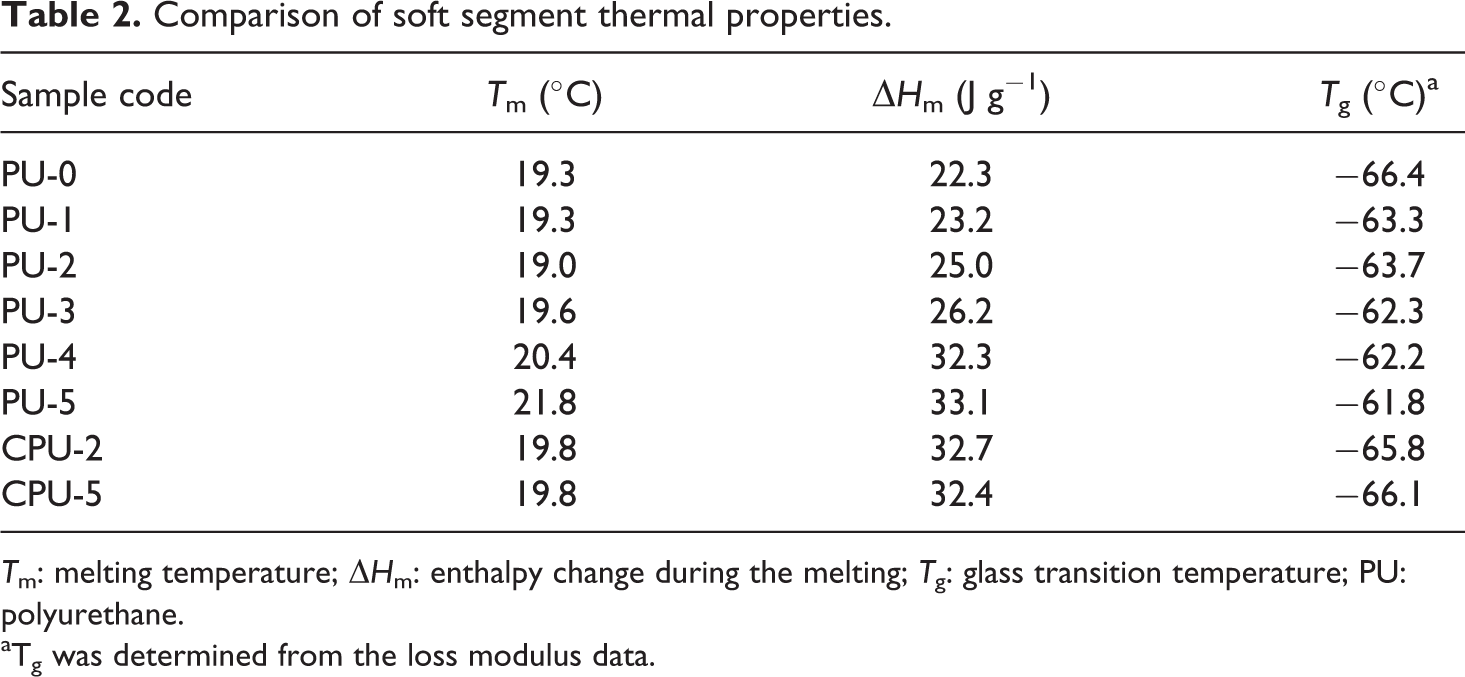
T m: melting temperature; ΔH m: enthalpy change during the melting; T g: glass transition temperature; PU: polyurethane.
aTg was determined from the loss modulus data.
The thermal decomposition of PU-3, PU-5, and CPU-5 was compared with that of PU-0 using thermogravimetric analysis (TGA) (Figure 8). The initial decomposition starting at approximately 280°C corresponding to the decarboxylation of the carbamate bond and the CA of PUs and the second decomposition from approximately 400°C due to the thermal decomposition of hydrocarbons of PU were observed for the all of the PUs. However, PU-0 showed a slower decarboxylation than those of PU-3, PU-5, and CPU-5 due to the absence of CA. Therefore, the difference observed between PU series and PU-0 in the TG thermograms indicated the presence of CA. The glass transition temperature (T g) of the soft segments was measured by DMA, which involved monitoring the storage and loss moduli between −150°C and 100°C (Figure 9). A rapid decrease in the storage modulus and the appearance of a loss modulus peak, which were indicative of the soft segment glass transition, were observed at approximately −65°C. The T g data presented in Table 2 are based on the loss modulus peaks. The T g increased as the CA content increased in the PU series, but the T g did not change in the CPU series. The T g changed from −66.4°C for PU-0 to −62.3°C for PU-3, −61.8°C for PU-5, and −66.1°C for CPU-5. The crystallization peaks of PU series at approximately −25°C in Figure 9(a) completely disappeared as the CA content increased, whereas CPU-5 did not exhibit such a decrease. The crystallization peak results indicated that the grafted CA had a significant effect on PU chain alignment. The T g results suggested that the grafted CA has a significant effect on PU chain rotation and alignment.
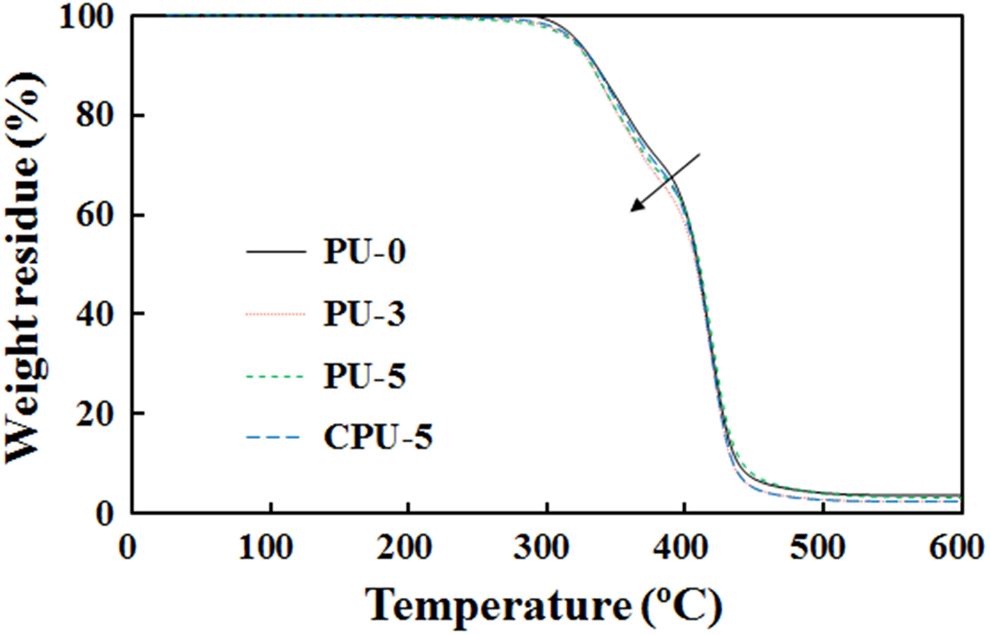
Comparison of the TGA thermograms of PU-0 and PU-5. TGA: thermogravimetric analysis; PU: polyurethane.
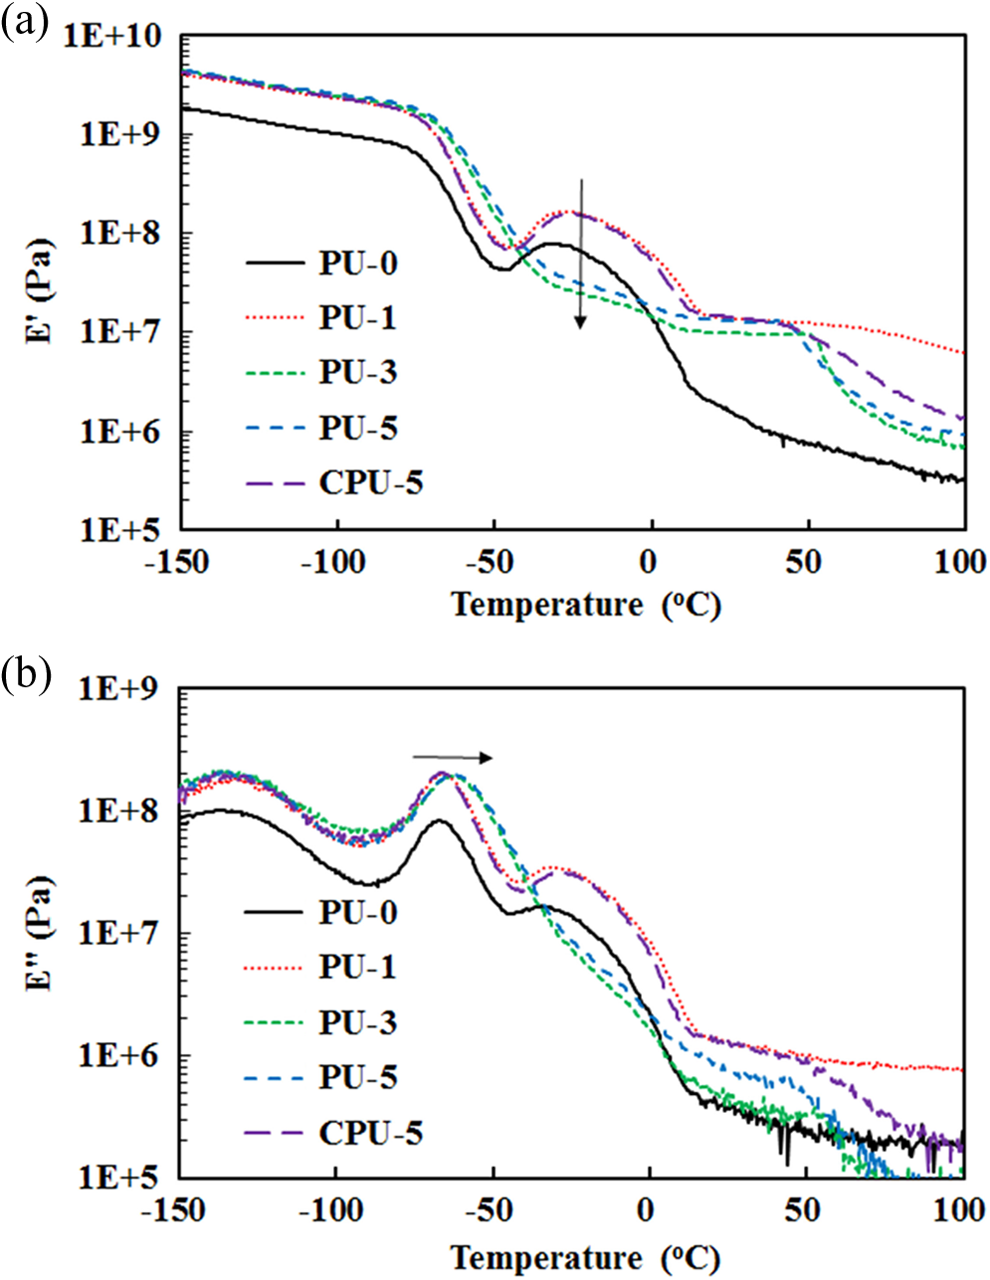
(a) Storage moduli (E′) and (b) loss moduli (E′′) of PU and CPU series. PU: polyurethane.
Tensile and shape memory properties
As the CA content increased, the maximum tensile stress of the PU series significantly increased compared with that of the CPU series. However, the maximum tensile stress of the PU series slowly decreased as the CA content further increased (Figure 10(a)). For example, the maximum tensile stress increased from 24.6 MPa for PU-0 to 55.9 MPa for PU-1, 49.4 MPa for PU-3, and 41.1 MPa for PU-5. However, the maximum tensile stress of the CPU series was relatively low (34.5 MPa for CPU-2 and 29.5 MPa for CPU-5). The increase in the maximum stress for the PU series was due to the cross-linking via MDI-3 (see Figure 1(c)), whereas the CPU series did not form the similar cross-linking, resulting in the decrease in tensile stress. The maximum tensile stresses of the PU series were comparable to those of PUs prepared by other cross-linking methods. The PEG cross-linked PU exhibited a maximum stress of 56 MPa, 33 and the PDMS cross-linked PU showed a maximum stress of 53 MPa. 25 With an increase in the CA content, the breaking strain slowly decreased for the PU series and remained the same for the CPU series. The breaking strain changed from 1958% for PU-0 to 1348% for PU-3, 1160% for PU-5, and 2184% for CPU-5 (Figure 10(b)). Thus, the breaking strain was not significantly affected by the grafted CA. The tensile test results revealed that the grafting of CA onto PU contributed to the enhanced tensile strength of PU without a significant decrease in strain.
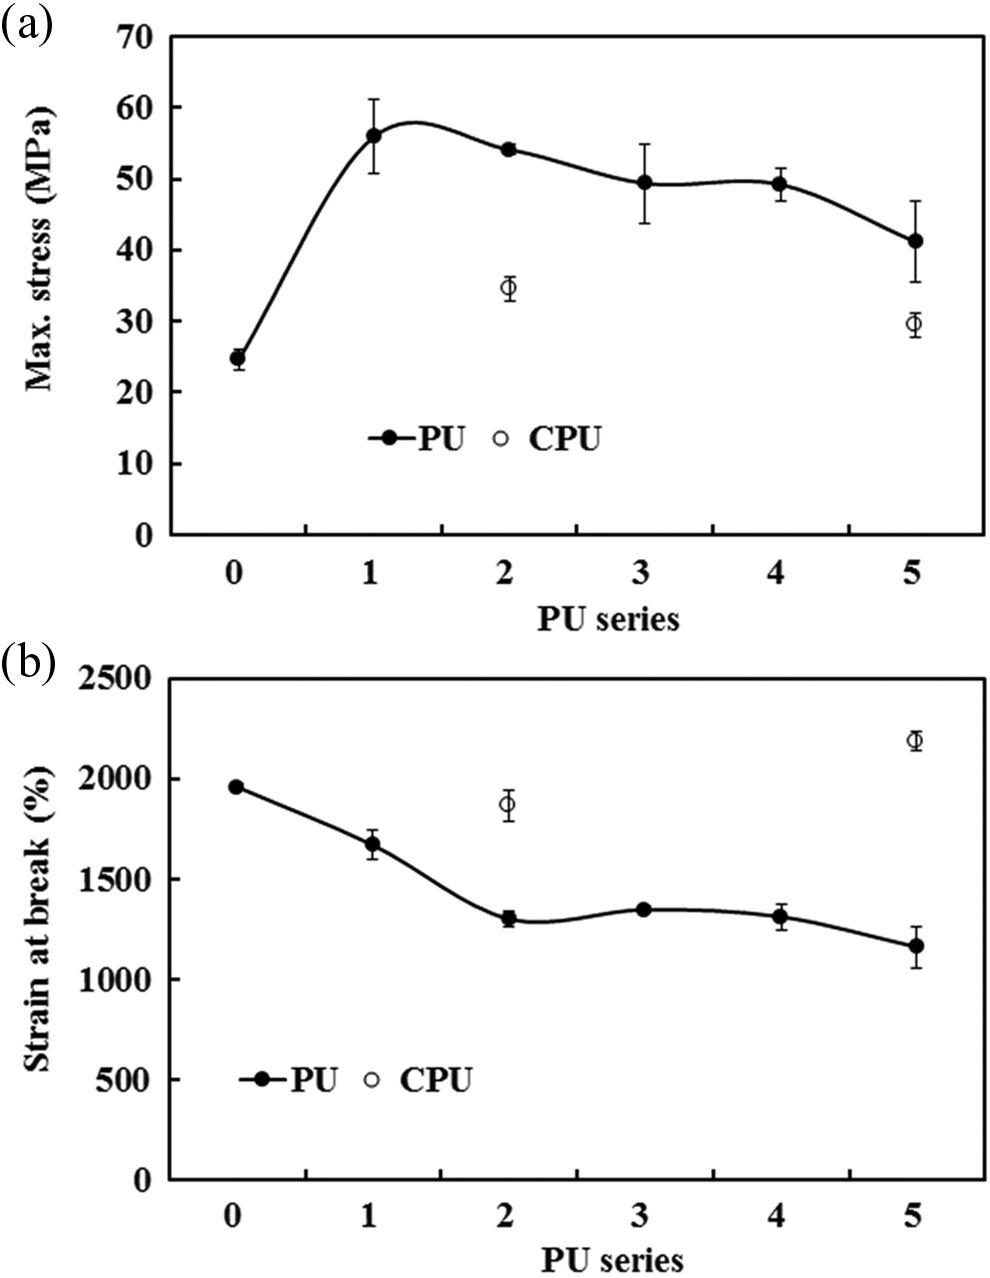
Profiles of (a) maximum stress and (b) strain at break for the PU and CPU series. PU: polyurethane.
Cyclic shape memory tests were conducted repeatedly between −25°C and 45°C. The soft segment T m was used as the reference temperature for the shape memory tests because the T m was close to room temperature, and shape recovery at room temperature is useful in practice. 34,35 The shape recovery of the PU series did not decrease as the test cycle was repeated and was better as the CA content increased (Table 3). For example, the shape recoveries of PU-0, PU-3, and PU-5 changed from 86%, 95%, and 93%, respectively, for the first test cycle to 83%, 93%, and 92%, respectively, for the fourth test cycle. The CPU series also exhibited a high and reproducible shape recovery over four repeated tests. Therefore, the test samples of the PU series did not lose their ability to recover their shape or their recovery efficiency after repeated stretching and shrinking cycles. The shape retention of the PU series also did not significantly decrease as the CA content increased and remained similar as the test cycle was repeated. For example, the shape retentions of PU-0, PU-3, and PU-5 changed from 91%, 83%, and 90%, respectively, for the first test cycle to 94%, 82%, and 85%, respectively, for the fourth test cycle. The shape retention of the CPU series also showed reproducible results after the four repeated tests. Therefore, the shape recovery and shape retention of the PU series were not significantly affected by the CA grafting.
Shape memory properties.
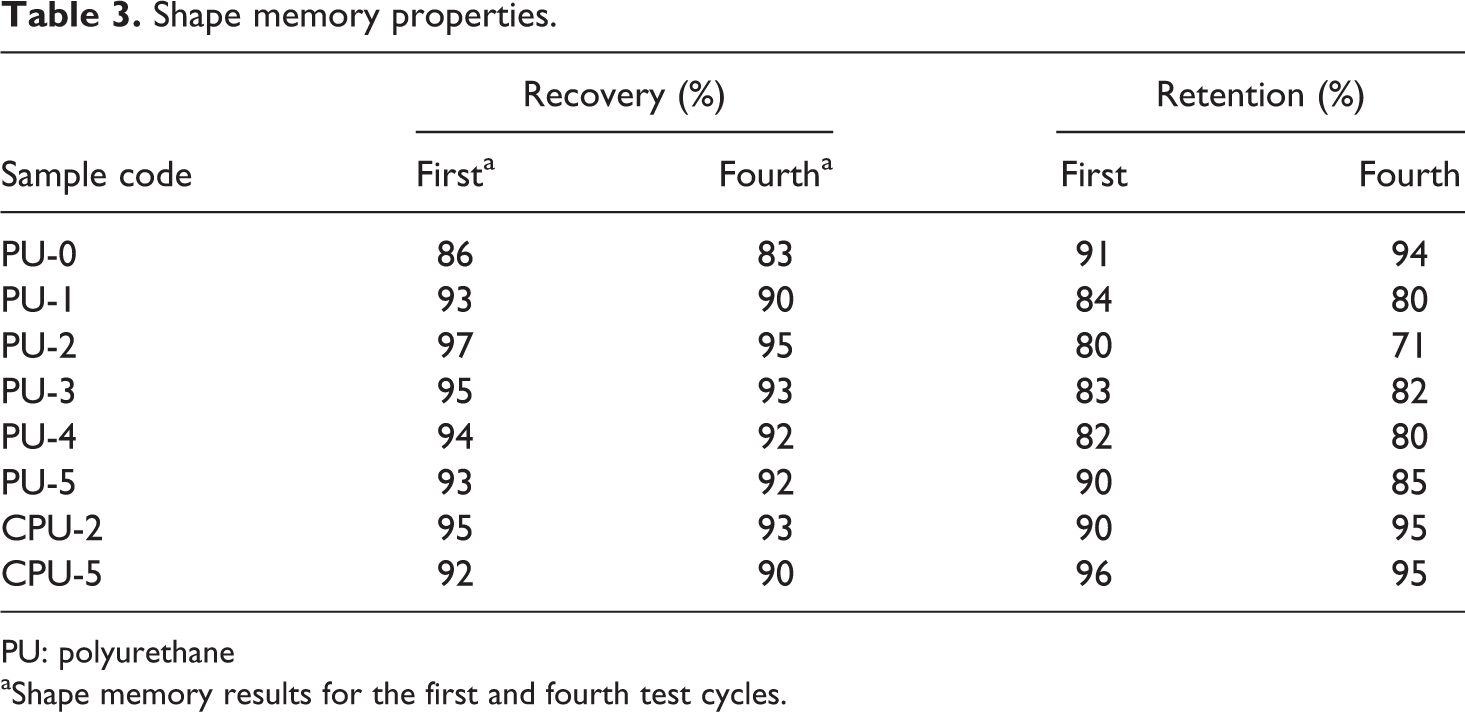
PU: polyurethane
aShape memory results for the first and fourth test cycles.
Low-temperature flexibility and WVP
The selected PU samples (PU-3, PU-5, and CPU-5) were compared with PU-0 in terms of their low-temperature flexibilities from −35°C because the electrostatic repulsion between the grafted CAs, as shown in Figure 1(d), could have a significant effect on the low-temperature flexibility (Figure 11). Twisted spiral samples were bound and stored in a temperature-controlled chamber for 3 h and allowed to regain their original shapes while the surrounding temperature was raised at a rate of 10°C min−1. The low-temperature flexibilities differed from the beginning temperature (−35°C) between different samples. PU-3 and PU-5 partially untangled even at −35°C and fully recovered to the original shape at 0°C, whereas PU-0 required heating above 17°C to achieve the same degree of recovery. However, CPU-5 did not exhibit the low-temperature flexibility as remarkably as PU-3 and PU-5, which suggested that the free CA did not improve the low-temperature flexibility compared with the grafted CA. The low-temperature flexibility of PU-3 and PU-5 is comparable to that of the PUs grafted with rigid and bulky side groups, 36 suggesting that the grafted triple carboxyl groups of CA effectively improved the low temperature flexibility of PU. Therefore, it was demonstrated that the grafted CA in the PU series remarkably improved the low-temperature flexibility of PUs, while the free CA in the CPU series did not contribute to its improvement of low-temperature flexibility.
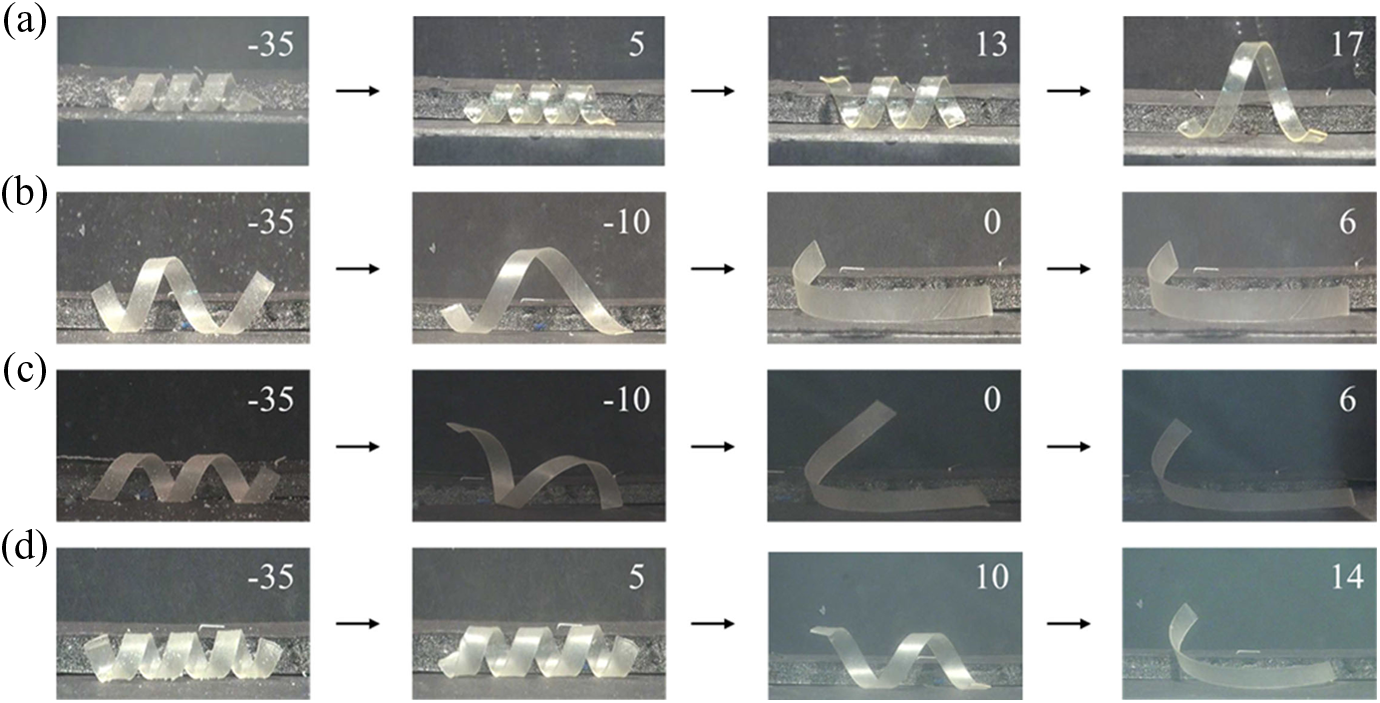
Low-temperature flexibility test of (a) PU-0, (b) PU-3, (c) PU-5, and (d) CPU-5 (the numbers represent the test temperature). PU: polyurethane.
The WVPs of selected samples (PU-1, PU-3, PU-5, and CPU-5) were compared with that of PU-0 at 60°C (Figure 12). The WVP test temperature was increased to 60°C because the water vapor pressure at room temperature was not sufficiently high to allow water vapor to pass through the PU membranes. The WVPs of the PU series (PU-1, PU-3, and PU-5) were relatively higher than the WVP of PU-0 at the onset of testing and remained steady throughout test period. In contrast, the WVPs of CPU-5 rapidly decreased from the beginning and reached the same rate as the WVP of PU-0. The difference in the WVPs observed at the onset of testing was due to the better water compatibility and the faster permeation of water vapor for the CPU-5 membrane, as indicated by the contact angle results. The WVPs of the PU series were higher than that of PU-0 because the grafted CA in the former increased the water compatibility and enhanced the water vapor permeation through the PU membrane. Overall, the grafting of CA to PU successfully improved the tensile strength, shape memory, low-temperature flexibility, and WVP of the PUs. The CA grafting to PU could improve the water compatibility of PU and resolve the platelet adhesion problems of the ordinary PUs, thus presenting potential applications in medical devices and implants.
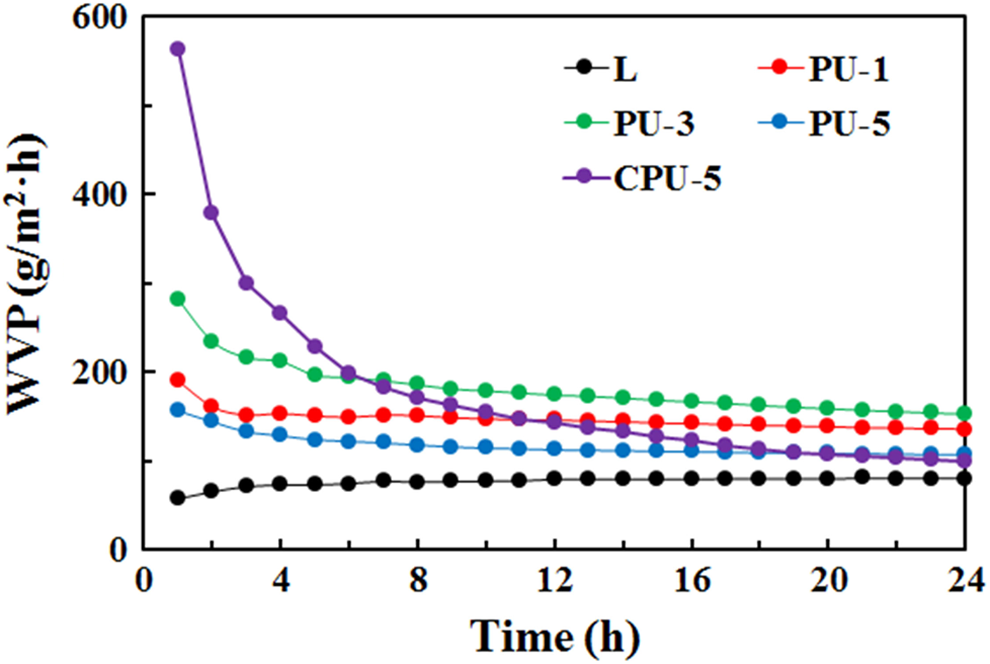
Water vapor permeability of the PU and CPU series. PU: polyurethane.
Conclusion
A PU series containing grafted CA and a control CPU series containing free CA were compared regarding their spectroscopic, thermal, tensile, shape memory, low-temperature flexibility, and WVP properties. The cross-link density of the PU series slowly increased with increasing CA content due to the cross-linking via MDI. The T m was not considerably altered by the CA content for the PU and CPU series. However, the T g of the PU series increased as the grafted CA content increased. With an increase in the CA content, the tensile strength of the PU series sharply increased, whereas that of the CPU series did not exhibit a sharp increase. With the increase in CA content, the breaking strain of the PU series decreased, whereas that of the CPU series remained similar. The cyclic shape memory tests of the PU series demonstrated that shape recovery and shape retention remained high after four repeated tests. The PU series containing the grafted CA demonstrated excellent low-temperature flexibility compared with PU-0. The PU series also exhibited a higher WVP than PU-0 due to the better water compatibility. Therefore, the grafting of CA onto PU improved the tensile stress, shape recovery, low-temperature flexibility, and WVP relative to those of the unmodified PU.
Footnotes
Declaration of conflicting interests
The author(s) declared no potential conflicts of interest with respect to the research, authorship, and/or publication of this article.
Funding
The author(s) disclosed receipt of the following financial support for the research, authorship, and/or publication of this article: This study was supported by the R&D Center for Valuable Recycling (Global-Top Environmental Technology Development Program) funded by the Ministry of Environment (project no.: GT-11-C-01-040-0).