
Abstract
This study determines the applicability of nanofillers (silica, boron nitride, and zinc oxide) in linear low-density polyethylene (LLDPE)/silicone rubber (SR) insulation compounds. Design of experiment is adopted to model the relationship between the properties (permittivity, loss tangent, dielectric strength, and volume resistivity) and factors (SR content, type of nanofiller, and nanofiller loading) for performance optimization. It is observed that SR content and type of nanofiller significantly influence the electrical properties of LLDPE/SR nanocomposites. Nanofiller loading, however, causes a small variation in the properties of the nanocomposites except for dielectric strength. From the optimization, it is found that the optimum formulation composition is 10 wt% of SR and 2 vol% of nanoboron nitride.
Introduction
Polymeric high-voltage (HV) insulators have rapidly developed since several decades ago and have replaced traditional porcelain and glass insulators. The superior properties of polymers such as light weight, high mechanical strength to weight ratio, high electrical properties (low dielectric permittivity, good withstand voltage, high surface and volume resistivity, etc.), good performance in polluted environment thus maintenance free and easy installation have made them increasingly been used in electric power utilities. 1 In the recent decades, thermoplastic elastomer (TPE), which is a unique type of polymers or polymer blends, has emerged as a promising material for electrical insulation. 2,3 TPE offers synergistic combination properties of thermoplastic and rubber with the simple processability of thermoplastics. Due to comparable or better performance of TPE insulator than those of well-established polymeric insulators such as silicone rubber (SR), ethylene propylene diene monomer (EPDM), SR/EPDM blend, ethylene propylene rubber, and cross-linked polyethylene insulators, TPE has received a great acceptance as the third-generation polymeric materials to be used in HV cables. 3
Polyethylene (PE)/SR blend is one type of TPE blends that has been exhaustively studied due to the potential of SR and PE as electrical insulating materials. SR is a specialty rubber for cable applications at high and low temperatures. 4 SR is suitable for use in moist conditions and in highly polluted atmosphere because of its superior properties for outdoor insulation. Several of these properties include long-term hydrophobicity and capability to recover hydrophobicity. 5 However, the application of SR is limited by its high cost and low mechanical strength. Therefore, blending SR with cheaper polyolefins such as PE is an attractive way to develop TPE blend with better mechanical strength apart from reducing its cost. In addition, PE is a good insulator for electric power cable at low and high transmission voltages due to its excellent electrical properties such as very low electric conductivity, low dielectric loss, and permittivity at high frequencies and high dielectric strength. 6 These advantages have made PE-based TPE blends find potential application in HV insulation.
Studies related to PE/SR TPE blends were found published since many years ago. Jana et al. conducted a series of studies on the low-density polyethylene/polydimethylsiloxane (LDPE/PDMS)-based TPEs investigating the effect of dicumyl peroxide cross-linking 7 and attempted to compatibilize the TPE blend using various copolymers of ethylene such as ethylene methyl acrylate, ethylene vinyl acetate, ethylene acrylic acid, and Lotek ionomer. 8 Jalali-arani et al. 9 made a comparison between three different types of TPEs based on LDPE, linear low-density polyethylene (LLDPE) and high-density polyethylene (HDPE)/SR blends and concluded that LLDPE was more reactive compared to LDPE and HDPE, that it resulted in both grafting and cross-linking with SR chains. Later, they prepared LLDPE/SR-based TPEs by thermomechanical reactive mixing where they focused more on the effects of mixing parameters such as temperature, shear rate, mixing time, and sequence of feeding the ingredients on the yield and rate of interfacial reaction as well as the rheology of the TPE blends. 10 Sureshkumar et al. 11 and Suresh et al. 12 investigated the influence of processing parameters on the mechanical properties of LLDPE/SR and attempted to optimize the parameters by using Taguchi methodology and ANFIS-based model, respectively. Giri and coworkers 6,13 discussed on the effect of electron beam radiation and in situ compatibilization of LLDPE/PDMS in two different studies. Both studies reported on various thermal and electrical characteristics as well as mechanical performance of the TPE blends.
Despite the increasing publications on PE/SR-based TPE blends over the years, very little effort has been so far directed at exploring the possibilities of incorporating nanofillers in these TPEs. Hence, in this article, attempts have been made to incorporate nanofillers into the LLDPE/SR insulating compound. Adding nanofillers into polymers produces nanodielectric that can have a great improvement in both electrical and mechanical properties. These improvements have received attention in electrical insulation prospects for many years. Literature studies have shown that nanodielectric demonstrated an improved breakdown strength or voltage endurance due to the presence of enormously large sectional area of the interface between the nanoparticles and the polymer matrix. 14,15 Thus, nanodielectric can last longer compared to conventional microcomposites, and this reduces the need for maintenance and extend the life of HV equipment. Furthermore, with the improved performance of nanodielectrics, they promised efficient application at higher electric fields and this greatly reduces cost and saves energy.
In the present study, the effects of nanofiller-filled LLDPE/SR were investigated. Three metal oxide nanofillers silica (Si), boron nitride (BN), and zinc oxide (Zn) with natural insulation capacity were selected and used in this study. An attempt to optimize the formulation compositions, such as blend ratio, nanofiller type, and nanofiller loading, for the preparation of LLDPE/SR nanocomposites was made in this study. A three-level factorial design was used, and the responses were characterized in terms of electrical properties (permittivity, loss tangent, dielectric breakdown strength (DBS), and volume resistivity). These responses were chosen because they are the important criteria that need to be considered in selecting insulation materials. Morphological observations using scanning electron microscopy (SEM) and high-resolution transmission electron microscopy (HRTEM) were used to support the findings.
Experimental
Materials
Commercial-grade LLDPE (Titanex LF2021) with a melt index of 2.0 g/10 min and a density of 0.922 g/cm3 was supplied by Titan Petchem (M) Sdn (Pasir Gudang, Malaysia). Bhd. SR-grade Vinyl Methyl Quality (VMQ) with a density of 1.2 g/cm3 and a vinyl content of 0.03% to 1.0% was supplied by Zibo Na Fluorochem Co., Ltd (Zhangdian, China). The fillers used in this study are nanosilica (Si) and nanozinc oxide (Zn), which were supplied by Sigma-Aldrich (Petaling Jaya, Malaysia), and nanoBN, which was supplied by Qinhuangdao Taiji Ring Nano-products Co., Ltd (Hebei, China). The average particle sizes of Si, BN, and Zn are 1, 36, and 92 nm, respectively. The surface of the nanofiller was not functionalized and used as purchased.
Design of experiment
The effect of three formulation parameters involved in preparing the nanocomposites was investigated by using design of experiment (DOE). The type of DOE utilized in this study was three-level factorial design from response surface methodology (RSM). With DOE, it is possible to simultaneously evaluate the influence of various factors on electrical properties, and the combination factors could be optimized to obtain nanocomposites with maximum performance as HV insulator. The three-level factorial design employed in this study required 27 experiments with SR content (A), nanofiller loading (B), and nanofiller type (C) as the independent variables. Coded values are generally used to represent the factor levels; −1, 0, and +1 correspond to the minimum, central point, and maximum levels of the factors, respectively. The coefficients can be easily interpreted by using the coded values. Table 1 shows the independent variables along with their low, medium, and high levels.
Variables in three-level factorial design.
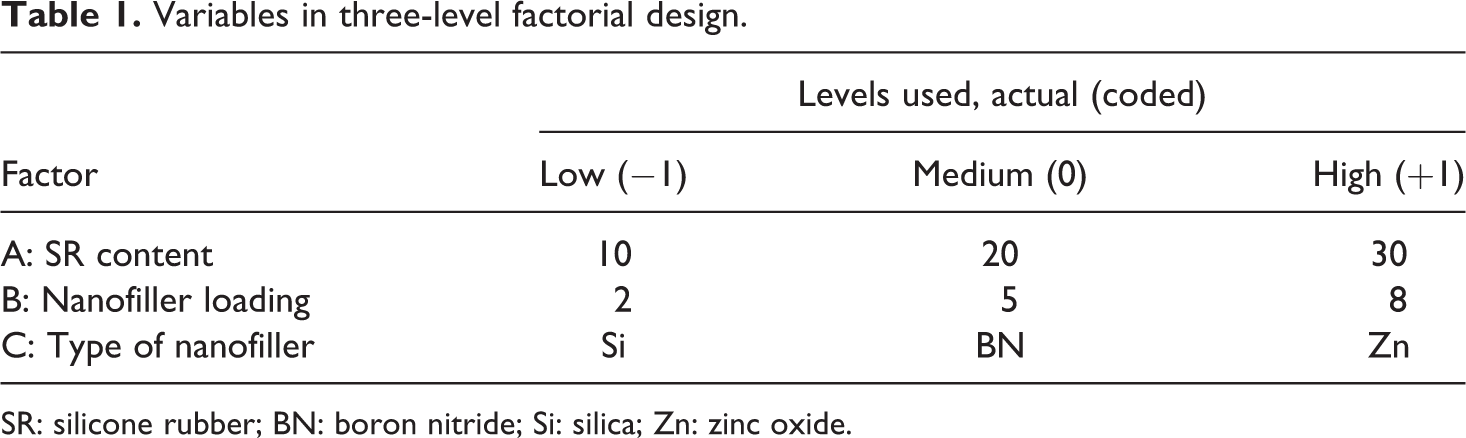
SR: silicone rubber; BN: boron nitride; Si: silica; Zn: zinc oxide.
The data obtained from various experimental techniques (responses) were fitted into mathematical models (equations) by nonlinear multiple regression analysis. To ensure a good model for each selected response, test for significance of the regression model and test for significance of individual model coefficients via R2 test and analysis of variance (ANOVA) were performed. Three-dimensional (3-D) response surfaces generated from the model equations were used to identify the effects of the test variables and the interactions between the variables toward the response. All the statistical and mathematical calculations were conducted by using Design-Expert 8.0.7.1v (Stat. Ease, Inc., Minneapolis, USA).
Sample preparation
The control samples (90/10, 80/20, and 70/30 LLDPE/SR) and LLDPE/SR nanocomposites were prepared through melt mixing in a Haake (Massachusetts, USA) internal mixer at 170°C and 50 r min−1. The compounding of LLDPE/SR nanocomposites was done according to formulations shown in Table 2. For the preparation of nanocomposites, a masterbatch of SR/nanofiller was initially prepared at 80°C for 8 min prior to blending with LLDPE at 170°C for 4 min. Finally, all samples were compression molded at 170°C in an electrically heated hot press.
Three-level factorial design experiments with responses (uncoded).
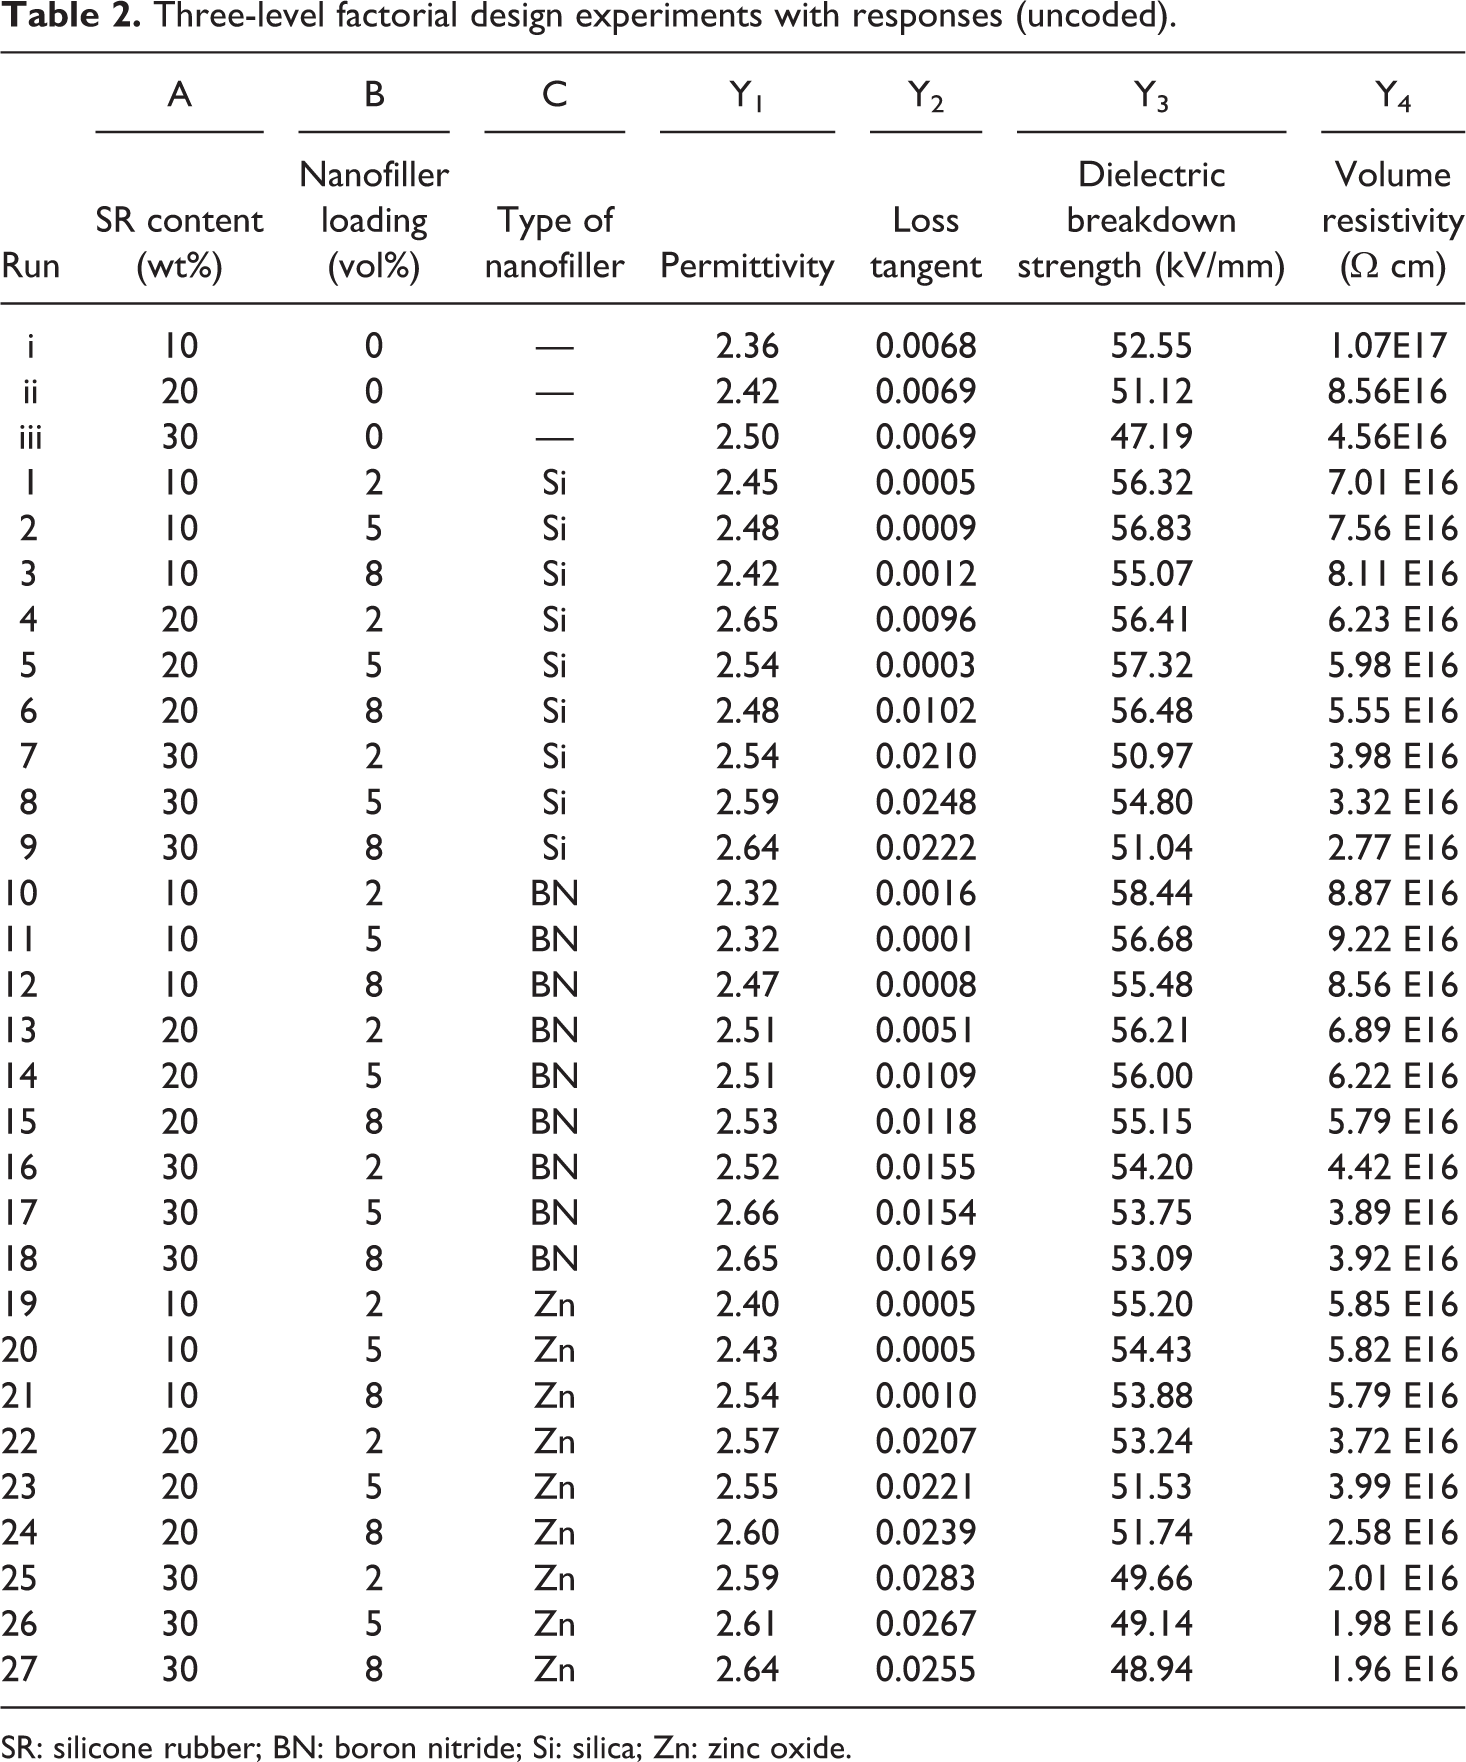
SR: silicone rubber; BN: boron nitride; Si: silica; Zn: zinc oxide.
Characterizations
The DBS of insulating materials is one of the key factors in HV applications. It measures the ability of insulating materials to withstand voltage up to failure. This parameter can be characterized by the rapid reduction in electrical resistance accompanied by physical breakdown, such as sparks jumping around or through the insulator. The DBS was measured as per IEC 60156 standard. The copper electrode faces were kept parallel and held exactly opposite to each other. Insulating oil was used as embedding medium for the measurement at room temperature. Each sample with a thickness of 1 mm was kept between two electrodes, and an incremental alternating current (AC) voltage of 1 kV/s was applied until electrical breakdown occurred. The DBS was determined by dividing the breakdown voltage by the thickness (mm) of the samples. An average of 10 readings was reported. The dielectric permittivity (ε′) and loss tangent (tan δ) of LLDPE/SR blends and LLDPE/SR nanocomposites were measured at 50 Hz by using an Agilent (California, USA) E4980A Precision LCR meter. The volume resistivity of the samples was measured at 25°C using a Hewlett-Packard (California, USA) High Resistance Meter (Model 4339A) coupled with a Hewlett-Packard (Model 16008B) resistivity cell. This measurement was conducted as specified in IEC 60093. Per formulation, three volumetric electrical resistivity measurements were performed. The morphologies of the nanocomposites were observed using a SEM system (Hitachi TM-3000 Tabletop, Schaumburg, USA) and an HRTEM system (FEI Tecnai G2 20 S-TWIN, Hillsboro, USA). For SEM observation, the molded samples were cryofractured in liquid nitrogen to avoid any possibility of phase deformation during the fracture process. The cross sections were then etched in toluene at 50°C for 1 h to extract the rubber phase out of the nanocomposite system. The surfaces were then sputtered with gold before SEM examination. The specimens for HRTEM analysis were prepared by microtoming 50 nm thick films from the nanocomposite samples with a cryomicrotome (RMC-Boeckeler, Arizona, USA).
Results and discussion
Analysis of the model
The complete design layout of the three-level factorial design (uncoded factors) for the 27 runs with the output responses is given in Table 2. Four responses, namely, permittivity (Y1), loss tangent (Y2), DBS (Y3), and volume resistivity (Y4), were measured for each nanocomposite.
Regression analysis was carried out to obtain the best-fit models to the experimental data. The regression analysis of the experimental data suggested that the relationship between the responses (properties) of the LLDPE/SR nanocomposites and the three factors was best fitted with three types of model, which are quadratic model: DBS; linear model: permittivity and volume resistivity; and 2FI model: loss tangent. For all the responses, the model equations describing this relationship in terms of coded factors were as follows:
Equations of permittivity (Y 1):


Equations of loss tangent (Y 2):


Equations of DBS (Y 3):


Equations of volume resistivity (Y 4):


Coefficients with one factor correspond to the effect of the particular factor, whereas those with two factors and second-order terms correspond to the interaction between two factors and the quadratic effect, respectively. The plus sign in front of the terms indicated synergistic effect, whereas negative sign indicated antagonistic effect. 16 The regression equations generated from the experimental data can be used to predict the properties of the nanocomposites at any particular content of SR as well as nanofiller loading.
Model adequacy checking
Model adequacy checking is an important part of data analysis procedure in RSM experimentations. To ensure how well that the regression models fit, several statistical tests such as R 2 test and ANOVA need to be performed. These tests are the most popular and convenient methods for examining the fitted model to ensure that the model provided an adequate approximation to the true system. 17
R 2 test
The R 2 value gives the correlation between the experimental response and the predicted response and should be high for a particular model to be significant. Adjusted R 2, which gives a similar correlation after ignoring the insignificant model terms, should have a good agreement with the predicted R 2 for the model to be fit. 18 Table 3 details the results from the R 2 test for all the responses. It can be observed that, the coefficient of correlation (R 2) for all responses were high, except for permittivity which showed R 2 < 0.8. The high R 2 indicated a high degree of correlation between the experimental and predicted responses. Only (1 − R2 ) × 100 of the total variation in the model was not accounted by the model. For example, the R 2 value for DBS was 0.9035. This indicated that 90.35% of the total variation in DBS was attributed to the independent variables studied. It also indicated that only 9.65% of the total variation was not explained by the model.
Results from R 2 test.
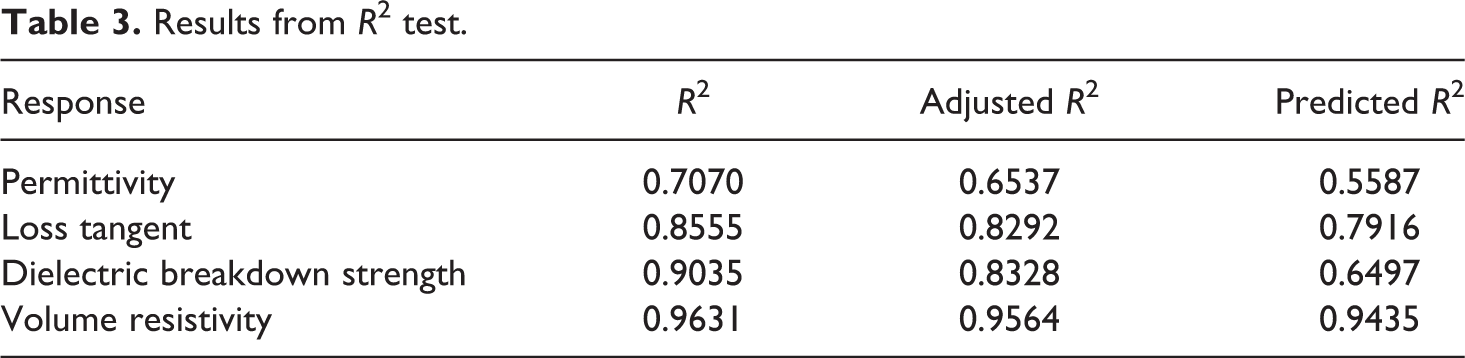
The closer the R 2 value to unity, the better the model will be as it will give predicted value which is closer to the actual value for the response. The relationship between the actual (experimental) and predicted values of each response was translated into a graph, as shown in Figure 1(a) to (d). The residuals for the prediction of all responses except permittivity were minimum because they lied close to the diagonal line. Thus, the regression equations generated in this experimental study can be used to predict the properties of LLDPE/SR nanocomposites with a fair degree of accuracy. The model also showed that the predicted R 2 value was in good agreement with the adjusted R 2 value (Table 3). However, in the case of permittivity, the low R 2 value and high residuals indicated that there were too many insignificant model terms.
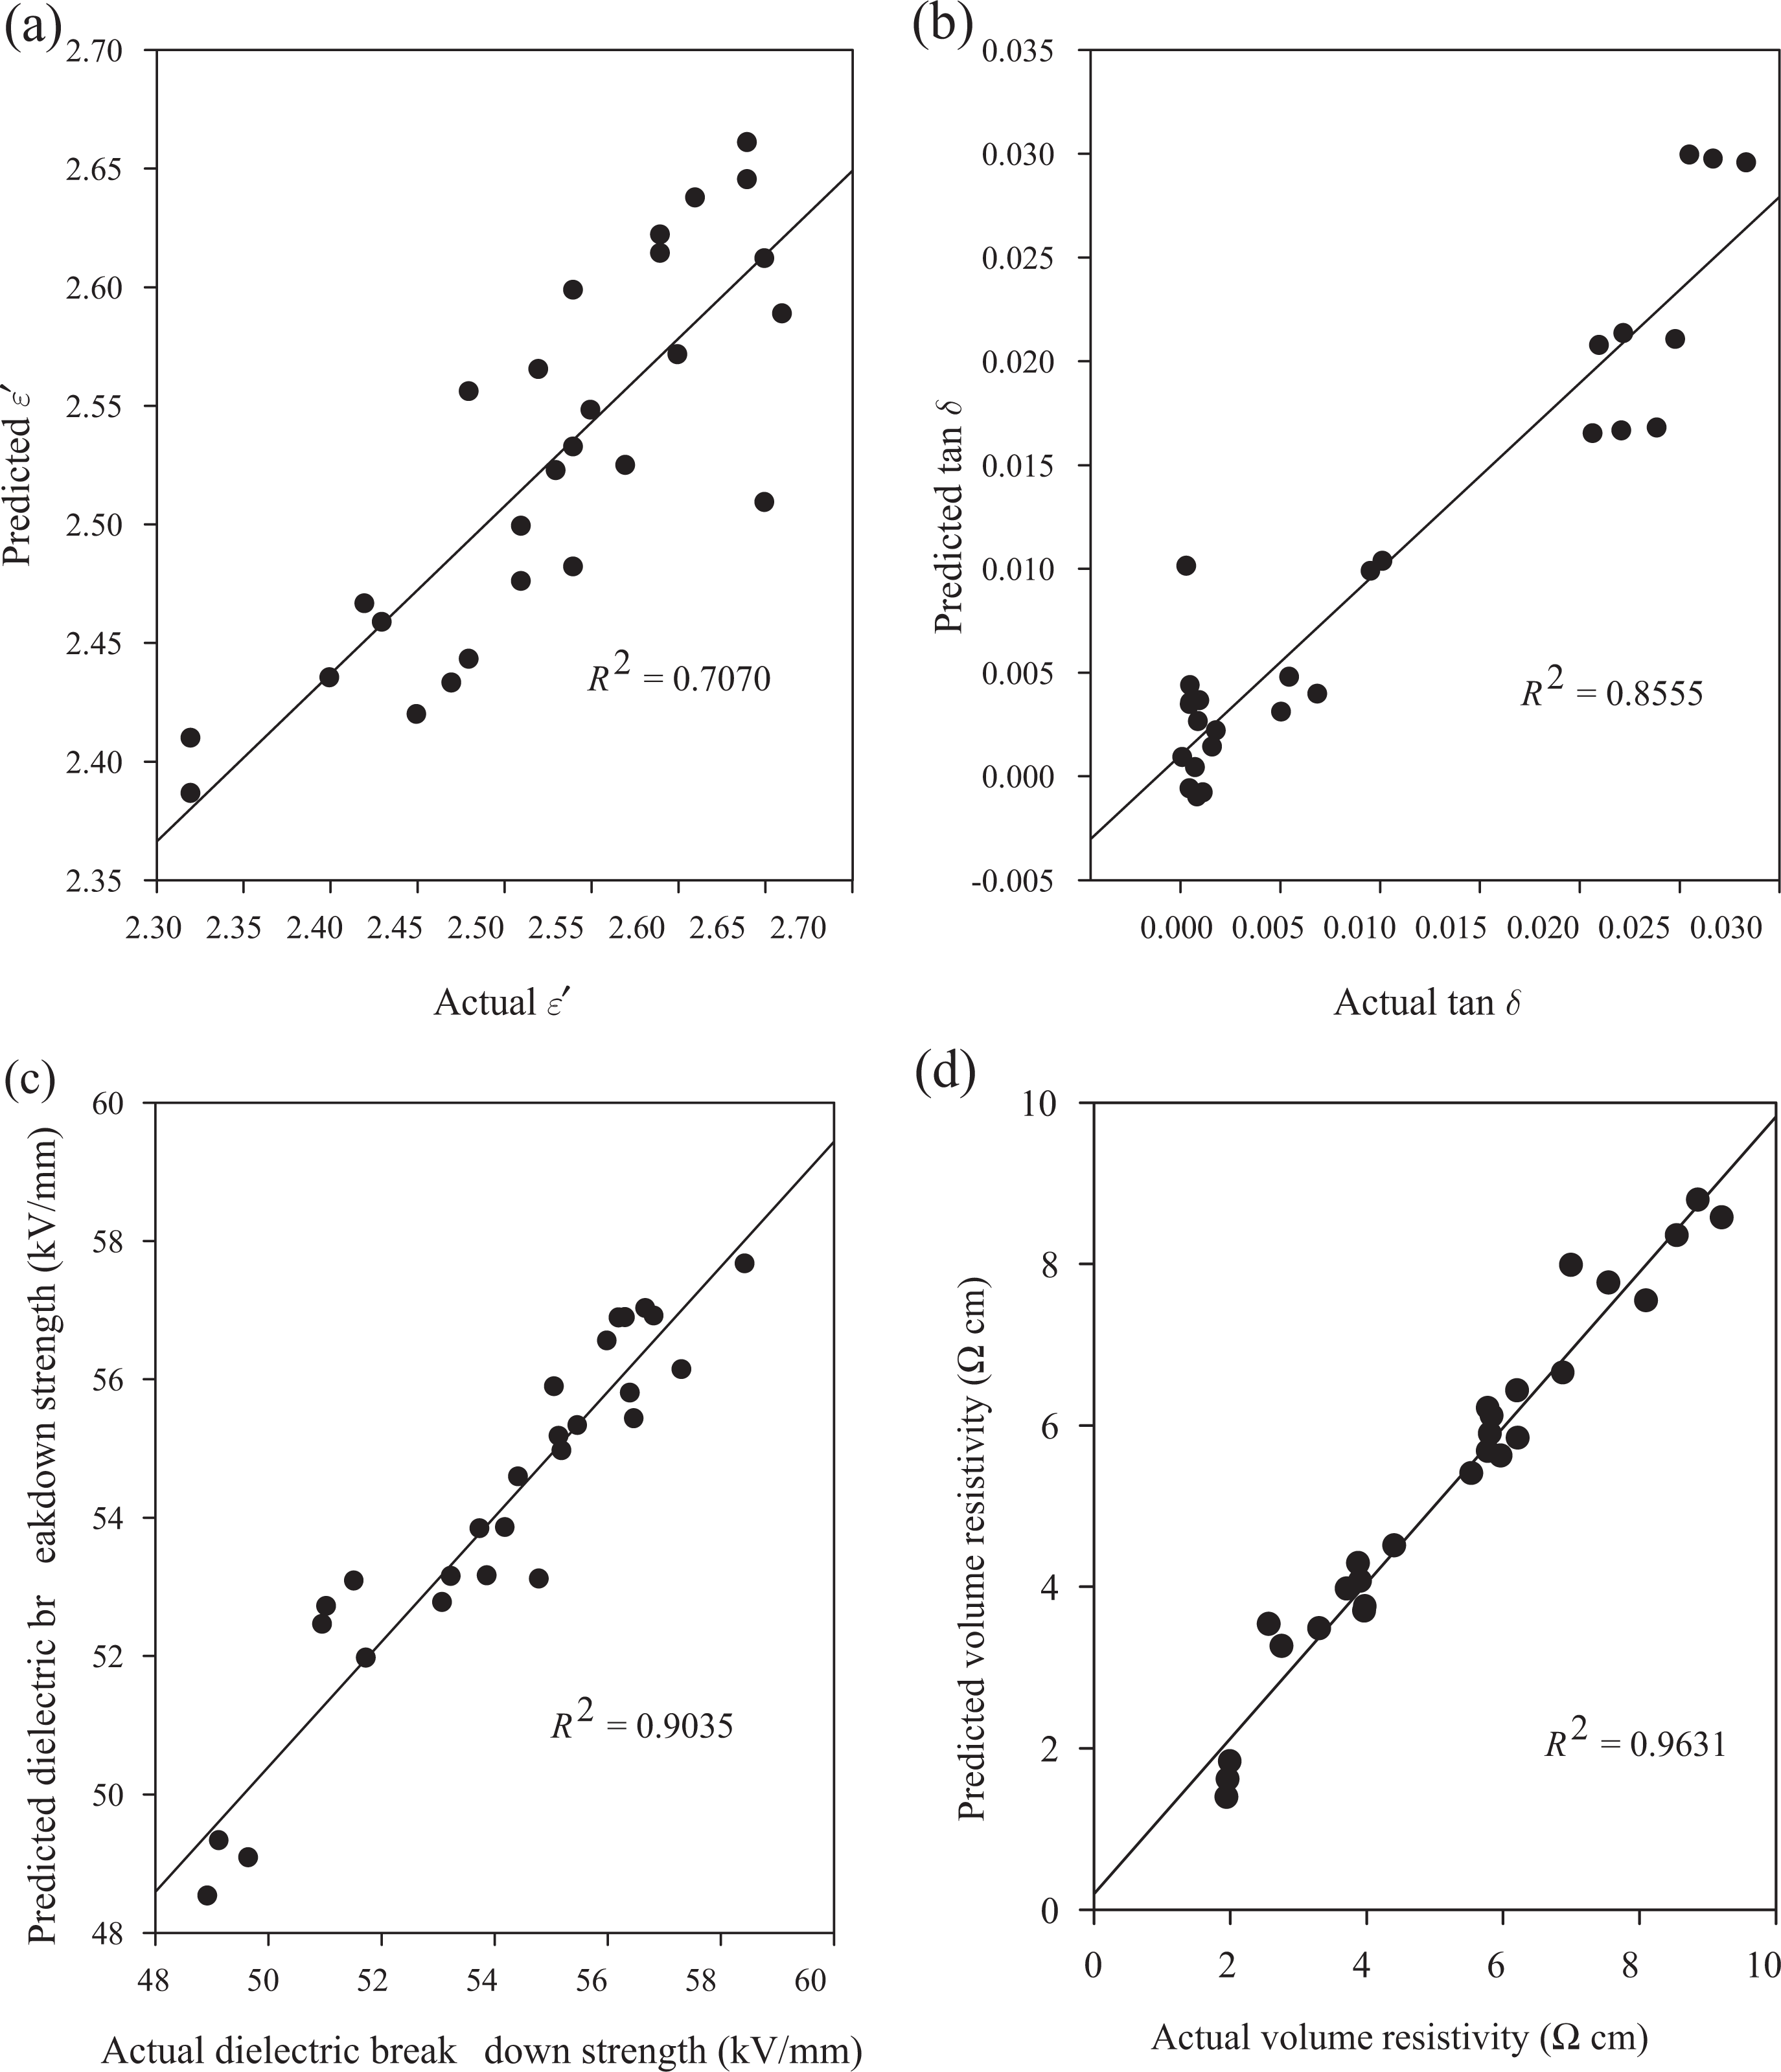
Predicted versus experimental for (a) permittivity, (b) loss tangent, (c) dielectric breakdown strength, and (d) volume resistivity.
Analysis of variance
ANOVA was further carried out to justify the significance of the factors and the adequacy of the models. ANOVA allows analyzing the influence of each independent variable on the total variance of the results. For each designed parameter, the ANOVA provides the degree of freedom (DF); the sum of square (SS); the mean square (MS), which was computed by dividing the SS by the DF (SS/DF); and the Fisher test (F). Both SS and MS were used to measure the percentage variation in every experiment run. The size of the variance of each experimental result was verified through the F-test. If the value of prob > F (p-value) is less than 0.05, the model terms are considered as significant. The low prob > F values indicate that the result is not random and the model terms have a significant effect on the response. Table 4 summarizes the F-test results from ANOVA for studying the most influential factor affecting the properties of the nanocomposites. The results showed that the regression models developed for all the investigated properties of the nanocomposites were significant. Furthermore, all the main factors and the quadratic relationship of SR contents were found to significantly influence the DBS of the nanocomposites. The results for permittivity showed that only the effect of SR content on the nanocomposites permittivity was significant. The rest of the factors would not influence much the permittivity. On the other hand, SR content and the type of nanofiller appeared as significant factors affecting the loss tangent and volume resistivity.
Summary of ANOVA results for various responses of LLDPE/SR nanocomposites.
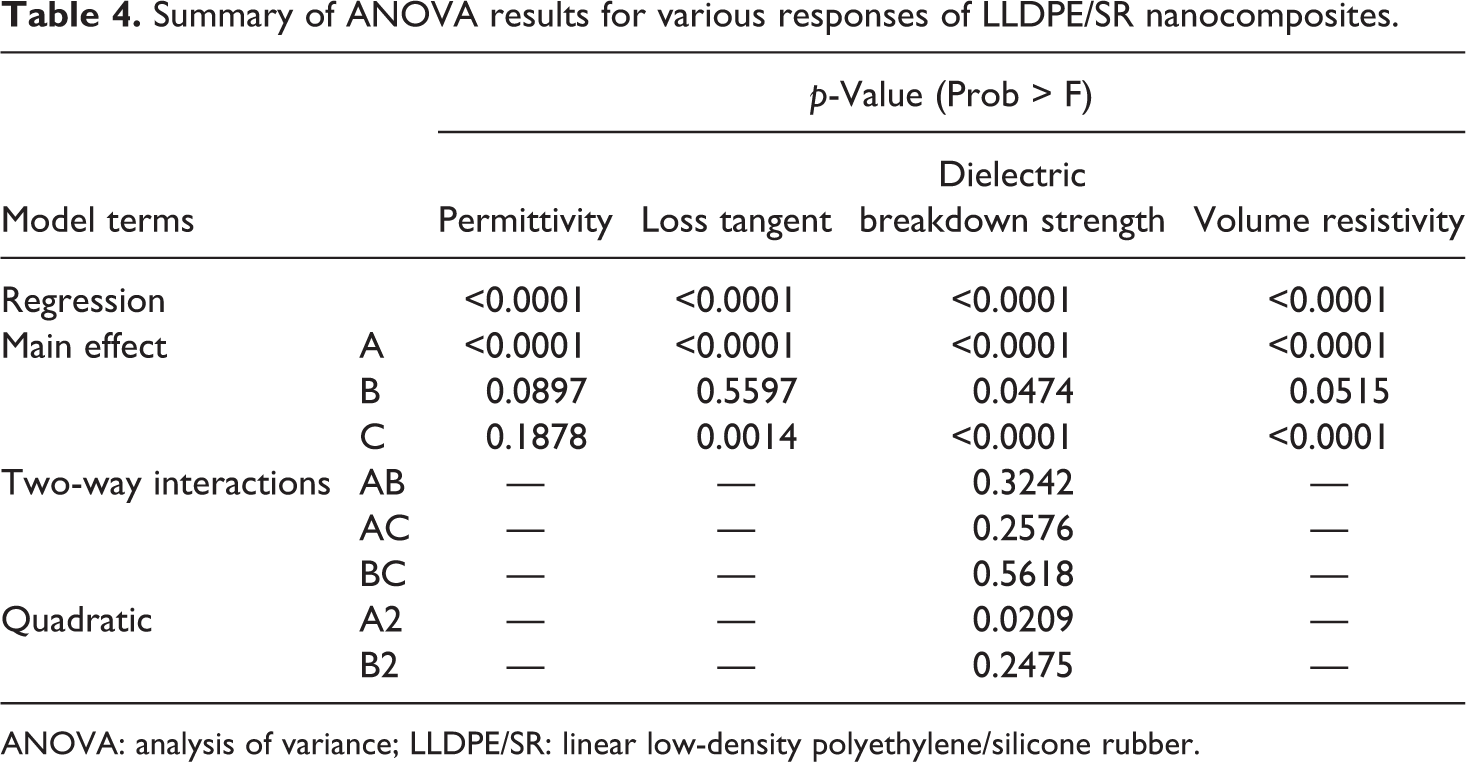
ANOVA: analysis of variance; LLDPE/SR: linear low-density polyethylene/silicone rubber.
Morphology observation
The blend of LLDPE/SR (90/10) filled with BN, Si, and Zn nanofiller at 2 vol% was chosen as representative for morphological observation and the results are presented in Figure 2. The presence of cavities in all the micrographs was associated with the extraction of individual SR domains from LLDPE during etching. It is known that LLDPE/SR is an incompatible blend, which results in heterogeneous phase in the system. 13 As mentioned previously, during the preparation of the nanocomposites, all the nanofillers were introduced into SR to prepare the masterbatch of SR/nanofiller prior to blending with LLDPE in the next processing step. Thus, it is expected that in the present nanocomposite system, the nanofillers will be dispersed in the SR phase, forming the core–shell morphology. As can be observed in Figure 2(a), which presents the micrograph of BN-filled system, the presence of BN nanoparticles was hardly seen throughout the cryofractured sample. Thus, it can be assumed that most of the BN nanofillers were encapsulated in SR phase and probably had been extracted out together with SR during etching. In order to further confirm the encapsulation of BN by SR, the sample was observed under HRTEM. Figure 3(a) revealed the presence of BN in the isolated SR phase, thus proving the encapsulation structure.
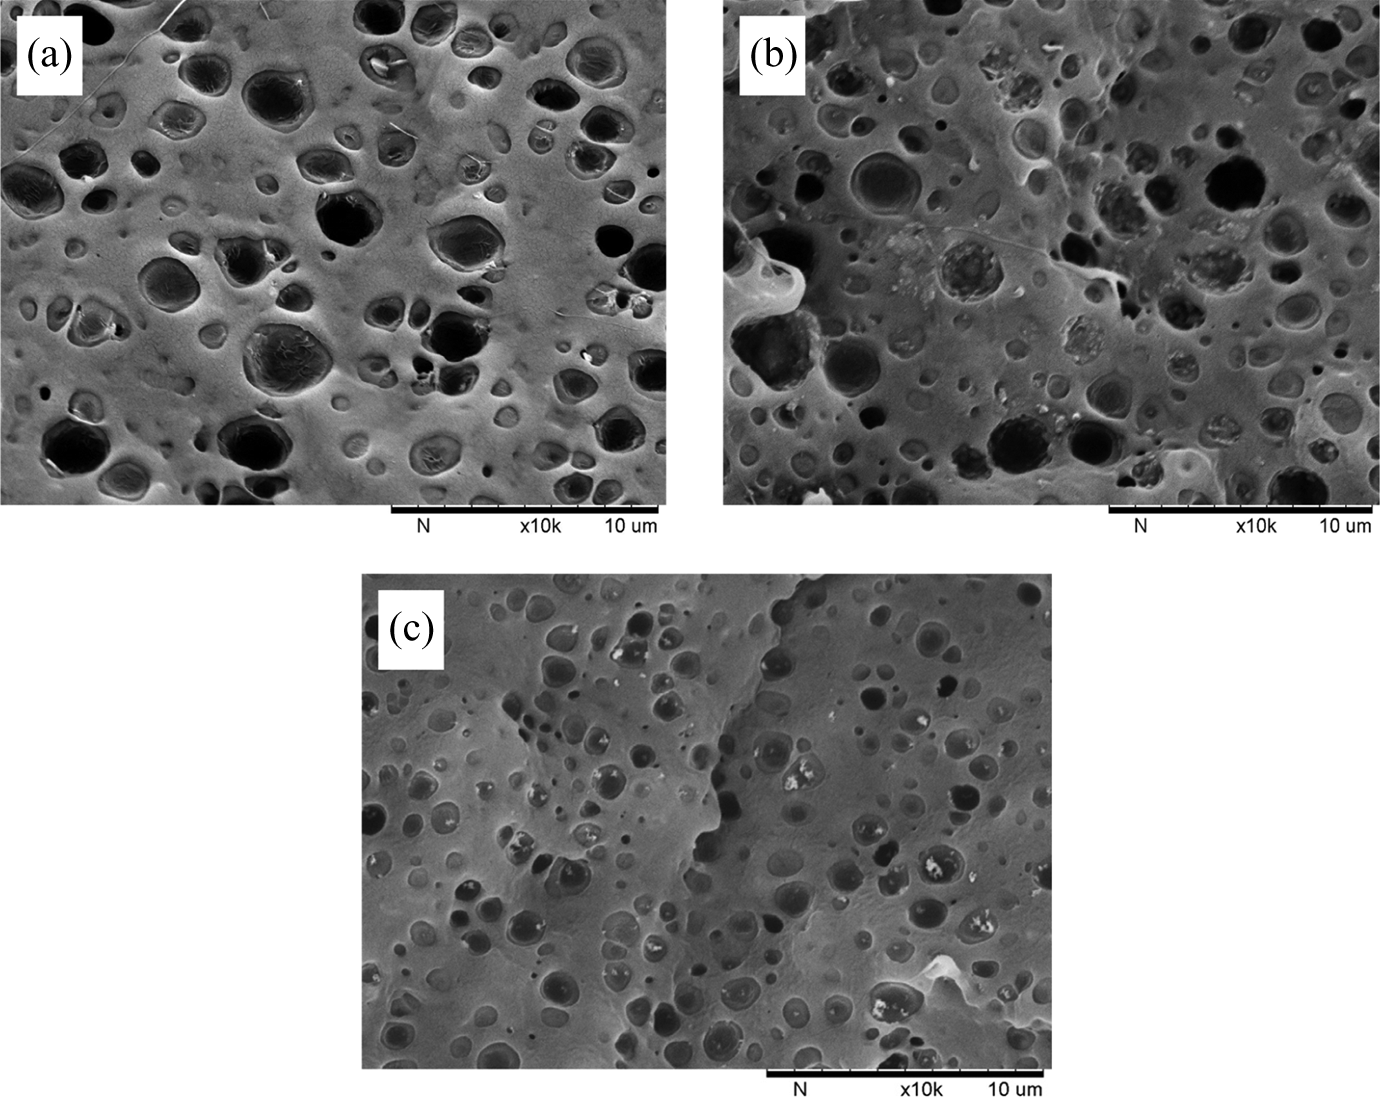
SEM images of toluene-etched fractured surfaces of 90/10 LLDPE/SR filled with (a) BN, (b) Si, and (c) Zn at 2 vol%. SEM: scanning electron microscope; LLDPE: linear low-density polyethylene; SR: silicone rubber; BN: boron nitride; Si: silica; Zn: zinc oxide.
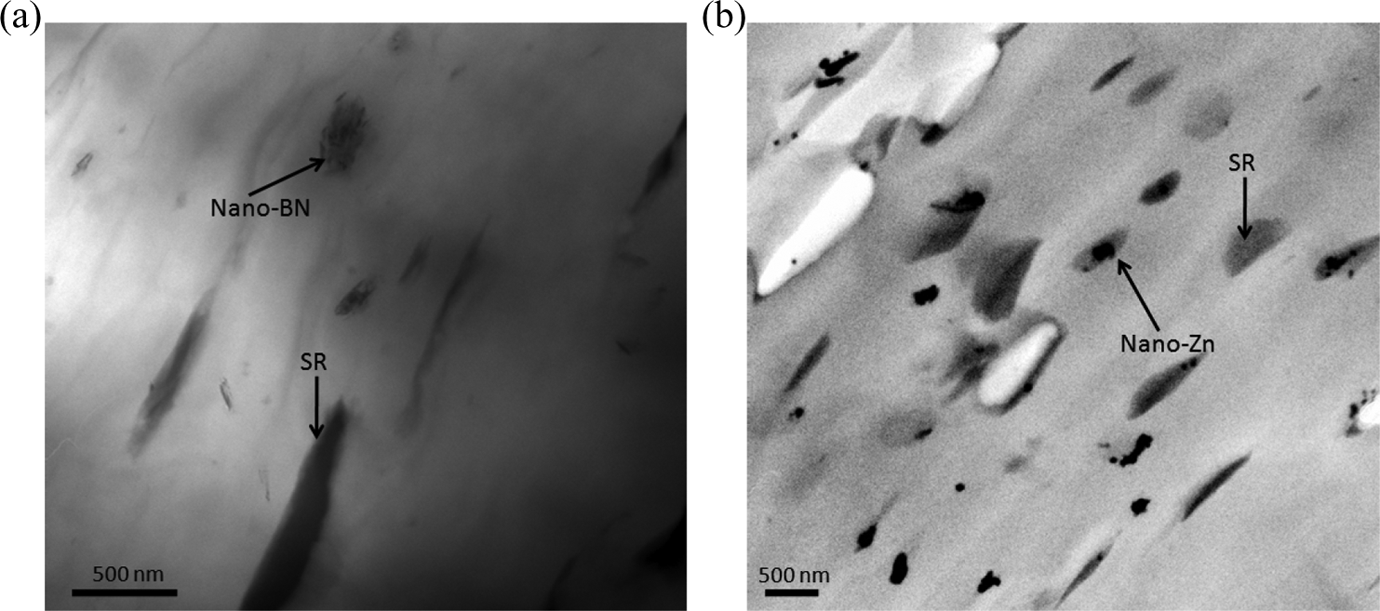
HRTEM images of (a) 90/10/2 LLDPE/SR/BN and (b) 90/10/2 LLDPE/SR/Zn nanocomposites showing the presence of nanoparticles inside SR domains. HRTEM: high-resolution transmission electron microscopy; LLDPE: linear low-density polyethylene; SR: silicone rubber; BN: boron nitride; Zn: zinc oxide.
On the other hand, Figure 2(b) shows the micrograph of Si-filled system, where the dispersion of Si can be clearly observed in the cavities and at the vicinity of the cavities. The dispersion of Si at the vicinity of SR phases might be due to the migration of nano-Si from SR phase to LLDPE/SR interfaces during mixing. The migration of remarkable amount of Si nanoparticles from SR phase to the interfaces could be related to the larger number of Si nanoparticles compared to BN and Zn at the same nanofiller loading due to the smaller particle size of Si nanofiller. In Zn-filled system, the core–shell morphology can be observed in which the Zn nanoparticles were encapsulated in SR phase. This was evident by the presence of Zn residues in the cavities after the extraction of SR (Figure 2(c)). HRTEM image in Figure 3(b) can further confirm the encapsulation structure in Zn-filled system.
Interactions of design parameters and their effects on the properties of LLDPE/SR nanocomposites
Interaction plots, or also known as response surface plots, are generated based on the model equations obtained in the regression analysis. The response surface plot is a 3-D graph that helps to identify the type of interactions between two test variables on the response, while the other variables are held at constant levels.
Permittivity
The 3-D response surface plots for the variation in the ε′ of LLDPE/SR nanocomposites as a function of SR content and nanofiller loading are shown in Figure 4(a), (b) and (c) for Si-, BN-, and Zn-filled system, respectively. The plots were based on ε′ data in Table 2, which were measured at a fix frequency of 50 Hz; 50 Hz is the widely used frequency in the energy supply network, hence most of the measured electrical insulating materials have a corresponding ε′ value in the material specification. It can be observed in the unfilled TPEs and the nanocomposites that the ε′ increased with increasing SR content. This was expected because SR has higher intrinsic ε′ than LLDPE. The increment in ε′ might also be contributed from various types of polarizations that occurred in the materials under the application of electric field. At low frequency, interfacial polarization might contribute to the increment in ε′. This interfacial polarization arose because of the heterogeneity in the system. The increase in ε′ might also be due to orientation polarization, which depends on material crystallinity. The addition of rubber into a thermoplastic could reduce the crystallinity of thermoplastic. When the crystallinity decreases, the dipoles can orient more easily, thereby promoting orientation polarization and increasing the ε′. 19
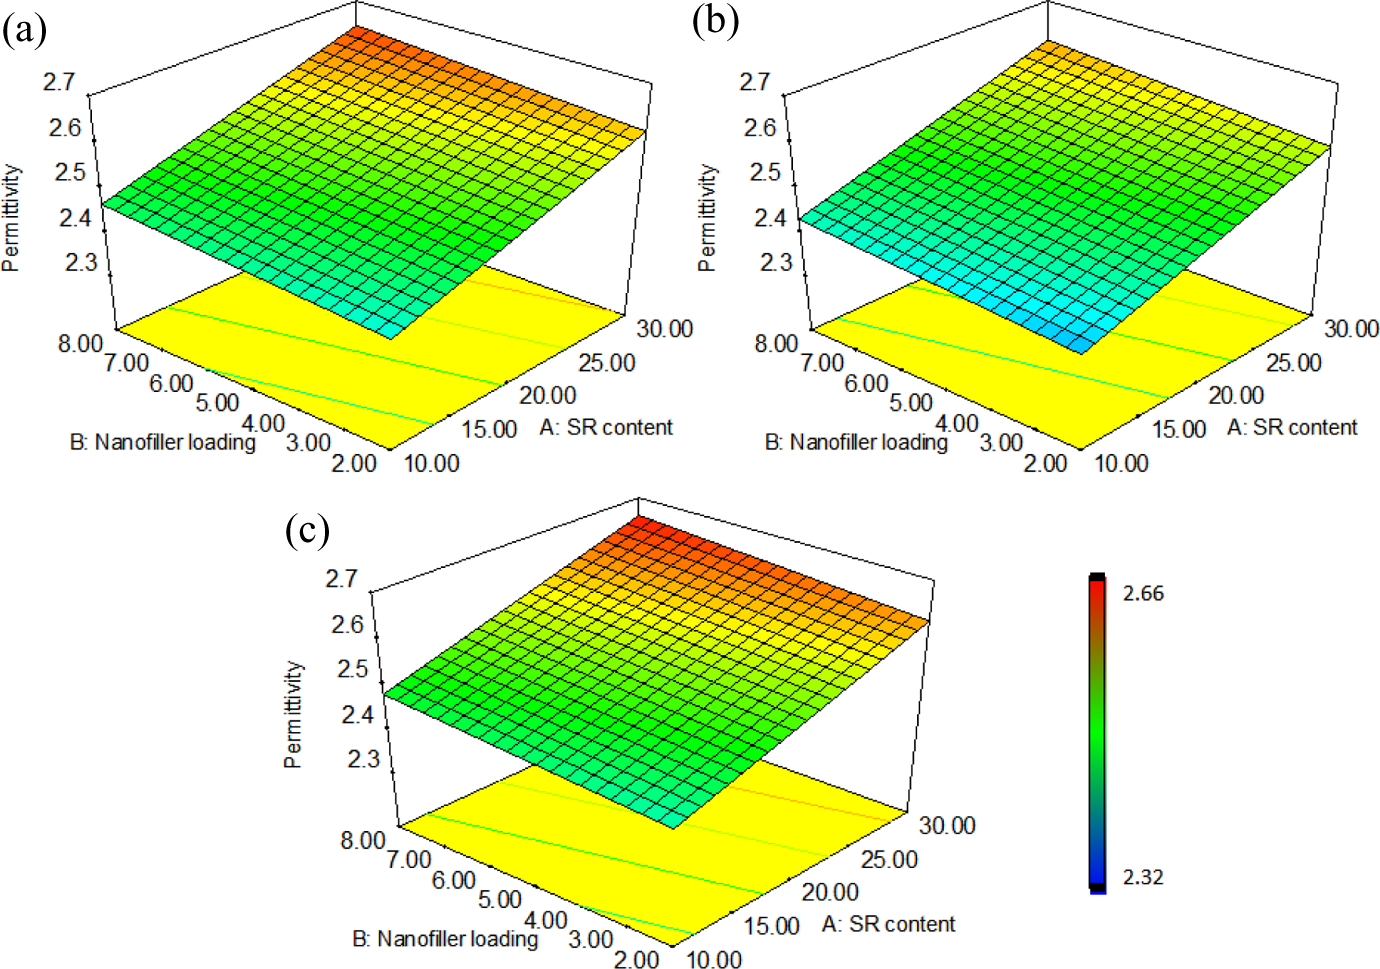
Three-dimensional response surface plots of permittivity as a function of silicone rubber content and nanofiller loading for (a) Si-, (b) BN-, and (c) Zn-filled LLDPE/SR nanocomposites. LLDPE: linear low-density polyethylene; SR: silicone rubber; BN: boron nitride; Si: silica; Zn: zinc oxide.
Furthermore, from the results, it was found that the addition of nanofiller in LLDPE/SR blends resulted in an increase in ε′ and this was observed in all types of nanocomposites. The increase in permittivities after the incorporation of nanofiller was ascribed to the influence of Maxwell–Wagner interfacial polarization in the nanocomposites system. Apart from that, the increment was expected as the individual permittivities of the inorganic nanofillers are typically higher than with the polymers. As verified through ANOVA, increasing nanofiller loading showed no significant effect on the ε′ values of LLDPE/SR nanocomposites, where only a marginal increase was observed. It is also noticed that the ε′ behavior of all nanocomposites was similar with increasing nanofiller loading and SR content, irrespective of the types of filler. Only, slightly higher values of ε′ can be observed in Zn-filled system, followed by Si and BN. Overall, the ε′ results reflected that all the LLDPE/SR nanocomposites are good electrical insulator and the lowest ε′ that is desirable for an insulator can be obtained at the minimum point of both variables.
Loss tangent
Figure 5 shows the response surface plots for the variations in dielectric loss tangent (tan δ) of the LLDPE/SR nanocomposites as a function of SR contents and nanofiller loadings. The tan δ was significantly affected by SR concentration. The tan δ noticeably increased when SR content in the nanocomposites increased, which was not happened in the unfilled LLDPE/SR blends (refer Table 2). In the case of LLDPE, which is nonpolar, relaxation is not due to dipole orientation. But, on the incorporation of SR, dipoles are introduced into the system due to the presence of nanofillers inside the SR phase; this caused a lag in orientation of dipoles on the application of the electric field. Hence, the tan δ increased with an increase in SR content. Similar observation was reported by George et al. 19 Furthermore, no significant difference was observed in the trend of tan δ with the changes in nanofiller content among the nanofilled systems. Nevertheless, the Zn-filled system had a higher tan δ values than the other systems, which can be related to the higher permittivity and conductivity value of the Zn nanofillers. This caused an enhancement of charge carriers in the system, thereby increasing the tan δ. 20,21 Similar to results, the lowest tan δ was observed at the minimum level of SR and nanofiller contents.
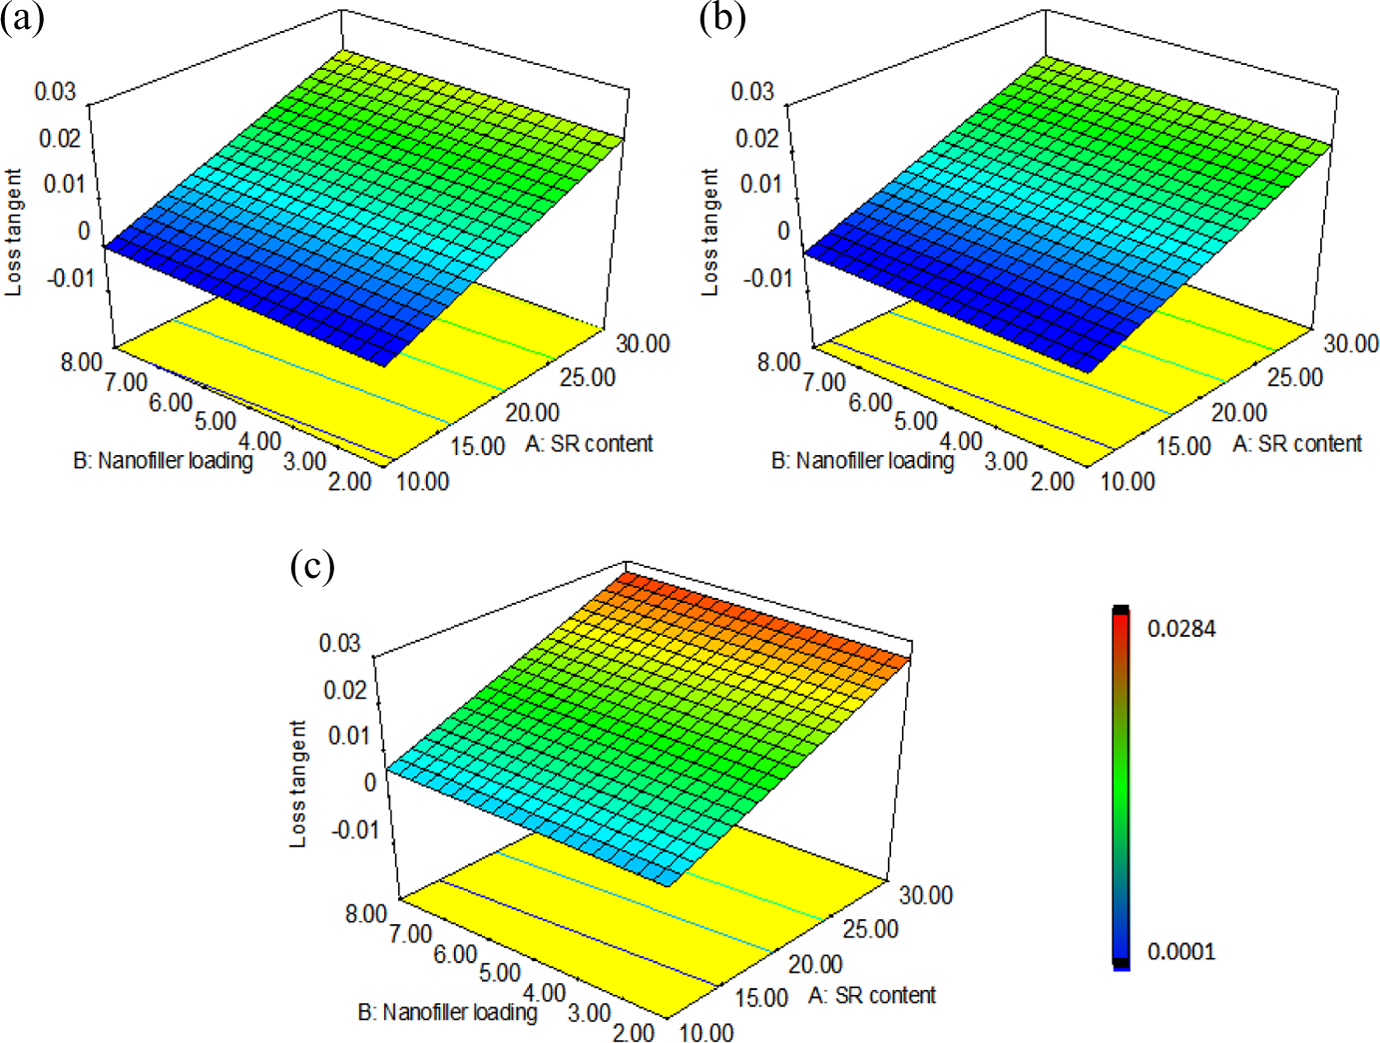
Three-dimensional response surface plots of loss tangent as a function of silicone rubber content and nanofiller loading for (a) Si-, (b) BN-, and (c) Zn-filled LLDPE/SR nanocomposites. LLDPE: linear low-density polyethylene; SR: silicone rubber; BN: boron nitride; Si: silica; Zn: zinc oxide.
Dielectric breakdown strength
The response surface plots for the DBS of LLDPE/SR nanocomposites as a function of the interaction between SR contents and nanofiller loadings are shown in Figure 6(a), (b) and (c) for Si-, BN- and Zn-filled system, respectively. The observation based on DBS data in Table 2 revealed that the DBS of LLDPE/SR filled with Si, BN, and Zn nanofillers was higher in all blend compositions as compared to the respective blends without nanofillers. From the 3-D plots, it is observed that increasing concentration of SR in the nanocomposite system would decrease the DBS values considerably. This could be attributed to the weak DBS of SR in addition to the incompatibility between LLDPE and SR. Note that the DBS of pure LLDPE and SR determined from the preliminary work is 53.5 and 31.5 kV/mm, respectively. The interface between SR particles and LLDPE might have caused the accumulation of space charge which accelerated the breakdown.
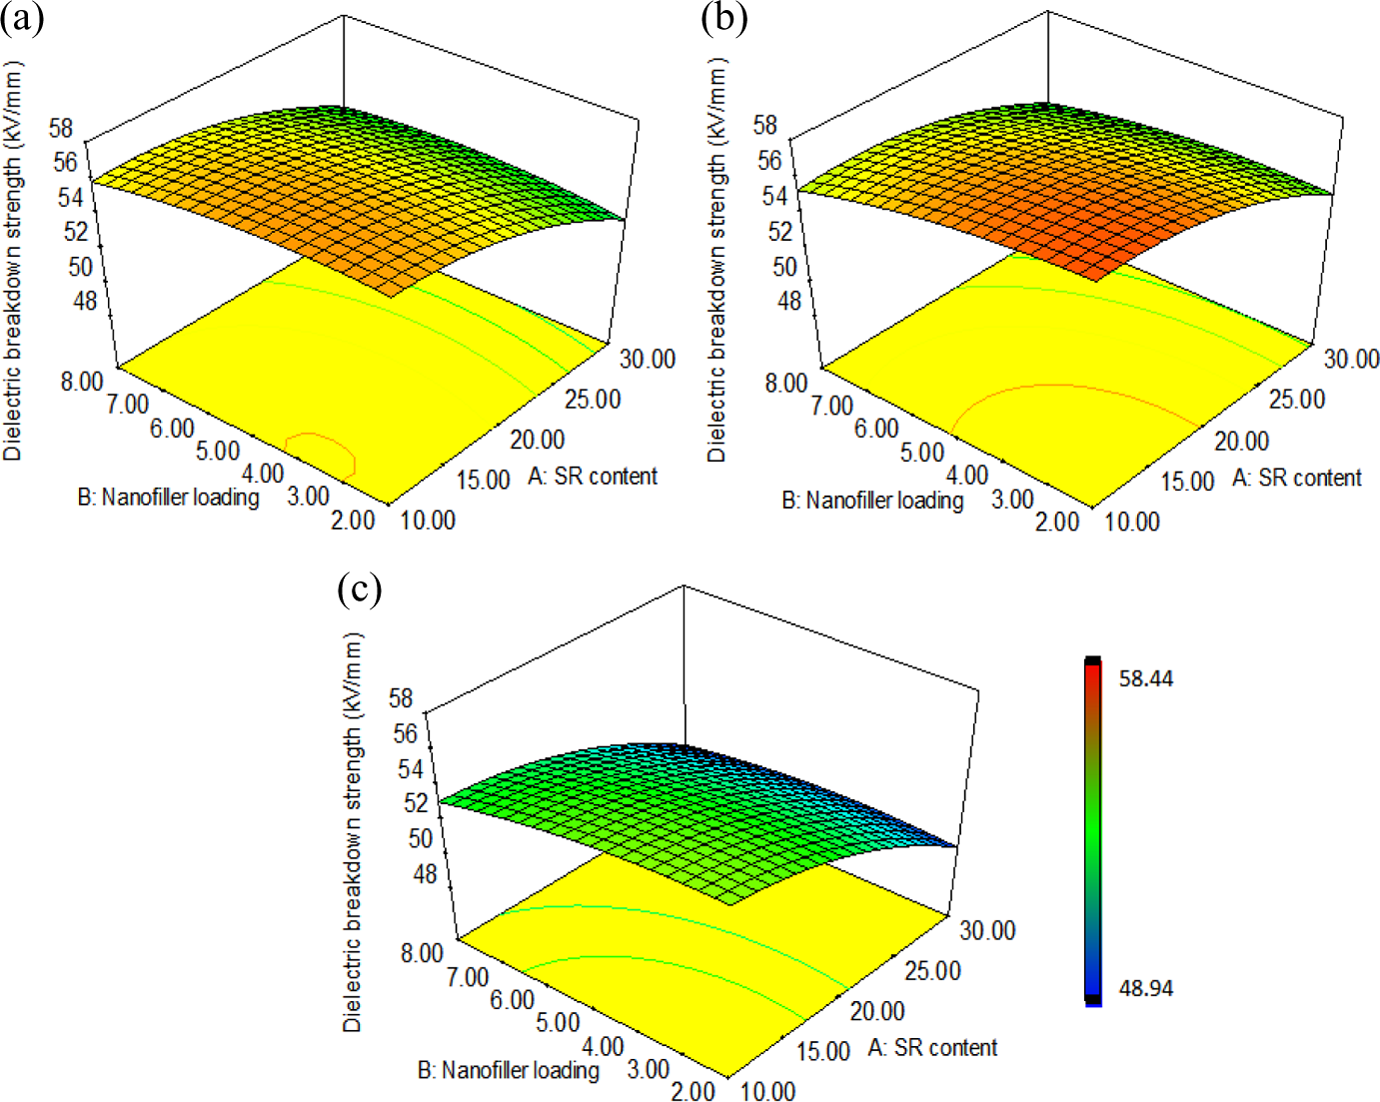
Three-dimensional response surface plots of dielectric breakdown strength as a function of silicone rubber content and nanofiller loading for (a) Si-, (b) BN-, and (c) Zn-filled LLDPE/SR nanocomposites. LLDPE: linear low-density polyethylene; SR: silicone rubber; BN: boron nitride; Si: silica; Zn: zinc oxide.
Comparing between the three nanocomposite systems, the largest increase in DBS was observed for BN-filled nanocomposite, which was then followed by Si- and Zn-filled nanocomposites. Additionally, the DBS of the three systems was observed to behave differently with increasing nanofiller loading. At low loading (2 vol%), all types of nanocomposites showed an increment in DBS. When filler loading increased up to 5 vol%, the DBS was found to continue increasing in Si-filled system and decrease in both BN- and Zn-filled systems. Further increase of nanofiller loading up to 8 vol% decreased DBS values in all nanocomposite systems. The behavior of DBS with increasing nanofiller loading could be explained by the overlapping of the interaction zone as nanoparticle content increased. Since DBS is closely related to the polymer morphology, the encapsulation of nanofillers by SR might influence the values of DBS. The increase in DBS at 2 vol% of nanofiller observed in all nanocomposites suggested that the overlapping of loose polymer region had already occurred at this loading level due to the dispersion of nanofiller in the confined space of SR, which hindered discharge path inside the phase, thus increasing DBS. With increasing nanofiller loading up to 5 vol%, the decrease in DBS observed in BN- and Zn-filled nanocomposites could possibly be due to nanoparticle contents that have exceeded the percolation threshold. Here, the tightly bound polymer regions might overlap in the SR phase, leading to an easier conducting path for the charge transfer and thereby a reduction in the DBS. 15
However, the increased DBS observed in Si-filled system at the same loading was surprising. This might be related to the presence of the Si nanoparticles at the vicinity of the SR phases as well as in the SR phase as shown in Figure 2(b). It was speculated that the presence of the nanoparticles at the interfaces helped to increase DBS, which might be explained by the following reasons: the cavity or void at LLDPE/SR interfaces, before filled with nanofillers, usually allows space charge to accumulate within it, leading to voltage breakdown. With the presence of nanofillers within the void, there would be high packing density, which caused the accumulated charge to reduce and hence altering the space charge distribution. In addition, as the void is packed with nanoparticles, the particles act as scattering sites and trapping centers. The electrons injected from the electrode at high field might collide with the nanoparticles and/or get trapped at the nanofiller/polymer interface. This would decelerate the movement of the electrons. The large scattering site and the closely packed nanoparticles caused the electrons to lose momentum to involve in the process of breakdown, hence improving the DBS. 22
The reduction in DBS at 8 vol% of nanofiller loading in all nanocomposites was well expected. At the high content of nanofillers, the reduction of DBS could be due to these two factors: (i) the nanoparticles might highly overlap with its neighbor particles. According to Chen et al., 23 when the overlap of the interaction zone is so strong, the charge tunneling dominates the charge transportation process. Generally, the tunneling process exhibits a strong dependency to electric field. At a lower applied voltage, the electric field is not high enough leading to a low conduction current. The electric field increases accordingly with increasing applied voltage, hence increasing conduction current. At one point when the electric field is sufficiently high, the conduction current will increase rapidly with the voltage, leading to a great increase in the mobility of charge carriers, thus decreasing the DBS, and (ii) the fillers might extremely agglomerate, leading to charge accumulation at the voids and defects associated with the agglomerates, thus resulting in the decrease in DBS.
Reason for the different behavior of DBS observed in the three nanocomposite systems could also be attributed to the difference in permittivity between the nanofillers. According to Tan et al., 24 high permittivity materials represent high polar materials that contain dipoles. High polar materials have lower energy band gap that results in lower DBS. On the contrary, materials with low permittivity are less polar (low dipole moments) and have high energy gap, which makes them very good insulators. Additionally, difference in the permittivities between the filler and polymer can cause electric field distortion in the nanocomposites under AC condition. 25,26 The larger the difference, the greater the electric field distortion and the higher the local electric field enhancement, which results in the low DBS of the nanocomposites.
The result showed an agreement with the theory in the case of Zn-filled nanocomposites, which was observed to have the lowest DBS in all blend compositions, when compared to the other nanocomposites. This is because, Zn has higher permittivity (approximately 8.7) and lower energy band gap as compared to Si and BN with permittivity values 3.9 and 4.48, respectively. 26 –28 The incorporation of Zn nanofiller into the polymer caused a large difference in their permittivities. Thus, electrical field distortion was intensified and field enhancement became greater, which result in the low DBS of the nanocomposite. Therefore, nanofillers with electrical characteristics that are similar with the polymer matrix should be selected to obtain nanocomposites with a high DBS.
Volume resistivity
The variations in the volume resistivity for Si-, BN-, and Zn-filled LLDPE/SR nanocomposites with respect to SR contents and filler loadings are presented in Figure 7. By referring to Table 2, it is found that the introduction of nanofiller decreased the volume resistivity of the nanocomposites irrespective of filler type. Increasing SR content also considerably reduced the volume resistivity of all types of nanocomposites. Increasing nanofiller loading, however, gave insignificant effect on the volume resistivity of the nanocomposites.
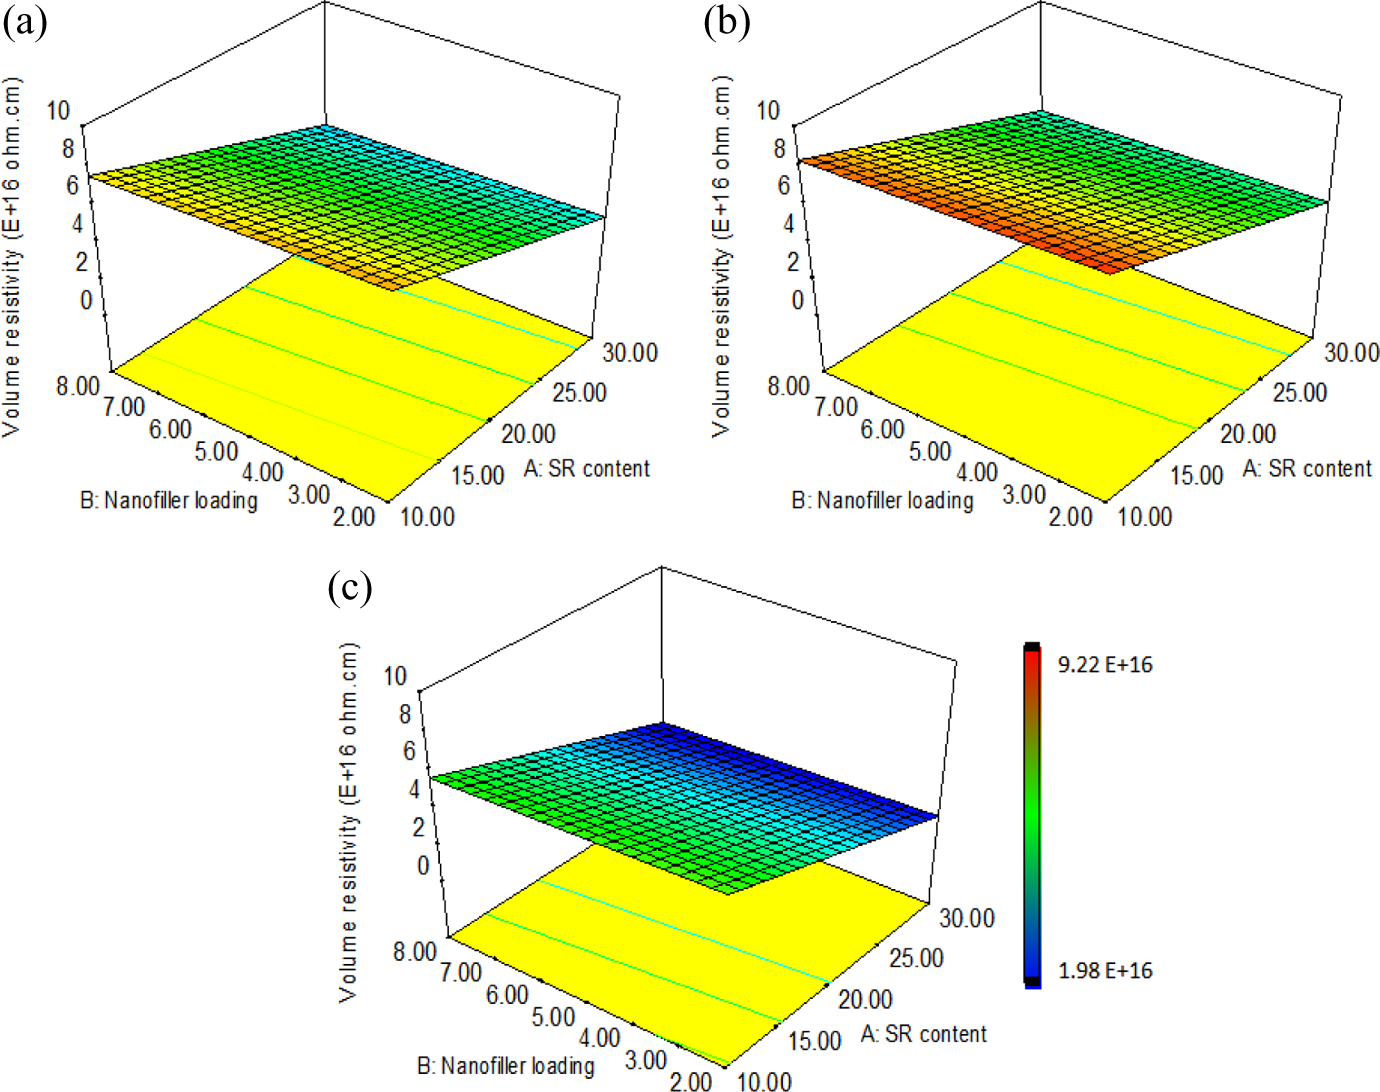
Three-dimensional response surface plots of volume resistivity as a function of silicone rubber content and nanofiller loading for (a) Si-, (b) BN-, and (c) Zn-filled LLDPE/SR nanocomposites. LLDPE: linear low-density polyethylene; SR: silicone rubber; BN: boron nitride; Si: silica; Zn: zinc oxide.
The reduction in the direct current (DC) volume resistivity with increasing SR content was expected due to low resistivity of SR. LLDPE is a good insulator, having resistivity in the order of 1017 Ω cm, whereas the volume resistivity of SR is in the order of 1015 Ω cm. Therefore, the introduction of SR into LLDPE resulted in the intermediate resistivity value between that of LLDPE and SR. As the content of SR increased, the resistivity decreased accordingly. On the other hand, the volume resistivity of the nanocomposite depends on the electrical conductivity in the bulk of the material. The introduction of inorganic fillers introduced free ions into the system, which can increase the DC conductivity of the nanocomposites. 20 This explained the reduction in the volume resistivity of the filled LLDPE/SR. There was a significant effect on the type of nanofiller on the volume resistivity as has been verified through ANOVA. BN-filled nanocomposites exhibited higher volume resistivity, followed by Si- and Zn-filled nanocomposites. The significantly lower resistivity value of Zn-filled samples compared to that of BN and Si might probably due to the introduction of excess free charges into the nanocomposite system by the Zn particles. This was in agreement with the loss tangent results as discussed in section “Loss tangent.”
Optimization of LLDPE/SR nanocomposites
In order to be useful as electrical insulators, the material should have the following combination properties: (1) low dielectric constant (relative permittivity) to prevent local charge accumulation; (2) low dielectric loss to prevent excessive heating of dielectric material; (3) high DBS to withstand an electric field; and (4) it should possess low conductivity or high resistivity. Numerical optimization was carried out using Design Expert 8.0.7.1v software to determine the combination of variables that give the optimal responses based on the desirable criteria. This computerized optimization was used to optimize any combination of one or more goals. The goals may be applied either on the factors or responses. In the optimization parameters, the program uses five possibilities for a goal to construct the desirability indices, namely, maximize, minimize, target, is in range, none (for responses only). Table 5 summarizes the constraints applied for the optimization of the properties of LLDPE/SR nanocomposites. The constraints in this study were chosen as to minimize all the formulation variables to achieve overall economy of the process. Meanwhile, the goals for the responses were set as shown in Table 5 in order to meet the requirements for HV insulator.
Constraints applied for optimization.
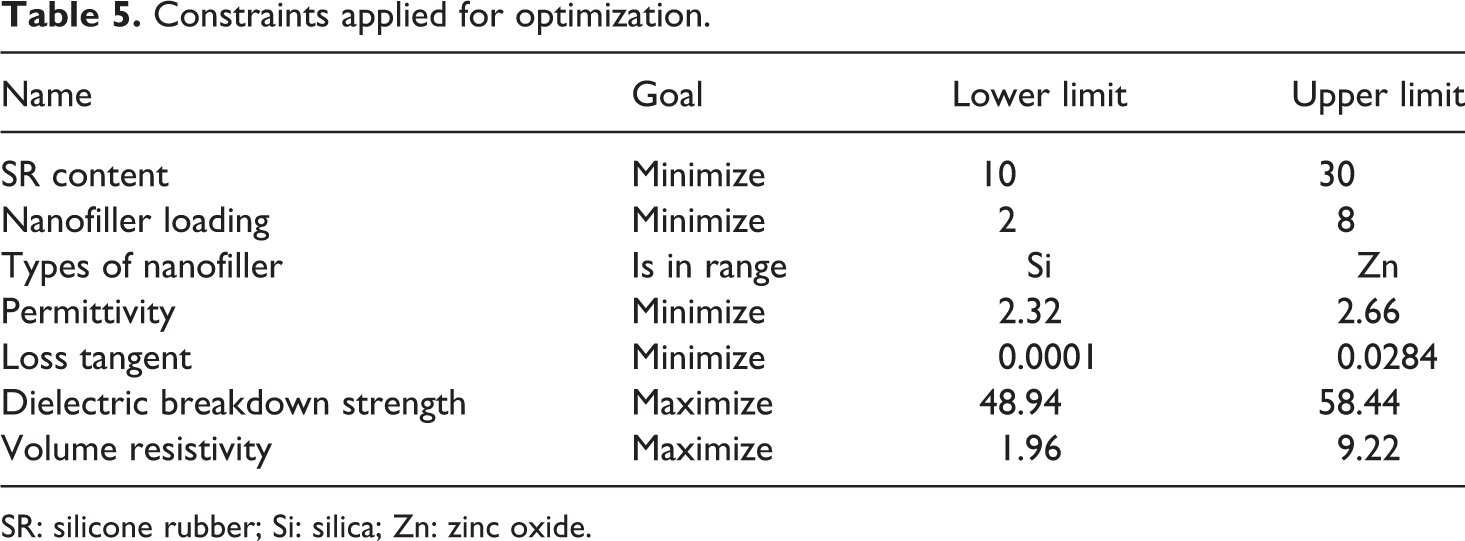
SR: silicone rubber; Si: silica; Zn: zinc oxide.
After running the optimization, three solutions or combinations of optimum responses for formulation variables of LLDPE/SR nanocomposites were identified and are listed in Table 6. From the solutions, the first combination should be chosen because it showed the highest desirability (0.919). The desirabilities range from zero to one for any given response. A value of one represents an ideal case, whereas a value of zero indicates that one or more responses fall outside the desirable limits. The solution number 1 was then rerun to verify the linearity between the predicted values suggested by the optimization and the experimental values. The results are listed in Table 7. The percentage of error between predicted value and experimental data was also determined. In all cases, it can be observed that the errors were within ±9% of the predicted values. These suggested a fair consistency between the results obtained. These errors could be explained by the imperfect fit between the optimization and the experimental factors.
Solutions of formulation parameters optimization of LLDPE/SR nanocomposites with the optimum responses and desirability indices.
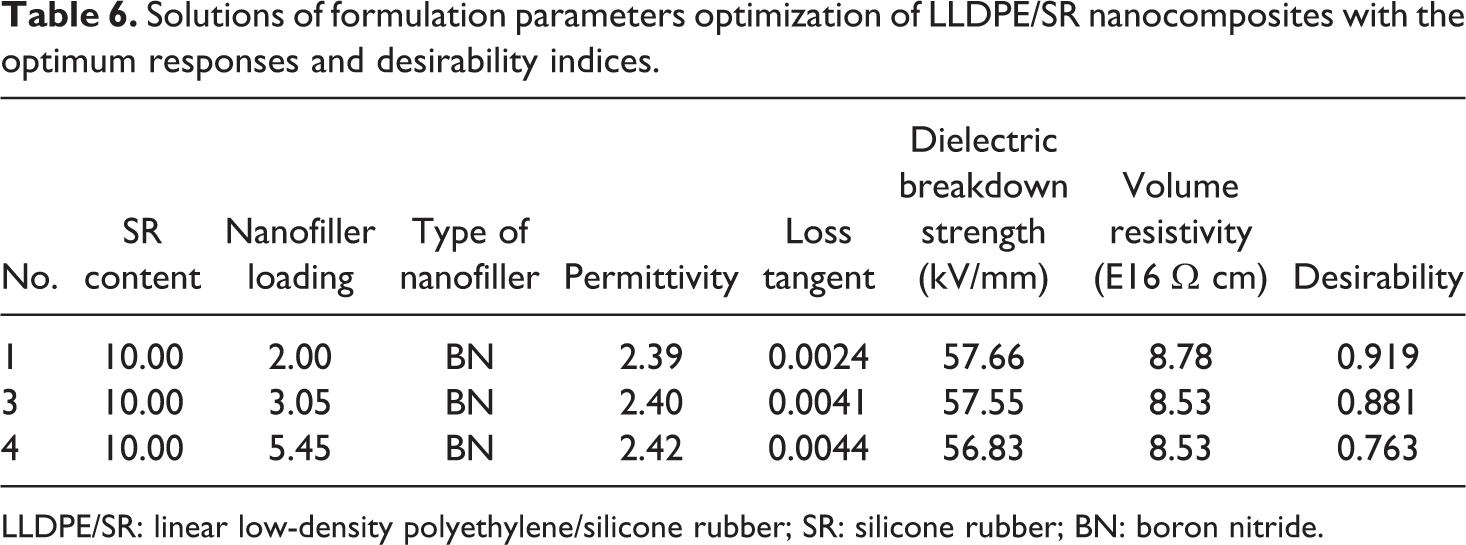
LLDPE/SR: linear low-density polyethylene/silicone rubber; SR: silicone rubber; BN: boron nitride.
Comparison of properties between experimental and predicted by the regression equations.
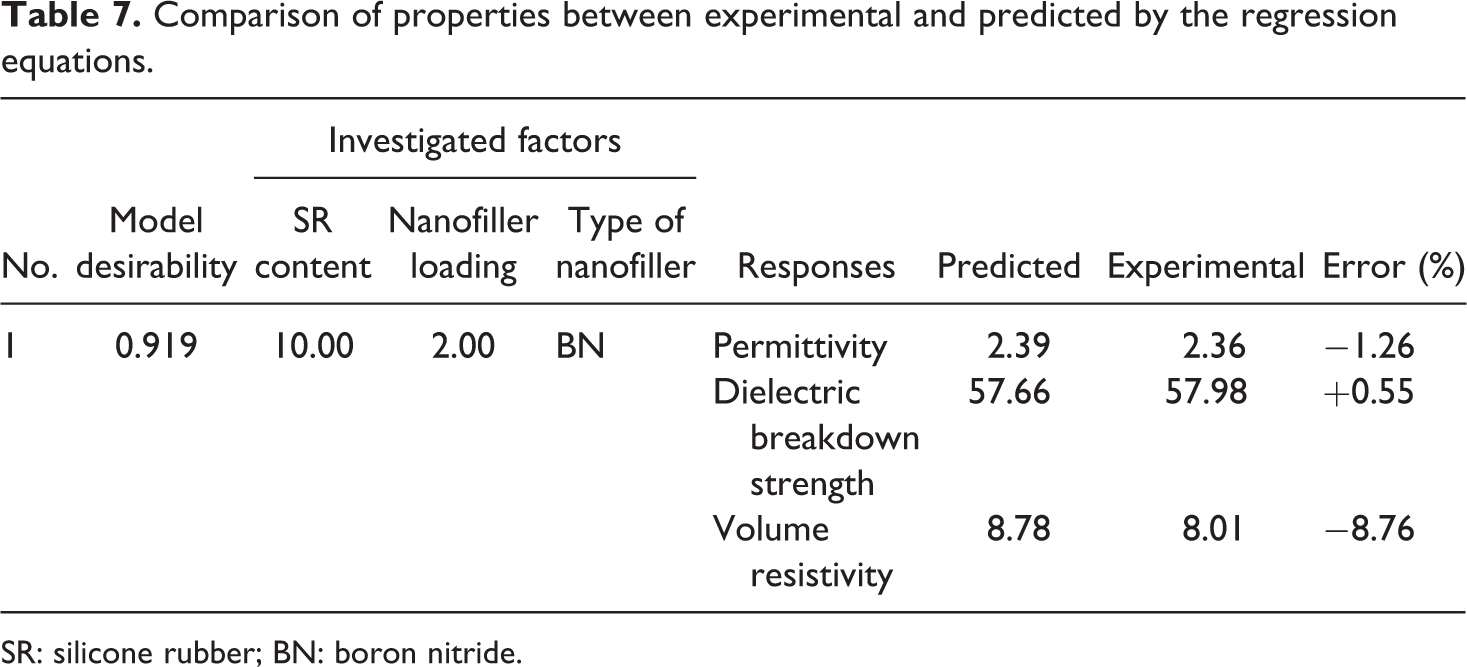
SR: silicone rubber; BN: boron nitride.
According to Naidu and Kamaraju (2004) 29 , solid insulating materials with DBS of 33 kV to 400 kV and above can be classified as HV insulators. With the sufficiently high DBS value, low permittivity and loss as well as good volume resistivity, the optimized compound with 10 wt% of SR and 2 vol% of BN was found suitable for the application in HV insulators.
Conclusions
In this study, various types of LLDPE/SR nanocomposites were prepared and three-level factorial design from DOE was applied to optimize the formulation parameters for producing nanocomposites with good HV insulation performance. Three formulation parameters (with three different levels) were used, which are SR content, type of nanofiller, and nanofiller loading, and their effects on various electrical properties (permittivity, loss tangent, DBS and volume resistivity) which are important for electrical insulator were studied. The experimental data were fitted to mathematical models by multivariable regression analysis. The variance of the models was tested by R
2 test and ANOVA, justifying the adequacy of the equations. The models were used to generate response surface plots. The visualization of the models through response surface plots showed the multidimensional nature of variation of properties with variation in the input variables. The optimum parameters were then determined through optimization process, and the validity of the models was tested by making comparison between the experimental and the predicted by the models. From the results, it can be concluded that SR content and type of nanofiller appeared as significant factor influencing the value of permittivity, loss tangent, and volume resistivity. Zn-filled system showed the highest permittivity and loss tangent as well as the lowest resistivity, which are not desirable for electrical insulator. The dielectric strength was significantly influenced by SR content and nanofiller type. Nanofiller loading, on the other hand, was found to affect the DBS behavior of the three nanocomposite systems differently. The largest increase in DBS was observed for BN-filled nanocomposite, which was then followed by Si- and Zn-filled nanocomposites. LLDPE/SR nanocomposite showing optimal properties for HV insulators was obtained at 10 wt% of SR and 2 vol% of BN. The results of a confirmatory experiment were found to be in good agreement with values predicted by the model.
Footnotes
Acknowledgements
The authors gratefully acknowledge the Universiti Sains Malaysia for the Research University grant (8044036) and Ministry of High Education for granting the MyBrain15 scholarship that made this study possible.
Declaration of conflicting interests
The author(s) declared no potential conflicts of interest with respect to the research, authorship, and/or publication of this article.
Funding
The author(s) disclosed receipt of the following financial support for the research, authorship, and/or publication of this article: This research is funded by Research University grant (8044036) from Universiti Sains Malaysia and MyBrain15 Scholarship from Malaysia Ministry of High Education.