
Abstract
Silica–graphite filler was prepared via two-step grafting procedure by grafting silica particles onto the expanded graphite. In the first step, isocyanatopropyltriethoxysilane was chemically introduced onto the silica aggregates, which was followed by grafting onto the expanded graphite via urethane linkage in the second step. Successful grafting of silica aggregates onto the graphite was corroborated using Fourier transform infrared spectroscopy and X-ray photoelectron spectroscopy. The presence of a thin graphene layer on silica aggregates corroborated using transmission electron microscopy confirmed the grafting of silica aggregates onto the graphite surface. Styrene–butadiene rubber (SBR) composites with various silica–graphite loadings were prepared by melt processing technique to generate pristine silica and silica–graphite-filled elastomeric composites. Rheometric cure studies revealed that the torque difference (ΔS) increased with pristine silica loading, when compared to the unfilled SBR system, and this effect is more pronounced on loading silica–graphite filler. Improvements in mechanical properties such as modulus and tensile strength were observed with increasing loading of silica particles and this effect is more pronounced on loading silica–graphite fillers, indicating that this is due to the rise in the elastomer–filler interactions in the silica–graphite-loaded SBR systems. This fact was further corroborated using bound rubber content and equilibrium swelling ratios of the unvulcanized and vulcanized SBR composites.
Keywords
Introduction
The pneumatic tire, a complex structure consisting of geometrically torus and mechanically flexible pressure container, is structurally a high performance composite and chemically made up of elastomers (rubber) and reinforcing materials that provide stiffness to the tire. 1,2 Rubber composites used for tire manufacture should have excellent mechanical, abrasion resistance, fatigue, and aging resistance properties so as to meet the requirements such as (a) lowest possible rolling resistance, (b) highest mileage, and (c) excellent traction between the road and tire. 3 –5
Generally, carbon black (CB) is used as a reinforcing material in tire formulations that normally enhances the properties of vulcanized rubber composites. Although CB-loaded rubber compounds meet the current needs of the tire formulations, these systems have severe pitfalls like significant increase in rolling resistance and reduction in wet traction. 6 –8 Alternatively, loading of silica particles in tire formulations resulted in approximately 20% reduction in rolling resistance and 15% increase in wet traction when compared with CB-filled systems. Nevertheless, the serious setbacks associated with silica-loaded rubber compounds are poor abrasion and mechanical properties, which are key factors that affect the tire performance. 9 –12 To overcome these technological problems, certain coupling agents are often used to improve the tire performance. 13 –15 Though the pneumatic tire designed using conventional silica-filled composites showed relatively good performance, these values are significantly low when compared with CB-loaded elastomeric systems.
For excellent tire performance, it is inevitable to have combined properties showed by both CB- and silica-filled elastomeric composites. To attain the desired objective, leading CB industries developed carbon–silica dual phase filler (CSDPF) by co-fuming technologies consisting of silica and carbon phases. 16 –18 Nonetheless, these CSDPF-loaded elastomer composites do not exhibit betterment in the desired properties when compared to the CB-loaded systems, though it showed a relatively good performance in comparison to the silica-filled elastomeric composites. 19 –21 Alternatively, few CB industries adopted surface coating technology, where the carbon particles are being coated with silica shell. 22 Although it showed a relatively good performance in tire formulations, the variation in the rolling resistance properties is not quite significant in comparison to the silica-filled rubber composites. 19,20 Alternatively, the rheometric, mechanical, dynamic mechanical, and abrasion resistance properties of elastomeric nanocomposites based on carbon nanotubes 23,24 and nanoclays 25,26 have also been investigated. The advantages on the use of nanofillers are attributed to the significant rise in properties at lower loading amount, when compared to CB or silica fillers.
Natural graphite consisting of several stacks of tightly bound two-dimensional (2D) graphene layers could be used as efficient filler for elastomer-based composites. However, interlayer spacing of natural graphite is significantly lower, which is one of the serious limitations to get optimum mechanical properties as the dispersion states of these fillers in the polymer matrices are lower. Alternatively, expanded graphite, which is a volumetrically expanded graphene sheet with 300–400% increment in interlayer spacing, could improve the dispersion states and thereby properties, when loaded in elastomeric systems. 27 Recently, chemically prepared layered graphene oxide (GO) has emerged as a potential candidate for replacing CB for reinforcement of rubbers due to its nanosize effects and unique physical properties. 28 The role of GO and GO–silica filler on the properties of Styrene–butadiene rubber (SBR) composites has been investigated by Mao et al. 28 and they claimed significant increase in wear resistance and low rolling resistance. However, latex processing technique has been used to prepare the SBR/GO composites. 28 On the other hand, Shin et al. 29 reported a new modification step in the preparation of silica–graphite filler, which can be used to prepare elastomeric composites by simple melt mixing process. It is expected that grafting of silica aggregates onto the graphite shell improves the elastomer–filler interaction with non-polar rubbers such as natural rubber or SBR that in turn boosts the properties such as mechanical, abrasion resistance, etc. quite identical to the CB-loaded rubber composites. However, a systematic investigation, which reveals the nature of interaction between the expanded graphite and silica, was not discussed. Also, the effects of silica–graphite filler loading on the mechanical and abrasion loss properties were also not reported by Shin et al. 29
In this report, graphite-coated silica aggregates (SiG) were prepared and characterized using various characterization tools such as Fourier transform infrared (FTIR) spectroscopy, X-ray photoelectron spectroscopy (XPS), X-ray diffraction (XRD), thermogravimetric analysis (TGA), transmission electron microscopy (TEM), and Brunauer–Emmett–Teller (BET) nitrogen (N2) surface area measurements. Finally, the role of prepared silica–graphite filler on the rheometric, mechanical, and abrasion loss properties of the SBR vulcanizates has been investigated.
Experimental
Materials
Silica particles (SiO2, average particle sizes of 10–20 nm) and isocyanatopropyltriethoxysilane (ICPTES) were obtained from Sigma-Aldrich, Korea. Expandable graphite was obtained from Asbury Carbon, New Jersey, USA (Expansion ratio: 307, Grade 3772). SBR (SBR-1502) was procured from Kumho Petrochemical Co., Ltd, Korea. Polymerized trimethyl quinolone, mercapto benzothiazole sulfonamide, and tetramethyl thiuram disulfide were obtained from Qingdao Rubber Chemicals Co., Ltd., Korea. Zinc oxide (ZnO), stearic acid, sulfur, ammonium hydroxide, and ethanol were purchased from standard local suppliers.
Preparation and characterization of silica–graphite filler
Preparation of the silica–graphite filler was done by the two-step modification procedure as discussed below. In the first step, desired amount of silica powder (150 g) was ultrasonically dispersed in 7500 mL (7.5 L) of ethanol solvent. To this dispersant, ICPTES silane (4.5 mL, 18.2 mmol) was added slowly and the reaction was done at 50°C for 24 h. The prepared samples were filtered off and dried under vacuum. In the second step, 50 g of silane-modified silica (Si-NCO) samples (dispersed in 2.5 L in ethanol) was mixed with 25 g of expanded graphite (G) (dispersed in 2.5 L of ethanol solvent) in the presence of 5 mL of ammonium hydroxide solution (NH4OH, 28% NH3 in H2O) and the reaction was carried out at 90°C for 24 h. The prepared samples were filtered off and dried under vacuum to get grey colored powder.
Characterization
FTIR spectroscopy of pristine silica (Si) and silica–graphite (SiG) filler was done using Perkin-Elmer 2000 spectrophotometer (Perkin-Elmer Inc., Massachusetts, USA). FTIR studies were carried out in the transmission mode using KBr pellets in the IR range of 4000–400 cm−1 set at the resolution of 4.0 cm−1. XPS (K-Alpha, Thermoelectron; Thermoscientific Inc., Massachusetts, USA) characterization was used to understand the surface chemical composition and functional groups present in the Si and SiG fillers. XRD results of the pristine silica (SiO2) and silica–graphite (SiG)filler were obtained at room temperature at 1° min−1 in the 2θ range of 5–50° using Macscience X-ray diffractometer (M18XHF-SRA, Mac Science Co. Ltd., Japan) employing Cu Kα radiation (20 mA, 40 kV, 1.5418 Å). The morphology of SiO2 and SiG fillers was obtained using TEM (Jeol JEM-2100F, Japan) using the filler dispersants (0.1 mg in 10 mL of ethanol solvent) deposited on the carbon-coated copper grids. The images were taken at the operating voltage of 100 kV and at the point-to-point distance of 2.3 Å. In addition, all samples were examined at both low
Preparation of SBR composites
Following the compounding formulations (Table 2), preparation of the SBR composites were done in the open two-roll mill set at the friction ratio of 1:1.1 with the nip gap of about 1 mm at room temperature. Standard mixing time was maintained (19 min) for all rubber composites. SBR vulcanizates were designated as S0, SSiX, and SSiGX (where X is the loading amount) for gum SBR, pristine silica, and silica–graphite filler-loaded SBR composites.
Surface area and pore size values of pristine and modified silica samples.
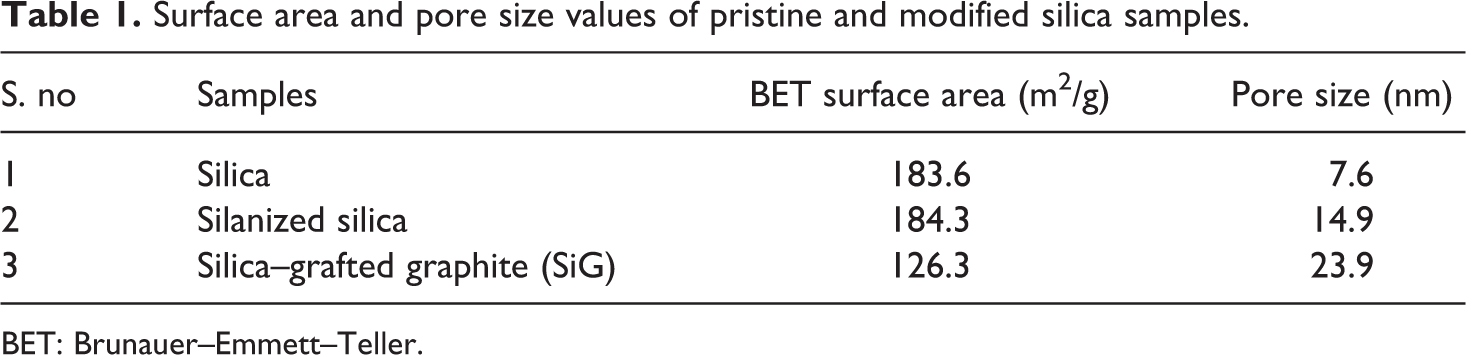
BET: Brunauer–Emmett–Teller.
Compounding formulation.
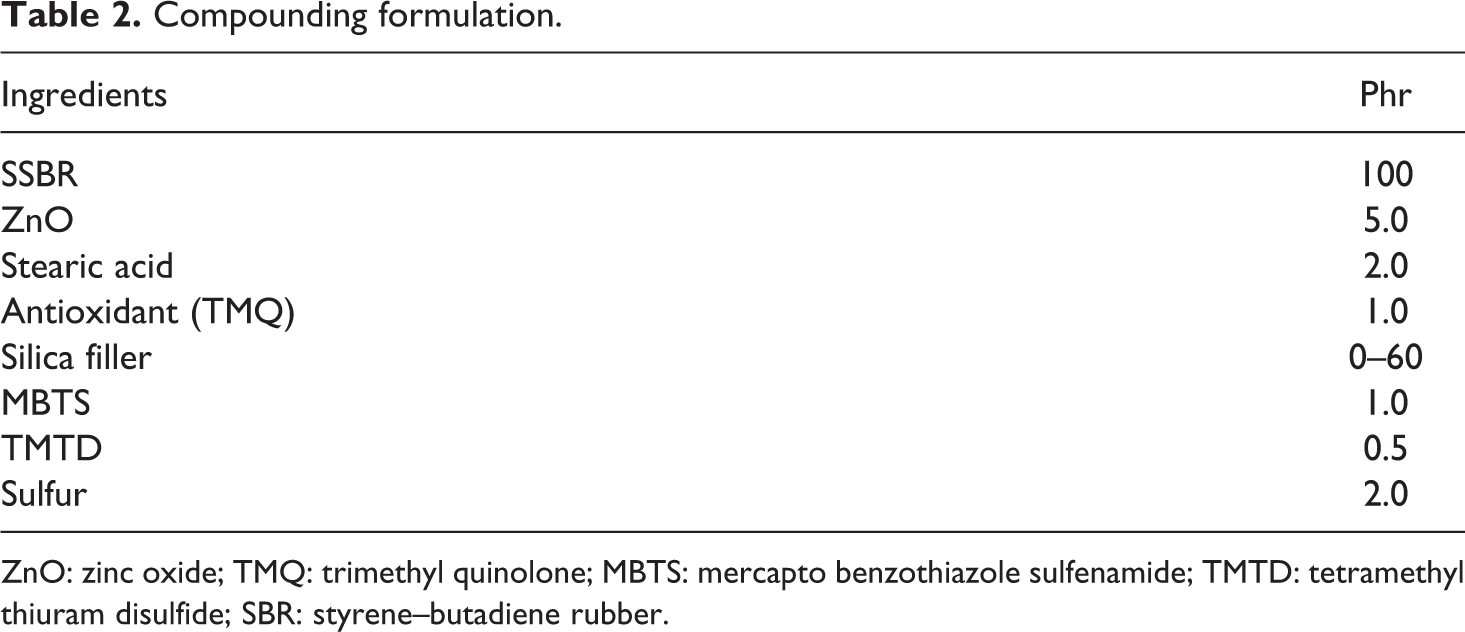
ZnO: zinc oxide; TMQ: trimethyl quinolone; MBTS: mercapto benzothiazole sulfenamide; TMTD: tetramethyl thiuram disulfide; SBR: styrene–butadiene rubber.
Bound rubber measurements
The bound rubber content of the pristine silica and silica–graphite-loaded SBR compounds were determined using the SBR masterbatches (without accelerator and sulfur) as per the mixing formulation (Table 2). 30 About 4 g of SBR masterbatches was dissolved in 40 mL of toluene and kept in an idle condition for 7 days. The bound rubber content was calculated using the weight loss of the samples by using equation (1) as shown below
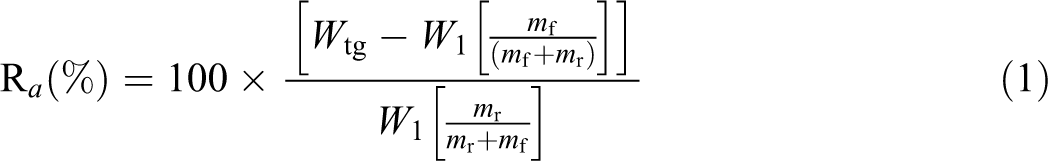
where Wtg is the weight of the filler and attached bound rubber gel, W1 is the weight of the sample, mr is the mass fraction of the rubber in the SBR masterbatches and mf is the mass fraction of filler in the SBR masterbatches. The toluene was replaced every 2 days during the course of bound rubber studies.
Rheometric, mechanical, and abrasion loss measurements
The cure characteristics of the gum, pristine silica, and silica–graphite-loaded SBR vulcanizates, such as minimum torque (ML), maximum torque (MH), torque difference (▵S, MH − ML), scorch time (tS2) and optimum cure time (t90), were determined using an oscillating disc rheometer (Alpha Technologies, Ohio, USA) measured at 150°C and 1° arc of oscillation. SBR composites were then vulcanized at 150°C at the desired cure times (t90) using a compression molding technique with a Carver hot press (Carver press (Carver Inc., Indiana, USA)) to obtain vulcanized rubber composite sheets of 150 × 160 × 1 mm3. Tensile dumbbell specimens were die cut using ASTM Die C following the ASTM D 412 method. Tensile strength test of the elastomeric composites were performed according to ASTM D412 using the Universal testing machine (Instron 5567, Bucks, UK). Tensile strength and modulus were determined using the testing machine with an extensometer at a crosshead speed of 500 mm min−1. For each composite, five replicated specimens were tested. Morphological characterization of the tensile fractured pristine silica and SiG-filled SBR vulcanizates was done using field emission scanning electron microscopy (FE-SEM; LEO SUPRA 55, Carl Zeiss, Germany). Akron abrasion loss of silica and SiG-filled SBR vulcanizates was evaluated by determining the abrasion volume per 1.61 km using Gotech GT-7012 AB testing machine (Taipel, China) following BS 903/A9 standard.
Equilibrium swelling studies
For equilibrium swelling studies, circular specimens with a diameter of 13 mm and a thickness of 2 mm were cut from the molded sheets and kept in toluene for up to 3 days at a temperature of 25°C; the solvent was refreshed every 24 h to remove extracted components. The swelling mass (ms) and the residual mass (md) of the sample were determined before and after drying the swelling sample in a vacuum oven at 60°C for 72 h, respectively. The equilibrium volume swelling results (Qr) of gum SBR vulcanizates were calculated using equations (2) and (3) 31
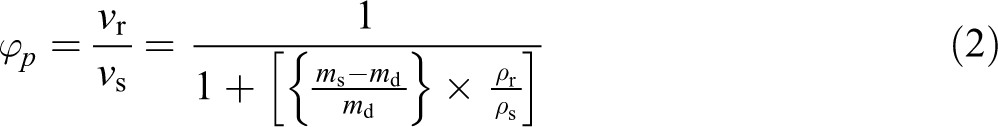
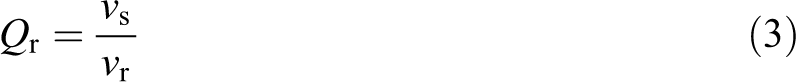
where φp is the volume fraction of polymer in the whole sample after swelling, Vr and Vs are the volume of gum SBR before and after swelling, respectively, and ρr and ρs are the density of the SBR and the toluene solvent (0.867 g cm−3). With the known values of ms, md, ρp and ρs, the values of Qr can be obtained. Similarly, the equilibrium volume swelling (Qr) results of filled SBR composites can be calculated using the respective ms (mass of swollen composite), md (mass of dried composite), ρr (density of the composite), and ρs (density of solvent) values.
Results and discussion
Preparation and characterization of silica–graphite filler
Silica–graphite (SiG) filler was prepared by two-step surface coating process as discussed in the “Experimental” section. In the present step, silica aggregates were functionalized with ICPTES followed by grafting onto the expandable graphite surface in the second step. The nature of chemical interaction present between the silica and graphite was determined using FTIR spectra. Figure 1(a) showed the FTIR spectra of pristine silica (SiO2), silane-coated silica (Si-NCO) and silica-graphite (SiG) fillers. Pristine silica (SiO2) powder showed major IR vibrations at 3400, 1640, and 1090 cm−1 that correspond to the stretching and bending vibrations of –OH groups and Si–O stretching of Si–O–Si groups. 32 ICPTES functionalization of silica particles (Si-NCO) resulted in the appearance of peaks at around 2945 and 2855 cm−1, which are corroborated to asymmetric and symmetric stretching of –CH2 groups revealing the successful grafting of silane on the silica surface (Si-NCO). This fact is further confirmed from the significant rise in the peak intensity at 1090 cm−1 (Si–O–Si stretching) with drastic decrease in the peak corresponding to the –OH bending vibration (1640 cm−1) along with the appearance of new peak (1455 cm−1) that corresponds to the –CH2 bending vibrations. Grafting of isocyanato propyl triethoxy silyl propyl isocyanate group on the silica surface was further corroborated to the appearance of the new small peak at around 2280 cm−1 (–NCO groups). 33 Complete disappearance of the –NCO peak (2280 cm−1) with the significant rise in the peak intensity corresponding to the –C=O group (1738 cm−1) for SiG samples revealed the formation of urethane linkages corroborating the successful grafting of silica aggregates onto the expanded graphite surface. 33 The possible formation mechanism of silica aggregates grafted onto the expanded graphite shell is included in Figure 1(b). The nature of chemical interaction present between the silica aggregates and graphite was further examined using XPS characterization and the results are displayed in Figure 2(a) and (b). Survey scan results of the silica (SiO2) showed three characteristic peaks at 101 eV (Si2p), 149 eV (Si2 s), and 531 eV (O1 s), which revealed the presence of silicon and oxygen atoms. 34 ICPTES functionalization of silica (Si-NCO) followed by its grafting onto graphite surface (SiG) resulted in the appearance of new peaks at 285 eV (C1 s) and at 400 eV (N1 s) along with the peaks corresponding to the silicon (Si2p and Si2 s) and oxygen (O1 s) atoms. To understand the functional groups present in the silica (SiO2), ICPTES-modified silica (Si-NCO), and graphite-grafted silica (SiG), deconvolution of high resolution spectra (C1 s, O1 s, N1 s, and Si2p) was carried out and the results are included in Figure 2(b) and Online Supplementary Figure S1. Deconvolution of the Si2p spectra of pristine silica showed two peaks that are corroborated to Si–O (102.4 eV; approximately 96%) and Si–OH (104.3 eV; approximately 4%) groups. This fact is further corroborated by the appearance of peaks at 532.8 eV (O–Si, approximately 90%) and 533.4 eV (Si–OH, approximately 10%) in deconvoluted O1 s spectra of silica particles (Online Supplementary Figure S1). In contrast to the pristine silica, deconvolution of Si2p spectra of silane-coated silica aggregates (Si-NCO) showed three peaks at 101.3 eV (SiC, approximately 9.2%), 102.1 eV (Siloxane, 42.9%), and at 103.7 eV (Si–O group of SiO2, 38%) corroborating the successful grafting of silane on the silica surface (Online Supplementary Figure S1). This fact is confirmed by the appearance of peaks at 530.7 eV (O=C, approximately 1%) and at 533.1 eV (O–Si, approximately 99%) in deconvoluted O1 s spectra of Si-NCO samples (Online Supplementary Figure S1). Grafting of ICPTES is further revealed from C1 s and N1 s spectra of Si-NCO samples (Online Supplementary Figure S1). High resolution C1 s spectra of Si-NCO showed four peaks, which are attributed to C–C/C–H (284.6 eV, approximately 76.2%), C=N (285.2 eV, approximately 4.3%), C–N (286.6 eV, approximately 9.5%), and C=O (288.7 eV, approximately 9.9%). 35,36 This fact is further corroborated by the appearance of peak at 398.8 eV, which is revealed by the appearance of C=N–C group in N1 s spectra of Si-NCO samples (Online Supplementary Figure S1). 37 Successful formation of silica aggregates-grafted graphite (SiG) is revealed from the deconvoluted spectra of Si2p, O1 s, C1 s, and N1 s peaks as displayed in Figure 2(b). From Figure 2(b), it is clearly evident that there is no significant variation in Si2p (SiC, 5.1%; Siloxane, 36.9%, and SiO2, 58%) of SiG samples, when compared to Si-NCO samples. Alternatively, deconvolution of O1 s peaks of SiG samples showed three peaks, which are attributed to C=O peaks (531 eV, approximately 7.4%), Si–O (533 eV, 81%), and C–O–C peaks (533.6 eV, 11.6%) corroborating successful grafting of silica aggregates on the graphite surface. Deconvolution of C1 s spectra of SiG showed three characteristic peaks, which are corroborated to C–C/C–H (284.4 eV, 84.0%), C–N (286.4 eV, 8%), and COO (288.8 eV, 8%) revealing the formation of urethane linkages between graphite and Si-NCO samples. This fact is further revealed by the appearance of two peaks in deconvoluted N1 s spectra at 398 5 eV (C–N–C) and at 401.2 eV (N–H) of SiG samples. 35 –37
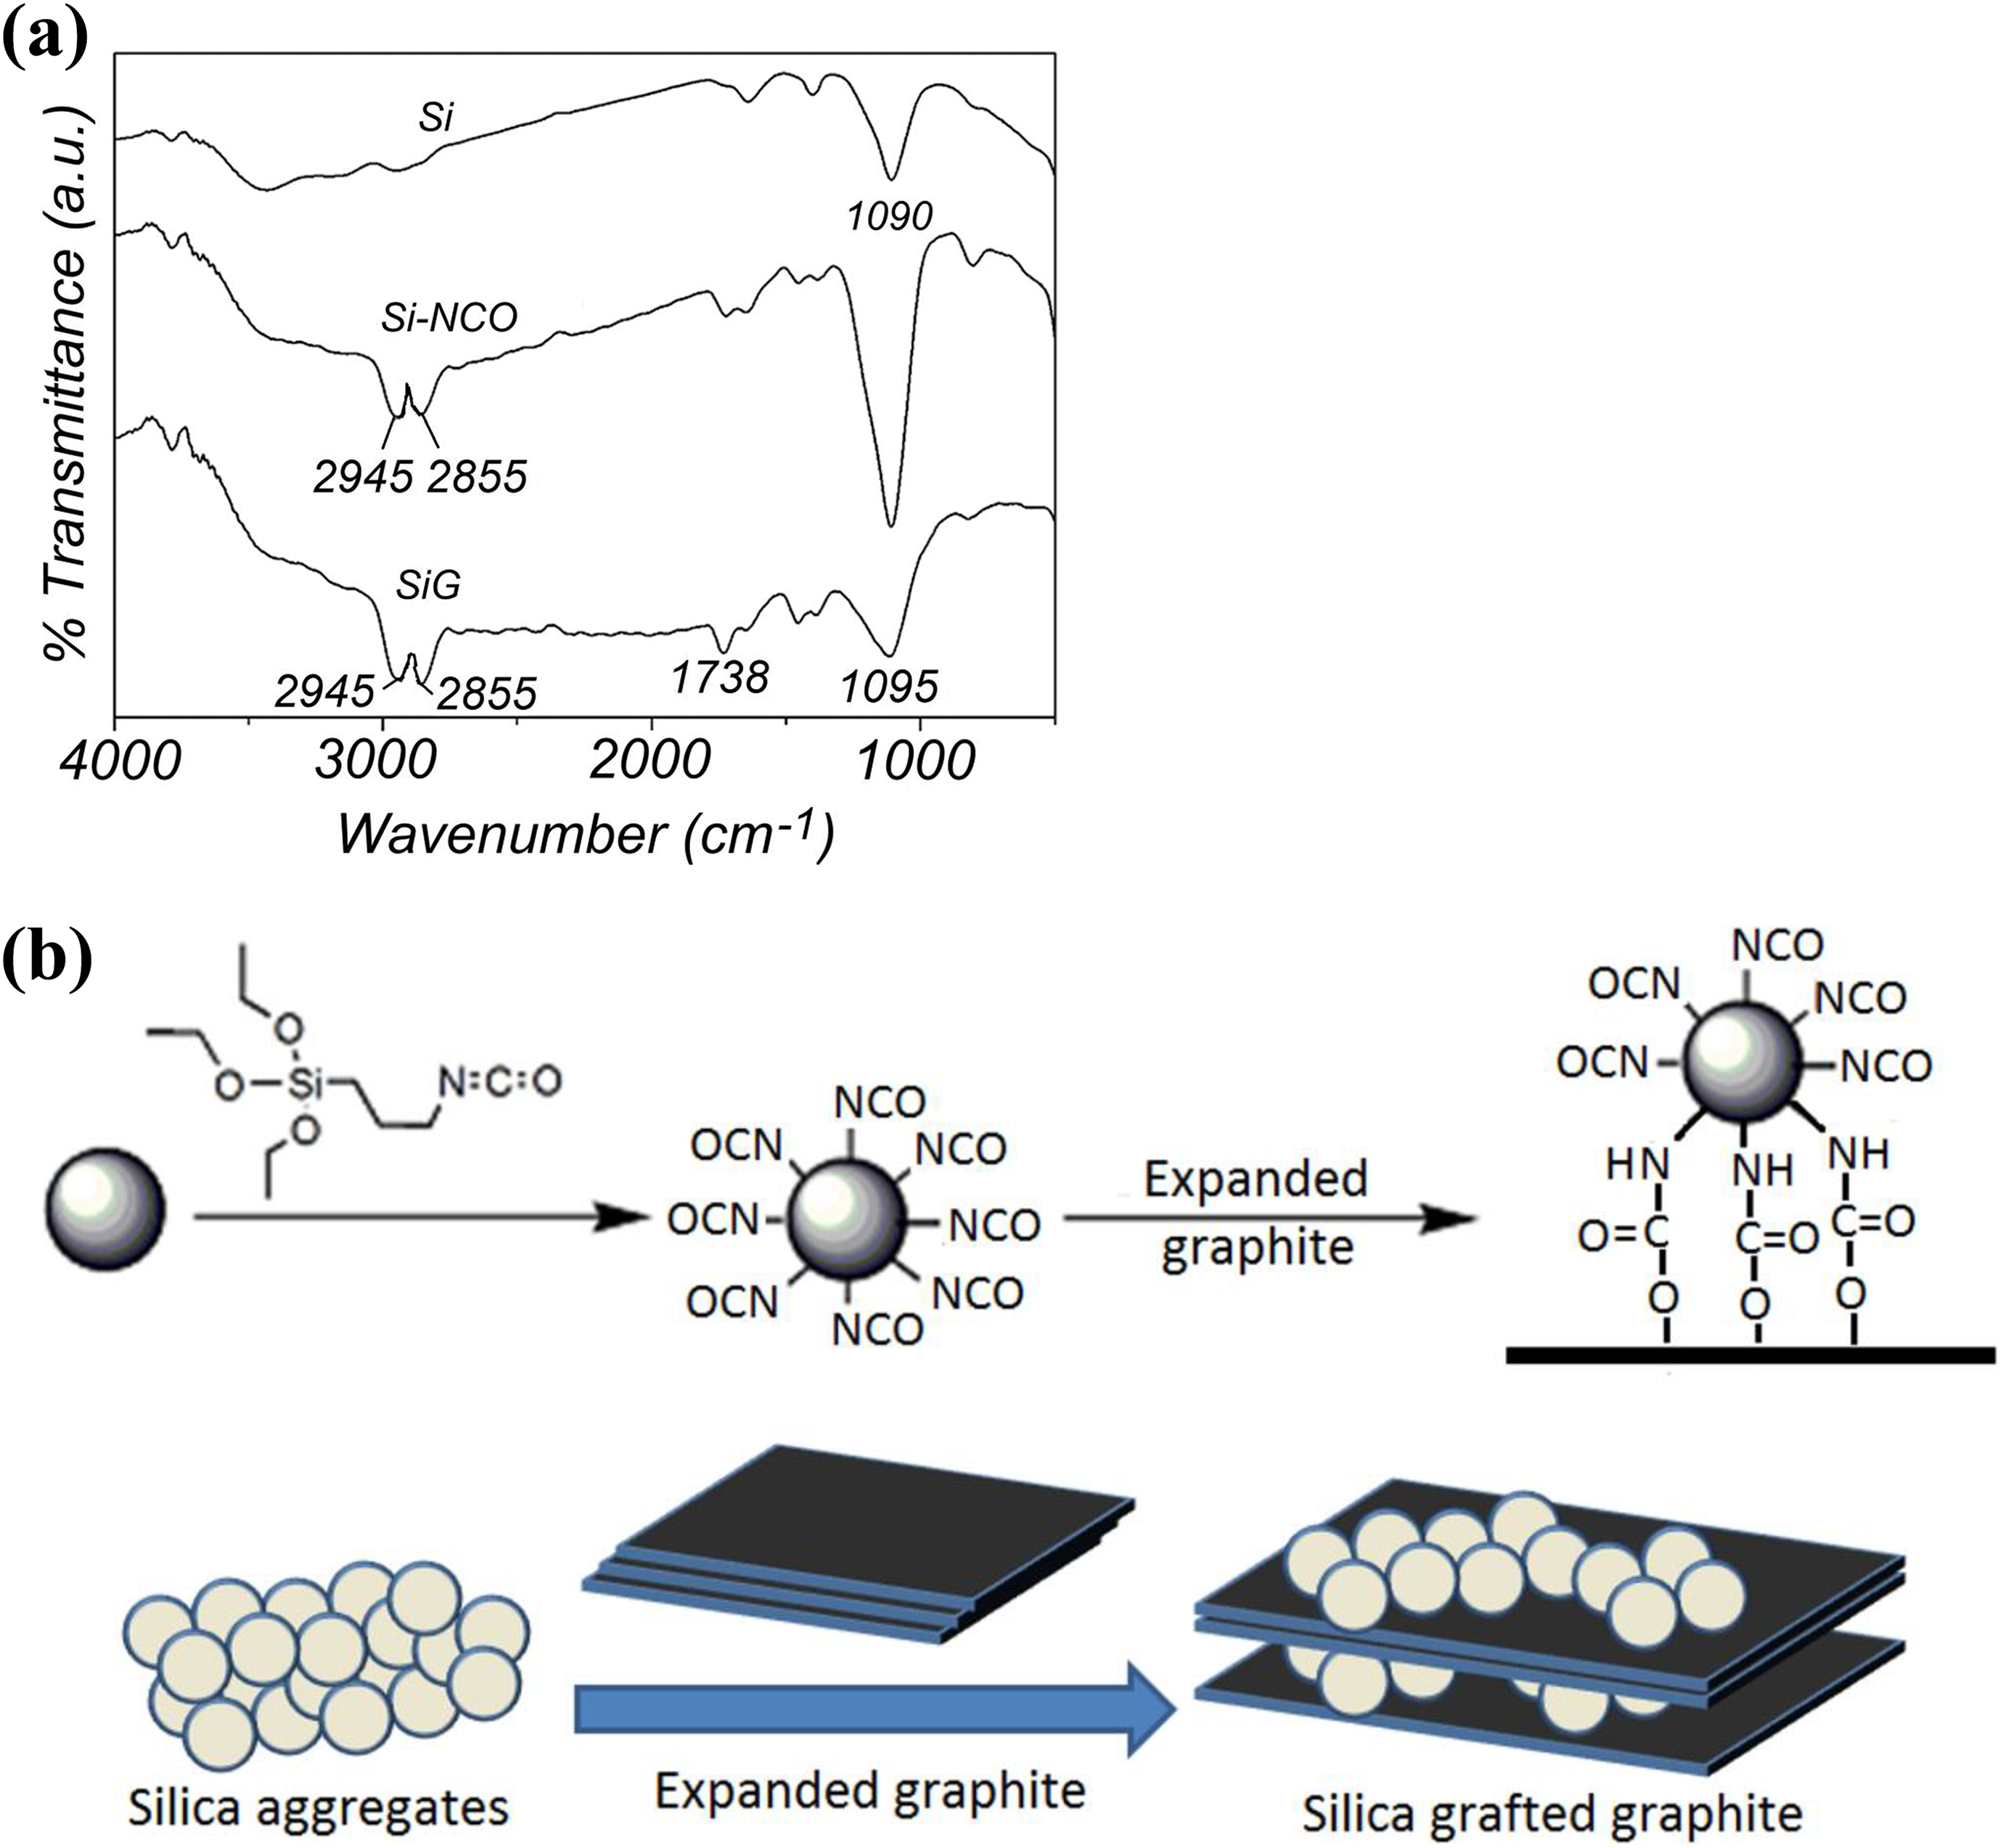
(a) FTIR results of silica (Si), silanized silica (Si-NCO), and silica–graphite fillers (SiG); (b) schematic representation of graphite-grafted silica aggregates. FTIR: Fourier transform infrared.
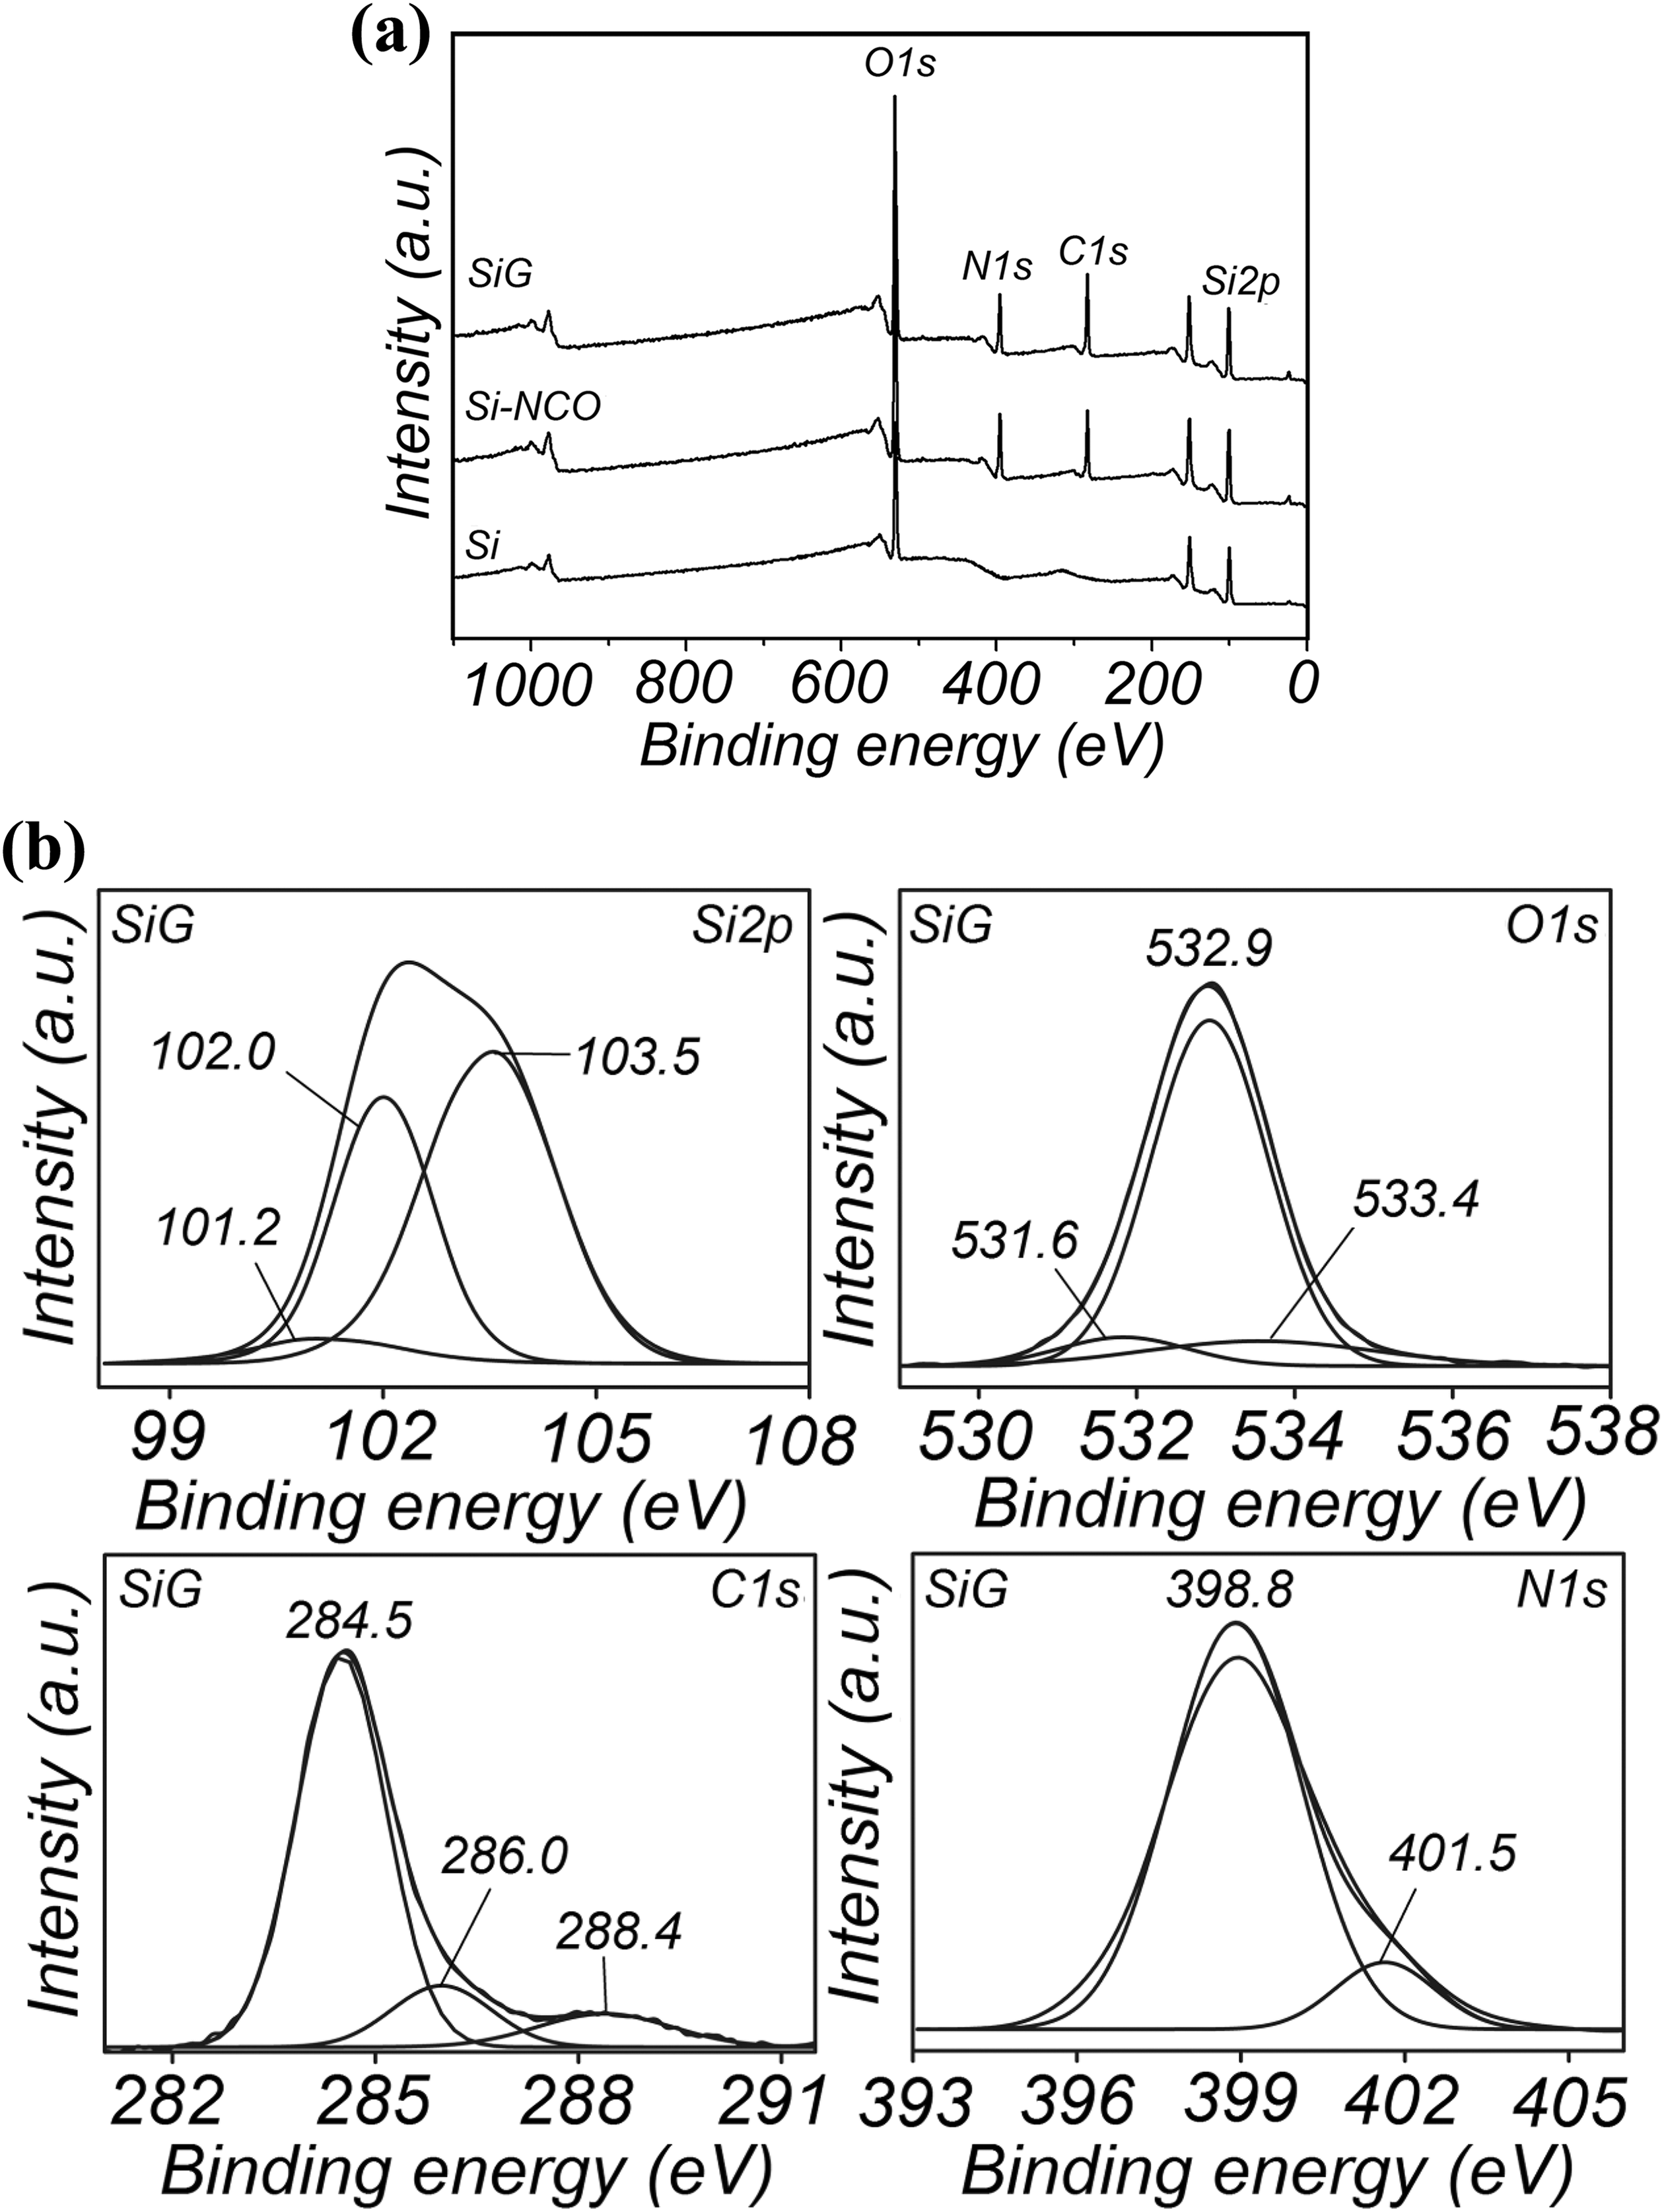
(a) XPS survey scan results of silica (Si), silane-coated silica (Si-NCO), and silica–graphite fillers (SiG); (b) high resolution XPS results of silica–graphite (SiG) filler. XPS: X-ray photoelectron spectroscopy.
XRD patterns of pristine silica (SiO2), silane-coated silica (Si-NCO), and graphite-coated silica aggregates (SiG) are displayed in Figure 3. The amorphous nature of the silica (Si) is corroborated by the appearance of two broad peaks (2θ = 16° and 30°) (Figure 3). In contrast, single broad peak at 2θ = 21.4° is observed in silane-coated silica samples (Si-NCO) revealing its amorphous nature (Figure 3). Alternatively, silica–graphite filler (SiG) exhibits a sharp peak at 2θ = 26.6° (002 peak of graphite crystals) along with a small hump at 2θ = 21° (Si-NCO amorphous peak) corroborating the grafting of silica aggregates onto the expanded graphite. Average d-spacing values of the graphite in SiG samples calculated using XRD is observed to be 3.35 Å. Thermal stability of pristine silica (SiO2), silane-coated silica (Si-NCO), and graphite-grafted silica aggregates (SiG) was determined using TGA and the results are shown in Figure 4. No major degradation step is observed for pristine silica (SiO2) samples in the selected temperature range (Figure 4). Alternatively, major weight loss (approximately 8%) in the temperature range of 150–300°C for Si-NCO samples corroborated the thermal degradation of the grafted silane molecules. Alternatively, significant reduction in the thermal degradation (approximately 4%) is observed on grafting the silica aggregates onto the expanded graphite (SiG), when compared to the silane-coated silica (Si-NCO). This fact can be attributed to the presence of the unreacted silane moieties in SiG as shown in the schematic representation (Figure 1(b)), which undergo degradation in the selected temperature range. Relative decrement in the degradation values is corroborated to the partial grafting of silane-coated silica (Si-NCO) with graphite shell as shown in the schematic representation (Figure 1(b)).
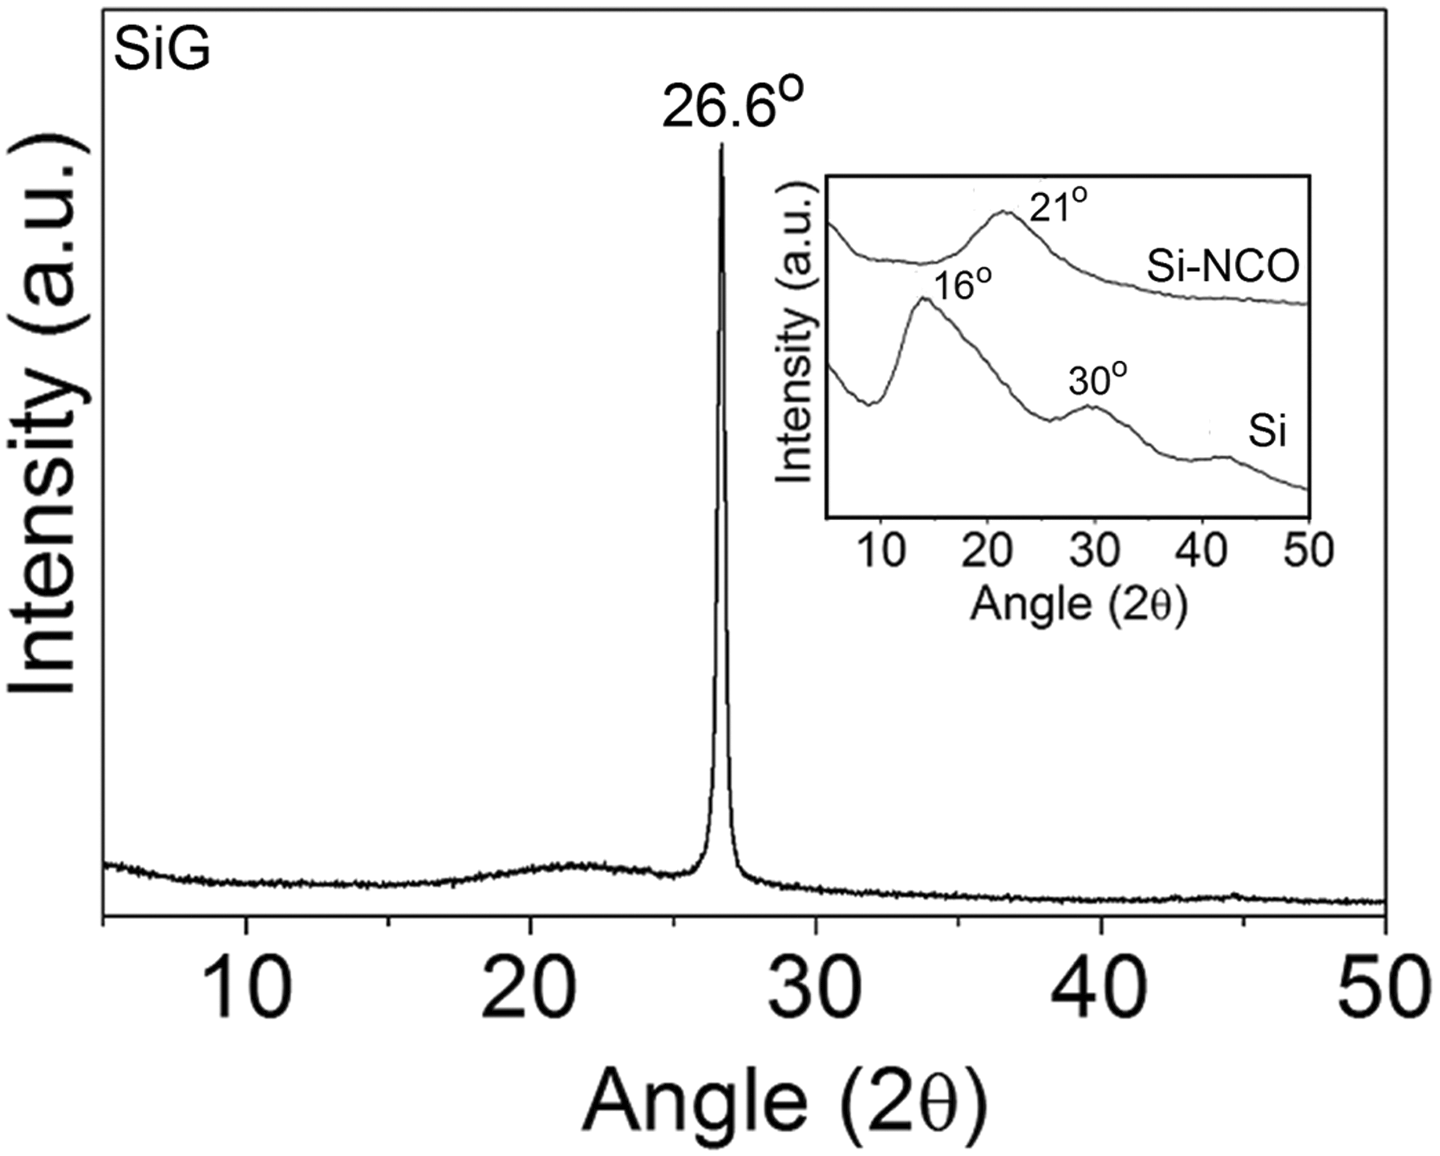
XRD results of silica and silica–graphite (SiG) filler. XRD: X-ray diffraction.
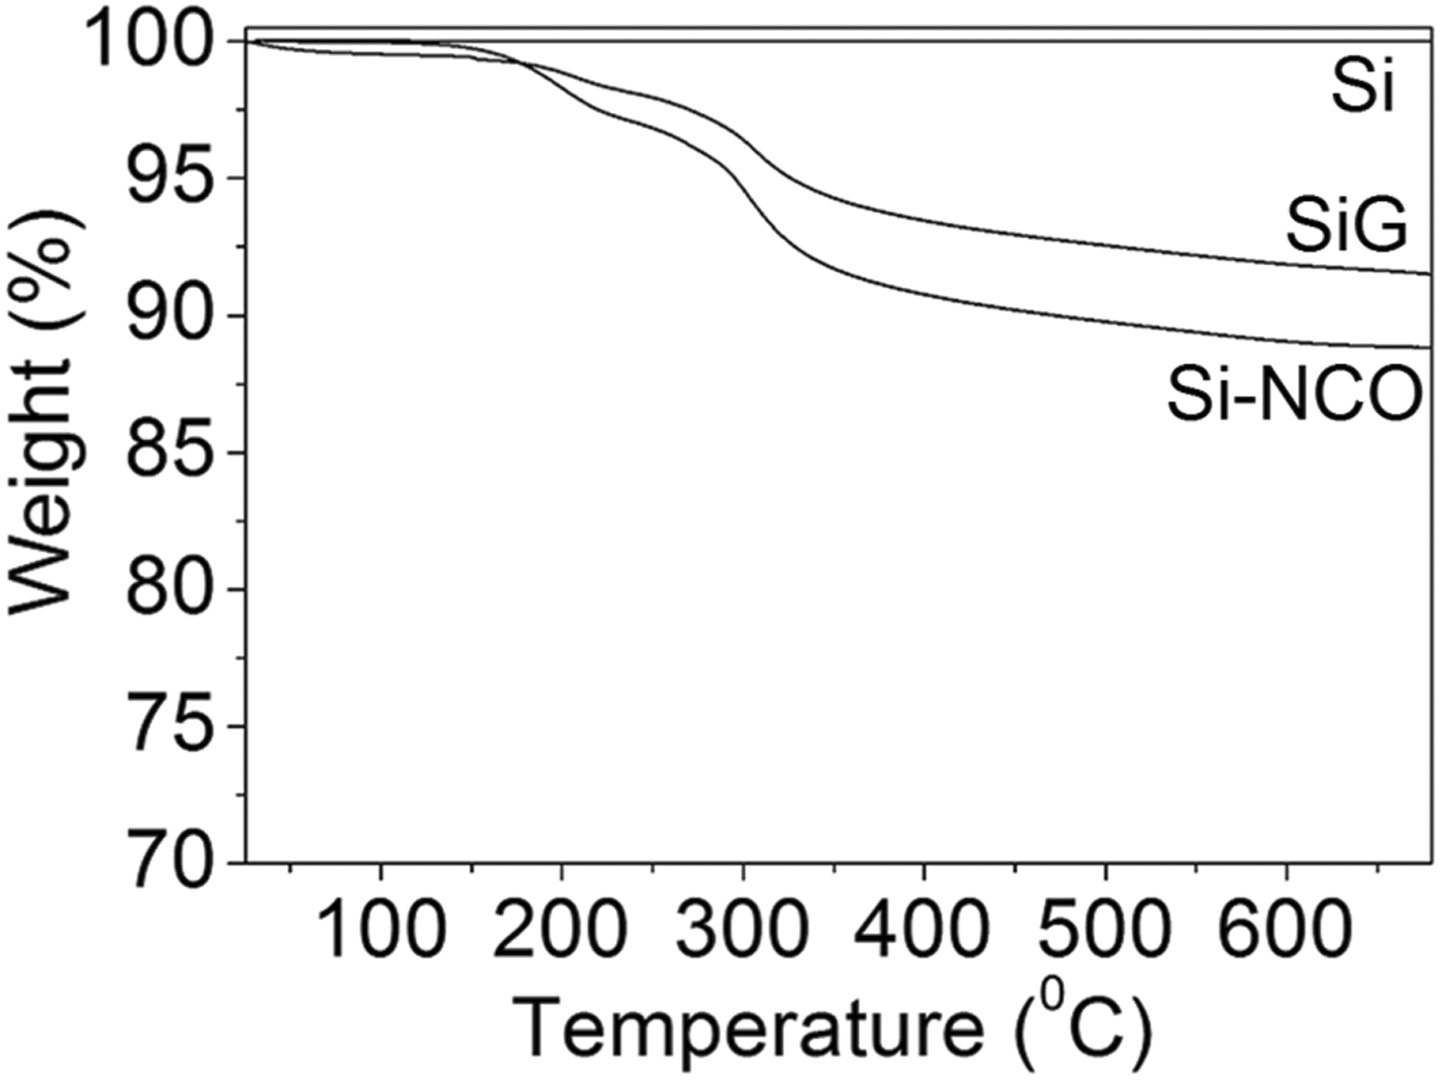
TGA results of silica and silica–graphite (SiG) filler. TGA: thermogravimetric analysis.
Morphological characterization of pristine silica (SiO2), silanized silica (Si-NCO), and graphite-coated silica aggregates (SiG) was done using TEM and the representative images are displayed in Figure 5 and Online Supplementary Figure S2. Pristine silica (SiO2) consists of silica particles (average particle sizes of 5–10 nm), which are fused together forming 3-D aggregate structure (Figure 5(a) and (c) and Online Supplementary Figure S2(a)). Grafting of the silane on silica (Si-NCO) aggregates does not lead to any major morphological changes (Online Supplementary Figure S2(b)). Alternatively, successful grafting of silica aggregates onto the graphite shell is corroborated by the presence of thin graphene layer in SiG samples (Figure 5(b) and (d) and Online Supplementary Figure S2(c)).
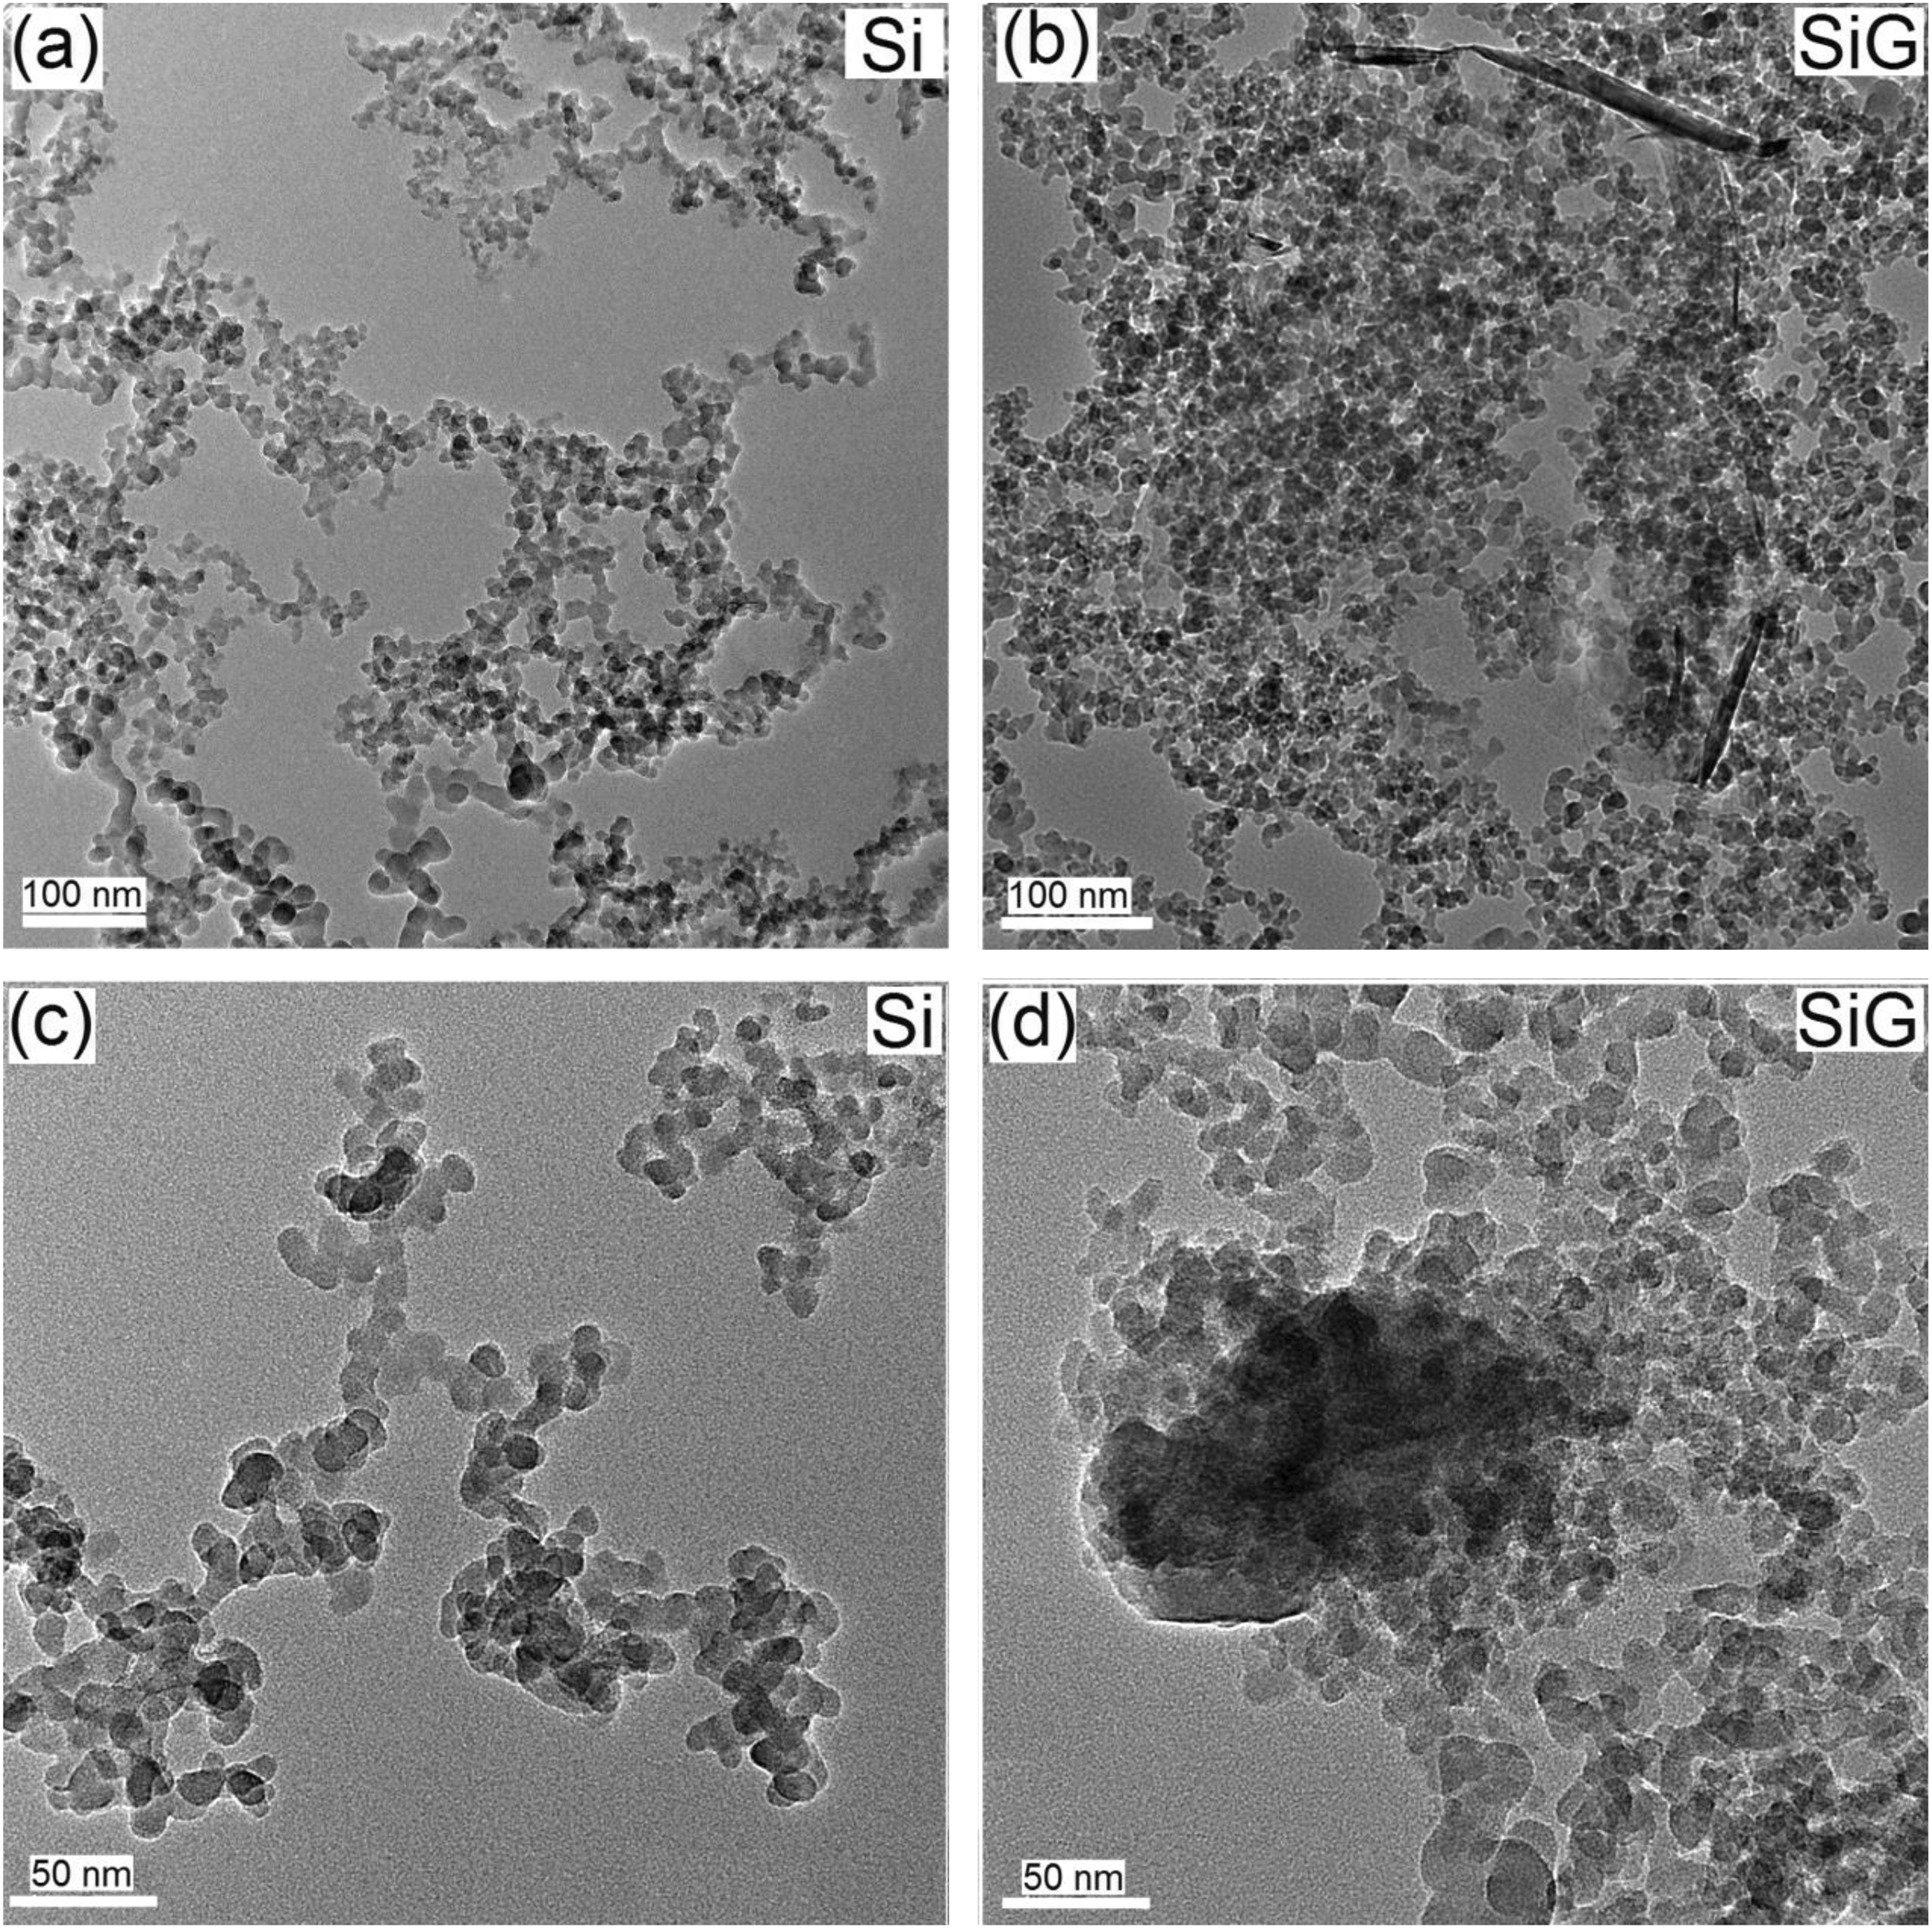
TEM results of silica and silica–graphite (SiG) filler. TEM: transmission electron microscopy.
Table 1 showed BET surface area results of the pristine silica (SiO2) and silica aggregates grafted onto graphite (SiG). As expected, grafting of silica aggregates onto graphite (SiG) resulted in 31% decrease in BET surface area and 214% increase in average pore size. Decrease in surface area and increase in pore size are attributed to the grafting of the silica aggregates onto the graphite layers, thereby reducing the N2 adsorption concentration onto silica aggregates.
Preparation and characterization of pristine (Si) and silica–graphite filler-loaded SBR composites
Pristine (SiO2) and silica aggregates-grafted graphite (SiG) samples were loaded in SBR at loading amounts according to the rubber compounding formulations to understand its reinforcing effect (Table 2). Conventional sulfur vulcanization depicting polysulfidic linkages between the SBR polymer chains is used in the present study to understand the impact of modified silica in the curing process
Bound rubber measurements
The presence of insoluble rubber fraction around the silica aggregates, which is often interpreted as bound rubber content, is usually correlated to the elastomer–filler adhesion. SBR masterbatches (without accelerator and sulfur loading) filled with silica or SiG fillers were prepared as per mixing formulation (Table 2) to determine the bound rubber content. A notable rise in bound rubber content (insoluble rubber fraction) is observed for silica–graphite filler-loaded SBR composites (SSiGX), when compared to pristine silica-filled system (SSiX) (Figure 6). For instance, 20 phr loading of silica–graphite filler results in 20% increment in bound rubber content, when compared to the pristine silica-filled SBR vulcanizates. It is reported that bound rubber content assessment is an indirect method to study the elastomer–filler interactions. 38,39 The bound rubber content depends on the characteristics of filler such as surface area, structure or morphology, porosity, and surface activity. Higher bound rubber content for silica–graphite filler-loaded SBR vulcanizates corroborated to the significant rise in porosity and elastomer–filler interaction, when compared to pristine silica-loaded system. As expected, bound rubber content rises steeply up to 20 phr of filler loading both in the case of pristine silica and silica–graphite-loaded SBR vulcanizates, whereas change in the bound rubber value is less significant at higher filler loadings (Figure 6). While, the fine dispersion of silica–graphite fillers plays a vital role in the rise of bound rubber content of up to 20 phr loading, formation of SiG clusters in the SBR matrix at higher loading amount does not lead to the rise in the bound rubber content.
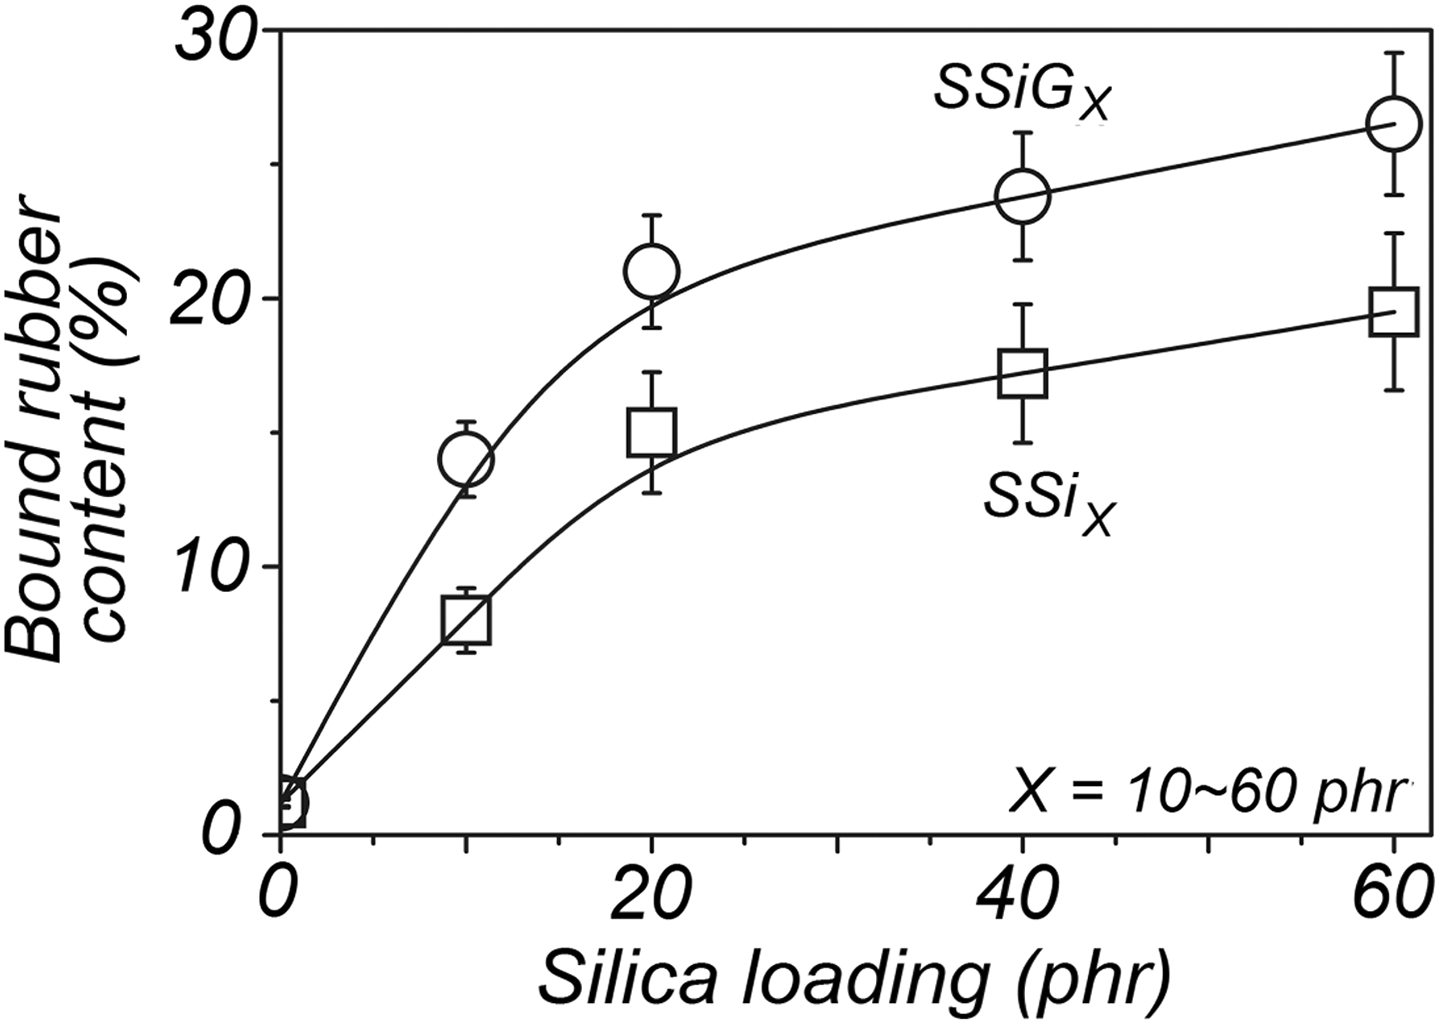
Variation in bound rubber content with filler loading of SBR composites. SBR: styrene–butadiene rubber.
Rheometric properties of pristine (SiO2) and silica–graphite (SiG) filler-loaded SBR vulcanizates
SBR composites filled with pristine silica (SSiX) or silica–graphite filler (SSiGX) were prepared using mixing formulation (Table 2) by melt mixing in a two-roll mill. The rheometric properties of unfilled SBR (S0), SSiX, and SSiGX measured at 150°C are included in Figures 7 and 8. The vulcanization properties such as minimum torque (ML), maximum torque (MH), torque difference (ΔS = MH − ML), scorch time (tS2), and optimum cure time (t90) of the unfilled SBR (S0), 20 phr pristine (SSi20), and silica–graphite filler-loaded SBR vulcanizates (SSiG20) are displayed in Figure 7. Loading pristine silica (SSi20) resulted in a significant increase in ML value, when compared to unfilled SBR, corroborating filler aggregation in the matrix. Alternatively, loading of silica–graphite filler in SBR (SSiG20) resulted in a slight decrease in ML value in comparison to pristine silica-filled system (SSi20) corroborating a decrease in filler aggregation (Figure 7). ΔS, which is a measure of the dynamic shear modulus that indirectly reveals the interfacial adhesion in the system, increases for silica-filled SBR vulcanizates, and this effect becomes even more pronounced when silica–graphite filler are loaded in the matrix. For instance, ΔS increases to about 50% on loading 20 phr of pristine silica (SSi20), whereas it increases to about 72% on loading 20 phr of silica–graphite filler (SSiG20) in comparison to unfilled SBR (S0) indicating a significant rise in elastomer–filler interactions. Scorch time, which is a measure of premature vulcanization (tS2), as well as the optimum cure time (t90) of the SBR vulcanizates increase, when silica is filled in the SBR, whereas a slight decrease in properties is observed on loading silica–graphite dual phase filler in the SBR matrix. Commercially available silica fillers consist of acidic –OH groups, which have the tendency to absorb basic accelerator species, thereby delaying the scorch time and optimum cure time of the SBR composites. Alternatively, the presence of urethane basic groups on the filler surface enhances the curing reaction and thereby reduces the scorch time and optimum cure time of the composites. 40,41
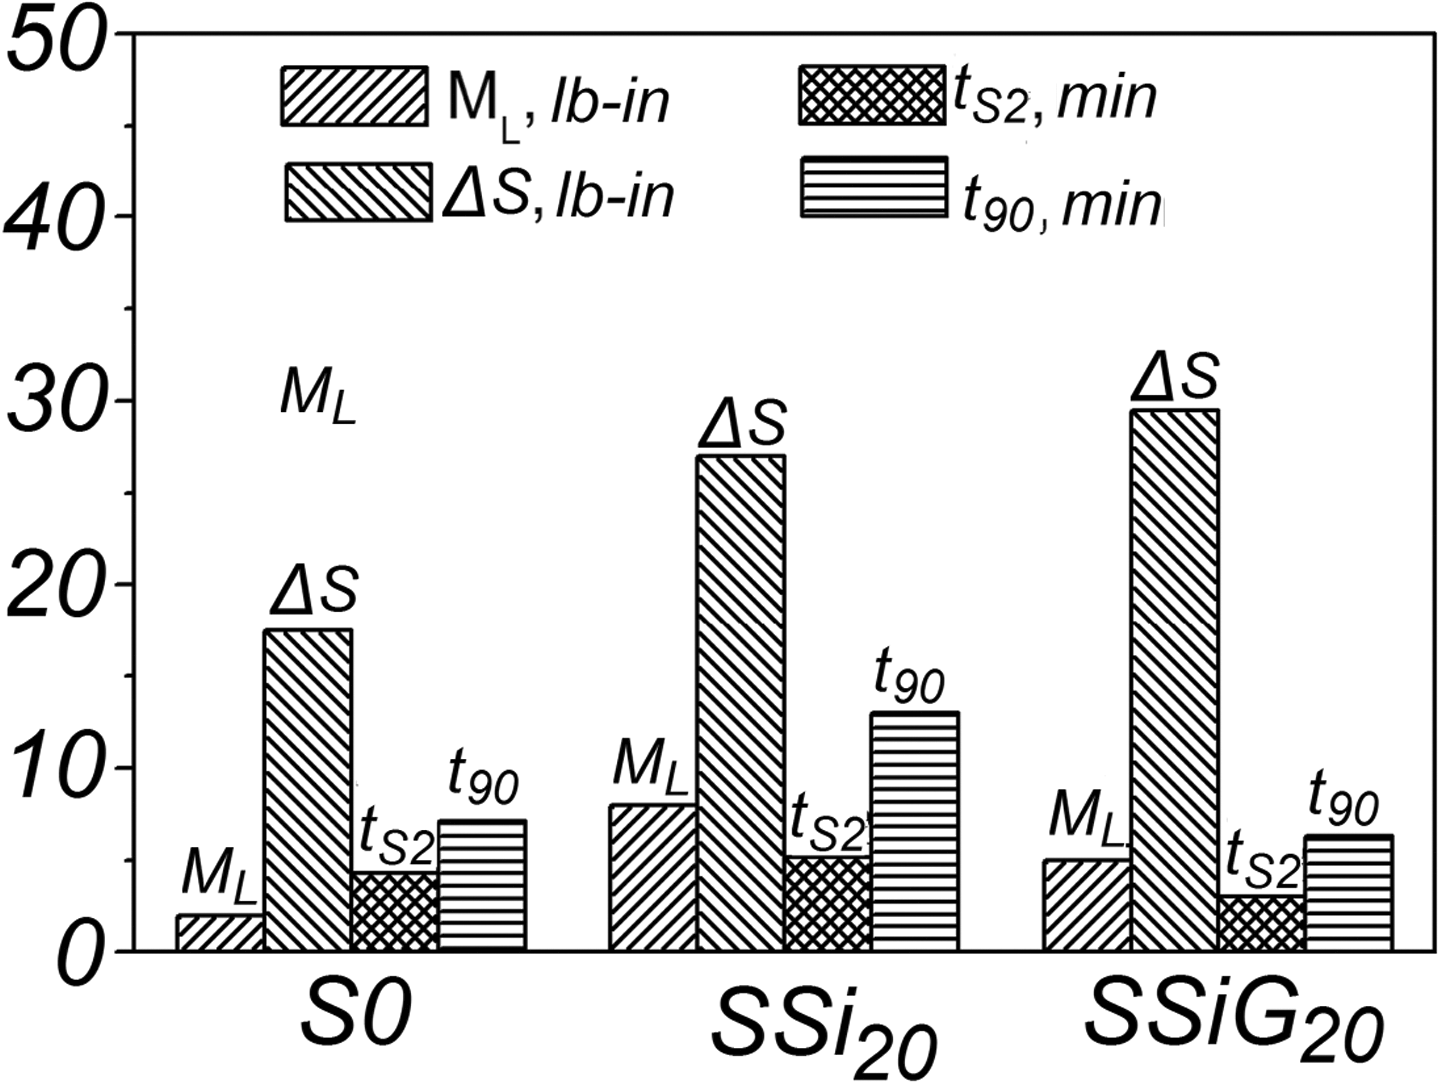
Effect of pristine silica and silica–graphite filler on rheometric properties of SBR composites. SBR: styrene–butadiene rubber.
Effect of filler loading on rheometric properties of SBR composites. SBR: styrene–butadiene rubber.
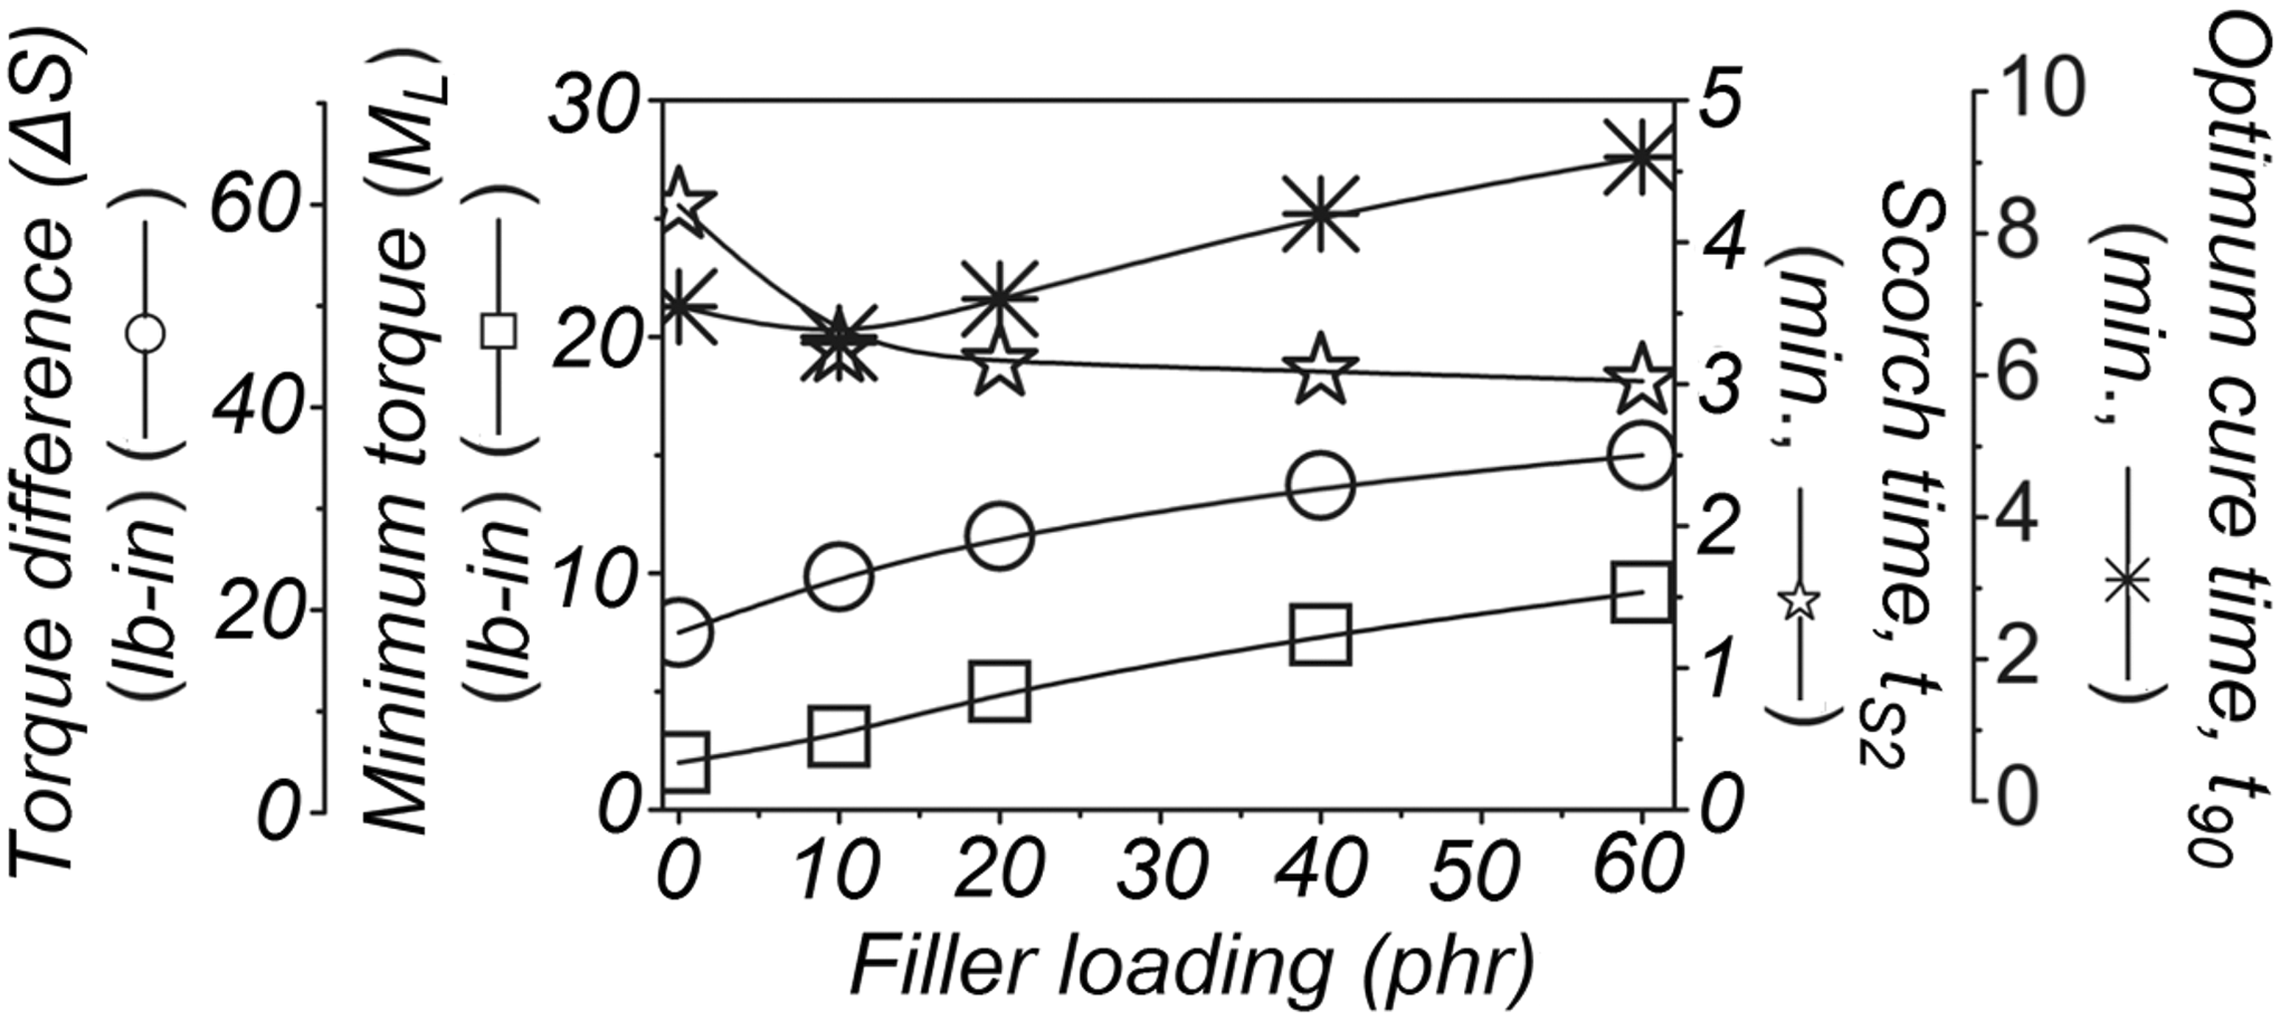
The effects of silica–graphite filler loading on the rheometric properties were investigated and the results are included in Figure 8. As expected, slight rise in rheometric properties such as minimum torque (ML), torque difference (ΔS), and optimum cure time (t90) is observed with increasing filler loading in SBR vulcanizates, without significant variation in scorch time (tS2) (Figure 8).
Mechanical properties, equilibrium swelling characteristics, and abrasion loss properties of pristine and silica–graphite filler-loaded SBR vulcanizates
Table 3 showed the variation of modulus at 100% strain, tensile strength, and elongation at break (%) of unfilled SBR and its composites at various silica and SiG loadings. The modulus at 100% strain increases significantly on loading pristine silica, and this effect is more pronounced when silica–graphite filler is loaded in the SBR matrix. For instance, stress at 100% strain (100% modulus) increases by 50% upon loading 20 phr of pristine silica (SSi20), whereas it increases to about 160% upon loading 20 phr of silica–graphite dual phase filler (SSiG20). Loading of pristine silica resulted in higher tensile strength and elongation at break values and this effect is more pronounced on loading silica–graphite (SiG) filler in comparison to unfilled SBR (Table 3). The tensile strength of the SBR vulcanizates loaded with pristine silica (SSiX) or silica–graphite filler (SSiGX) increases up to certain filler loading, whereas it remains almost constant at higher loading amount (Table 3). Significantly higher tensile strength value is observed for silica–graphite filler-loaded SBR (SSiGX) at all loading amounts, when compared to pristine silica-filled system (SSiX). For instance, about 33.5% increment in tensile strength is observed on loading 20 phr of pristine silica (SSi20), whereas 45.5% increment is noted on incorporating silica–graphite filler (SSiG20). Significant improvement in tensile properties on loading silica–graphite filler is corroborated to the higher reinforcing effect, when compared to pristine silica-filled system (Table 3). Earlier report by Ozbas et al. 42 revealed that the levels of reinforcement achieved by adding 2-D graphene nanosheets are typically higher, when compared to carbon nanotube (CNT) or clay-filled elastomers and this effect may be attributed to the geometry and aspect ratio of the graphene nanosheets along with the enhanced elastomer–filler interaction. 23,43 Considerably, higher tensile properties of SiG-loaded SBR vulcanizates in comparison to the silica-filled system is attributed to the thin layer of graphene coating on the silica aggregates (SiG), which is expected to show geometrical effect apart from enhanced elastomer–filler interaction. 42 As expected the elongation at break decreases with increasing filler loading for both silica and SiG-loaded SBR system and this fact is attributed to the unrestricted crack propagation promulgating a calamitous crack at the vicinity of the rigid silica/SiG fillers, leading to the drop in elongation at break values. 44 Relatively higher decrement in the equilibrium swelling ratio (Qr) is observed for SiG-filled SBR (SSiGX) composites in comparison to unfilled SBR or silica-filled SBR (SSiX) system. For instance, the equilibrium swelling ratio (Qr) decreases to about 22% for the SSi20 system and 27% for the SSiG20 system, when compared to the unfilled SBR (Table 3). Higher decrement in equilibrium swelling ratio (Qr) for SiG-loaded SBR is observed in comparison to silica-filled SBR corroborating enhanced filler–elastomer interaction (Table 3).
Mechanical and abrasion loss properties of silica–graphite filled SBR vulcanizates.
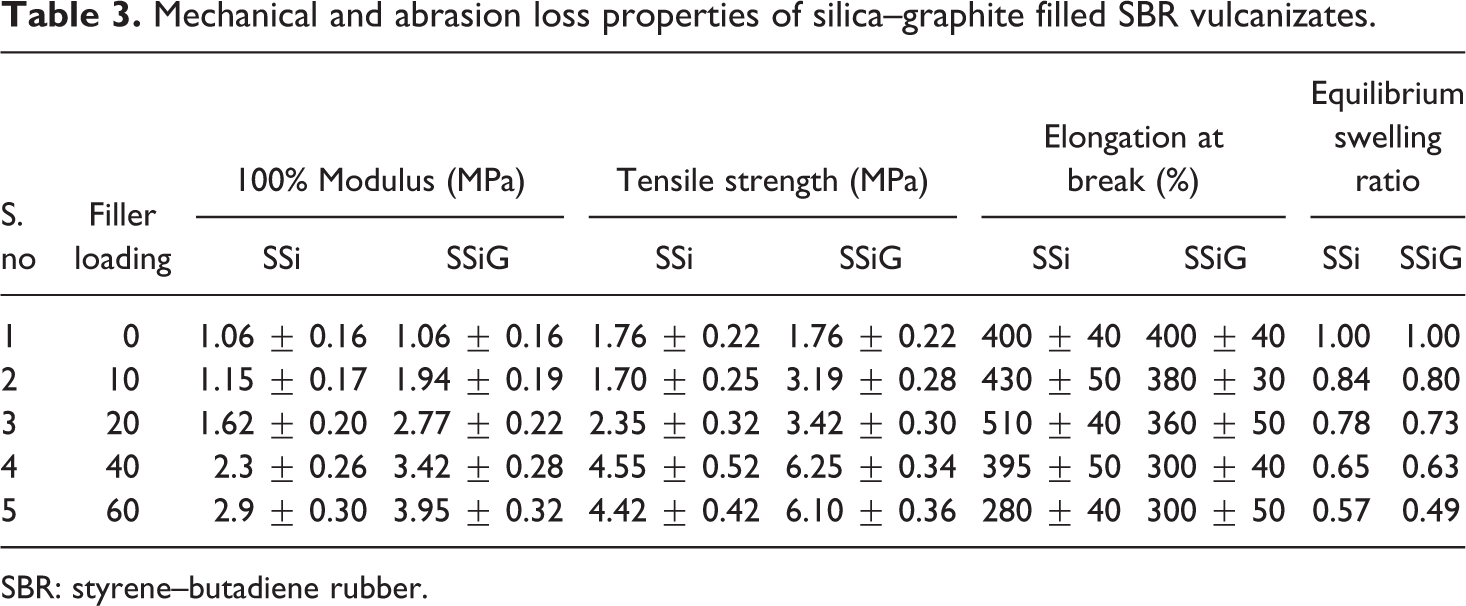
SBR: styrene–butadiene rubber.
Stronger interactions between SBR and silica–graphite (SiG) filler result in a relatively fine dispersion in the matrix as revealed by SEM results. Representative SEM images of tensile fractured SBR composites filled with 20 phr of pristine silica (SSi20) or silica–graphite filler (SSiG20) are shown in Figure 9. Partially embedded filler particles with average particle sizes as high as 5–10 µm (white circles) are observed in pristine silica-filled SBR vulcanizates (SSi20), whereas finely distributed and fully or partially embedded particles with average particle sizes of 0.1–5 µm (white circles) indicate enhanced dispersion of the functionalized silica–graphite filler in the SBR composite. We classify the few larger, white particles (yellow circles) that we observe as unreacted ZnO particles used as activators in the SBR compounding formulations.

SEM image of tensile fractured SSi20 and SSiG20 . SEM: scanning electron microscopy.
Finally, we investigated the abrasion resistance properties of representative samples (S0, SSi40, and SSiG40) and the results are displayed in Figure 10. A significant reduction in abrasion loss is observed on adding pristine silica in SBR composites (SSi40) and this effect is more pronounced on loading silica–graphite filler-loaded system (SSiG40). For instance, loading of pristine silica in SBR resulted in 32% (SSi40) decrement in abrasion loss, whereas 59% (SSiG40) decrement is observed on loading silica–graphite filler-loaded SBR system. Relatively lower abrasion loss for SSiG40 can be correlated to the improved wear resistance due to the higher elastomer–filler interactions, when compared to gum or pristine silica-filled SBR vulcanizates. 28,45
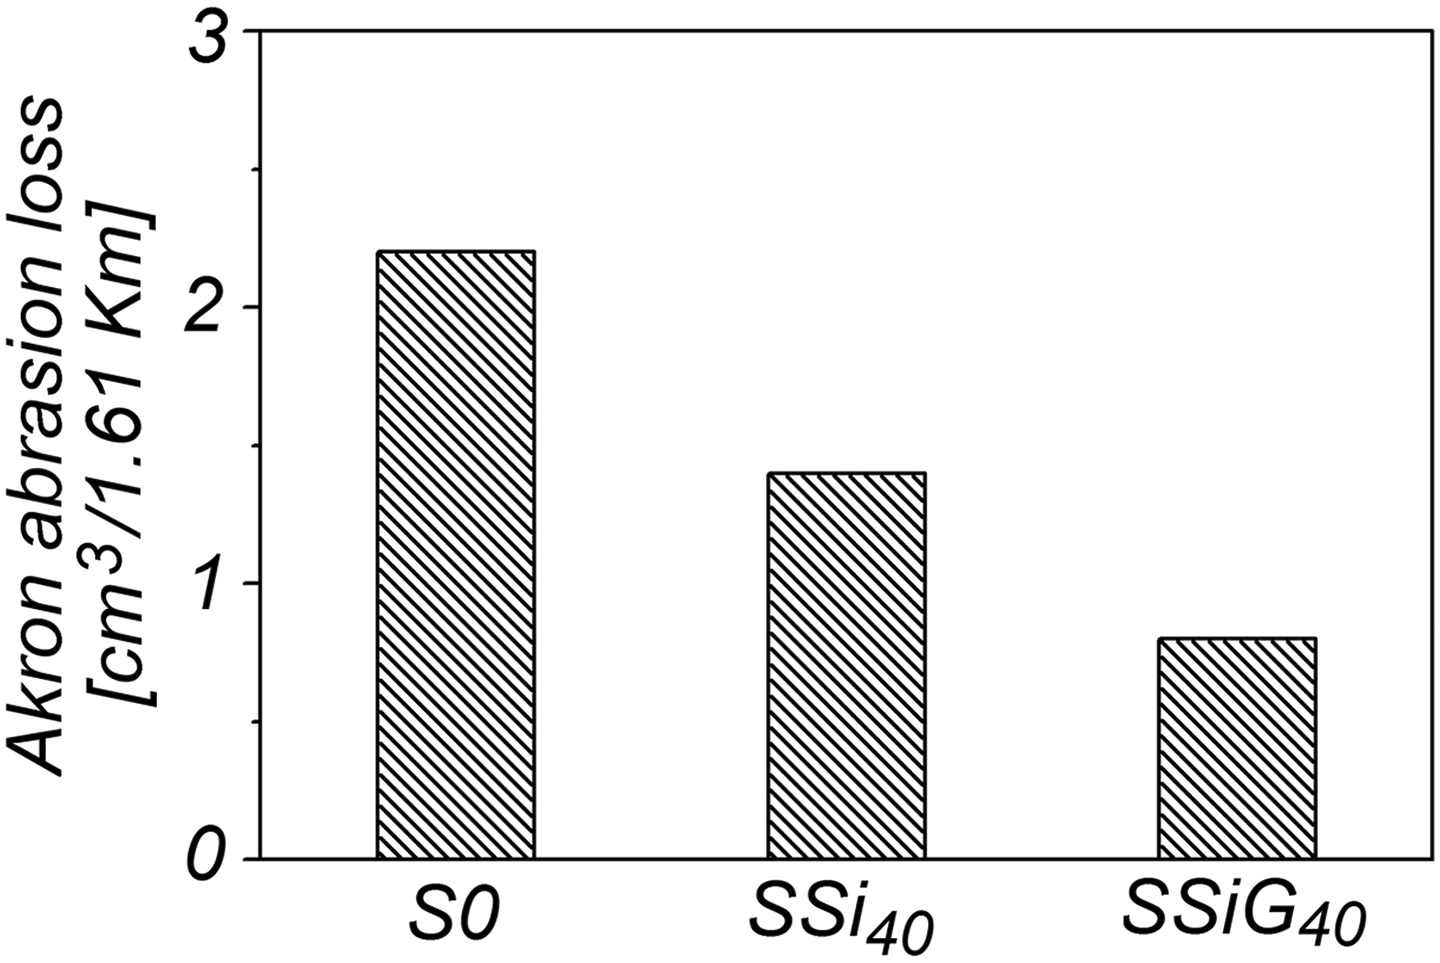
Variation in abrasion loss for unfilled SBR (S0), SSi40, and SSiG40. SBR: styrene–butadiene rubber.
Conclusions
The influence of silica–graphite (SiG) filler on the rheometric, mechanical, and abrasion loss properties of the SBR vulcanizates composites was investigated. Initially, successful coating of graphite on silica aggregates was corroborated using FTIR, XPS, XRD, TEM, and BET surface area measurements. Relative increment in the rheometric properties, namely, minimum torque (ML) and torque difference (ΔS), are observed on loading silica–graphite filler in SBR composites, when compared to the pristine silica-loaded system due to the rise in interfacial adhesion. Increment in the mechanical properties, such as the modulus and tensile strength, of the SBR vulcanizates upon filler loading is more pronounced for the silica–graphite system than for the pristine silica system due to the stronger elastomer–filler interactions in the former system along with the geometrical effect. This fact is further corroborated using bound rubber measurements of unvulcanized SBR and equilibrium swelling measurements of the cured SBR system.
Supplemental material
Supplementry_Information - Study on the effect of silica–graphite filler on the rheometric, mechanical, and abrasion loss properties of styrene–butadiene rubber vulcanizates
Supplementry_Information for Study on the effect of silica–graphite filler on the rheometric, mechanical, and abrasion loss properties of styrene–butadiene rubber vulcanizates by AM Shanmugharaj, K Thileep Kumar, G Sivagaami Sundari, E Senthil Kumar, A Ashwini, M Ramya, P Varsha, R Kalaivani, S Raghu and SH Ryu in Journal of Elastomers & Plastics
Footnotes
Declaration of conflicting interests
The author(s) declared no potential conflicts of interest with respect to the research, authorship, and/or publication of this article.
Funding
The author(s) received no financial support for the research, authorship, and/or publication of this article.
Supplemental material
Supplemental material for this article is available online.
References
Supplementary Material
Please find the following supplemental material available below.
For Open Access articles published under a Creative Commons License, all supplemental material carries the same license as the article it is associated with.
For non-Open Access articles published, all supplemental material carries a non-exclusive license, and permission requests for re-use of supplemental material or any part of supplemental material shall be sent directly to the copyright owner as specified in the copyright notice associated with the article.