
Abstract
The combination of rheological and interfacial properties is utilized in this work to explain the thermal and mechanical properties of a random polypropylene copolymer (RPP) toughened with an ethylene-propylene copolymer (EPR). RPP/EPR blends are directly prepared by injection molding. The EPR exhibits higher viscosity in comparison with the RPP over the evaluated shear rate, while the RPP/EPR blends show similar viscosities at high shear rates. The interfacial properties indicate a strong interaction between the RPP and EPR domains. Differential scanning calorimetry analyses indicate that the EPR does not act as a nucleating agent for the RPP, with the RPP crystallinity only decreasing at high EPR contents, suggesting that the EPR can modify the RPP crystallite size. Scanning electron micrographs of the blends demonstrate a ductile fracture surface, indicating that EPR can increase the RPP tenacity. The RPP impact strength is improved by up to 102% in the RPP/EPR 90/10 wt.% blend, while the RPP deformation at break is increased from 183% to 246% after the incorporation of 10% EPR. The tensile strengths of the RPP and RPP/EPR blends are very similar, indicating that the RPP achieves a good balance between stiffness and toughness after being blended with the EPR.
Keywords
Introduction
Polypropylene (PP) is one of the most important materials employed in manufacturing, with widespread usage in appliances 1 and automobile components 2 as a result of its low density, low cost, easy processability, recyclability, and diversification of applications. 3 Depending on its polymerization mechanism, PP can be categorized into three distinct types: PP homopolymers, heterophasic PP copolymers (isotactic PP homopolymer matrices with ethylene-propylene copolymer (EPR) as a dispersive phase), and random PP copolymers (RPPs).
RPPs are a special type of propylene copolymer that is obtained from the random copolymerization of PP with olefins, such as ethylene and 1-butene. 4 The comonomer weight fraction is usually ∼ 1–7 wt.% and based on aspects such as employed catalysts, polymerization process, and comonomer species, the comonomer can be presented in alternate blocks or random blocks on the polymer macromolecule. 5 –7 During the copolymerization process, the propylene chain sequence is disrupted by the incorporation of ethylene blocks, which results in a decrease in both the crystallinity and melting point of PP. 8
The RPP microstructure is heterogeneous, exhibiting both crystalline and amorphous domains. The crystalline fraction is responsible for the rigidity and impact strength of RPPs, while the amorphous fraction controls the optical properties. 7,9,10 In comparison with commodities such as polyethylene terephthalate, polyamides, polyoxymethylene, and polycarbonate, RPPs are cheaper and also possess a good cost-effective relationship. 8 RPPs exhibit good impact strength above 0ºC 11 (in contrast to PP homopolymers) and also show both good heat and aging resistance, 12 as well as transparency, allowing them to be used in applications such as film and rigid packing, 13 pipe systems, 14 automobile parts, and furniture, 15 as well as sanitary applications. 16
However, RPP presents some drawbacks mainly related to its toughness at lower temperatures. The glass transition of RPP is ∼ 4ºC, 17 which hinders its application at low temperatures (close to 0ºC) due to it becoming fragile 9,10,18,19 and prone to stress-induced cracking. 20 An interesting route for improving the low impact resistance of RPP is the incorporation of impact modifier additives during processing, which can potentially increase their impact strength and, concomitantly, their toughness-modulus balance. Ren et al. investigated the modification of the mechanical properties of RPPs by varying the olefin block copolymer (OBC) content from 0–20 wt.%. 18 The effectiveness of the OBC as an impact modifier for the RPPs was evaluated at 0 and 23ºC. The addition of a low OBC content (e.g. 10 wt.%) even at low temperatures, drastically increased the impact strength of the RPPs (from 28.2 to 85.5 kJ/m2 at 23ºC and from 6.44 to 60.2 kJ/m2 at 0ºC).
The improvement of polymer toughness by the incorporation of elastomeric particles during the processing step is one of the most important and employed routes in the development of polymers with superior impact absorption. 19 This route is very useful to toughen brittle polymers, since the presence of rubber particles dispersed over the polymer matrix could introduce large deformation during the fracture process, thereby improving the polymer tenacity. 21 This physical mixture is also known as polymer blending, which is a very attractive route to modify and improve the mechanical and processing characteristics of polymers, consisting of melt mixing a polymer matrix (major phase) with another polymer (minor phase). 22 Consequently, the new material acquires some characteristics of each polymer, achieving better cost/performance balance, besides reducing the cost of the original polymer. 23
The morphology and properties of a polymer blend, mainly the mechanical properties, are controlled by interfacial tension, phase composition, the viscosity ratio, type of flow and the processing parameters 24 (such as shear rate and total strain). 25 The combination and tailoring of all these parameters are fundamental to achieve the proper performance required for the application of the material. The interfacial tension is usually evaluated (by contact angle or rheological measurements) because this parameter is a strong indicator of the affinity degree of the polymer blend components and is useful to infer whether a blend could achieve sufficient mechanical properties, especially in terms of improving the polymer toughness. 26 Unfortunately, only estimation of the interfacial tension is not sufficient to predict the possible formed microstructure of a binary blend during the processing. Rheological parameters, such as the viscosity of each blend component and the viscosity ratio, are valuable assets for determining the possible microstructure for the polymer blend. This information allows us to infer, for instance, the particle size homogeneity, as well as if a blend could exhibit co-continuous or sea-island microstructures.
In previous studies, 27,28 we investigated the relationship between the rheological and interfacial properties for polymer blends with average to high elastomer contents. The results indicated good agreement between the expected mechanical behavior (predicted by the relation between rheological and interfacial properties) and the experimental mechanical behavior of the polymer blends. In this study, we seek to evaluate the relationship between the interfacial and rheological properties for predicting the mechanical properties of polymer blends with very low elastomer contents using a RPP as the matrix and an EPR as a toughening agent.
Experimental
Materials
The RPP (density of 0.902 g/cm3 and melt flow index (MFI) of 87 g/10 min 1 at 230ºC and 2.16 kg) and EPR (density of 0.862 g/cm3 and MFI of 20 g/10 min at 230ºC and 2.16 kg) were both donated by Sanremo S.A.
Preparation of PP/EPR blends
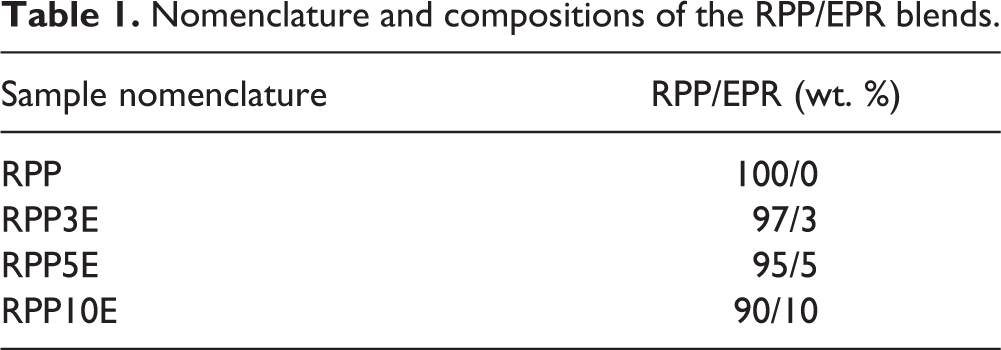
RPP/EPR blends were prepared by varying the EPR contents from 0% to 10%, as displayed in Table 1. The RPP and EPR were physically dispersed and mixed in an industrial mixer for solid polymers at 80 rpm for 2 min.
Nomenclature and compositions of the RPP/EPR blends.
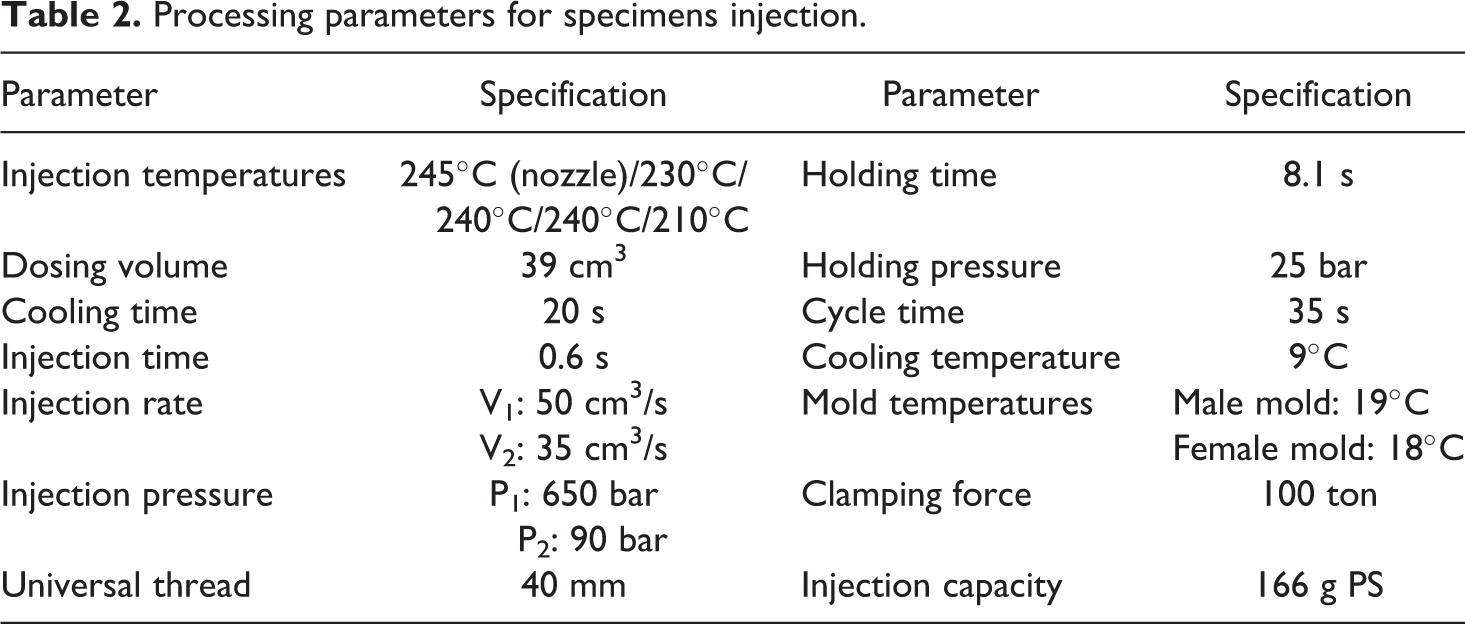
After the initial mixing, the polymer blends were prepared by injection molding in an Airburg injector (model 420). The injection parameters are given in Table 2.
Processing parameters for specimens injection.
Characterization
Rheological behavior of RPP/EPR blends
The viscosity (η) versus shear rate (


where “
Contact angle and surface energy measurements
The evaluation of the RPP and EPR surface properties, as well as the RPP/EPR blend interfacial properties, was carried out through contact angle measurements of the neat RPP and EPR polymers in a Phoenix Mini P10001 contact angle analyzer at 25 ºC. The sessile drop method was employed. The droplet images were captured using Surfaceware 9 software.
The Wu harmonic equation was utilized to estimate the contact angle (θ) and the total surface energy (γS) of both the RPP and EPR (Equation (3)). The test solvents were distilled water (polar (

where “

The estimation of the RPP/EPR interfacial tension (

The RPP/EPR interfacial tension at 180ºC (Equation 6) was estimated based on the modified Guggenheim equation, 30 and the data was used to support the rheological behavior of the RPP, EPR, and RPP/EPR blend:
where “
The thickness of the RPP/EPR interface was estimated by the interfacial thickness (L) (in nm) parameter at 25ºC, which is dependent on the RPP/EPR interfacial tension: 31

Differential scanning calorimetry
Differential scanning calorimetry (DSC) measurements were performed on a DSC Q20 calorimeter (TA Instruments) and the data acquisition and analysis were carried out with Universal V4.5A TA Instruments software. The polymers and blend samples (∼5 mg) were heated and held at 200ºC, cooled down to 25ºC, and then reheated up to 200ºC (second run) at a heating/cooling rate of 10ºC/min (under a N2 gas atmosphere). The crystallization and melting temperatures, and their respective enthalpies, were taken from the data of the second run curve. The crystallinity degree (Xc) of the RPP was calculated according to Equation 8: 32
where “ΔHm” is the melting enthalpy of the RPP, “WRPP” is the RPP weight fraction in the blend, and “
Scanning electron microscopy
The microscopy analysis was carried out with a scanning electron microscope (JEOL JSM 6060) operating at 10 kV. The blend morphology and the EPR dispersion in the RPP matrix were investigated. Scanning electron microscopy (SEM) images of the RPP/EPR blends were analyzed at a magnification of 200×.
Impact strength test
Izod impact strength tests under a notch were carried out with an instrumented impact tester (Ceast Resil Impactor II) at 9ºC based on ASTM D256. This temperature was chosen considering the specimens did not break at 25ºC. Each sample was previously notched before the impact test. The hammer energy employed was 10.8 J and the Izod impact strength of the RPP and its blends was the average measure of 10 specimens of the RPP and each RPP/EPR blend.
Tensile test
The tensile measurements of the RPP and RPP/EPR blends were carried out using a universal testing machine (Instron universal 3367) at 10ºC based on ASTM D638. The velocity test employed was 100 mm/min until the specimens broke. Ten specimens were tested to achieve the average value for each property evaluated.
Analysis of variance
The influence of the EPR content and the presence of the RPP/EPR blend mechanical properties was evaluated by analysis of variance (ANOVA) to verify the level of significance of both variables. The statistical data were analyzed using Excel software using the Duncan method and taking the confidence interval as 0.95, in addition to using the p-value test. A variable was considered significant when the p-value test was less than 0.05 (p < 0.05).
Results and discussion
Evaluation of RPP and EPR surface and interfacial properties
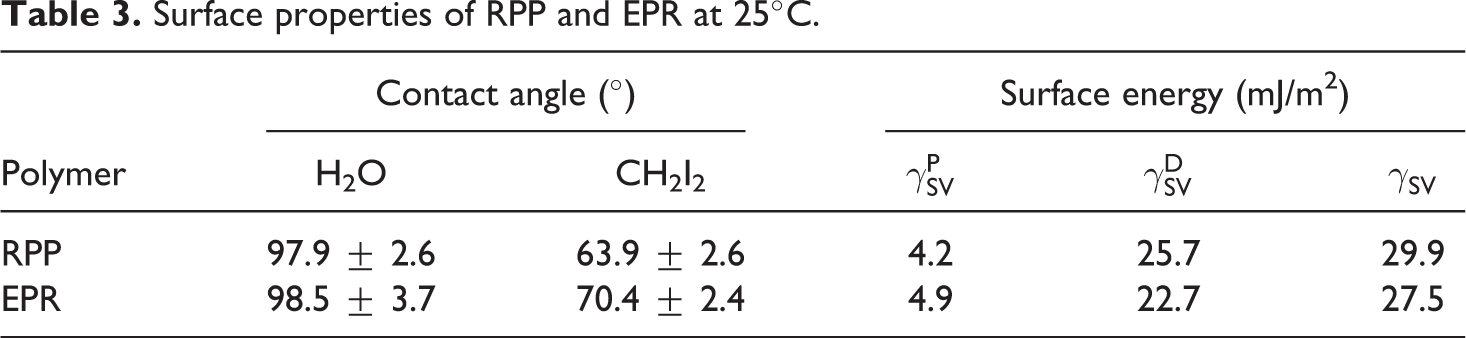
The water and diiodomethane contact angles, as well as the surface energies at 25 and 180ºC of the RPP and EPR, are shown in Table 3. The RPP and EPR water contact angles were very similar and above 90º and the polar component of the surface energy of each polymer was also very low, which was attributed to the weak intermolecular (London) forces. A similar trend was reported by Uthaipan et al., which investigated PP/ethylene octene copolymer (ECO)/ethylene-propylene-monomer diene (EPDM) blends. 34 The surface properties of PP and EPDM showed very low surface energy values (23.94 mN/m for EPDM and 28.36 mN/m for PP), while EOC exhibited values between 22.57–31.84 mN/m based on octene content in EOC. Qi et al. studied PP toughening with ultra-high molecular weight polyethylene and OBC and also observed a similar trend, in which all the non-polar polymers exhibited very low interfacial tensions (below 1 mN/m) between their interfaces. 29 On the other hand, Siročić et al. investigation of styrene-acrylonitrile (SAN)/EPDM blends indicated a significant difference between SAN and EPDM surface energies, in which the former exhibited a surface energy of 42.01 mJ/m2, while the latter a surface energy of 32.44 mJ/m2, resulting in a high interfacial tension. 35 A polymer pair with a small difference between polymer surface energy is expected to exhibit a high chemical affinity between their domains; therefore, it is also probable that this polymer pair shall present a low interfacial tension. By contrasting the RPP and EPR polarities, it is also expected that both polymers exhibit a low interfacial tension and possibly form a polymer blend with high chemical affinity.
Surface properties of RPP and EPR at 25ºC.
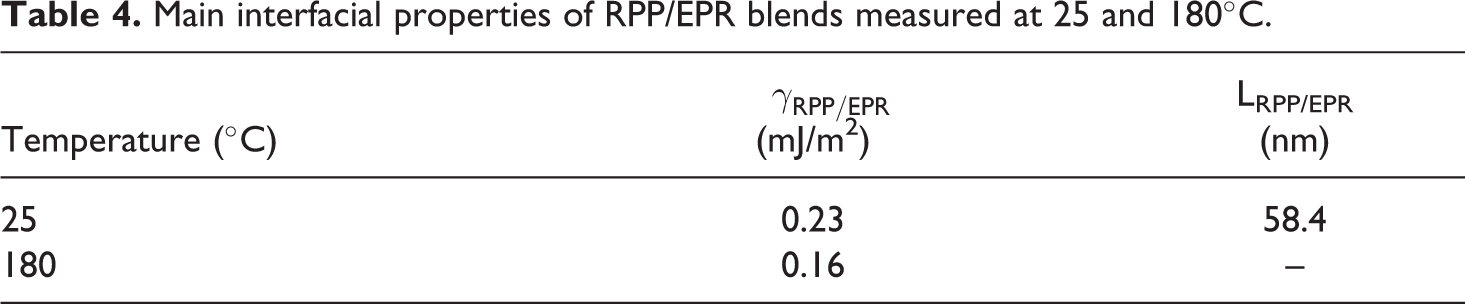
The RPP/EPR interfacial tension at 25ºC and those extrapolated to 180ºC, as well as the interfacial thickness, are displayed in Table 4. At both temperatures, the RPP/EPR interfacial tension was very low, confirming the hypothesis that a small difference between the surface energy of polymer blend components results in low interfacial tension. These results suggested that the RPP and EPR macromolecules should have strongly interacted, which would explain the thickness of RPP/EPR interface, as seen by the RPP/EPR interfacial thickness from Table 4. Wang et al. investigated the interfacial properties of TPU/polyethylene (PE) and TPU/PP blends. 36 The interfacial tensions of TPU/PP and TPU/PE were above 8 mJ/m2, which could be attributed to the differences between the TPU and polyolefin chemical structures. In addition, the interfacial thicknesses of both blends were also very small, which could result in a low efficiency in the stress-transferring mechanism. In multiphase systems, the mechanical properties are very influenced by the interfacial interaction and the interfacial adhesion between the components system. Based on the interfacial thickness and interfacial tension values of RPP/EPR blends, it is very probable that the EPR presence significantly improves RPP impact absorption and tensile behavior, which could result in a polymer blend with suitable rigidity-toughness balance.
Main interfacial properties of RPP/EPR blends measured at 25 and 180ºC.
Evaluation of RPP, EPR, and RPP/EPR blend rheological properties
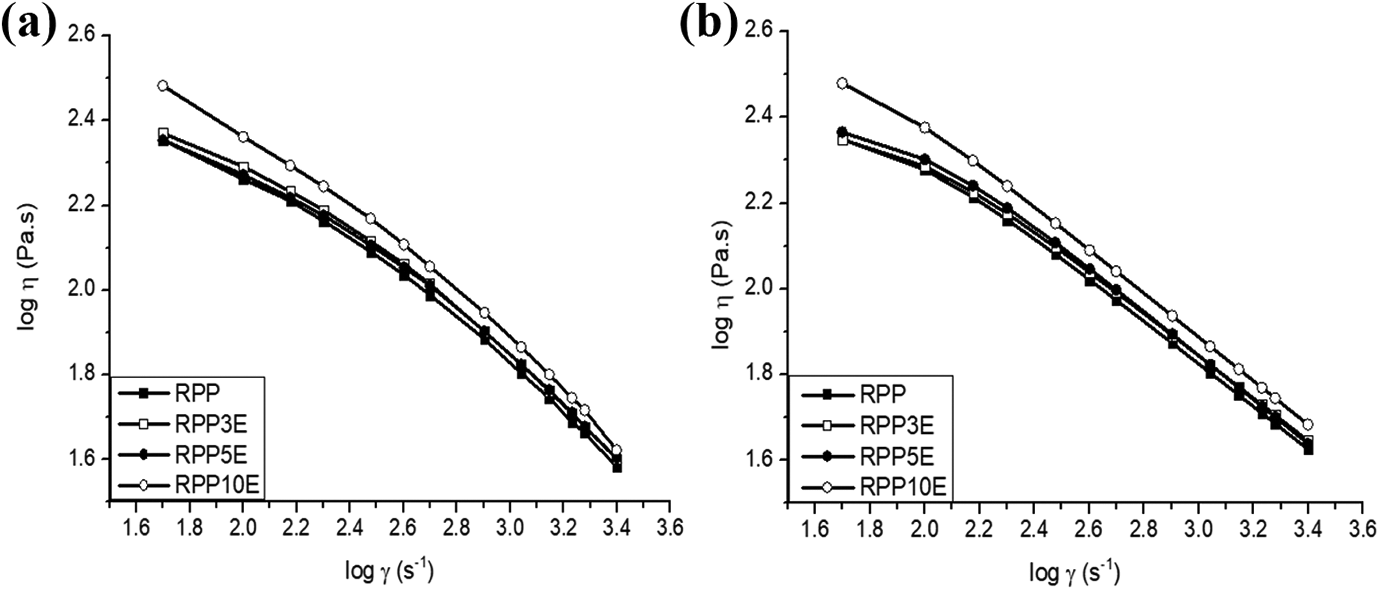
Figure 1 exhibits the RPP and EPR viscosities as a function of shear rate in the power-law (Figure 1(a)) and Carreau models (Figure 1(b)) measured by capillary rheometry. The EPR viscosity values were higher than the RPP ones, as confirmed by the consistency indexes of the power-law model (K) and by the zero viscosity (η0) data in Table 5. The power-law exponent (n) and Carreau exponent (m) indicated that the RPP and EPR exhibited pseudoplastic behavior, once their values were intermediary between 0 and 1. 37,38 The comparison of the RPP and EPR curves fitted by the power-law and Carreau models indicated that the latter exhibited higher linearity over the shear rate evaluated, suggesting that the Carreau model better described the viscoelastic behaviors of the RPP and EPR.
Considering that the EPR viscosity was higher than that for the RPP, it is also expected that the RPP/EPR blend viscosity will be increased as more of the EPR is incorporated. This hypothesis was confirmed by the investigation of Gopanna et al. for PP/cyclic olefin copolymer (COC) blends. 39 The authors tested a polymer system similar to ours, in which both polymers (PP and COC) are non-polar and weakly attracted by van der Waals forces. The viscosity versus shear rate curves at 280ºC indicated that the PP viscosity was increased after incorporating the COC and this increase was more prominent when more COC was added into the PP/COC blends.

Log viscosity vs log shear rate curves of neat RPP and EPR according (a) power-law model and (b) Carreau model at 180ºC.
Figure 2 exhibits the RPP and RPP/EPR blend viscosity as a function of shear rate in the power-law (Figure 2(a)) and Carreau models (Figure 2(b)). The comparison of the RPP and RPP/EPR blend curves fitted by the power-law and Carreau models indicated that both were accurate in describing the viscoelastic behavior of the RPP/EPR blends. All the RPP/EPR blends showed pseudoplastic behavior, once both the power-law (n) and Carreau (m) exponents were between 0 and 1, as shown in Table 5. The comparison of the “n” and “m” values of the RPP and RPP/EPR blends indicated that despite the increasing EPR fraction in the RPP/EPR blends, the RPP pseudoplasticity barely changed. The RPP and RPP3E and RPP5E blend curves were practically the same over the shear rate evaluated, suggesting that EPR contents up to 5% did not influence the RPP viscoelastic behavior. This hypothesis was also supported by the comparison of the consistency index, relaxation time, and zero viscosity values of the RPP and RPP3E and RPP5E blends, which were approximately the same. The increase in the EPR content to 0 to 10% modified the RPP viscoelastic behavior, once its consistency index and zero viscosity values were increased, indicating that the EPR viscosity only had a strong influence on RPP viscoelasticity for contents above 5%. However, by comparing the RPP and RPP/EPR blend viscosities at a higher shear rate, it was observed that all curves were almost coincident. This result suggested that the RPP and RPP/EPR blend viscoelastic behavior could have been very similar during the injection process (in which the shear rate values were over 2000 s−1) and that EPR contents up to 10% could have not influenced the RPP viscoelasticity during the injection process.
Log viscosity vs log shear rate curves of neat RPP/EPR blends according (a) power-law model and (b) Carreau model at 180 ºC.
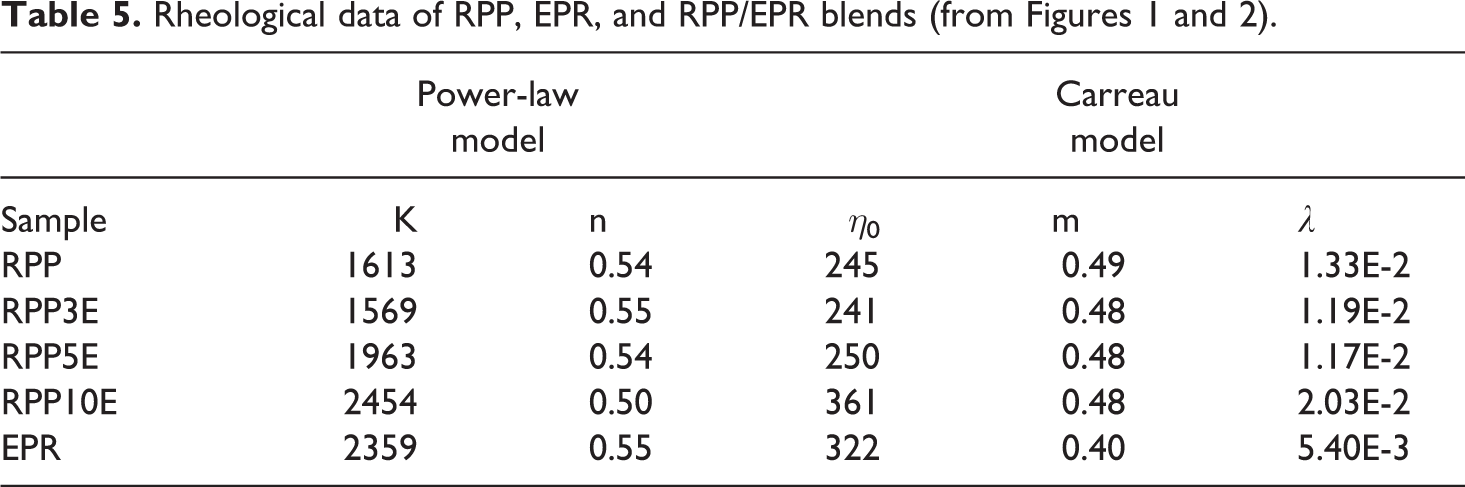
The influence of TPE on the PP viscoelastic behavior was also evaluated by Lima et al., 37 which investigated PP/EPR blends viscoelastic behavior with EPR content varying from 0 to 30%. The comparison of the PP and PP/EPR viscosity versus shear rate curves indicated that regardless of increasing EPR content, all samples exhibited pseudoplastic behavior. The PP and PP/EPR 70/30 curves were similar at high shear rate ranges, which suggested even with the addition of a higher EPR content, the PP/EPR blend viscoelasticity behavior was not affected and could exhibit satisfactory properties for the development of injected components.
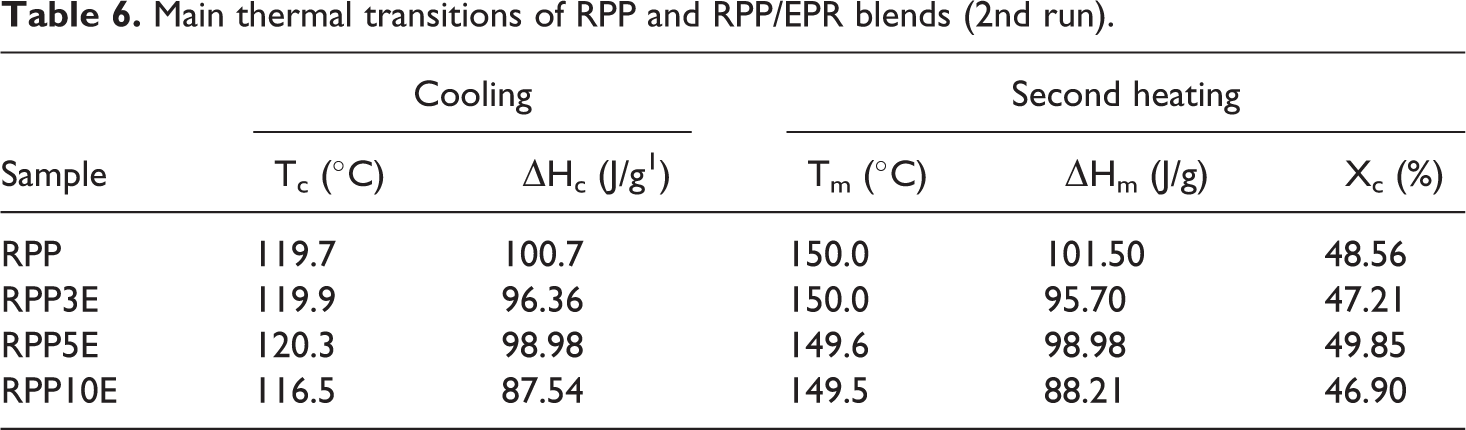
Influence of EPR on RPP thermal transitions
Figure 3 shows the DSC thermograms of the RPP and RPP/EPR blends during cooling (Figure 3(a)) and second heating (Figure 3(b)) in the temperature range of 25–200ºC. The thermal parameters evaluated are displayed in Table 6. All the thermal events are related to the RPP thermal transitions. The EPR did not exhibit melting and crystallization curves. The cooling curves of the RPP and RPP/EPR blends indicated that the molten EPR macromolecules did not act as nucleating agents for the RPP once the RPP crystallization temperature range was unaffected by the EPR content up to 5%. In contrast, the EPR contents above 5% shifted the RPP crystallization temperature (Tc) to lower temperatures by ∼ 5ºC, which could be attributed to a combination of stronger RPP-EPR intermolecular forces and the increase of RPP-EPR blend viscosity, which reduces the EPR efficiency on inducing the formation and growth of the RPP nucleus. Alanalp and Durmus evaluated the influence of styrene-ethylene-butadiene-styrene (SEBS) and a styrene-ethylene-ethylene/propylene-styrene (SEPS) copolymer on the thermal transitions of isotactic polypropylene (iPP) by varying the SEBS and SEPS contents from 0–30 wt.%. 40 The iPP onset crystallization temperature (117.5ºC) was shifted to higher temperatures (up to 121.5ºC) after the addition of SEBS or SEPS, regardless of the content used. The iPP crystallization peak temperature was barely shifted despite the addition of SEBS or SEPS, as well as increasing the fraction content of these TPEs on iPP blends. In contrast, the iPP crystallization temperature was decreased as the SEBS (or SEPS) content rose (especially for SEPS), indicating these TPEs could have modified the iPP crystallization process and the iPP crystallite size.
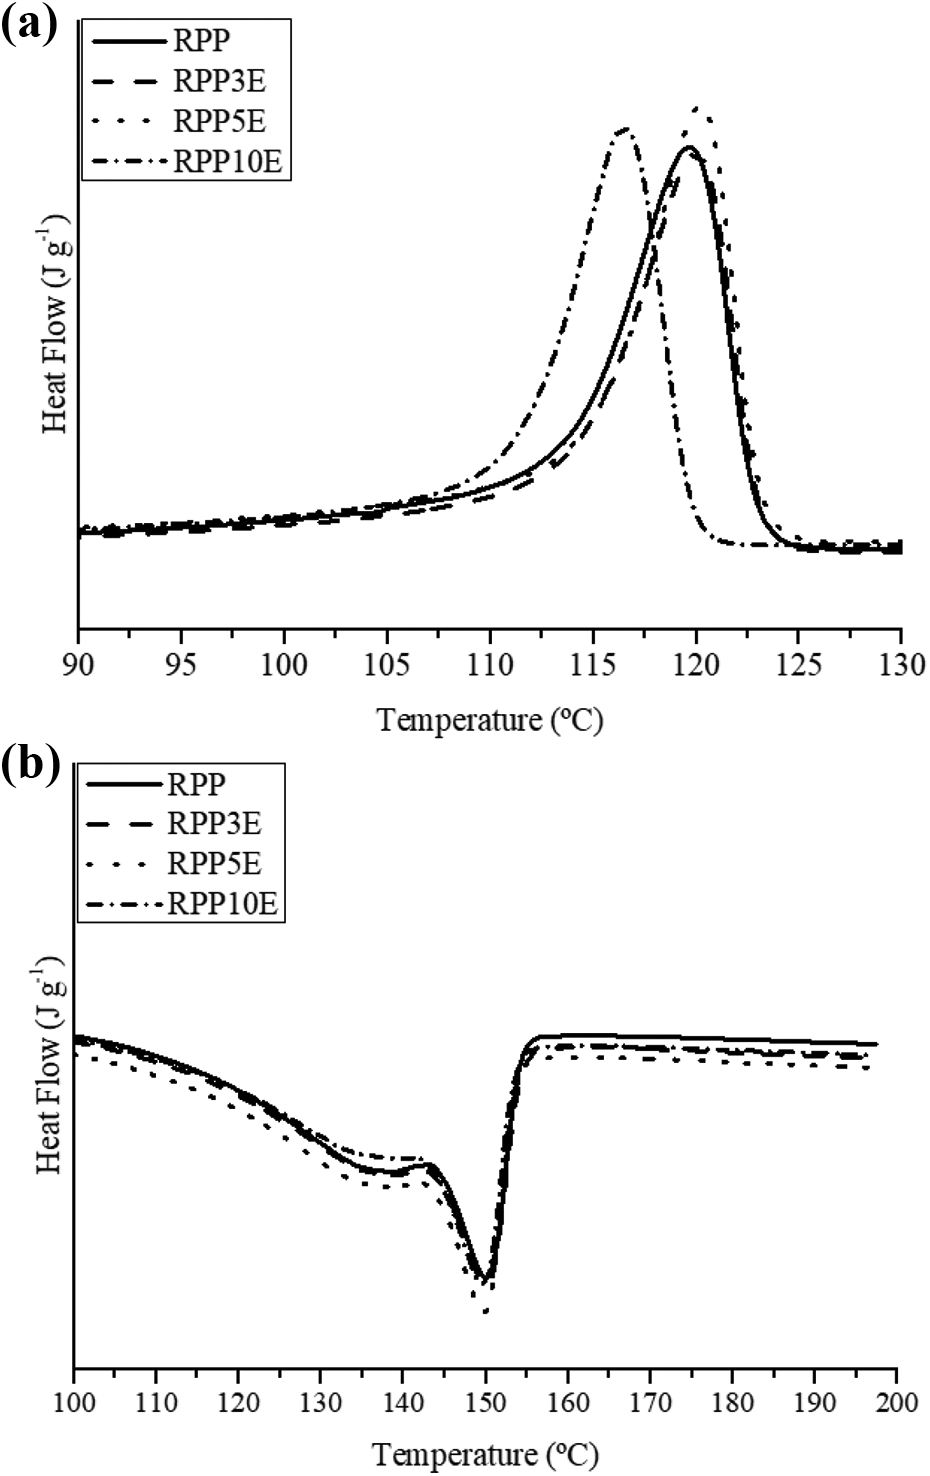
DSC thermograms of RPP and RPP/EPR blends (a) Cooling and (b) second heating.
The RPP and RPP/EPR blend melting process occurred between 140 and 160ºC, as seen in Figure 3(b). The RPP melting temperature range was unaffected regardless of the EPR content in the RPP/EPR blends, as corroborated by the RPP Tm peak positions. In contrast, as shown in Table 6, increasing the EPR fraction implied a reduction in the RPP melting enthalpy in the RPP/EPR blends and barely modified the RPP crystallinity content. This result suggests that the EPR could have altered the RPP crystallization process, modifying the RPP crystallite size and increasing its size heterogeneity, without modifying the RPP crystallization temperature range. A similar result was reported by Liu et al. regarding the influence of ethylene-octene (EOC) and OBCs on the PP thermal transitions. 41 The EOC and OBC contents were fixed at 30 wt.% in the PP/EOC and PP/OBC blends. Despite the presence of the EOC or OBC, the PP Tm was practically constant (∼ 165 ºC). The PP crystallinity content (49.3%) was also practically constant in the PP/EOC and PP/OBC blends, suggesting that both copolymers did not change the PP crystallization process.
Main thermal transitions of RPP and RPP/EPR blends (2nd run).
Alternatively, Abreu et al. observed a distinct result in their research on the influence of different TPEs on the PP thermal transitions, in which the authors tested styrene-butadiene-styrene (SBS) and SEBS copolymers by varying the contents from 0–30 wt.%. 42 The PP melting enthalpy in the PP/TPE blends was reduced as the TPE fraction rose (regardless of the TPE type), which suggested that the presence of TPE modified the PP crystallization process. The PP crystallinity content (56%) was increased after incorporating SBS and SEBS up to 61% after adding up to 10 wt.% TPE, indicating that both TPEs could have acted as nucleating agents for PP in the styrene blocks. A further increase of the SBS (or SEBS) decreased the PP crystallinity, which was attributed to SEBS hindering PP macromolecules from the growth nucleus.
Morphology of fractured surface of RPP/EPR blends
Figure 4 shows the scanning electron micrographs of the RPP and RPP/EPR blend surface fractures. The RPP micrograph exhibited a clean and smooth surface fracture, which is characteristic of a fragile fracture caused by shear. 7,9,15 The EPR particles were not observable in the micrographs due to the very low content utilized in the RPP/EPR blends.
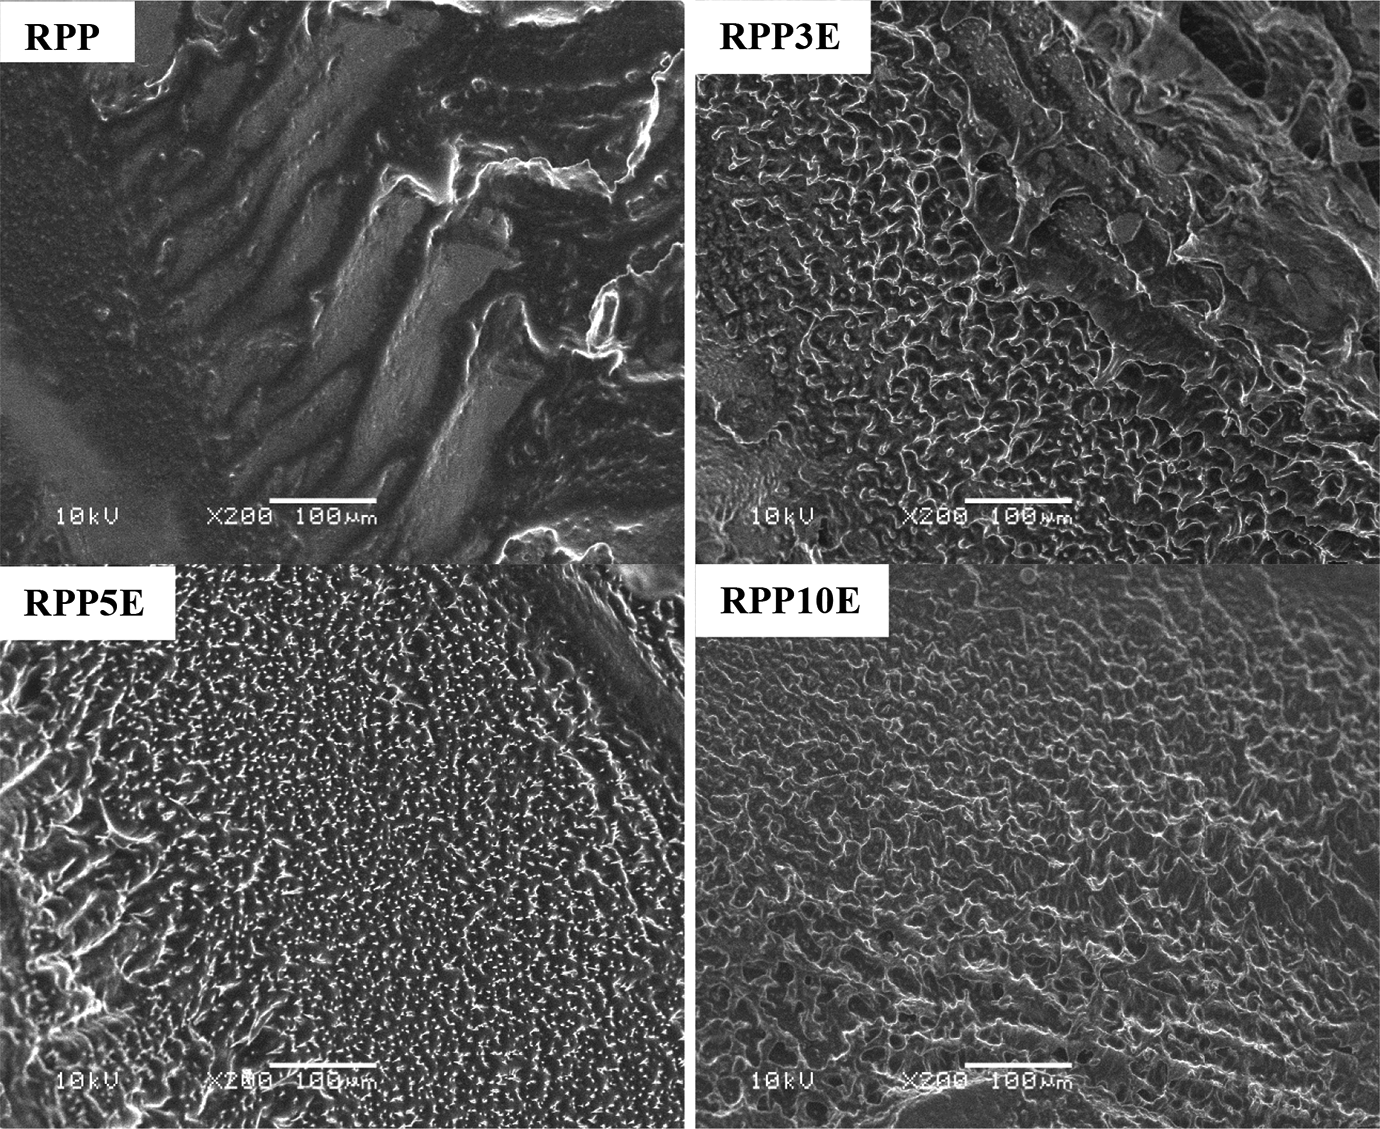
SEM micrograph of surface fracture of RPP/EPR blends.
The increase in the EPR fraction in the RPP/EPR blends modified the RPP surface from a smooth to a sharp profile, with no EPR particles observed in the micrographs, which could be attributed to the low EPR content employed. In addition to this, the EPR presence also induced the formation of microfibrils because of the ductile fracture, which increased as the EPR fraction rose. The presence of microfibrils is characteristic of toughened polymers and occurs because of the nucleation of voids over the polymer matrix and the deformation of polymer matrix fibrils around these voids, which improve the polymer impact absorption. This was also an indication that the RPP fracture mechanism was altered because of the increase of the EPR content. The surface fracture of the RPP10E blend suggested that the presence of 10% of EPR induced the highest RPP plastic deformation in comparison with the other samples, as confirmed by the appearance of cavities over the fractured surface, resulting in the highest tenacity among the other evaluated samples.
Analyses of the RPP/TPE blend surface fracture and fracture mechanism were also studied by Tang et al., which evaluated the mechanical and morphological properties of RPP/poly(ethylene-octene) (POE) blends by varying the POE content from 0 to 65%. 19 The authors only evaluated the micrograph of the RPP/POE 80/20 blend. The presence of voids and extensive fibrillation was observed around the crack region, as well as the presence of a small cavitation over the RPP matrix, which was attributed to a probable POE particle pull-out from the RPP matrix. Li et al. investigated the mechanical and morphological behavior of RPP blends with a random propylene-ethylene copolymer (PEC). 9 The scanning electron micrograph of the RPP/PEC 90/10 blend showed the presence of a fragile fracture with stress concentration, which indicated that the PEC content used was not enough to improve the RPP impact absorption. In contrast, increasing the PEC content modified the RPP fracture mechanism, which was confirmed by the presence of microfibrils and by the RPP ductile fracture.
Mechanical behavior of RPP/EPR blends
Figure 5 shows the impact strength of the RPP/EPR blends as a function of EPR content. The addition of 3%EPR did not influence the impact absorption of the RPP, which could be attributed to the very low EPR content used in comparison to the RPP content. In contrast, increasing the EPR to higher contents led to an improved RPP impact absorption. The RPP5E blend exhibited an improvement of 12% in impact strength in comparison with the neat RPP, while the RPP10E blend impact strength was improved by nearly 102%. These results suggested that only EPR contents above 5%EPR effectively modified the RPP impact absorption, which was supported by the results of the p-test in Table 7. A possible explanation for the improvement in the RPP toughness could be attributed to the formation of strain fields in the RPP matrix. The EPR presence could be capable to dissipate a fraction of the energy of the impact over the RPP matrix and to decrease the propagation of catastrophic flaw, as confirmed by the presence of microfibrils in the micrographs of Figure 4, whose content increased as more EPR was added into the RPP matrix.
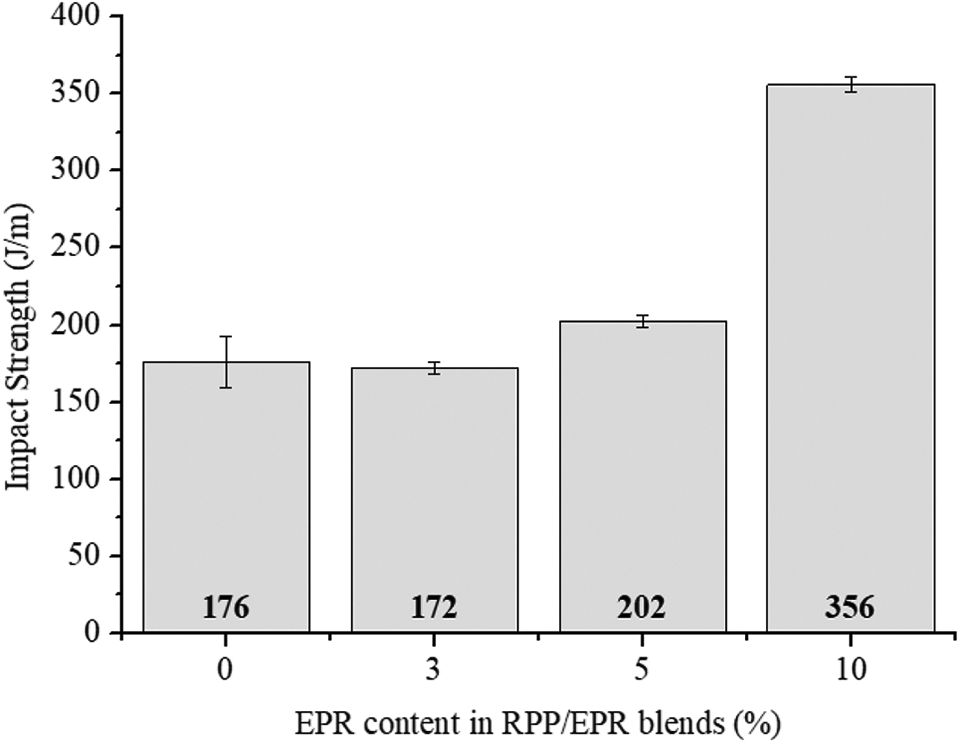
Impact strength of RPP/EPR blends as a function of %EPR.
Figure 6 shows the RPP and RPP/EPR blend stress-strain curves as a function of EPR content. The RPP elastic modulus was influenced by the EPR content, with it decreased with EPR contents above 3 wt. % (Table 7). The presence of 10 wt.% EPR reduced the RPP modulus by 23%, indicating a great improvement in RPP flexibility. This reduction in RPP rigidity could be attributed to the higher EPR chain flexibility in comparison with the RPP, which could have favored the RPP chain deformation under tensile stress. A similar result was also reported by Grein et al. who studied RPP/SEBS blends. It was observed that the incorporation of 20% SEBS decreased the RPP modulus by 27%. 43
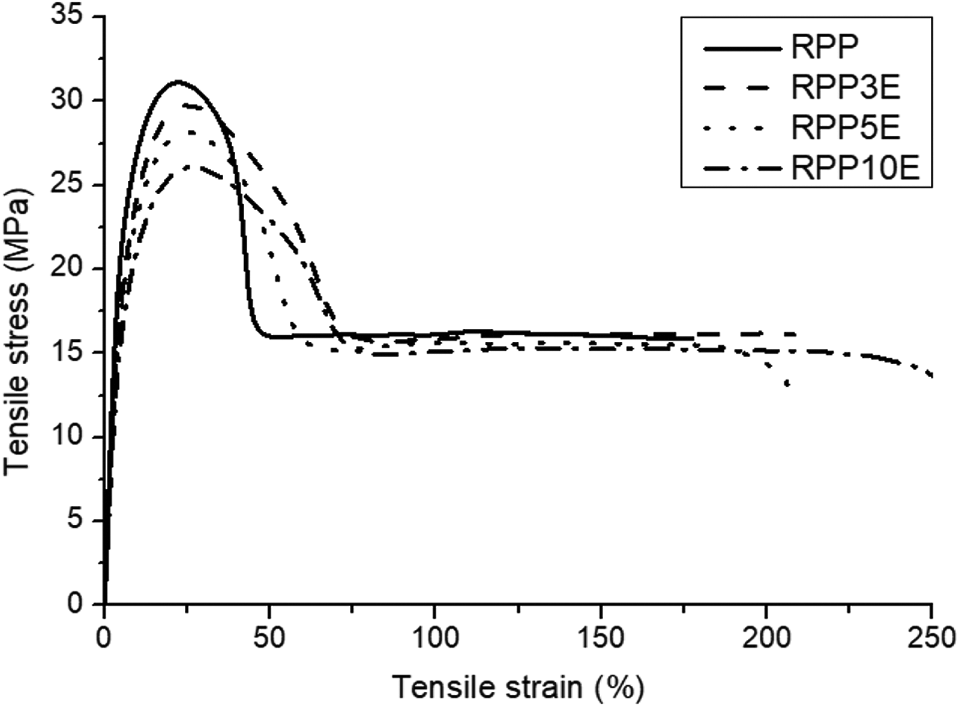
RPP and RPP/EPR blends tensile stress-strain curves.
The RPP and RPP/EPR blend tensile strength coincided with the yield stress. The tensile strength was reduced as the EPR fraction increased in the RPP/EPR blends. This result indicated that the EPR content used in the RPP/EPR blends significantly influenced this property, which was corroborated by the ANOVA results from Table 7. The addition of up to 5% EPR barely decreased the RPP tensile strength, while this property was reduced by 20% after incorporating 10% EPR to the RPP matrix. A similar trend was also reported by Abreu et al. who studied the influence of SEBS on the mechanical behavior of the RPP, in which the addition of 10% SEBS into the RPP matrix decreased the RPP tensile strength from 27 to 22 MPa (nearly 23%). 42
The RPP deformation at break was largely improved after the addition of EPR. The RPP3E and RPP5E blends exhibited similar deformation at break values, and, according to the ANOVA analyses of Table 7, there was no significant difference between these EPR contents for this property. The increase of the EPR content to 10 wt.% improved the RPP deformation at break by 34% and this EPR content exhibited a significant difference in comparison with the RPP3E and RPP5E blends. These results were similar to those reported by Liu et al. regarding the influence of polyamide elastomer (PAE) on the mechanical behavior of the RPP, 44 in which the presence of 10% PAE increased the RPP deformation at break by over 200%, while for the RPP blend with 20% PAE, the deformation at break was over 300%.
The improvement of the RPP deformation at break due to the EPR presence could be attributed to the combination of the higher RPP/EPR blend viscosity and a stronger RPP/EPR interface, as also reported in previous works. 27,28 The toughness of the RPP and RPP/EPR blends was determined and taken as the integral of the area under the stress-strain curves. The RPP toughness was improved by up to 17% after the incorporation of EPR and the RPP toughness was not influenced by the EPR content, according to Table 7. The improvement of the RPP toughness could be explained by the efficiency of the stress-transferring mechanism of the EPR phase to the RPP matrix as a result of the combination of good RPP/EPR interfacial strength (very low interfacial tension) and a thick interface layer (Table 4).
Main mechanical properties of RPP and RPP/EPR blends.
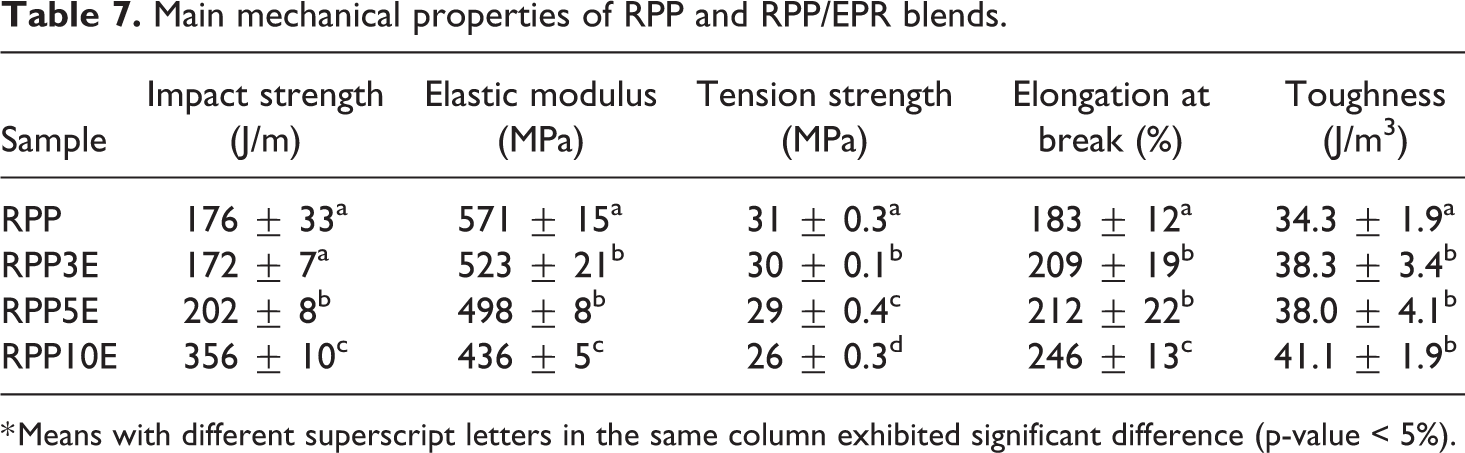
* Means with different superscript letters in the same column exhibited significant difference (p-value < 5%).
Keshin and Adanur also investigated the effectiveness of different TPEs on the improvement of PP toughness. 45 The authors used EPDM and a styrene-butadiene block polymer as TPEs to improve the PP impact resistance and toughness, and the comparison of the PP, PP/EPDM, and PP/styrene-butadiene block polymer stress-strain curves indicated that the neat PP modulus was decreased after the addition of these elastomers. In addition, the PP deformation at break was largely improved (from 2.2% to 62% in the PP/EPDM blend and 728% in the PP/styrene-butadiene block polymer blend). The authors also evaluated the PP and PP blend toughness by the area under the stress-strain curves, observing the PP toughness was largely improved after adding TPE, especially for the styrene-butadiene block polymer. Parameswaranpillai et al. evaluated the toughening of PP/high-density polyethylene (HDPE) (80/20) blend with different contents of EPDM. 46 The measurements of toughness by the area under the stress-strain curves indicated the presence of up to 4.8% EPDM increased the PP/HDPE blend toughness by ∼100% (from 1.5 to 3.2 J/m3), while the addition of 9.1% EPDM increased this property by almost 150% (from 1.5 to 3.7 J/m3).
Conclusions
The interfacial, thermomechanical, morphological, and rheological properties of the RPP and RPP/EPR blends were evaluated. The interfacial and surface properties of the RPP and EPR indicated both polymers exhibited excellent chemical affinity and a thick interface. The evaluation of the RPP, EPR, and RPP/EPR blend viscoelastic behavior indicated that the EPR possessed the highest viscosity among all samples, and RPP/EPR viscosities were practically the same at high shear rate ranges, regardless of the EPR content used. DSC analyses suggested the EPR did not act as a nucleating agent for the RPP, and the RPP crystallinity was only decreased at the RPP/EPR 90/10 blend. The reduction of the RPP crystallization enthalpy in the RPP/EPR blends suggested the EPR could have modified the form and the distribution in size of the formed RPP crystallites. The scanning electron micrographs of the RPP and RPP/EPR blends indicated the presence of microfibrils in reason of ductile fracture, indicating EPR increased the RPP tenacity. EPR incorporation significantly modified the RPP mechanical properties after incorporating 10% EPR.
Footnotes
Acknowledgements
The authors would like to thank Coordenação de Aperfeiçoamento de Pessoal de Nível Superior (CAPES) for the doctoral scholarship, Sanremo S.A for RPP and EPR samples donation, Fundação de Amparo à Pesquisa do Estado do Rio Grande do Sul (FAPERGS) for the undergraduate scholarship, Professor Doctor Nilo Sérgio Medeiros Cardozo for the capillary rheometry analysis, and Laboratório de Corrosão, Proteção e Reciclagem de Materiais (LACOR, UFRGS) for the contact angle measurements.
Declaration of conflicting interests
The author(s) declared no potential conflicts of interest with respect to the research, authorship, and/or publication of this article.
Funding
The author(s) disclosed receipt of the following financial support for the research, authorship, and/or publication of this article: The authors would like to thank CAPES (Mr. Giordano P. Bernardes’ grant: 1593772 / Mr. João A. P. Silva’ grant: 88882.181973/2018-01) and FAPERGS (Miss Victoria C. Bönmann’ grant: 18715) for the financial support.