
Abstract
In this study, a new method was proposed to reduce the keyhole volume with friction stir spot welding process and improve the lap joint shear load-carrying capacity of the weld by analyzing the effects of tool rotation speed, plunge depth and dwell time on the weld. Single lap shear tests were carried out to determine the influences of the welding parameters on the mechanical behavior of the welds. The quality of the joint was evaluated by examining the characteristics of the joint as a result of the lap joint shear load. For friction stir spot welding of the acrylonitrile butadiene styrene samples, the experiments were designed according to Taguchi’s L9 orthogonal array in a randomized way. From the analysis of variance and the signal-to-noise ratio, the significant parameters and the optimum combination level of the parameters were obtained. It was found that using a tool rotation of 1000 rpm, plunge depth 11.5 mm and dwell time of 40 s, an improved joint strength can be obtained. The results showed that joint strength was improved by an amount of 20% as compared with the optimum welding parameters to the initial welding parameters. Macrostructure examination plays an important role to determine the joint strength and evaluate the influences of each welding parameters. So, weld morphology was investigated by morphological analysis and visual comparisons. It was also observed failure modes for fractured samples having the highest, moderate and lowest lap joint shear load.
Keywords
Introduction
Polymeric materials are strong such as some metallic alloys and show developed mechanical properties, chemical and corrosion resistance in addition to increased design freedom. Polymers have been preferred in industrial components to save weight and for current emission reduction policies. Acrylonitrile-butadiene-styrene, often abbreviated as ABS, is an impact-resistant engineering thermoplastic and amorphous polymer, and commonly used in the automotive industry, electrical and electronic equipment. It provides rigidity, good processability, and low cost. On the other hand, ABS also has some disadvantages such as low thermal stability, poor chemical, and flame resistance.1,2
The joining of polymers is very important in the production of parts. 3 New techniques have emerged along with an increase in research and development activities on the joining of polymers. 4 Friction Stir Welding (FSW) is a novel joining process and a solid-state welding method that uses a rotating tool to generate heat and force the plasticized materials into a joint line for consolidation. In 1993, based on the linear friction stir welding (FSW), Mazda Corporation of Japan proposed a Friction Stir Spot Welding (FSSW) process which has successfully been applied to the production of the hood and rear door and it was developed in the automotive industry instead of resistance spot welding of aluminum sheets in 2001. 5 Friction stir spot welding (FSSW), derived from Friction Stir Welding (FSW) has certain advantages compared to resistance spot welding which has been extensively used for many years in the automotive and other industries to assemble metals. 6 Although there are a large number of studies about FSW and FSSW of metal parts, fewer studies have been concerned with FSW and FSSW of polymers. In addition, due to the high difference in terms of thermal, rheological, and mechanical properties between metals and thermoplastic polymers, researchers preferred to choose the proper processing conditions for specific studies and improve the quality of welds performed by FSW and FSSW on polymeric materials. Thus, many researchers have focused on three main issues: analysis and optimization of the tool geometry, optimization of the welding conditions, and development of the FSSW tools. 7 Up to now, investigations about FSSW of polymers are: polyethylene (HDPE),8–10 polypropylene (PP),11–16 polycarbonate (PC),17–21 acrylonitrile butadiene styrene (ABS),22–24 and polymethyl methacrylate (PMMA). 25
Many studies have been investigated to figure out the effect of the main process parameters and tool pin geometries on FSSW. The welding parameters such as rotational speed, plunge rate, plunge depth, dwell time, pre-heating time, waiting time, and tool geometries (pin diameter, tool shoulder diameter, taper angle) have an effect on joint strength.
Bilici et al. 8 used Taguchi method to find optimum welding parameters and the contribution of individual process parameters of FSSW of polyethylene sheets. According to the results, it was reported that dwell time was the most effective parameter and this was followed by rotational speed. Lambiase et al. 17 stated that a predetermined waiting time should elapse to provide a drop in the temperature of the welded PC specimens. According to results, waiting time has not shown significant effect and very short waiting time values resulted in a decrease in shear strength. Also, FSSW of polycarbonate sheets was performed to analyze the effects of various tool pin geometries and tool shoulder diameters on the joining loads. An increase in the taper angle causes a slight increase in the plunging load and torque when the tool shoulder reaches the upper sheets since the taper pins have an expanding contact area, unlike cylindrical pins. On the other hand, the effects of the pin diameter and the shoulder diameter are higher than the taper angle. Paoletti et al. 18 studied the effect of welding parameters (tool plunge rate, tool rotational speed, pre-heating time, dwell time, and waiting time) during FSSW phases of polycarbonate sheets. The results of the lap joint shear test of polycarbonate joints showed maximum mechanical strength in case of low tool plunge rate and tool rotational speed and high pre-heating, dwell, and waiting times. Also, it was observed that the polycarbonate particles were rotated by the tool and spread out from the welding zone because of inertial forces causing a material loss in the welded area. Yan et al. 23 used a flat pin tool to prove the applicability of FSSW of ABS and revealed the importance of process parameters on mechanical performances as well. The rotational speed had an important effect while dwell time had a negligible effect on the weld formation of FSSW of acrylonitrile butadiene styrene sheets. Visible defects did not appear for low rotational speeds contributing to the welding but high rotational speed led to an increase of groove defects. The results showed that high dwell time and moderate rotational speed had a slight effect on shear strength. Dashatan et al. 25 investigated that feasibility of friction stir spot welded two different polymeric materials specimens as weld strength of joints. Rotational speed, tool plunge rate and dwell time significantly influenced the lap joint shear load, and tool plunge rate has been more influential parameter than other welding parameters.
Bilici et al. 12 studied the effects of tool geometries and determined weld strength on friction stir spot welding of polypropylene sheets. Among the four different tool pin profiles (straight cylindrical, tapered cylindrical, threaded cylindrical, square), tapered cylindrical pin has maximum fracture force in friction stir spot weld region. Yan et al. 22 used a different pin geometry (triflute pin tool) to carry out FSSW of acrylonitrile butadiene styrene sheets and aimed at reducing the keyhole volume. Results showed that the triflute pin tool was much more effective than a cylindrical pin in decreasing the keyhole volume considerably. Cylindrical pin formed a larger ring due to the displacement of more material. In addition to this, the triflute pin was superior to the cylindrical pin in creating larger bonded areas and increasing material flow under the same conditions. In another study of Yan et al. 24 used a pinless tool for FSSW of ABS. Also, additive ABS gaskets were placed to hole of clamping plate to increase of upper sheet thickness and the effect of plunge rate and gasket thickness on mechanical properties were investigated. By using experimental results it was investigated that bonded area diameter and fracture load increased while the plunge rate and gasket thickness were increasing but then it was observed that fracture load decreased slightly.
The present study is aimed at reducing the volume of the keyhole with an additional ABS sheet by presenting a fully complete Taguchi experimental design method. Moreover, the scope is to focus on the effect of the welding parameters while keeping a constant plunge rate and pre-heating time as well as the tool pin geometry and dimensions for ABS-ABS joints achieved by using FSSW.
Materials and method
Materials
Acrylonitrile butadiene styrene (ABS) specimens having 4 mm thickness, 25.4 mm width and 100 mm length were joined by Friction Stir Spot Welding. The specimens have been overlapped by 25 mm in length. Acrylonitrile butadiene styrene is an amorphous thermoplastic polymer having a tensile strength of about 38 MPa, a glass transition temperature of about 108°C and a melting temperature of about 220°C.
Experimental setup
Friction stir spot welding operations were carried out using a vertical machining center.
The tool with a shoulder and threaded cylindrical was used in this investigation. The pin was designed with thread for increasing the frictional heat and stirring ability. 26 The threaded cylindrical tool pin made up of H13 hot work tool steel with a shoulder diameter of 20 mm, a pin diameter of M5 thread screw and a pin length of 5 mm was used (Figure 1). Also, a clamping fixture having a central through hole was designed to fix the lapped polymer workpieces as presented in Figure 2. After the fixing of this clamping fixture on the table of vertical milling machine, two ABS specimens are placed in the slots and the filler workpiece is put on the upper sheet specimen.
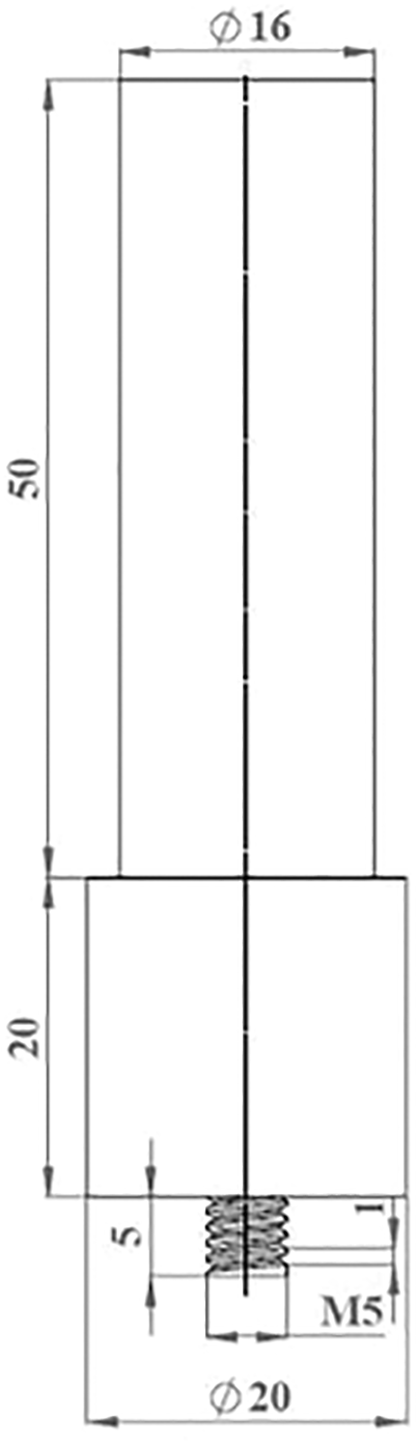
Welding tool used in experimentations.
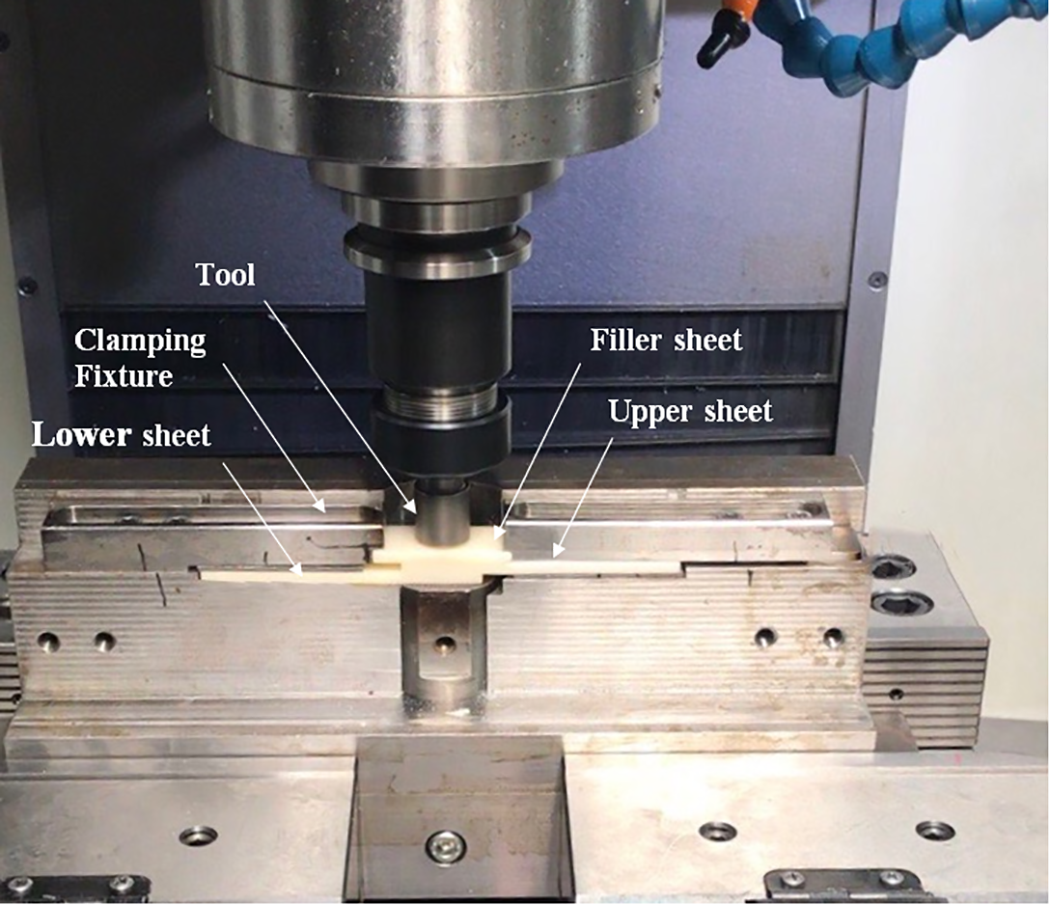
Clamping fixture and FSSW tool during fabrication of the joints.
The direction of tool rotation is chosen as counter-clockwise to allow material to flow downward in the welding area due to the helix direction. 27 Depending on previous studies, the plunge rate and pre-heating time were kept constant as 8 mm/min and 20 s, respectively.
The materials were positioned together with an overlapping area of 25 × 25 mm and welded at the center of this area. Before the welding operation, an ABS filler plate with 48 mm length was put on above the upper sheet (Figure 3). The steps of the process were illustrated in Figure 4, consisting of pre-heating, plunging, stirring, and retracting.
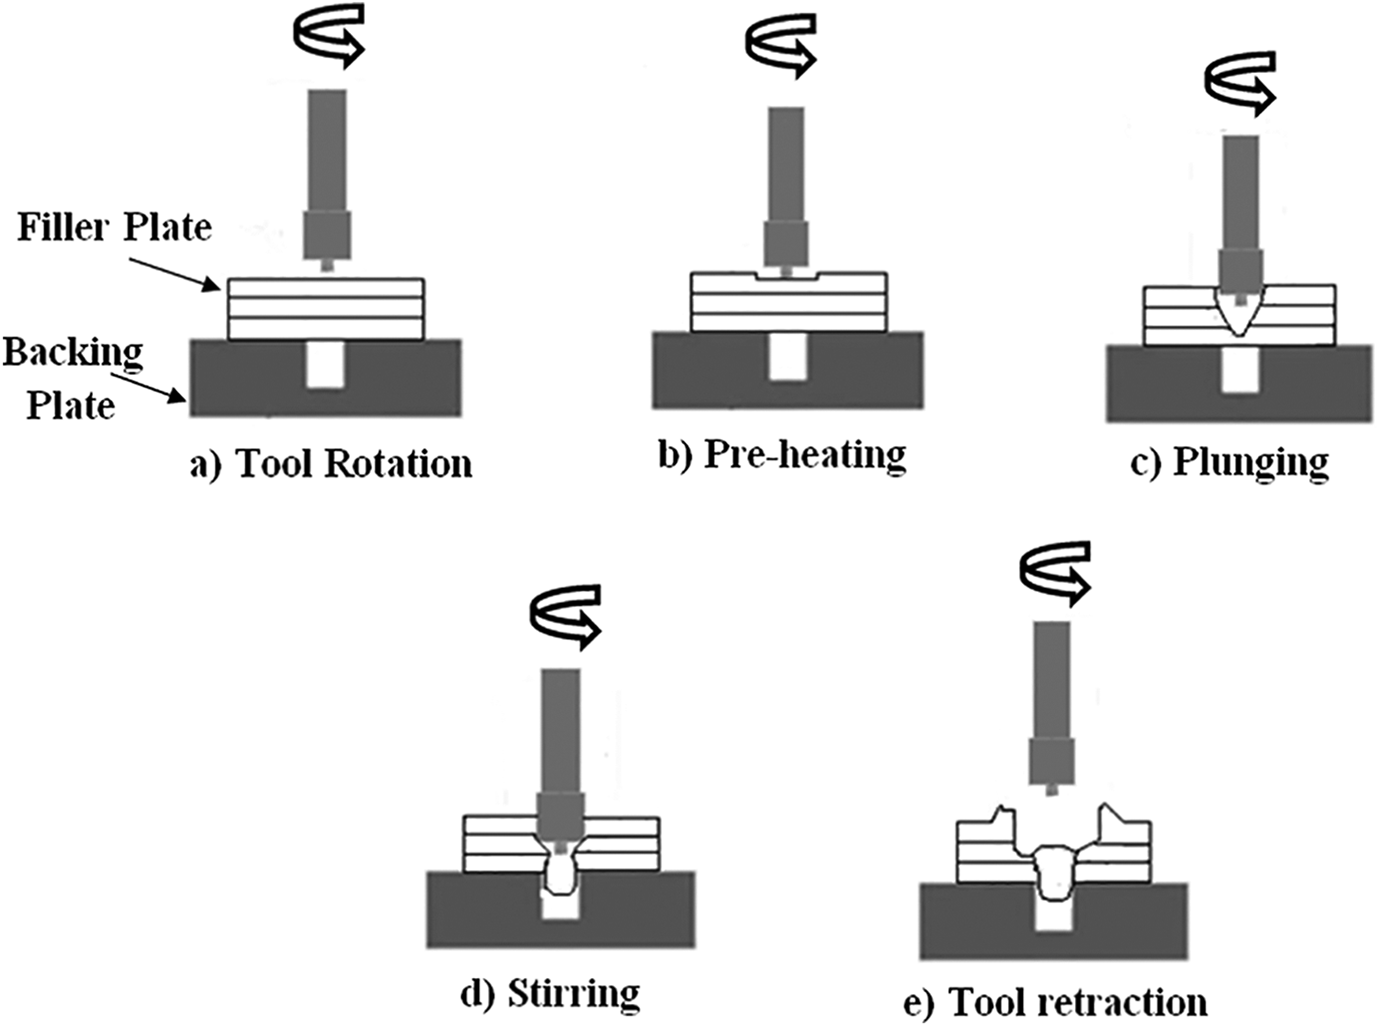
The stages of FSSW process.
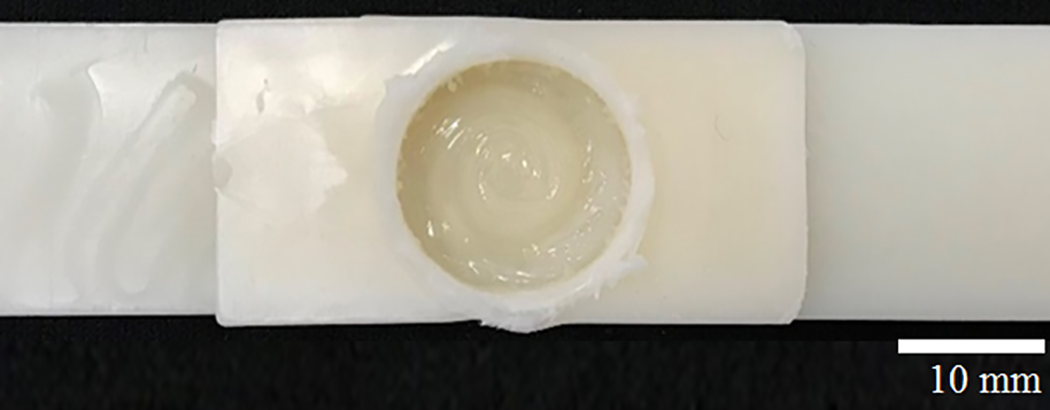
Friction stir spot welded specimen.
First of all, the threaded cylindrical tool starts by rotating with at pre-determined rotational speed, and punch moves vertically 0.2 mm to the additional filler sheet with a constant plunge rate. The tool stops and starts to apply pressure for a preheating time. ABS materials are heated and the tool again continues plunging until the shoulder reaches the upper sheet to the desired level of plunge depth. Plunge motion is stopped while the tool continues to rotational speed in the workpiece for a prescribed dwell time. Temperature increases between the material and the pin due to the frictional heat generated by the material adhering to the pin. As the temperature increases, it causes the plastic flow in the welded zone. Applied force by tool shoulder causes the continuation of the plastic deformation until the dwelling period is complete. After this step, the rotating tool is retracted from the workpieces and a solid state phase is formed between the materials.
Figure 5 illustrates the appearance of a welded specimen and joining is successfully performed.
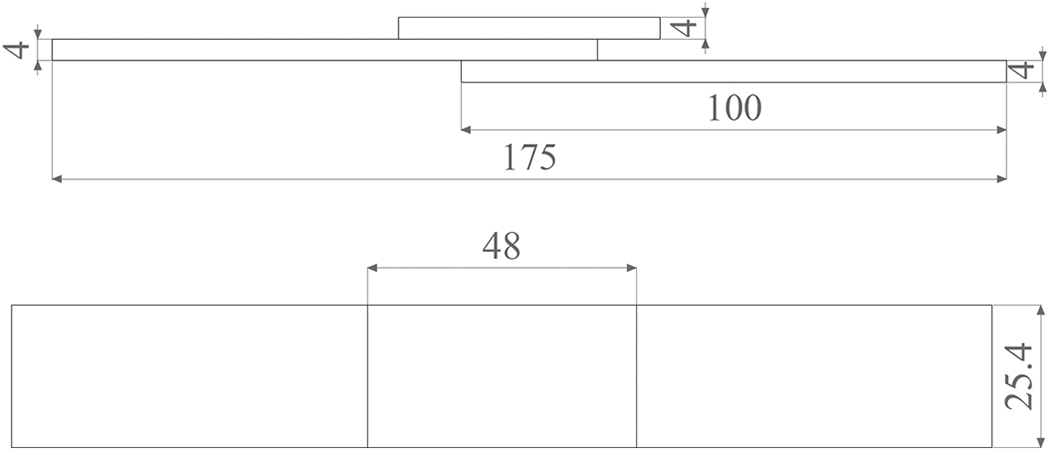
Configuration of lap-shear test specimens.
Experimental procedure
Genichi Taguchi improved a technique called as Taguchi method 28 to design and carry out experiments for researching processes where the result depends on many factors, Taguchi experimental design method is basic, easy and not complicated for obtaining intended purposes. Taguchi’s technique also provides optimization of the welding parameters without increasing the experiment number, time, and cost. 29 In summary, Taguchi experimental design includes the following flow chart: (1) Definition of the objective of the study; (2) Identifying process parameters having significant effects; (3) Selection of the orthogonal array and designing the matrix experiment; (4) Carrying out the matrix experiments; (5) Determination of optimum process parameters; (6) Application of analysis of variance or obtaining the effect of each parameter; (7) Perform a confirmatory test of the optimum design parameters if the result is not satisfactory. In this technique, an applicable orthogonal array is chosen based on the total degree of freedom (DOF). It is determined by summing the individual DOF of each parameter.
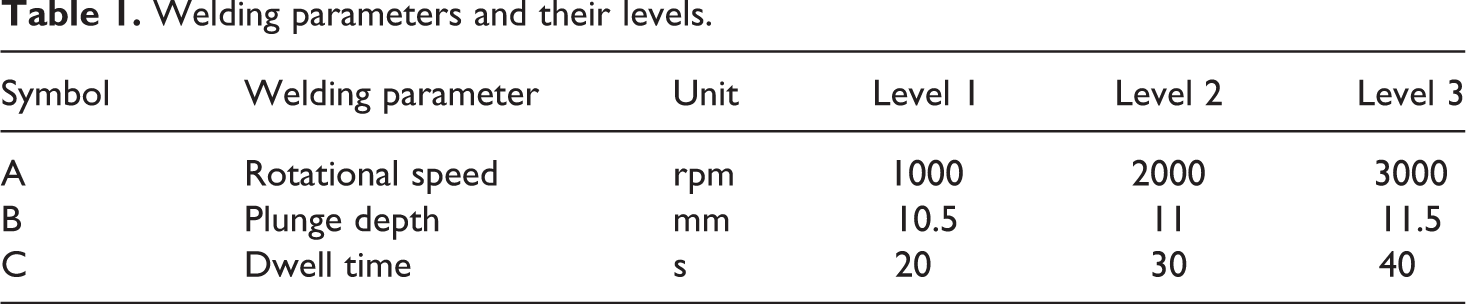
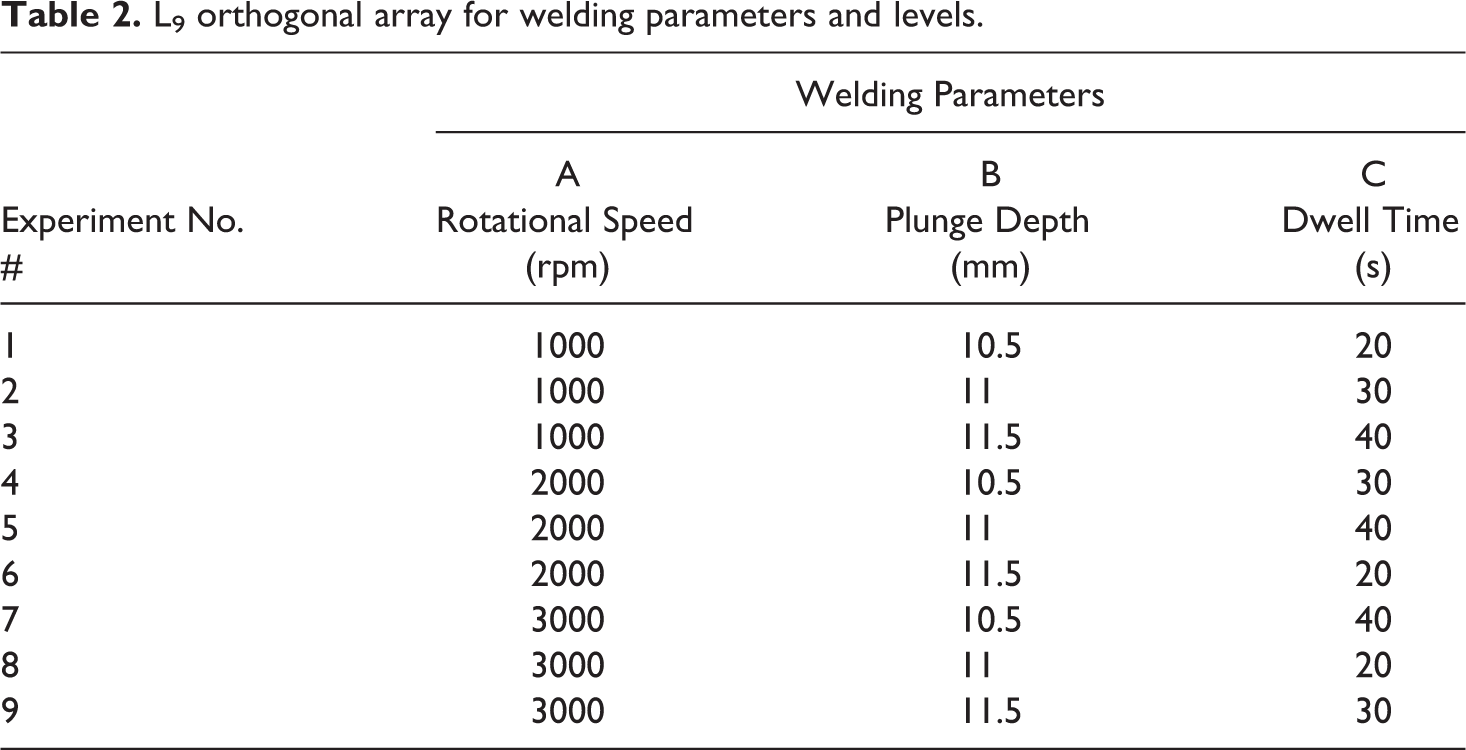
The experimental design matrix includes parameters and their levels in Taguchi’s L9 orthogonal array. In Table 1, welding parameters (rotational speed (A), plunge depth (B), and dwell time (C)) were set up at three levels. Therefore, only nine experiments were sufficient to investigate the welding processes. In the present study, Taguchi’s L9 orthogonal array was selected to investigate the influences of welding parameters on the lap shear fracture load of welded joints as shown in Table 2.
Welding parameters and their levels.
Lap joint shear tests were carried out to investigate mechanical properties and macrostructure analysis of welded specimens. The specimens were tested in a SHIMADZU tensile testing machine with 100 kN of load cell by using a noncontact video extensometer with an initial gauge length of L0 = 70 mm at a constant crosshead speed of 5 mm/min. Displacement and the breaking force were recorded during the test to evaluate the mechanical performances of welded joints. The lap shear fracture load was obtained by averaging the strengths of three replicates. All the specimens were sectioned for mechanical and cross-sectional macrostructure analyzes.
L9 orthogonal array for welding parameters and levels.
Results and discussion
Signal to noise ratio
In the Taguchi experimental design, while the term “signal” refers to the desired value, the term “noise” refers to an undesired value. The S/N ratio is the ratio of the mean to the square deviation. The experiment is designed in order not to be affected by unmanageable factors. Therefore, the signal to the noise ratio should be high. There are three categories of the performance characteristics in the S/N ratio analysis: the lower-the-better, the larger-the-better, and the nominal-the-best. As the optimum level of the process parameters is selected a larger S/N ratio which shows better performance characteristics.
The S/N ratio is calculated by equation (1):

MSD is the mean square deviation for the output characteristics for the output.
Due to the highest lap joint shear load is desired, the mean squared deviation (MSD) for “the larger is better” is stated by equation (2):
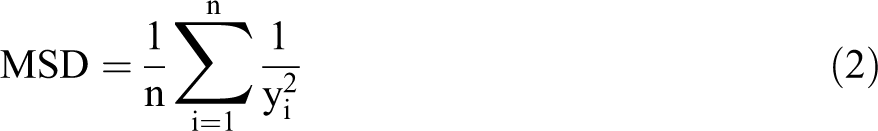
with yi: the value of output characteristic for the test and n: number of the ith test.
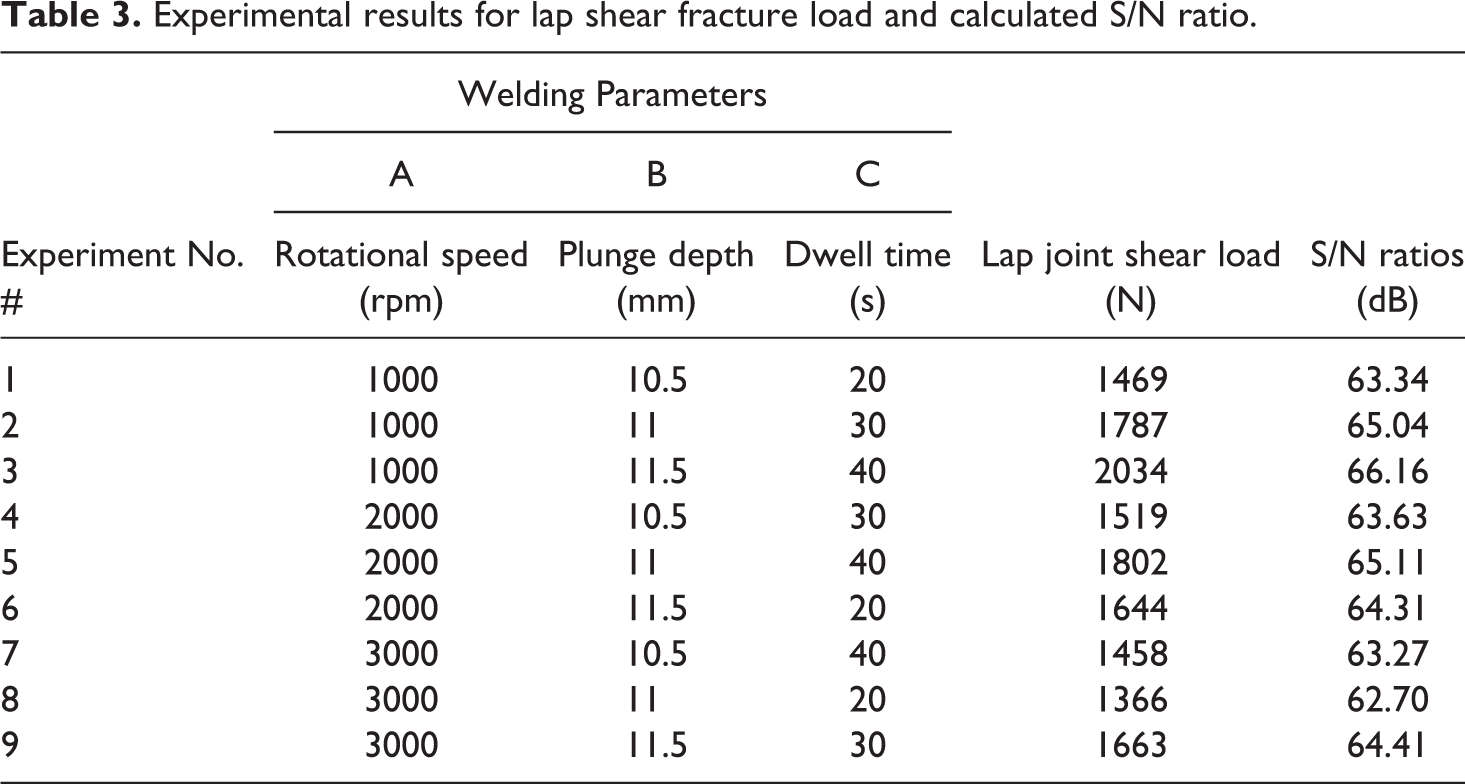
Table 3 indicates lap shear fracture load values for welded ABS specimens and S/N ratios determined by equation (1) and (2). These values were calculated by utilizing statistical analysis software Minitab v.17.
Experimental results for lap shear fracture load and calculated S/N ratio.
Analysis of variance (ANOVA)
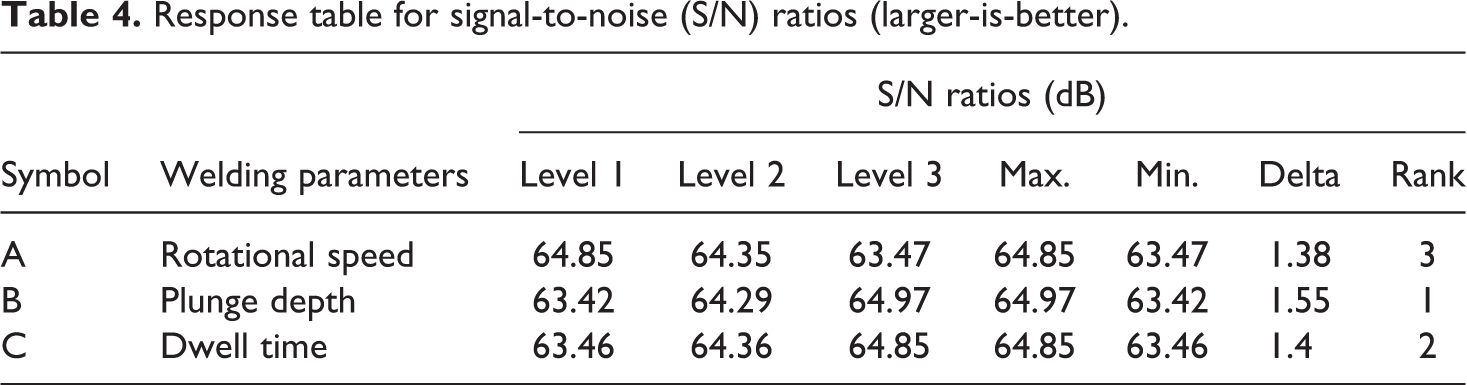
Table 3 shows nine different processes parameter combinations but the influences of the individual welding parameter cannot be fully deduced according to the result of the table. Since the experimental design is orthogonal, the effect of each welding parameter at different levels can be separated. For instance, it is possible to determine the mean S/N ratio of tool rotational speed at levels 1, 2, and 3 by averaging the S/N ratios for the experiments 1 to 3, 4 to 6 and 7 to 9 respectively. The mean S/N ratio calculations of all parameters can be performed in a similar way. Also, Table 4 summarizes the S/N ratio for each level of process parameters which is called the response table for S/N ratio charts of lap joint shear load are illustrated in Figure 6.
Response table for signal-to-noise (S/N) ratios (larger-is-better).
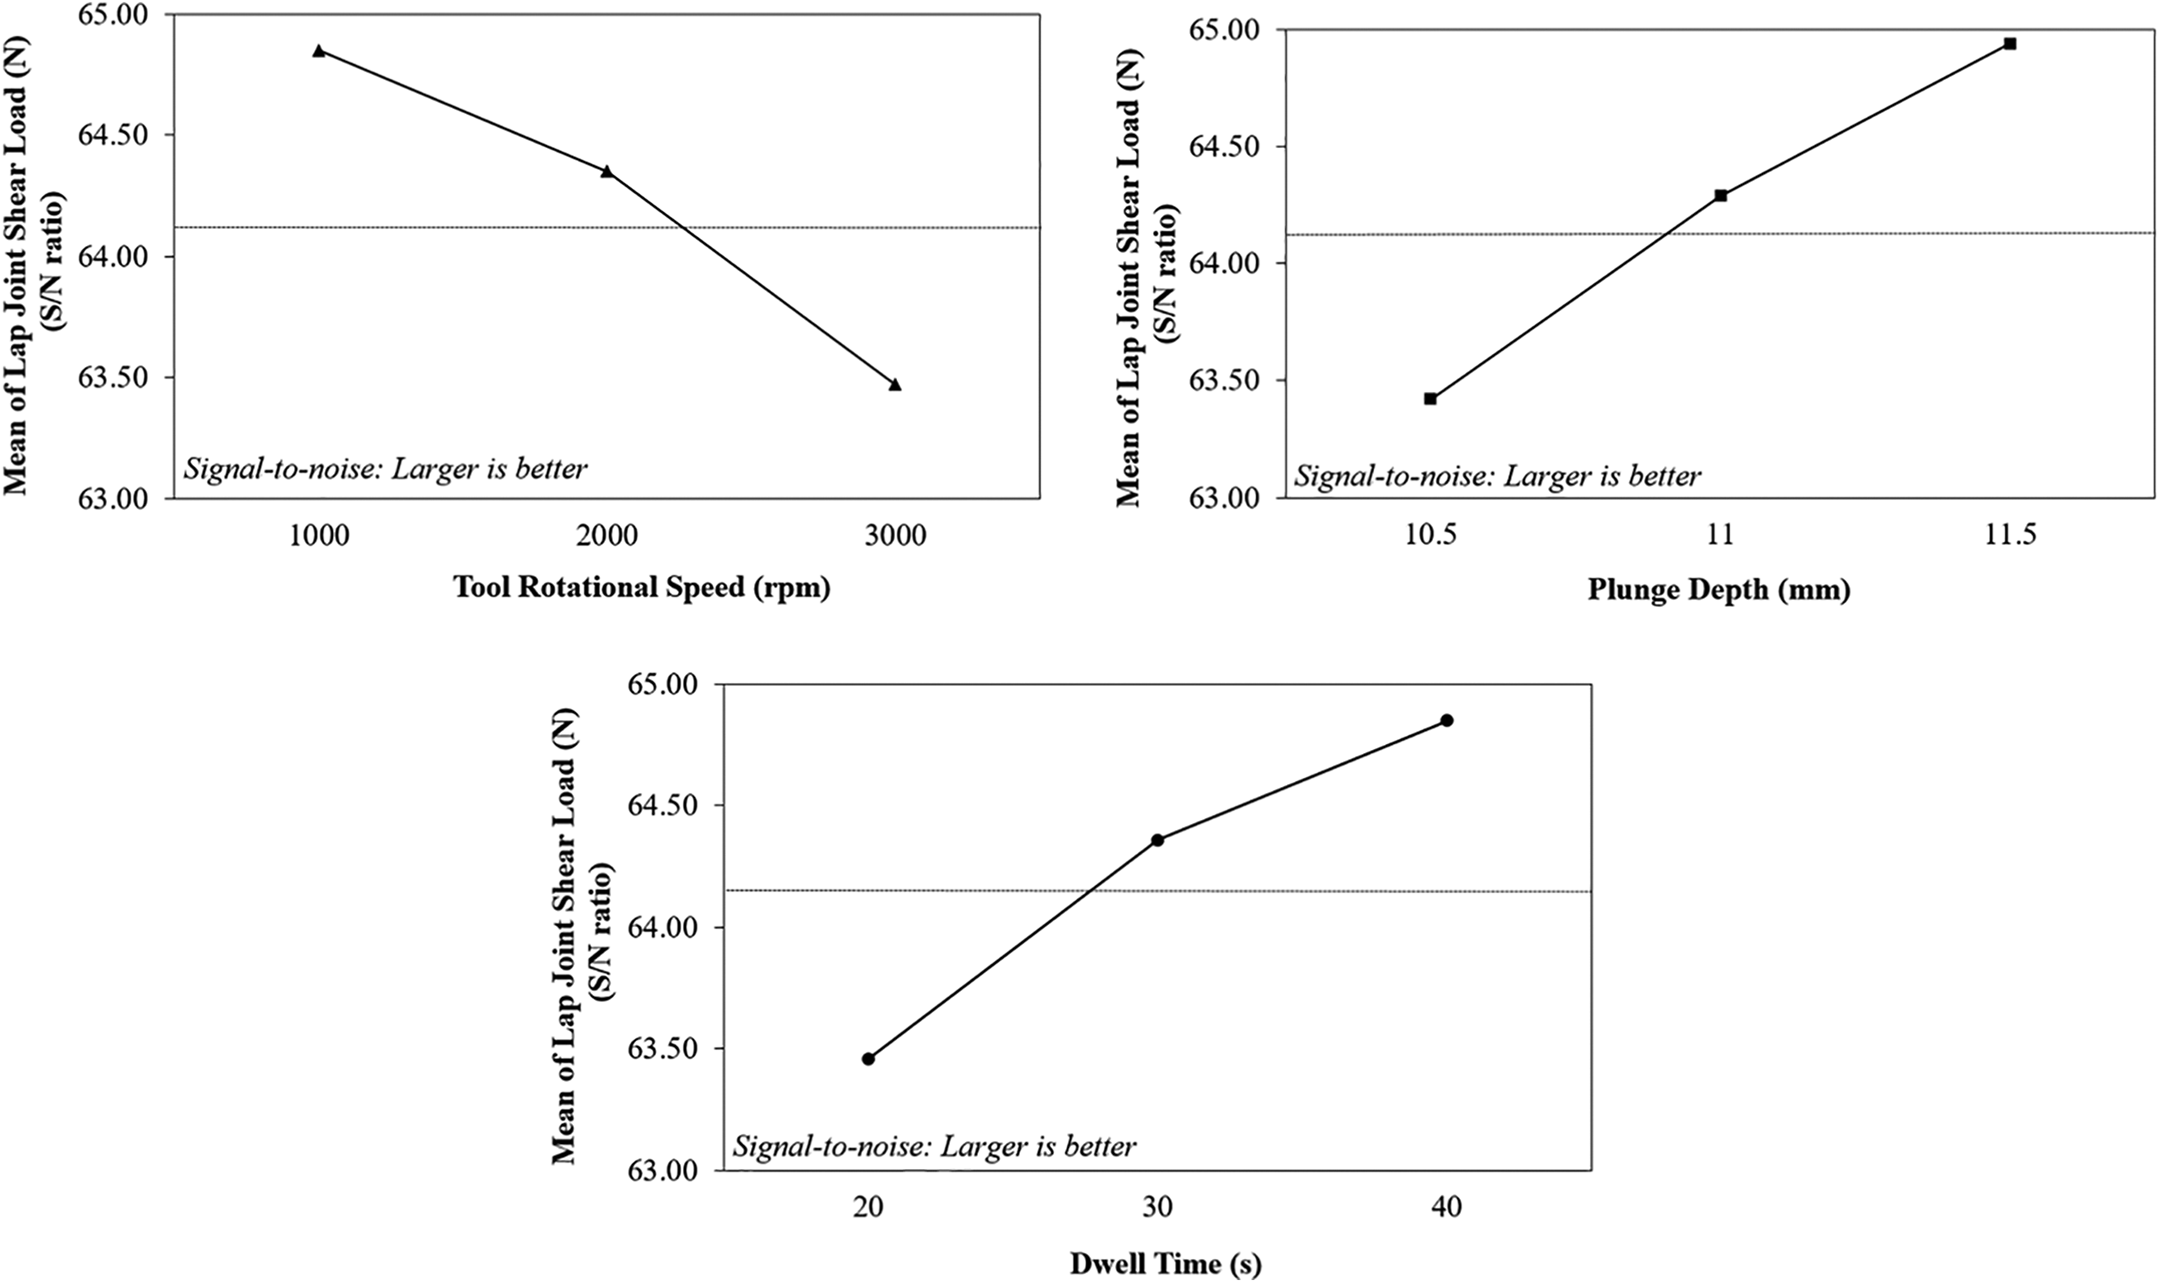
Main effects plots for S/N ratios.
There is two way to determine the influence of welding parameters that is performed in two steps: analysis of variance (ANOVA) and Fisher Test.
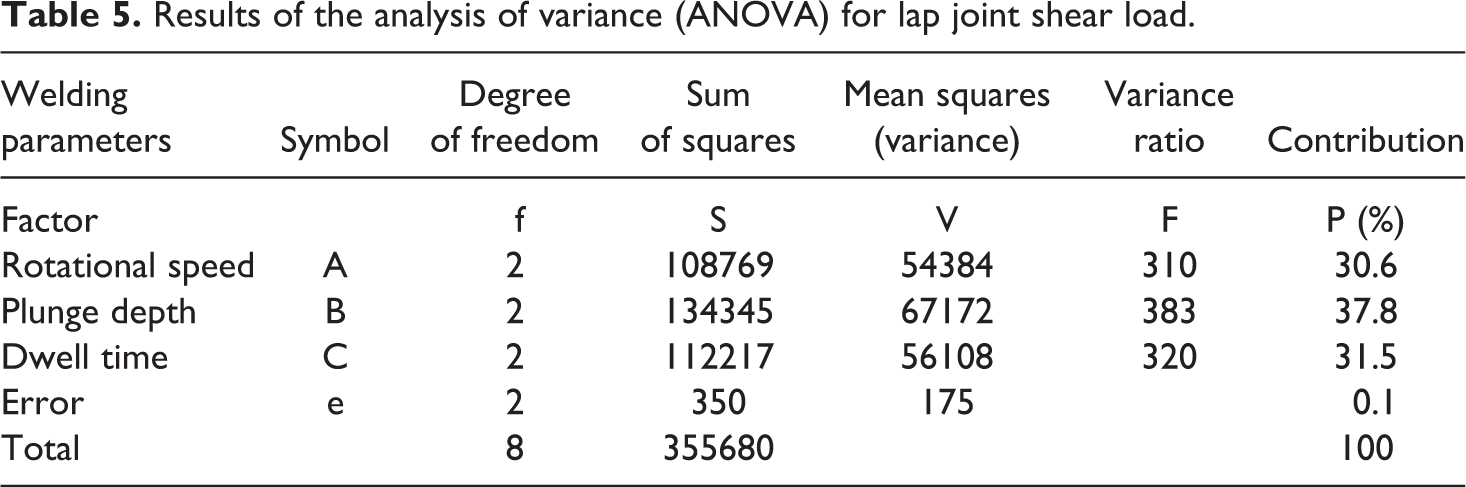
As a first step of the statistical analysis, the ANOVA method is used to obtain which parameters significantly influence the properties of quality or measure the performance characteristics statistically. This study includes process input variables (tool rotational speed, plunge depth, dwell time) and output variables as shown in Table 5. Evaluations and calculations of ANOVA results for lap joint shear load of means were carried out by using Minitab v17.1 software (Table 5).
Results of the analysis of variance (ANOVA) for lap joint shear load.
In the second step, the Fisher test provides determining the degree of significance of process parameters. For the large F values, the welding parameters get more significant statistically.
It was found that process input variables showed a very significant influence on welding strength at the 99.5% confidence level because of their F values (310.8, 383.8, 320.6) which are greater than Fisher test values (F0,005 (2,2) = 199) (Table 6). Plunge depth has a maximum significant effect to improve weld strength.
Fisher test values.
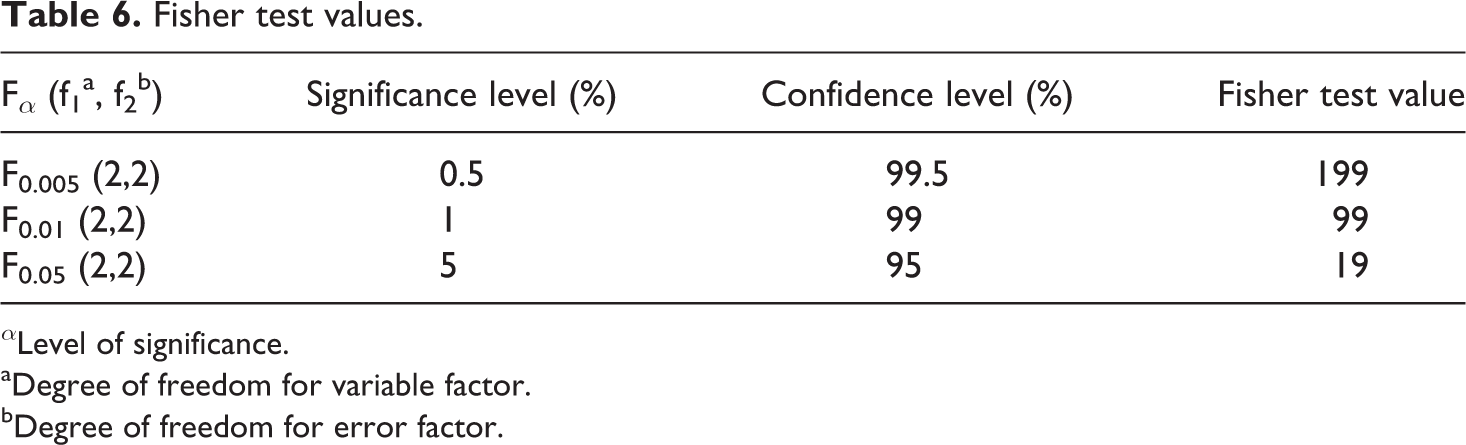
αLevel of significance.
aDegree of freedom for variable factor.
bDegree of freedom for error factor.
Rate of contribution
The percentage of contribution is the part of the total variation of each factor identified in the experimental design. The influence of the control factors on the process is shown in Table 5. The total percentage of contribution was 99.9%. The error ratio was only 0.1% and it is concluded that the experimental design was carried out very successfully.
In FSSW of ABS specimens, the most effective factor was plunge depth with a contribution rate of 37.8%. Therefore, this factor has a critical importance in effecting the weld strength.
Weld joint morphology
Process parameters directly influence the morphologies of welded specimens as well as mechanical properties. Figure 7 shows a schematic illustration of the cross-section of a friction stir spot welding joint.
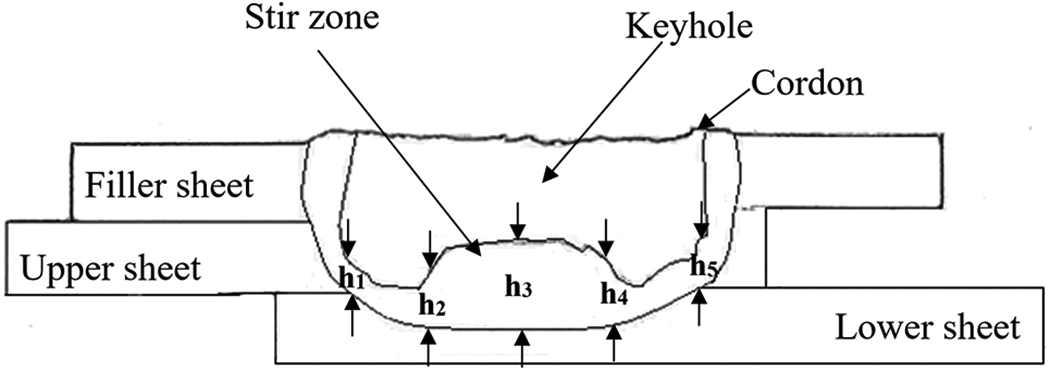
The cross-sectional schematic view of the FSSW joint.
In FSSW, the center of the joint is called stir zone (SZ) or weld nugget (Figure 7). The weld nugget means the weld bond in the FSSW joints. The cross section area of a weld nugget provides an evaluation of the strength of a weld and its fracture morphology. In the welding process, the heated and softened sheet flowing radially and upward is penetrated by the rotating tool.
The particles of the molten materials are spun and extruded in the form of a cordon by the tool and ejected from the weld zone by inertial forces during the stirring process. 21 Thus, the material loss increases with the forces in the weld area (Figure 7). A flow of the material is close to the movement of the tool. The designed threaded welding tool has capable of creating excessive friction heat and stirring, provides softening in the stirring zone and the nugget gets thicker.
Measuring the nugget heights (h1, h2, h3, h4, h5) from the cross-section of the weld specimen may indicate the nugget cross sectional area (Figure 7). In order to measure nugget heights and investigate the effects of the nugget heights, three welded samples were cut by water jet cutting.
Figure 8 shows the cross sectional views of welded joints fabricated by using the same welding conditions for which highest, moderate, and lowest lap joint shear loads measured by the lap shear test. The nugget heights measured from five different points in stir zones for three welded specimens were tabulated in Table 7.
Nugget heights for welded joints with highest, moderate, lowest lap joint shear load.
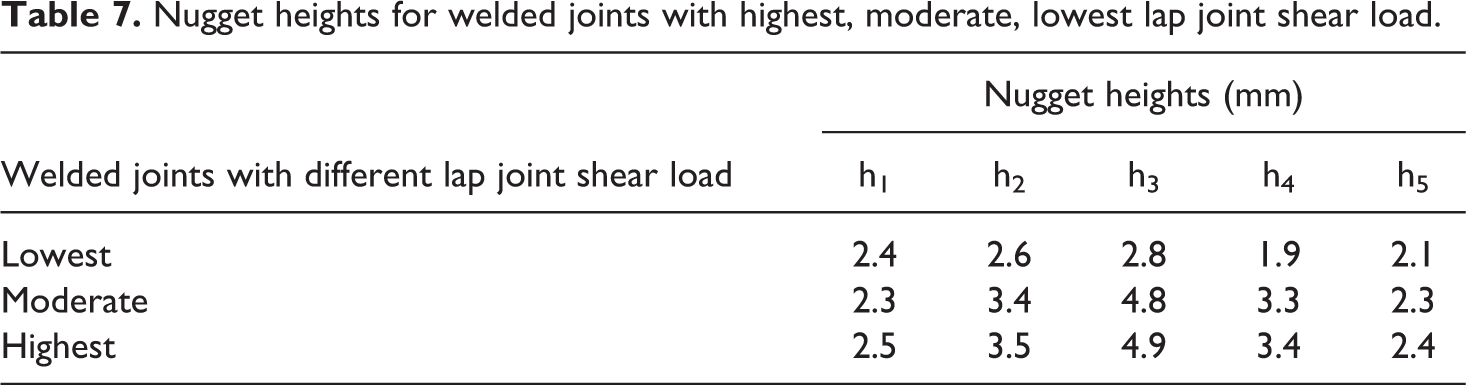
The heights validate that while nugget heights increased, the lap joint shear loads increased (Table 7). Thus, the highest lap joint shear load was obtained for the welded joint by selecting the lowest level of tool rotational speed, high level of plunge depth and dwell times.
A keyhole forms during friction stir spot welding. Upper and lower sheet materials are displaced upwards and outwards by the movement of the tool when the rotating pin forms the keyhole. After the retraction of the threaded pin tool, the keyhole remains at the weld area. (Figure 7)
Keyhole size (Figure 8) in the stir zone of welded joint with the highest lap joint shear load (Figure 8(c)) was smaller compared welded joint in Figure 8(a) and (b). The cross sectional appearances showed that with the decrease of the keyhole size, the lap joint shear load increased.
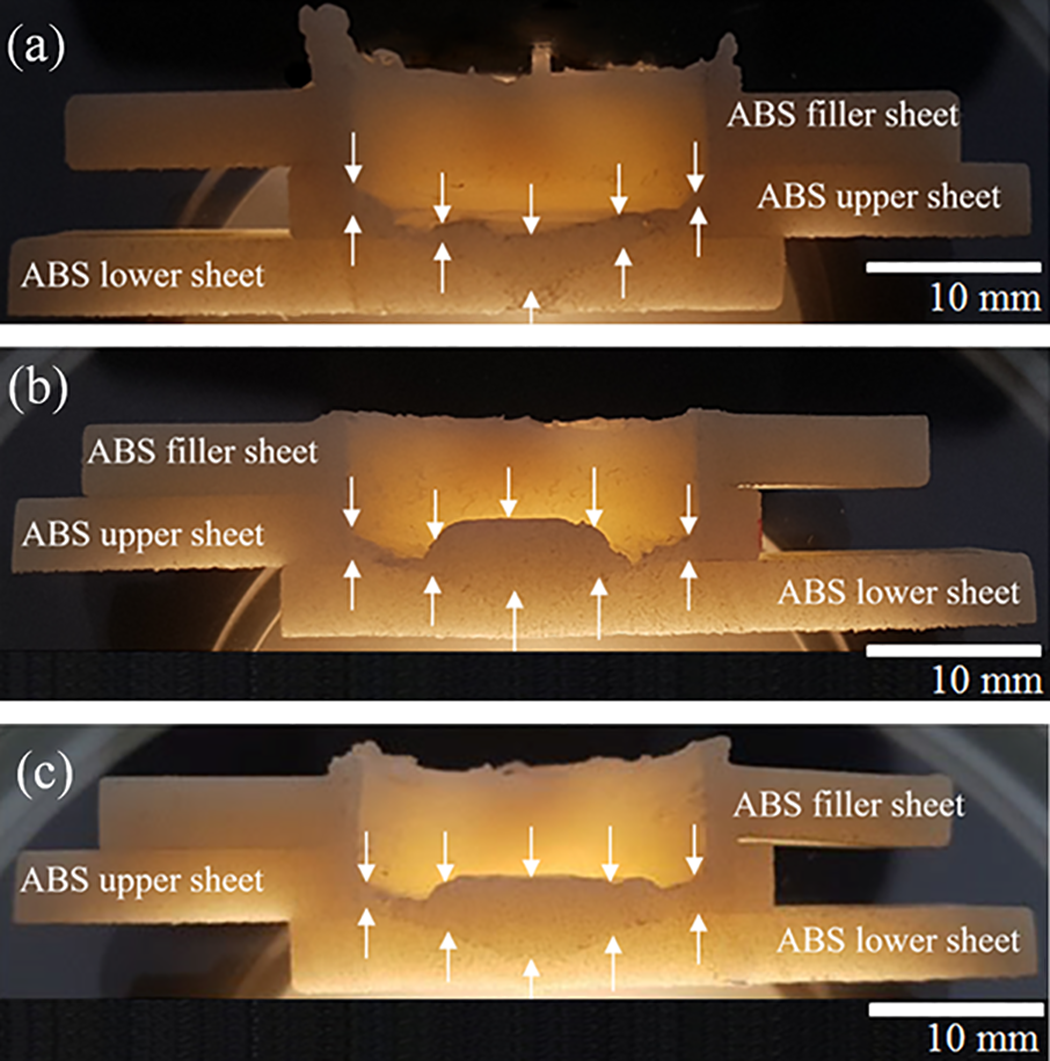
The cross-sectional macrostructures of welded specimens (a) lowest lap joint shear load with 3000 rpm, 11 mm, 20 s, (b) moderate lap joint shear load with 2000 rpm, 11.5 mm, 20 s, and (c) highest lap joint shear load with 1000 rpm, 11.5 mm, 40 s. ABS: Acrylonitrile butadiene styrene.
Effect of process parameters
It was observed lap shear fracture load decreased along with an increase in tool rotational speed (Figure 6). The maximum lap joint shear load occurred at a tool rotational speed of 1000 rpm. Excessive tool rotational speed led to overheating of the tool and defects in a large amount of material as a result of inertial forces. The rotational speed of 1000 rpm among the designed experiment parameters had a strong joint by creating sufficient frictional heat for ABS-ABS welded specimens.
Also, the plunge depth dramatically affected joint strength (Table 5). Lap joint shear load increased almost linearly with an increase in plunge depth. The maximum lap joint shear load was obtained at 11.5 mm of plunge depth (Figure 6). As the penetration increased, more frictional heat was generated by the threaded tool pin and the pressure exerted by the tool shoulder.
As shown in Figure 6, the increase in the levels of dwell time (from 20 s to 40 s) brought about an increase in the lap joint shear load. Lower dwell times led to a reduction in the nugget height. Because the time required to produce the heat of friction was insufficient. 25 When the longer dwell time was elapsed in the stirring zone, the nugget height increased because of the generation of more frictional heat and softening of materials. Consequently, increasing dwell time had an important effect on weld strength.
Optimum lap joint shear load and comparison of the results
The optimum welding parameters A1B3C3 having the maximum joint strength values are deduced from Table 4 and Figure 6. Also, optimum welding parameters and their levels are demonstrated in Table 8.
Optimum welding parameters and levels.
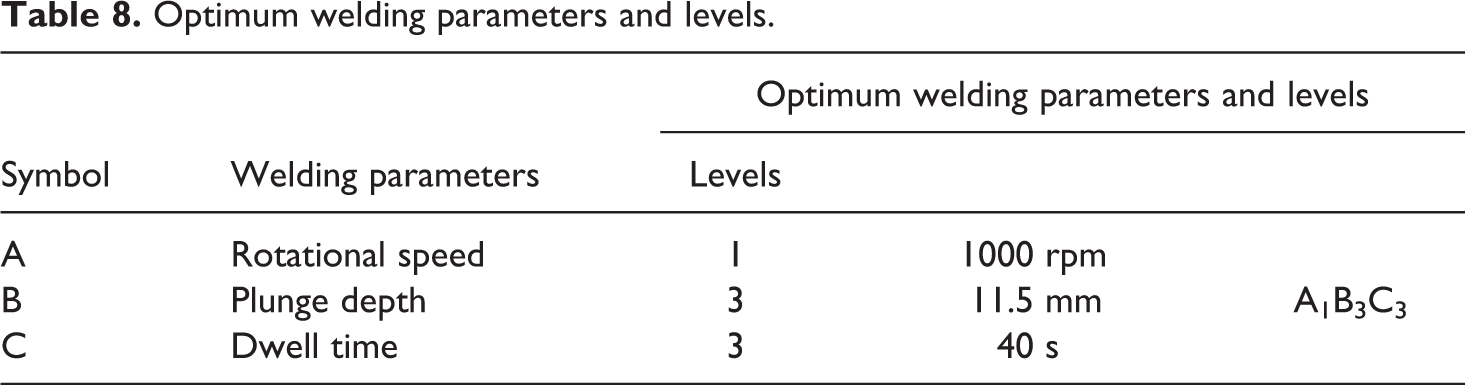
A1B3C3 means tool rotation (A), feed rate (B), and shoulder diameter (C) are set to levels 1, 3, and 3, respectively.Depending on the experimental results, the predicted value of lap joint shear load (SLp) for optimum welding parameters can be calculated means of equation 3.
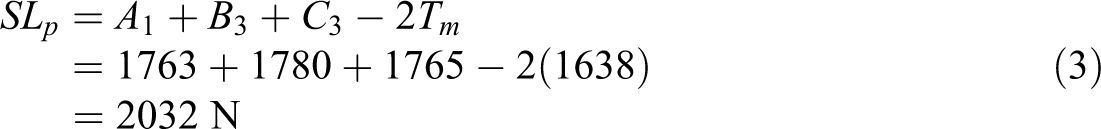
where Tm is the overall average of lap shear fracture loads by obtained experiments.
The final step is the confirmation of experiments after evaluating the optimum welding parameters in order to validate the obvious results with the analysis. The confirmation of the experiment provides validation of predicted values with the experimental results. If the optimum combination of parameters and their levels coincidently match with one of the experiments in the orthogonal array then the confirmatory experiment is not necessary. 30 Because the confirmation experiment specimen had already been welded by using A1B3C3 optimum welding parameters during the experimentation (Table 2), no confirmation experiment was performed.
Then, S/N ratio graphs are used to find optimum welding parameters as well as determining the initial welding parameters (Figure 6). The closest points represented by A2B2C2 to the average level indicated by the dashed line in Figure 6 were found as the initial welding parameters and corresponding levels are also shown in Table 9. 31
Initial welding parameters and levels.
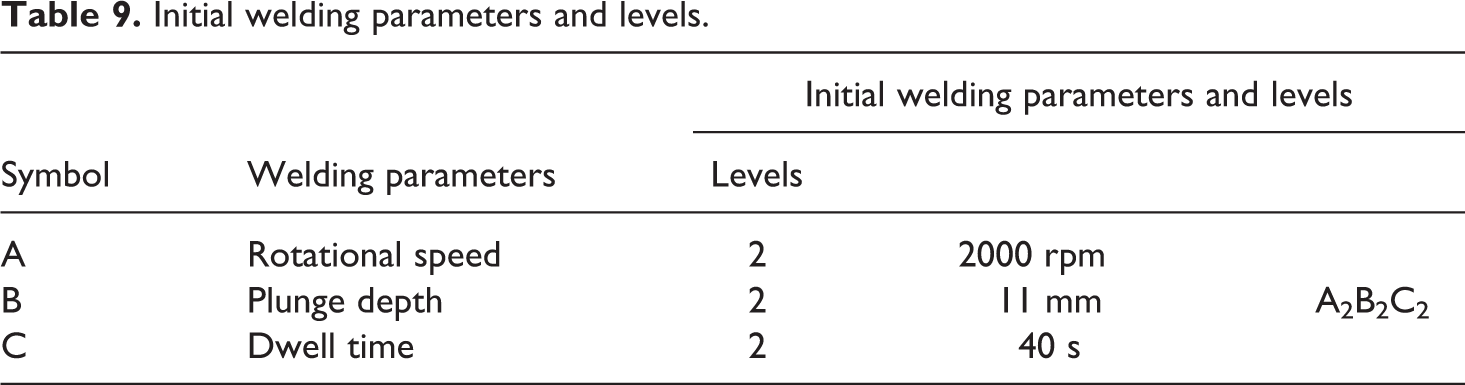
Initial lap joint shear load (SLi) can be calculated as in equation 4.
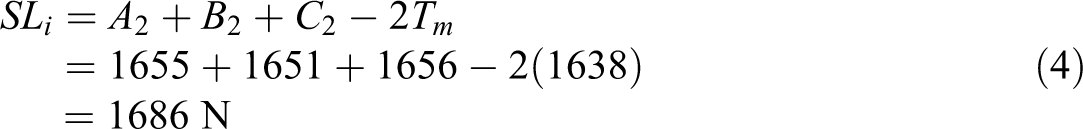
where A2B2C2 is the average of rotational speed, plunge depth and dwell time at second levels respectively.
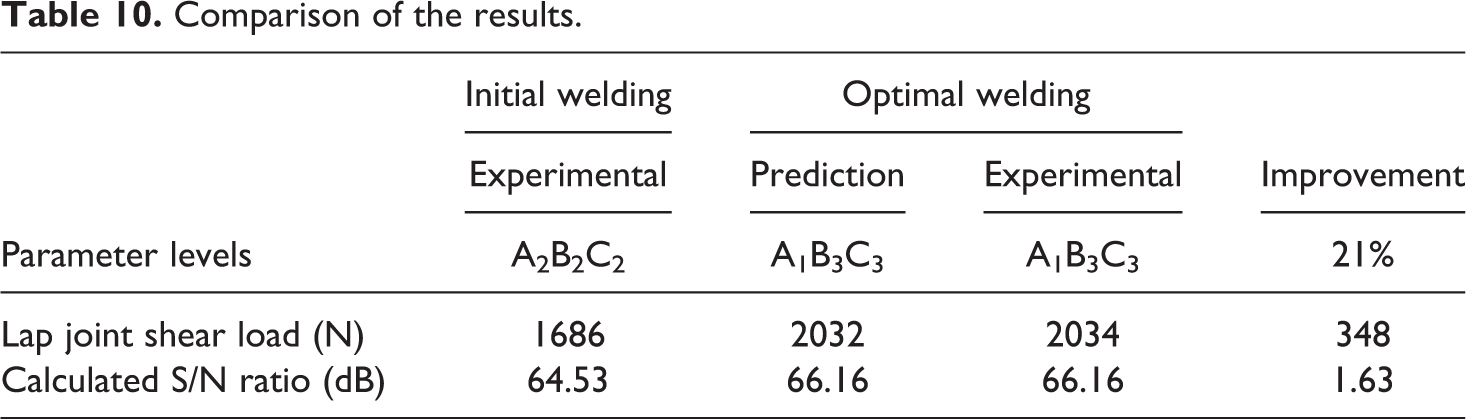
The prediction for the lap joint shear load is reasonable when it is compared with the experimental value. According to the results, lap joint shear load gain is about 21%. The S/N ratio was enhanced by 1.63 dB and lap shear fracture load is increased by 348 N from the initial welding parameters to the optimum welding parameters (Table 10).
Comparison of the results.
Failure modes
Three different failure modes were observed after the lap joint shear test of the samples as shown in Figure 9.
The failure modes (I) upper sheet fracture and (II) upper nugget fractures and (III) lower nugget fractures.
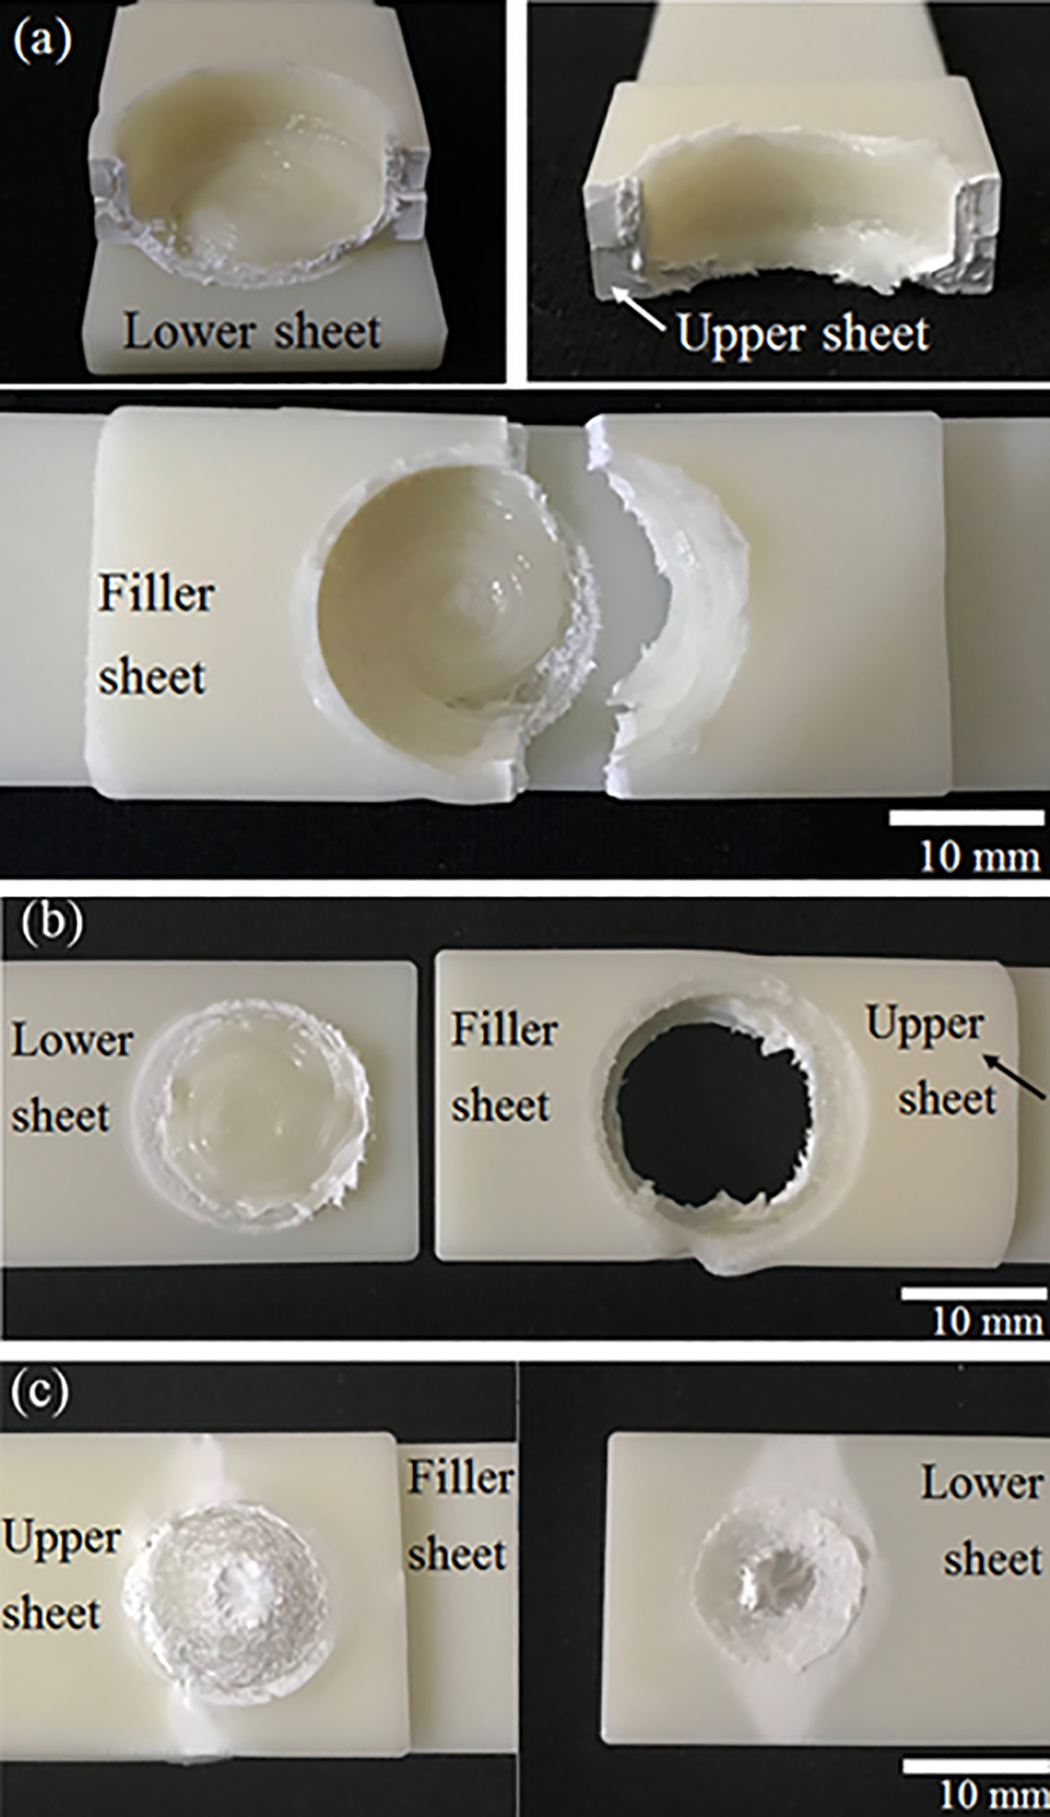
Failure modes (a) upper sheet fracture (highest lap joint shear load of 2034 N with 1000 rpm, 11.5 mm, 40 s), (b) from the upper nugget fracture—(moderate lap joint shear load of 1766 N with 2000 rpm, 11.5 mm, 20 s), and (c) from the lower nugget fracture—(lowest lap joint shear load of 1240 N with 3000 rpm, 11 mm, 20 s).
In mode I, upper sheet fracture showing maximum lap joint shear load was obtained after the lap joint shear test, and this type of failure was illustrated in Figure 9(a). The separation of the stirred zone from the upper sheet shows strong adhesion in the stir zone due to the larger outer diameter of the nugget.
For the other failure modes (upper nugget and lower nugget failure) high lap joint shear load values were not observed unlike in the case of first failure mode due to the small bonded area and thin nugget.
Failure mode II showed the moderate lap joint shear load and the joints were sheared off as called upper nugget failure (Figure 9(b)). This failure type had a smaller bonded area than the first type of failure mode.
In the last type as failure mode III, the smallest outer nugget was observed due to the insufficient dwell time (10 s) to generate friction heat (Figure 9(c)). As a result, failure mode III has the lowest lap joint shear load in the experimental design.
Conclusions
The friction stir spot welded ABS-ABS specimens were investigated to determine the lap joint shear load. Taguchi method is applied systematically for evaluating the optimization of welded joints by reducing the number of experiments and time. The rotational speed, plunge depth and dwell time significantly influenced the ABS specimens. The most dominant parameter with a value of 37.8% was the plunge depth and this followed by dwell time of 31.5%, tool rotational speed of 30.6%, respectively. An experimental error was observed only 0.1%. Therefore, it can be understood that the experimental design was very successful. Optimum level parameters were obtained to reach maximum weld strength by Taguchi experimental method. These are plunge rotational speed of 1000 rpm, depth of 11.5 mm, and dwell time of 40 s. The maximum lap shear fracture load of 2034 N was obtained under the optimum welding parameter condition. The lap joint shear load of the optimum combination of parameters was predicted as 2032 N. As a result of optimization, lap shear fracture load has improved 21% which means an improvement in lap joint shear load from the initial welding parameters to the optimum welding parameters. The results of the experiments prove the efficiency of the robust Taguchi technique for the optimization of the FSSW.
It has been revealed that keyhole size was reduced and the lap joint shear load was improved of the welded specimens by adding one layer filler plate. Three different failure modes were observed: (I) the separation of the stirred zone from the upper sheet and (II) upper nugget fractures and (III) lower nugget fractures.
Further studies may consider an evaluation of the effect of the different welding parameters on mechanical properties by using Taguchi methodology. Also, the most common problem is the remaining keyhole in the friction stir spot welding process. Thus, different tool profiles and geometries can be used to minimize the size of the keyhole without using filler material and different welding apparatus can be designed to restrict material loss in the stirring zone.
Footnotes
Acknowledgement
The authors are deeply grateful for the technological and informational support of Department of Mechanical Engineering of Izmir Katip Celebi University and Department of Polymer Technology of Ege University, Izmir, Turkey.
Declaration of conflicting interests
The author(s) declared no potential conflicts of interest with respect to the research, authorship, and/or publication of this article.
Funding
The author(s) received no financial support for the research, authorship, and/or publication of this article.