
Abstract
Alcohols are increasingly being looked upon as the most viable alternative to the conventional sources of energy. Methanol is the first member of the alcohol family and can be easily synthesized from syngas. It is an attractive blend to gasoline due to its advantageous properties. There is a necessity to make sure that the infrastructure is ready to adapt these alternative fuels. Hence, the aim of this study is to assess the degradation of widely used thermoplastics in fuel tanks, pipes, and the fuel injection system, namely, polytetrafluoroethylene (PTFE), polyethyleneterephthalate (PET), and high density polyethylene (HDPE) post exposure to methanol–gasoline blends (P100, M15, and M30) for a period of 4, 10, and 30 days. The effects of the exposure were examined by comparing changes in gain/loss of mass, hardness, elongation, and tensile strength. The surface morphology changes of the polymeric coupons were characterized by scanning electron microscopy and their elemental analysis was done by energy dispersive X-ray spectroscopy. The studied materials were found to gain mass in the order HDPE > PTFE >PET. The decrease in hardness was found to be more in HDPE followed by PTFE and PET. PTFE and PET showed reduction in strength but an increase in tensile strength was observed for HDPE post exposure to fuel blend. Highest change in elongation was found in HDPE followed by PTFE and PET. The changes were found to be the least in P100 followed by M15 and maximum in M30 blends for all immersion periods.
Introduction
Over the past few years, there is a gradual transition to greater use of alternate fuels. These fuels make use of different feedstocks and are produced using new pathways and technologies and in varying formulations. These alternate fuels are generally blended with the conventional fuels like gasoline and diesel. Alcohols are predominantly being used as blends with gasoline and diesel. This results in reduction of consumption of fossil fuel resources and significantly reduces the toxic emissions being let out of the automobiles. Methanol has many advantageous characteristics that make it suitable to be used as a fuel in spark ignition engine, it has high molar expansion ratio, high hydrogen to carbon ratio, is a liquid at standard temperature and pressure, has high heat of vaporization, and high flame speed.1,2 It undergoes combustion at low temperature, being an oxygenate undergoes more complete combustion, has no sulfur contents, and therefore has zero sulfur-based pollutants.3,4
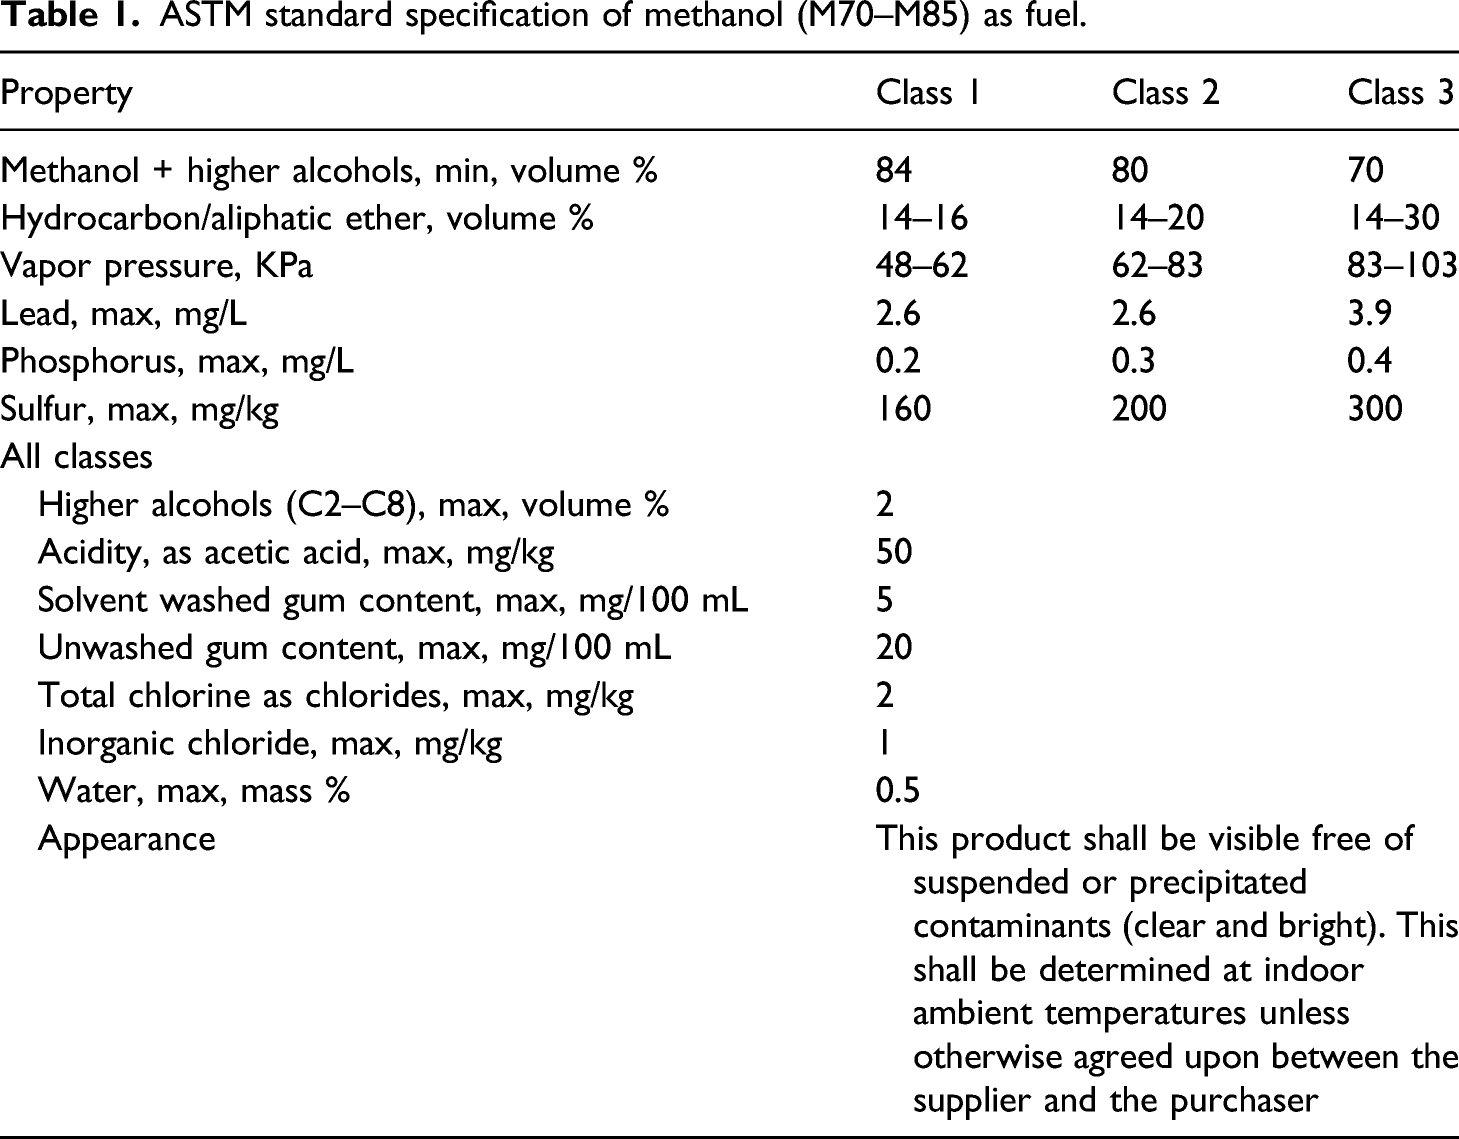
ASTM standard specification of methanol (M70–M85) as fuel.
Basic components of fuel system are shown in Figure 1. It consists of fuel tank, feed pump, fuel filter, injector pump, and injector connected with lines. The fuel feed pump helps to draw fuel from fuel tank to injector of various cylinders. Schematic of basic fuel system.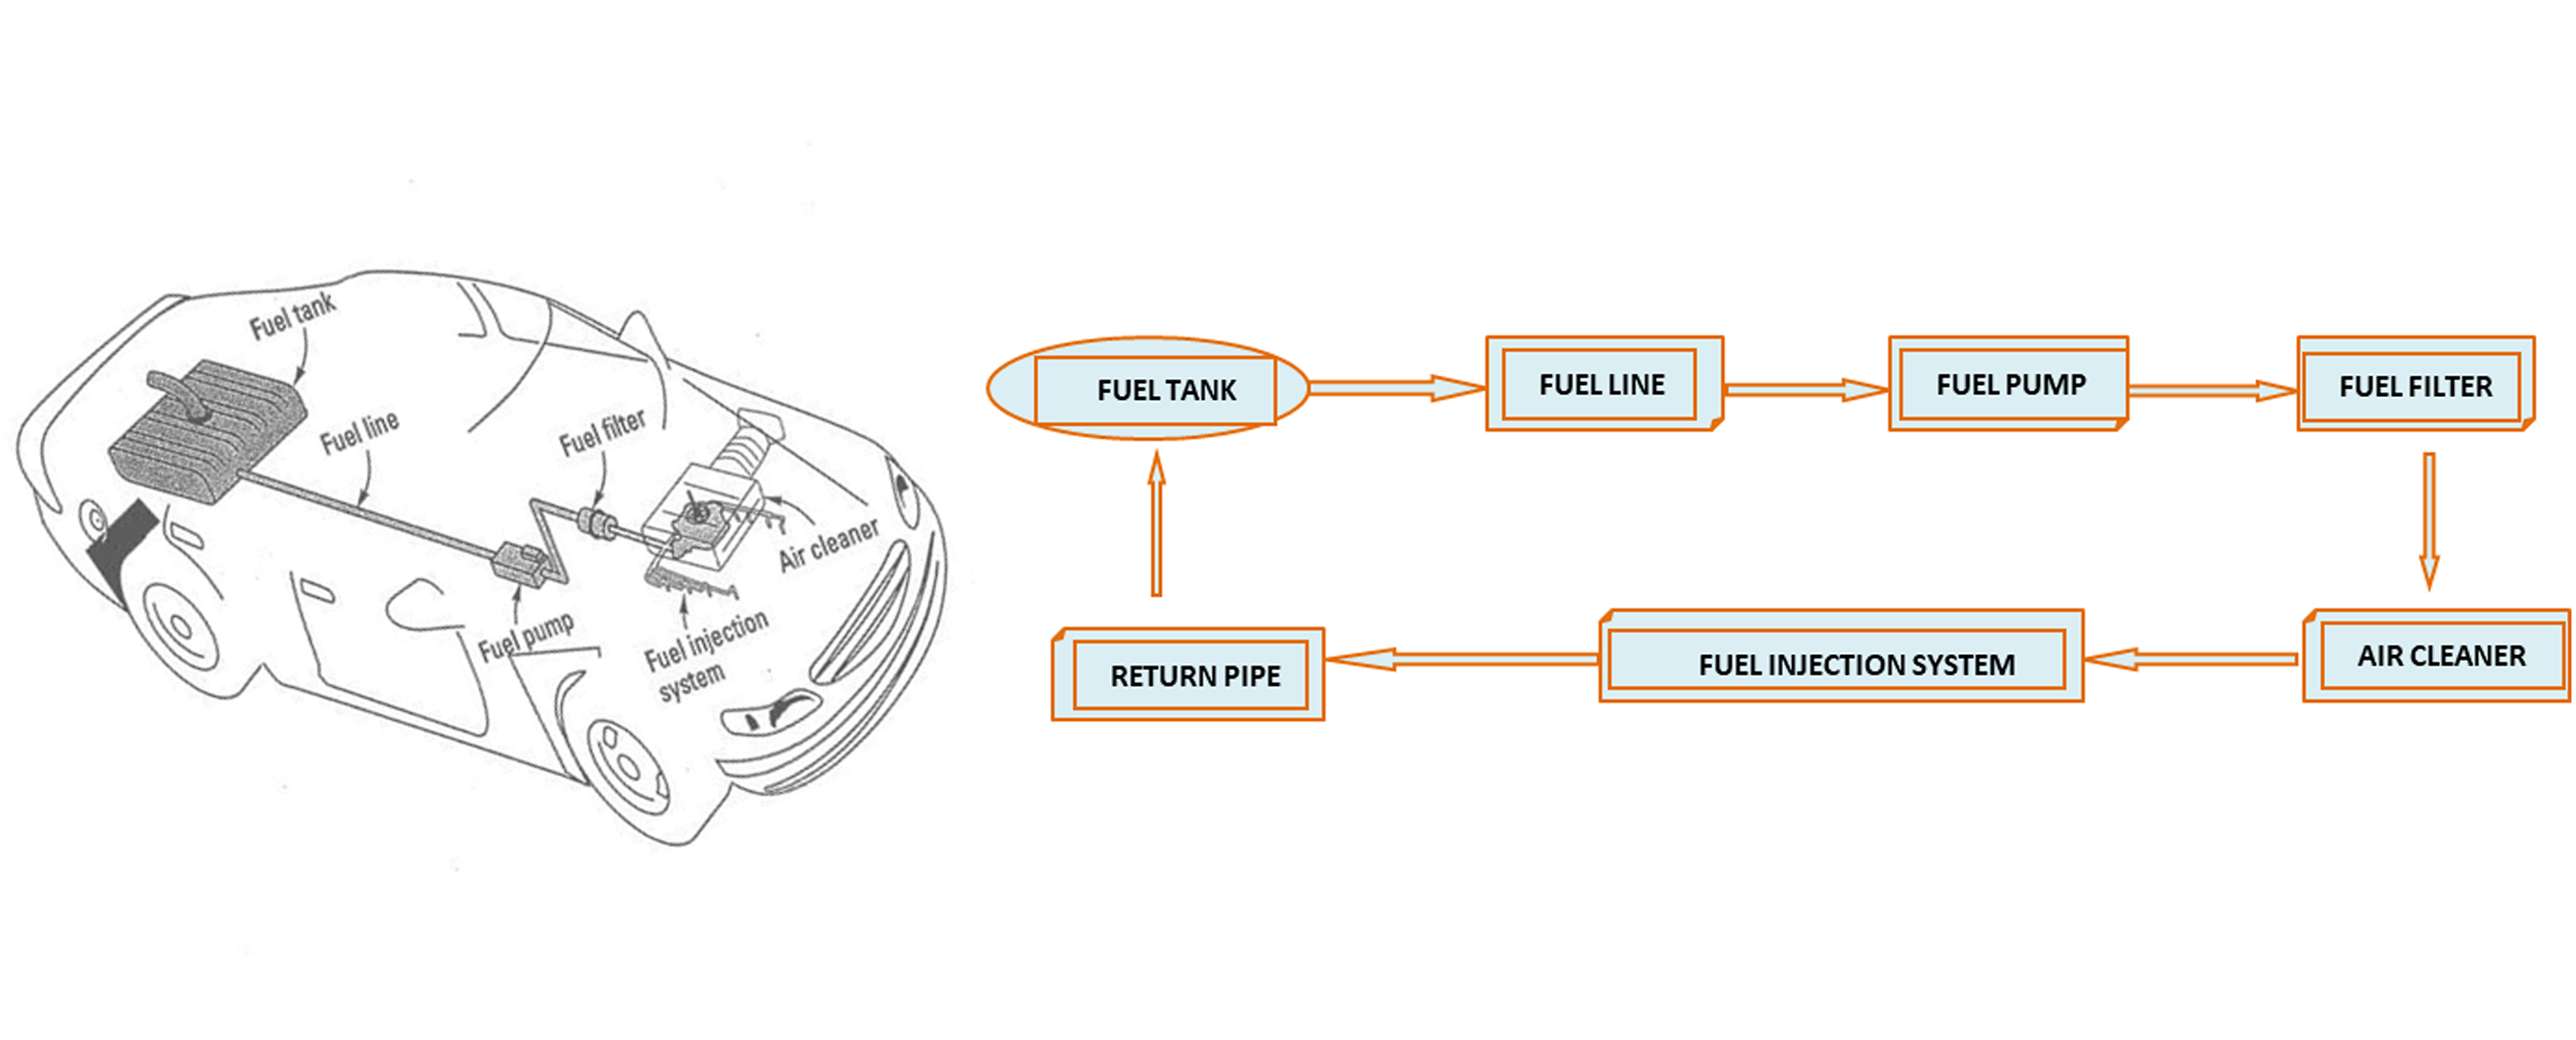
Polymeric materials are commonly used to construct fuel tank, fuel hose, and fuel filters in the supply system. Thermoplastics are used as permeation barriers and flexible piping wall materials. Thermoplastic polymers are treated with additives such as glass fibers, ceramic fillers, thickeners, antioxidants, antimicrobials, impact modifiers, plasticizers, and light stabilizers to improve their properties. 6 The strength of thermoplastics gets reduced because of swelling and subsequent cracking due to internal stress. Degradation of plastic materials depends on their physical nature and on the type of attack. The result of such attacks can include softening, charring, delamination, embrittlement, discoloration, and dissolving or swelling. Excessive damage to the structural materials may result in fuel leakage and can lead to explosion which can be hazardous to human lives and environment. PTFE, PET, and HDPE find numerous applications in fueling infrastructure materials owing to their superior properties.7,8 However, the lifetime of these materials in a specific environment cannot be accurately predicted until there is a clear understanding of the degradation process.
Several researchers have studied the effect of biofuel and traditional fuel blends on various polymeric materials and some of them have been discussed here. Kass et al. 9 studied the compatibility of plastics, namely, polyamides, PTFE, polyvinylidene fluoride (PVDF), ethylene tetrafluoroethylene (ETFE), polyphenylene sulfide (PPS), HDPE, polybutylene terephthalate (PBT), polyloxymethylene (POM), polyetherimide (PEI), polyetheretherketone (PEEK), and phenol formaldehyde reinforced with glass fiber with the 16% isobutanol (iBu16) and 10% ethanol (E10) test fuels (both separately studied with gasoline) and reported excellent compatibility between these polymeric materials and test fuels. However, structural degradation was observed for flexible polyvinylchloride (PVC) on exposure to either fuel type. Another study showed incompatibility of copolymer of PET and ethylene glycol with iBu16 and E10. 10
The effect of ethanol blended with gasoline (5% and 10% ethanol) has been studied on four types of elastomers—neoprene rubber, nitrile rubber, hydrogenated nitrile butadiene rubber (HNBR), and polyvinyl chloride/nitrile butadiene rubber blend (PVC/NBR), and two types of plastic materials, namely, nylon 66 and polyoxymethylene (Delrin). The materials were exposed in E5 and E10 for 100 h at 50oC. Various properties like mass loss, tensile strength, hardness, and elongation were measured after completion of the reactions. The study reported maximum leaching of PVC/NBR in E5 and E10 specimens. Maximum shrinkage was reported in neoprene dryout specimens, and Delrin was found to have good compatibility with the test fuel blends. 11 Another study reported no drastic changes in properties of POM, HDPE, polyamide 6, and nylon 66 post-immersion in E20 (ethanol 20% and gasoline 80%) blends. All the polymers immersed in E20 showed a mass increase of below 10%. 12 The compatibility of infrastructure materials such as styrene butadiene rubber (SBR), nitrile butadiene rubber (NBR), natural rubber (NR), fluorocarbons (Viton A401C and Viton B601), nylon (N6 and N6/6), polybutylene terephthalate (PBT), PET, polyphenylene sulfide (PPS), polyvinylidene fluoride (PVDF), polyoxymethylene acetal copolymer (POMAC), and PTFE with 10% ethanol blends of both aggressive and nonaggressive formulation and 55% butanol blend having aggressive formulation has been investigated for changes in mass, volume, and tensile strength. An increase in volume and mass of polymers after exposure was observed indicating the absorption of fuels into the plastic and elastomer materials. These materials showed reduction in tensile strength and elongation. 13
Studies on degradation of polypthalamide (PPA) and polyarylamide (PAA) in pongamia biodiesel and diesel blends showed significant changes in physical properties and surface morphology of the polymers. The overall compatibility sequence of polymers was found to be PAA > PPA for static and PPA > PAA for flow conditions. 14 Comparative studies of PTFE and NBR with B20D75E5, B0 (diesel 100%) and B100 (biodiesel 100%) blends showed that mass loss of NBR was higher than PTFE. Change in mass and volume of NBR is mainly attributed to the relaxation of polymer chain and absorption of solvent. 15 The degradation of PTFE, NBR, ethylene propylene diene monomer (EPDM), silicone rubber (SR), and polychloroprene (CR) was investigated in palm biodiesel–diesel blends. The extent of swelling of polymers was found to be least in pure diesel. The sequence of compatible elastomers in palm biodiesel is PTFE > SR > NBR > EPDM > CR. 16 Biodiesel even when blended with diesel is very prone to degradation because of the presence of unsaturated fatty acids in them. Diesel on the other hand is a mixture of aliphatic and aromatic hydrocarbons with no oxygen, thereby is more compatible with polymeric materials.
It is evident from the literature that alcohol blend fuels quicken the penetration of fuels in plastic materials. The present study aims to investigate the impact of methanol–gasoline blends on degradation of thermoplastics, namely, PTFE, HDPE, and PET. These material specimens were evaluated for changes in mass, hardness, tensile strength, and elongation before and after immersion in fuel blends.
Methods and Materials
Preparation of test coupons and fuel blends
Commercially available PTFE, HDPE, and PET sheets were purchased and test coupons of size of 50 mm length, 10 mm width, and 3 mm thickness were prepared. 2 mm diameter hole was drilled near the edge of the coupon to enable hanging the specimens into fuel. Prior to exposure, coupons were cleaned with deionized water and wiped with tissue paper. Then they were stored in the desiccators for further use. The test coupons used in this study and their chemical structures are shown in the Figure 2. Chemical structures and prepared coupons of thermoplastics.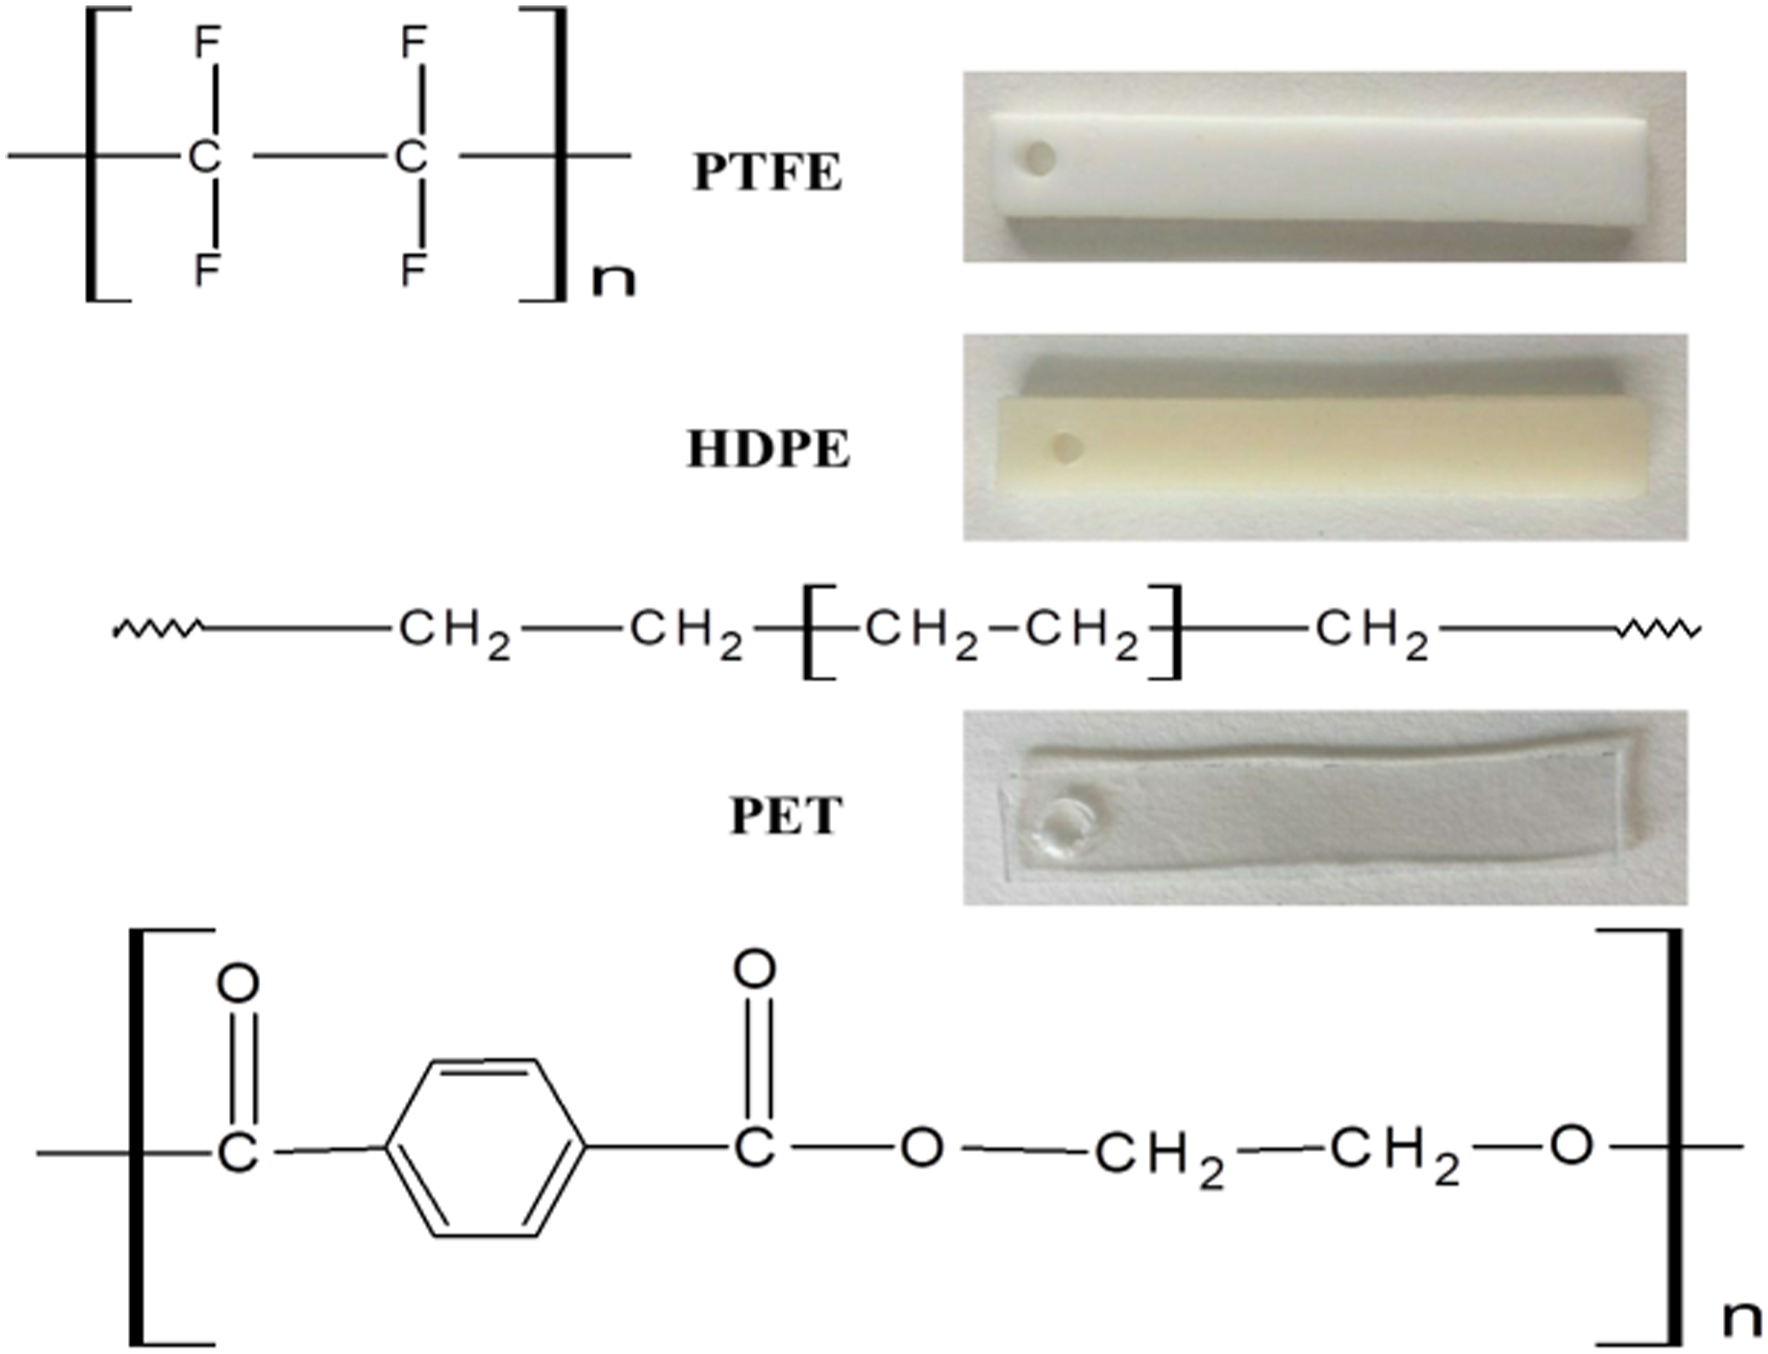
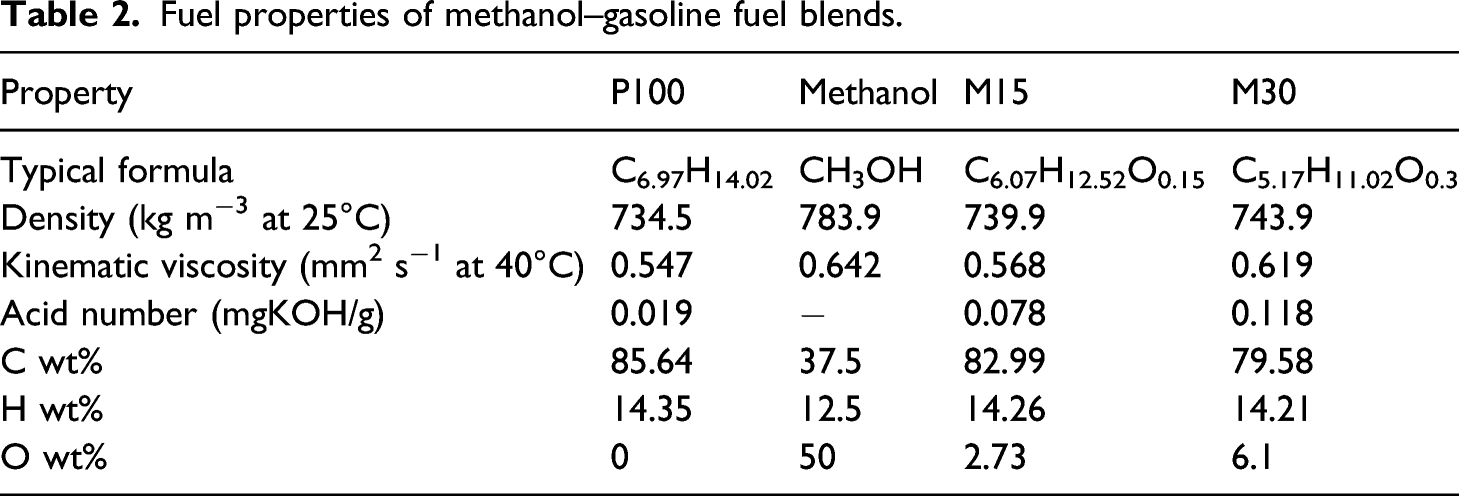
Fuel properties of methanol–gasoline fuel blends.
After the stipulated time (4, 10, and 30 days) of immersion in fuel blends, coupons were removed and wiped with tissue paper. Then they were stored in the desiccators for further analysis. Experiments were performed in triplicates and an average of the same was reported. The degradation of the tested materials was evaluated using the differences in mass, hardness, tensile strength, and elongation parameters.
Change in mass
Coupons were removed at stipulated time after immersion in fuel blends. These coupons were wiped with filter paper and weighed. Final mass is post-immersion weight and initial mass is weight of the cleaned coupon prior to immersion. The percentage change in mass was calculated as per the formula given in equation (1) and recorded.
Durometer hardness
The hardness of the coupons was measured as per ASTM D2240 18 before and after immersion in fuel blends to check the effect of various fuel compositions on polymeric materials. Yuzuki shore D rubber hardness tester was used to measure the hardness five times at different locations of each coupon and the average value was taken.
Measurement of ultimate tensile strength
The tensile strength was measured as per ASTM D638
19
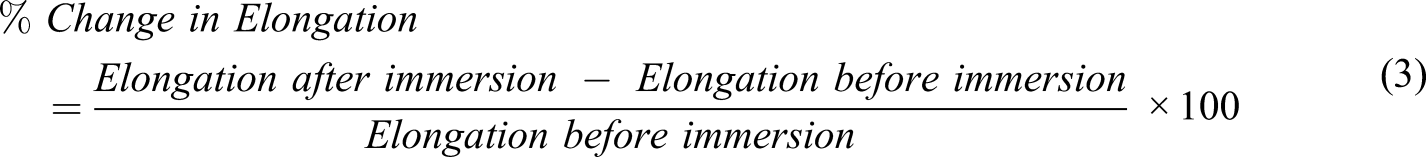
using MTS Exceed E43 (10 kN). The tensile strength and % elongation were measured before and after immersion coupons to determine the changes in tensile strength and elongation. These coupons were pulled at a uniform rate of 250 mm/minute until failure as per ASTM D412. Five coupons were measured in each condition and the average values were taken. The percentage change in tensile strength and elongation were calculated using the following formulae given in equation (2) and (3) respectively and reported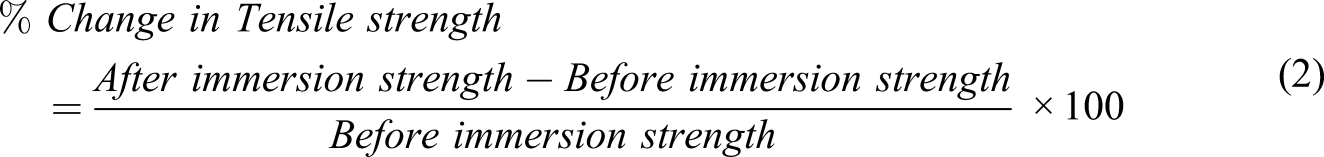
The surface morphology changes of studied coupons in various methanol–gasoline blends were characterized by scanning electron microscopy (SEM, HITACHI, SU3500) and elemental composition analyzed by EDS. The conductivities of fuels were measured before and after immersion of coupons in various fuel blends and compared. The fuel degradation, chemical structure, and functionalities for fuel blends were evaluated before and after the immersion of coupons by Fourier transform infrared spectroscopy (FT-IR) technique. The spectrum was recorded in the wave length from 4000 to 400 cm−1 using Shimandzu ATR spectrophotometer used at 4 cm−1 resolution and total 64 scans.
Results and Discussion
Change in mass
The mass change of PTFE, HDPE, and PET in P100, M15, and M30 has been investigated for different time of immersion at room temperature and 40°C. Studied thermoplastic materials immersed in fuel blends for different time durations showed considerable mass gain. This mass gain was found to increase with increase in exposure time for all materials. The mass gain percentage of the plastic coupons at room temperature and at 40°C for various immersion periods has been shown in Figure 3. These tested coupons showed mass changes ranging from 0.09% to 3.98% at room temperature and from 0.16% to 6.52% at 40°C. Changes in mass of thermoplastics in methanol/gasoline fuel blends for various immersion periods (a) room temperature and (b) 40°C.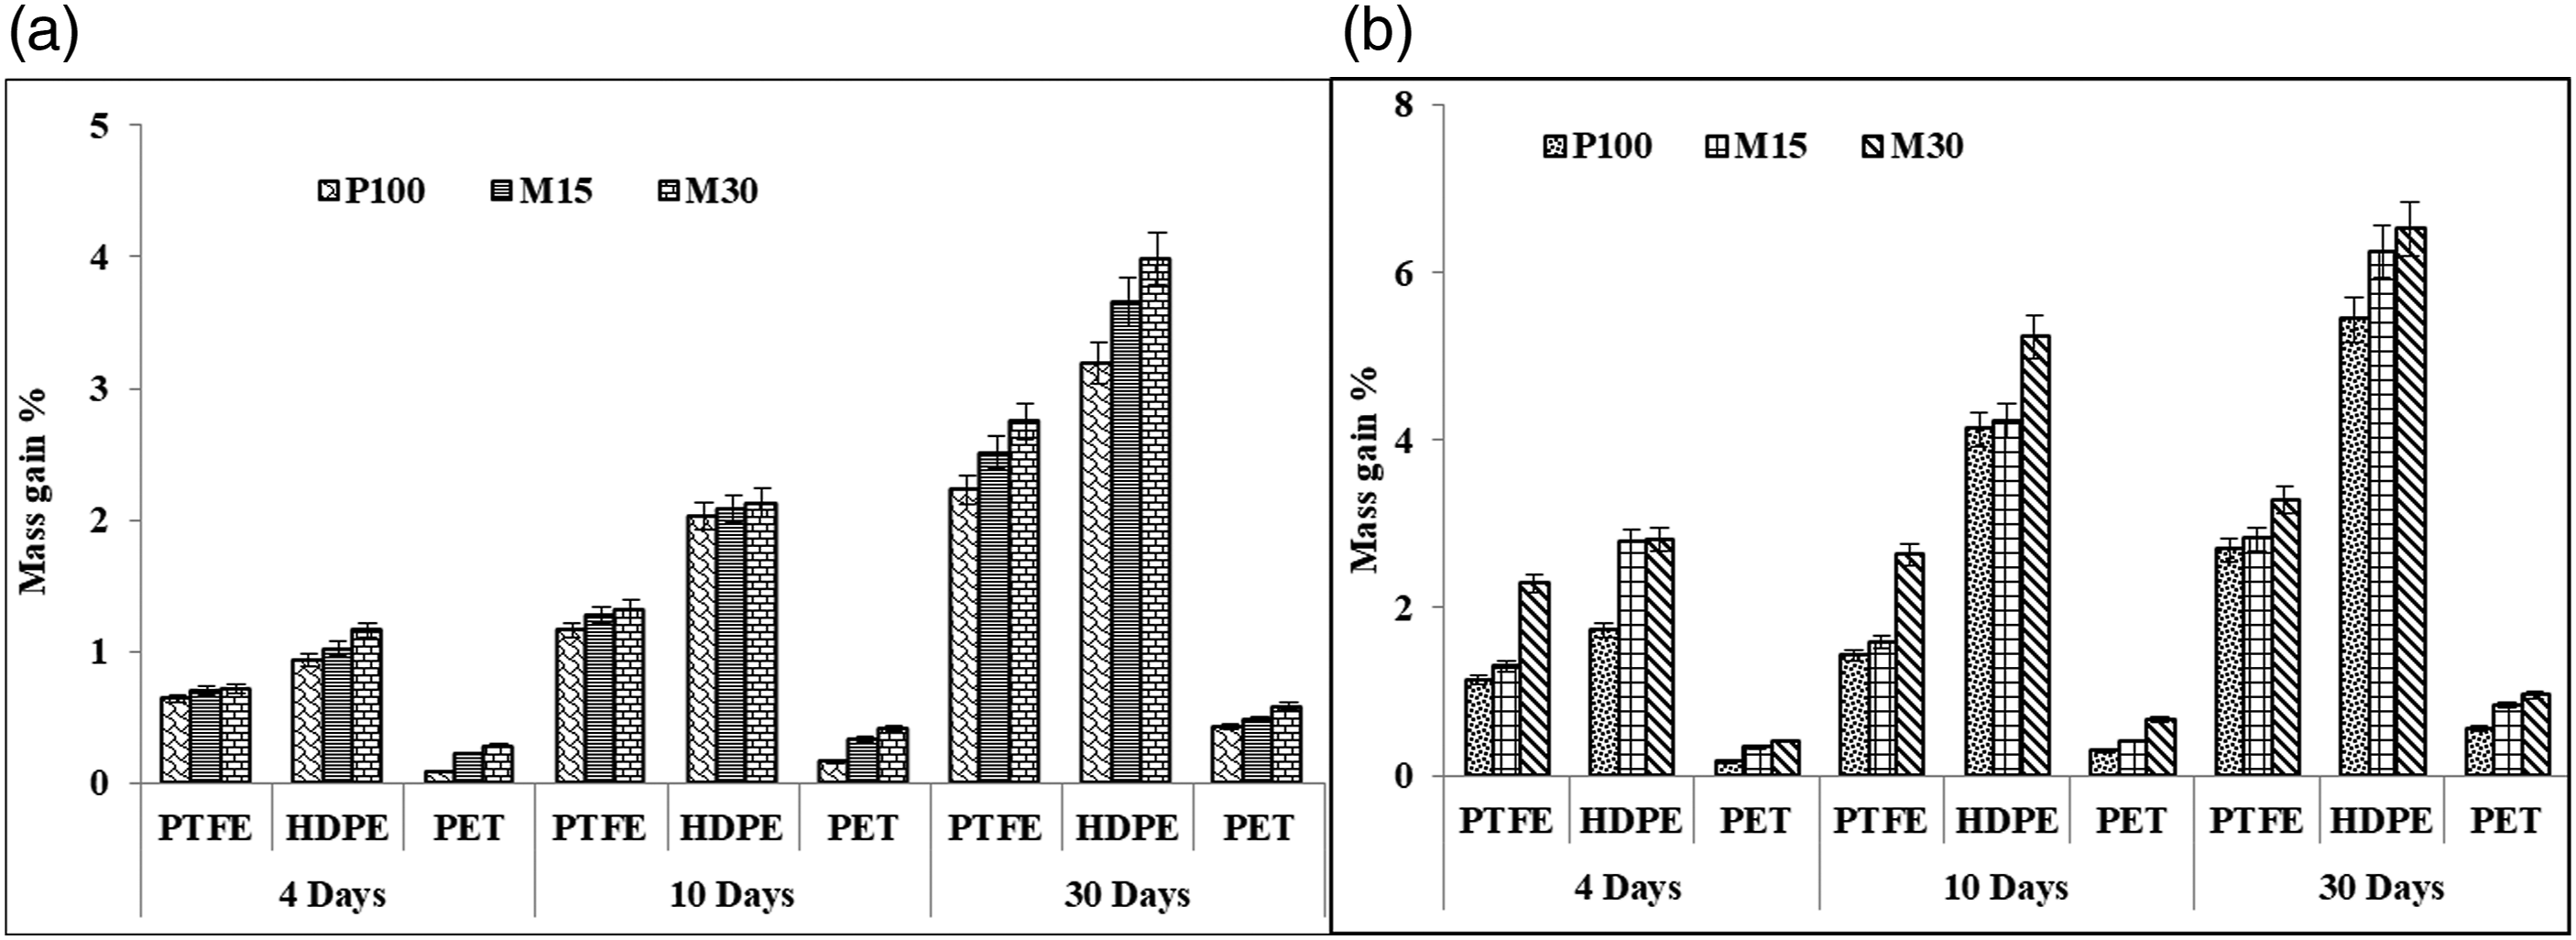
It is observed that there is a gradual increase in mass from 4 to 30 days immersion of thermoplastic coupons. Although there is an increase in mass gain % when methanol concentration increases, the influence of temperature and time is more predominant on the mass changes of thermoplastic coupons. Similar behavior has been observed in all studied coupons, but the magnitude of the degradation varied with the type of thermoplastics studied. The studied materials were found to gain mass in the order HDPE > PTFE > PET. At higher temperature, the molecules have more energy hence fuel absorption on the coupon surfaces is more due to the faster rate of diffusion. Mass gain is observed most in HDPE and least in PET perhaps due to the difference in polarity of the polymers studied.
The hardness Shore D values of received thermoplastics and coupons immersed in gasoline and methanol/gasoline blends were measured after stipulated time of immersion and compared. Figure 4 reveals that there is reduction in hardness of all materials when exposed to gasoline and methanol blended gasoline. It was found that increase in time of exposure in fuel blends further decreases the hardness for all studied materials. The decrease in hardness was found to be more in HDPE followed by PTFE and PET. Hardness of studied thermoplastics before and after immersion in fuel blends at different time intervals.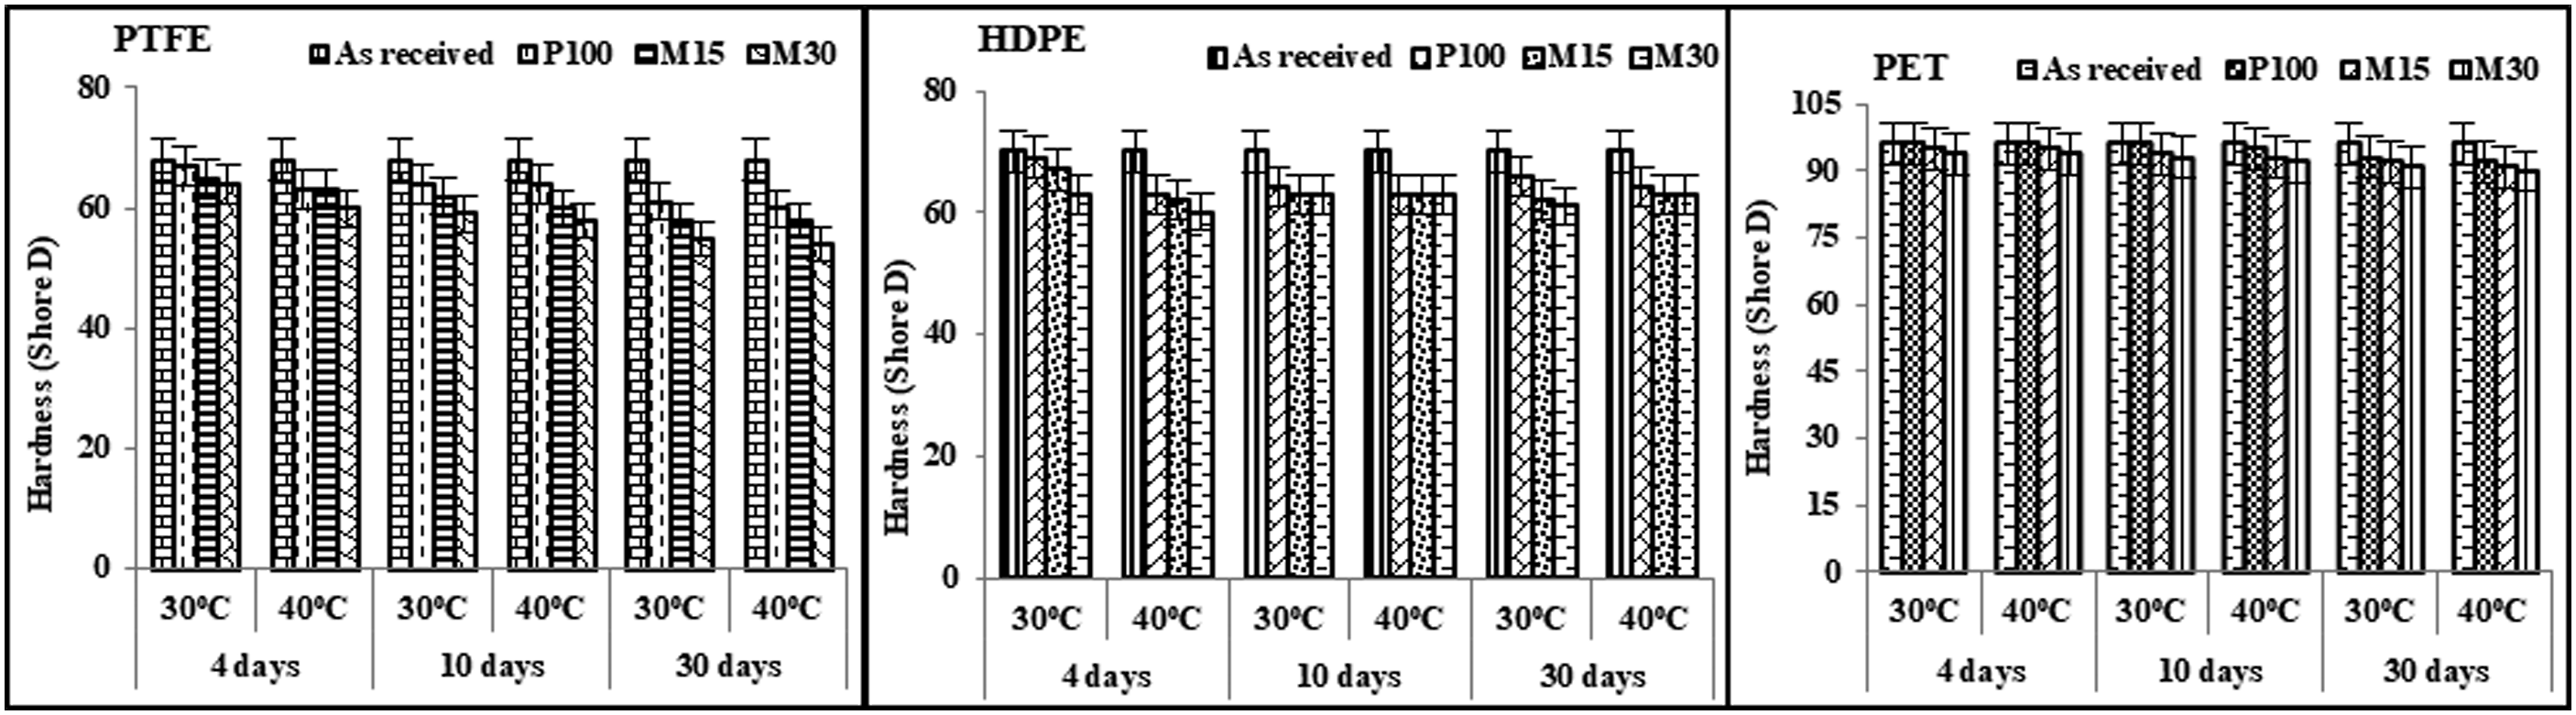
The percent change of tensile strength for thermoplastic coupons immersed in P100, M15, and M30 for different days of immersion is shown in Figure 5. % change in tensile strength of polymeric materials in methanol/gasoline blends at different time intervals.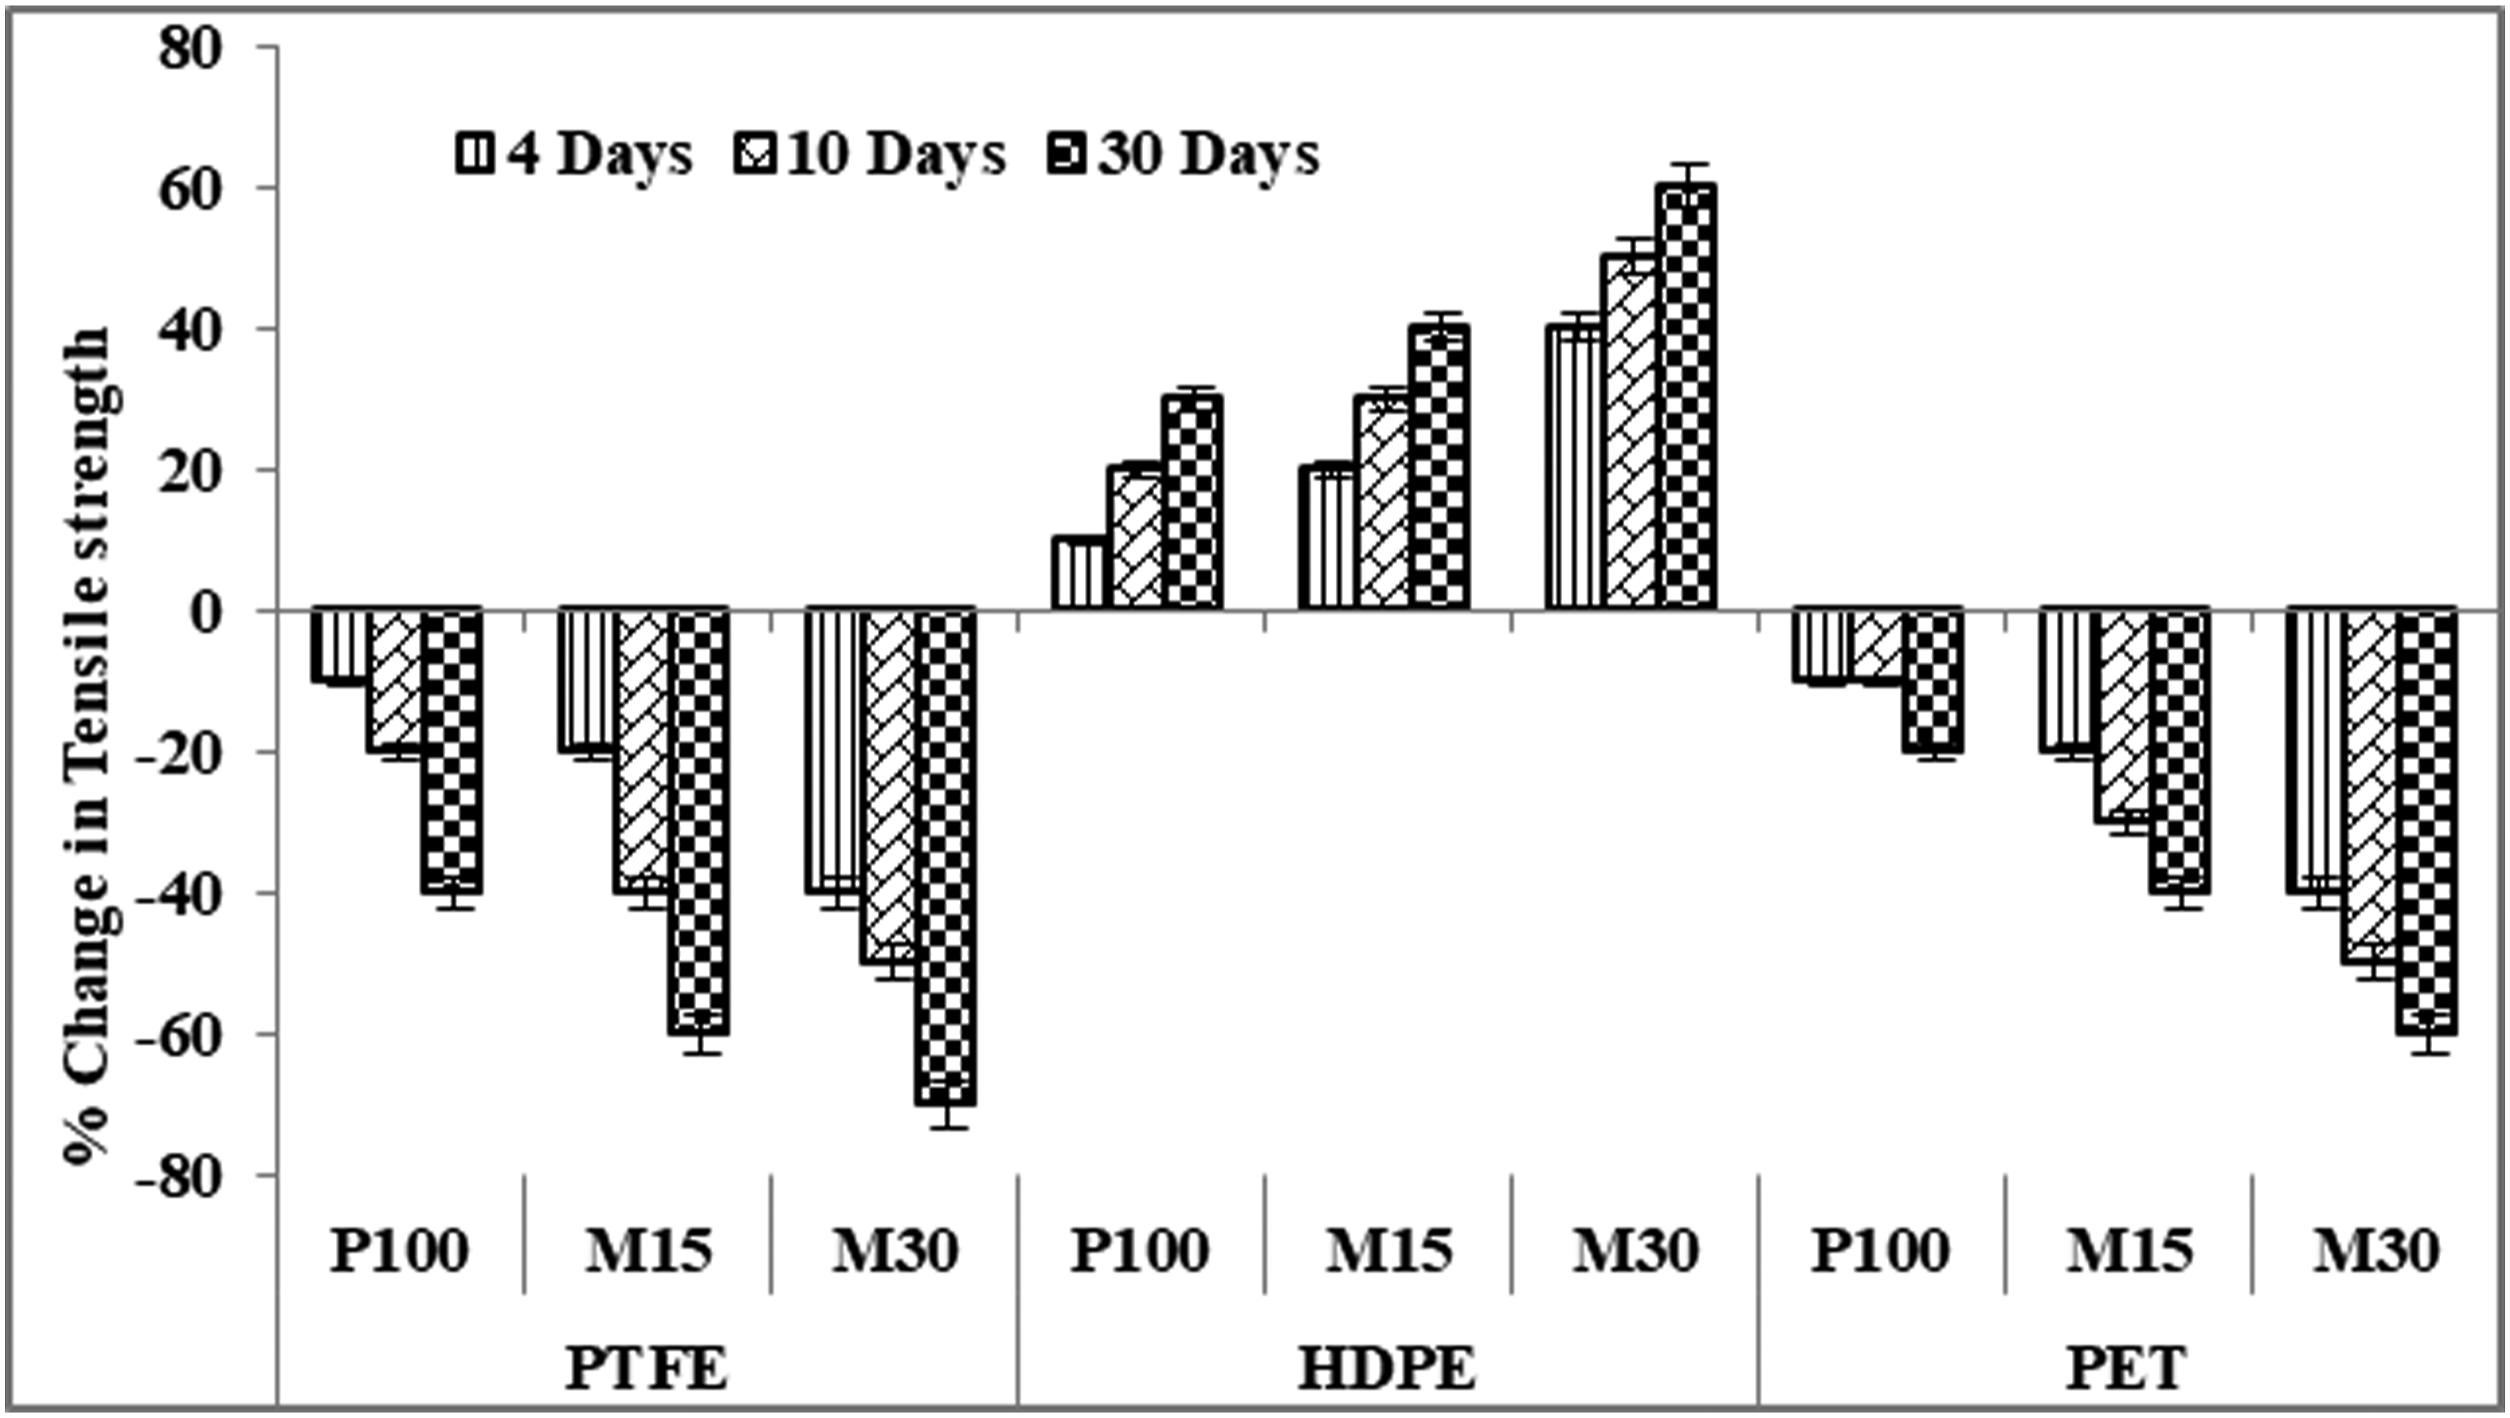
PTFE and PET showed reduction in strength, but an increase in tensile strength was observed for HDPE in fuel blends. Change in tensile strength was found the least in P100 and gradual increase when coupons immersed in M15 and M30 for all immersion periods. Also, the change in tensile strength increases when exposure time increases. PET showed reductions from 10% to 20% in P100, 20% to 40% in M15, and 40% to 60% in M30 for 4, 10, and 30 days of immersion. PTFE showed similar trend with minor increase in tensile strength for 10 and 30 days immersion time. An increase in tensile strength was observed for HDPE from 10% to 30% in P100, 20% to 40% in M15, and 40% to 60% in M30 for 4, 10, and 30 days of immersion.
Figure 6 shows the percentage change in elongation of thermoplastic coupons exposed to P100, M15, and M30 at various days of immersion. Studied materials showed reduction in elongation. Highest % change in elongation was found in HDPE followed by PTFE and PET. Reductions in elongation for PTFE, HDPE, and PET were ranging from 1 to 21% when exposed to fuel blends. M30 showed the highest elongation reduction for studied materials. Among the studied plastics, the least (1%) and the highest (21%) reductions in elongation were observed for HDPE immersed in P100 for 4 days and in M30 for 30 days, respectively. % elongation changes of polymeric materials in methanol/gasoline blends at different exposure time intervals.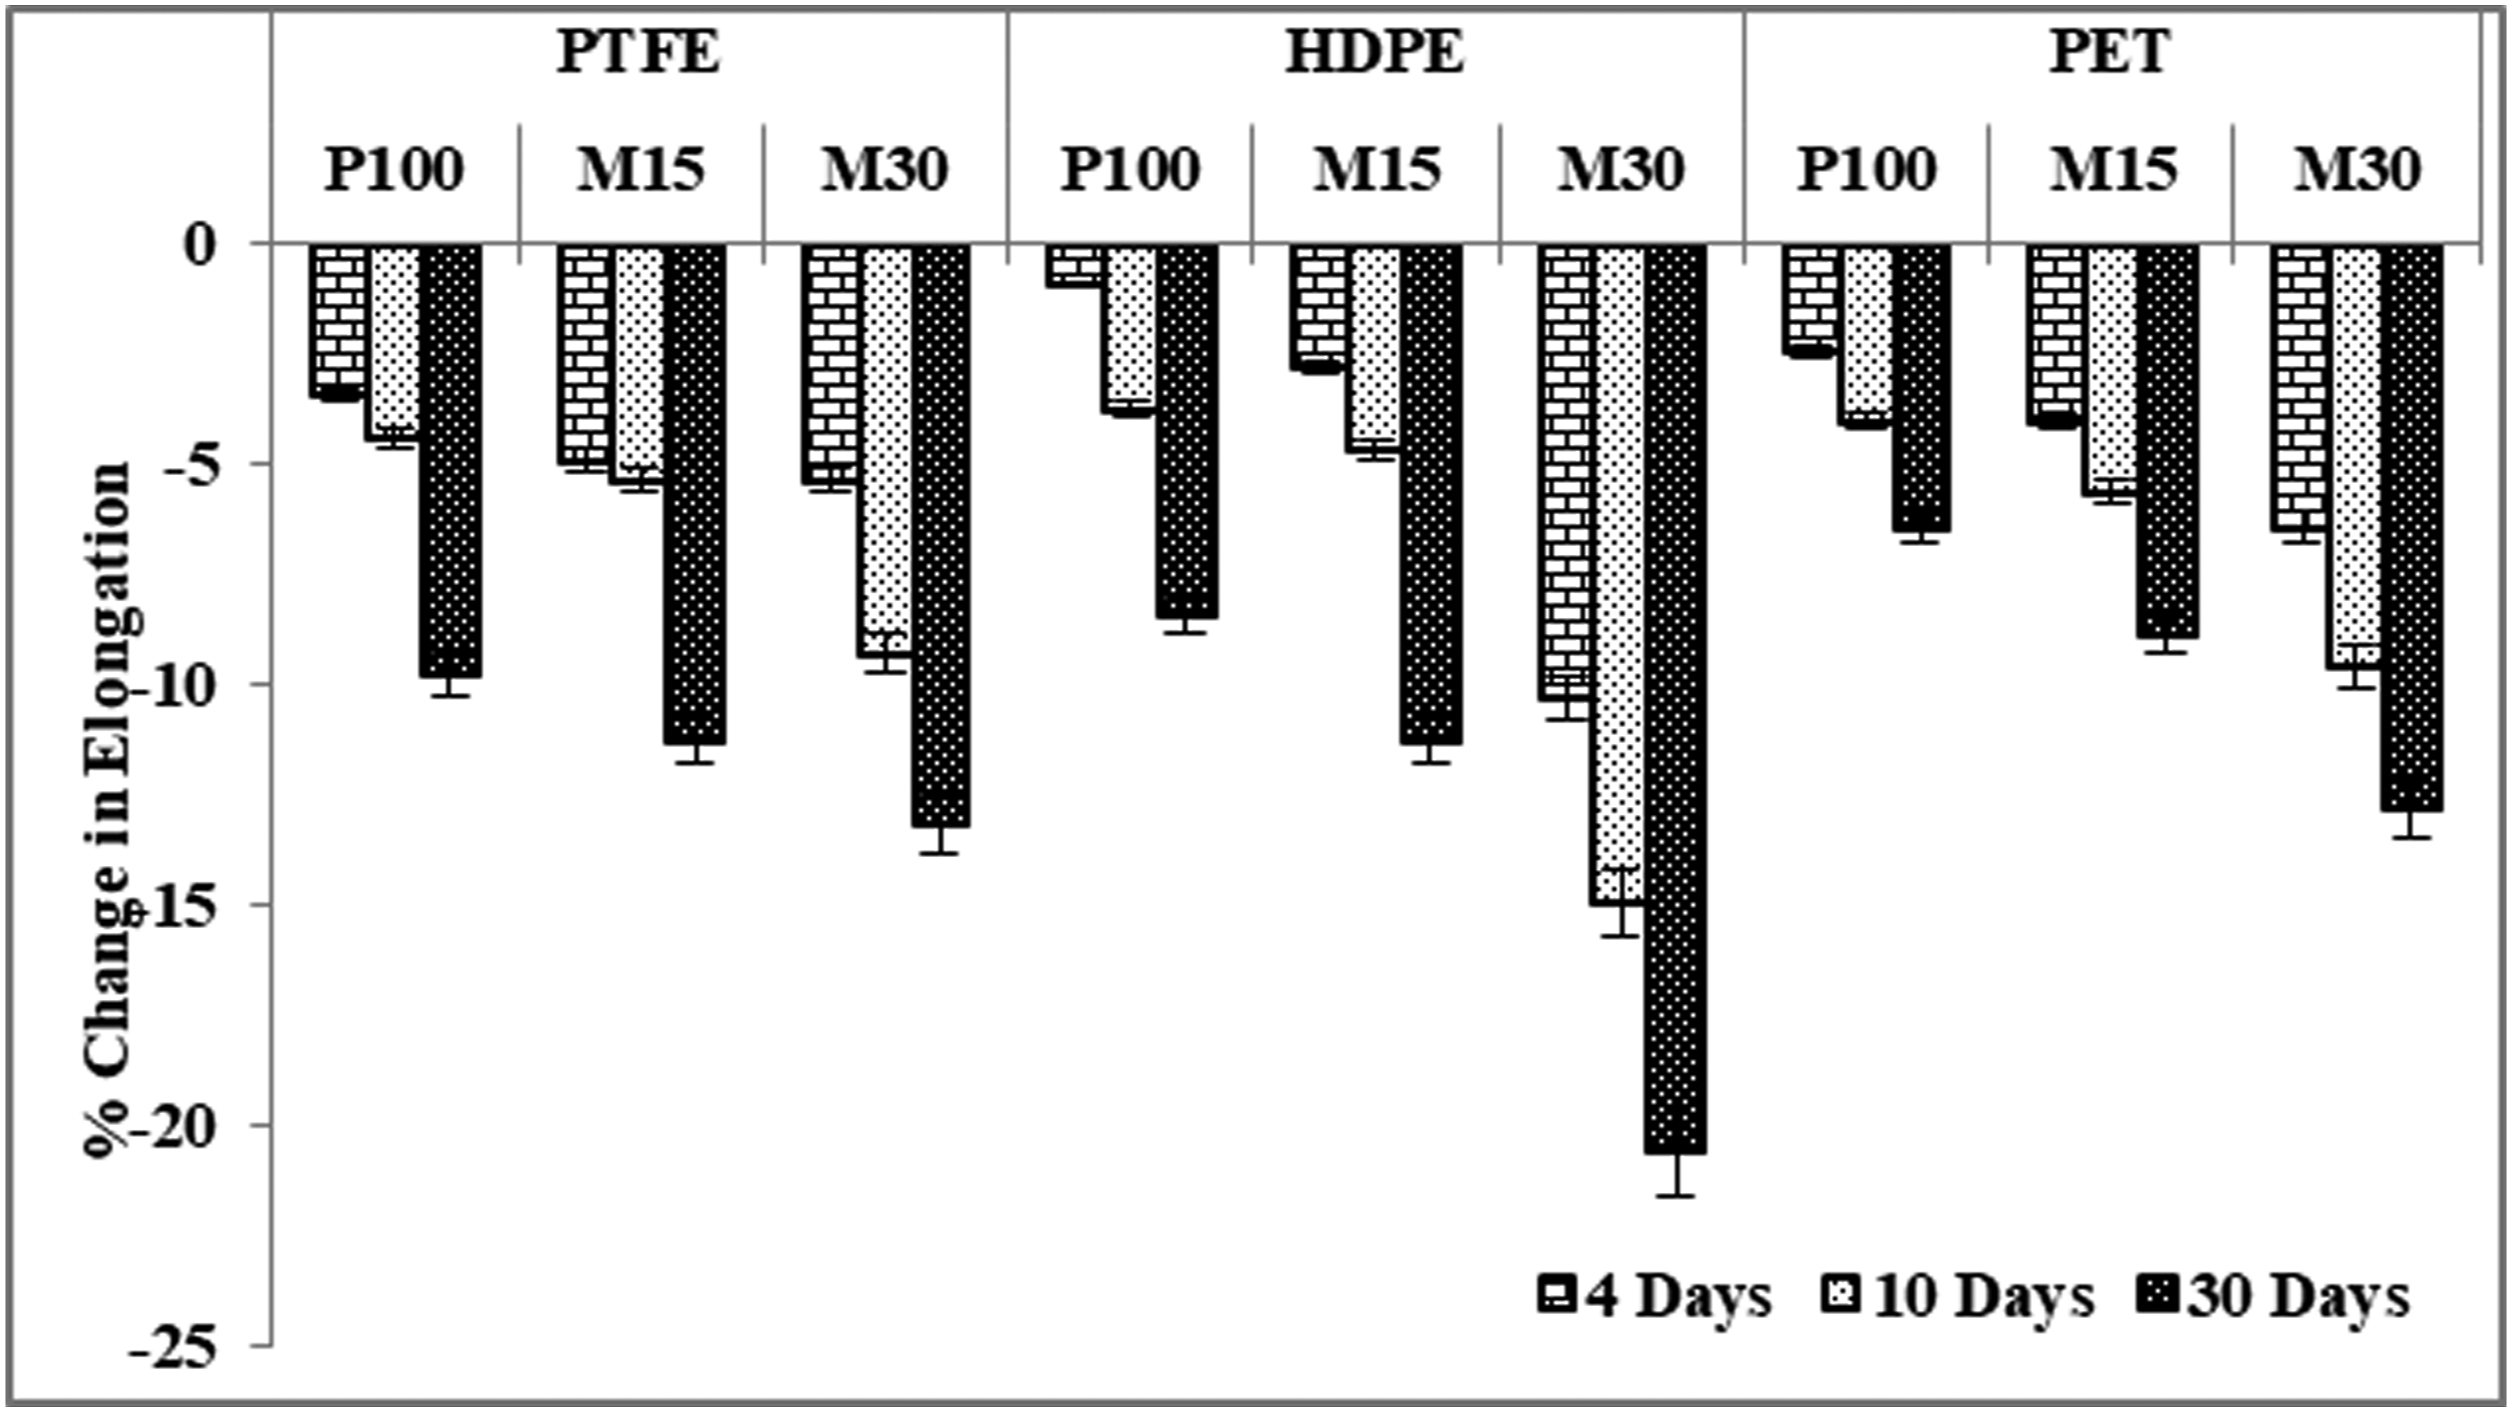
SEM micrographs of as received polymeric materials, namely, PTFE, HDPE, and PET surfaces and those of coupons exposed to P100, M15, and M30 for 30 days of immersion were compared and the same has been given in Figure 7. SEM micrographs of PTFE and PET coupons immersed in P100 and M15 did not show much degradation on the surface. No pits and cracks were found in PET and PTFE after immersion in P100 and M15. This confirmed that the microstructures of these plastics have not been affected by gasoline–methanol fuel blend. Uneven surfaces with occasional pitting and hackle lines on the coupons immersed in M30 can be results of loose reinforcing agglomerates in the matrix that create an easy path for the degradation by reducing the strength of the materials. SEM micrographs of thermoplastics (a) as received and coupons immersed in, (b) P100, (c) M15, and (d) M30.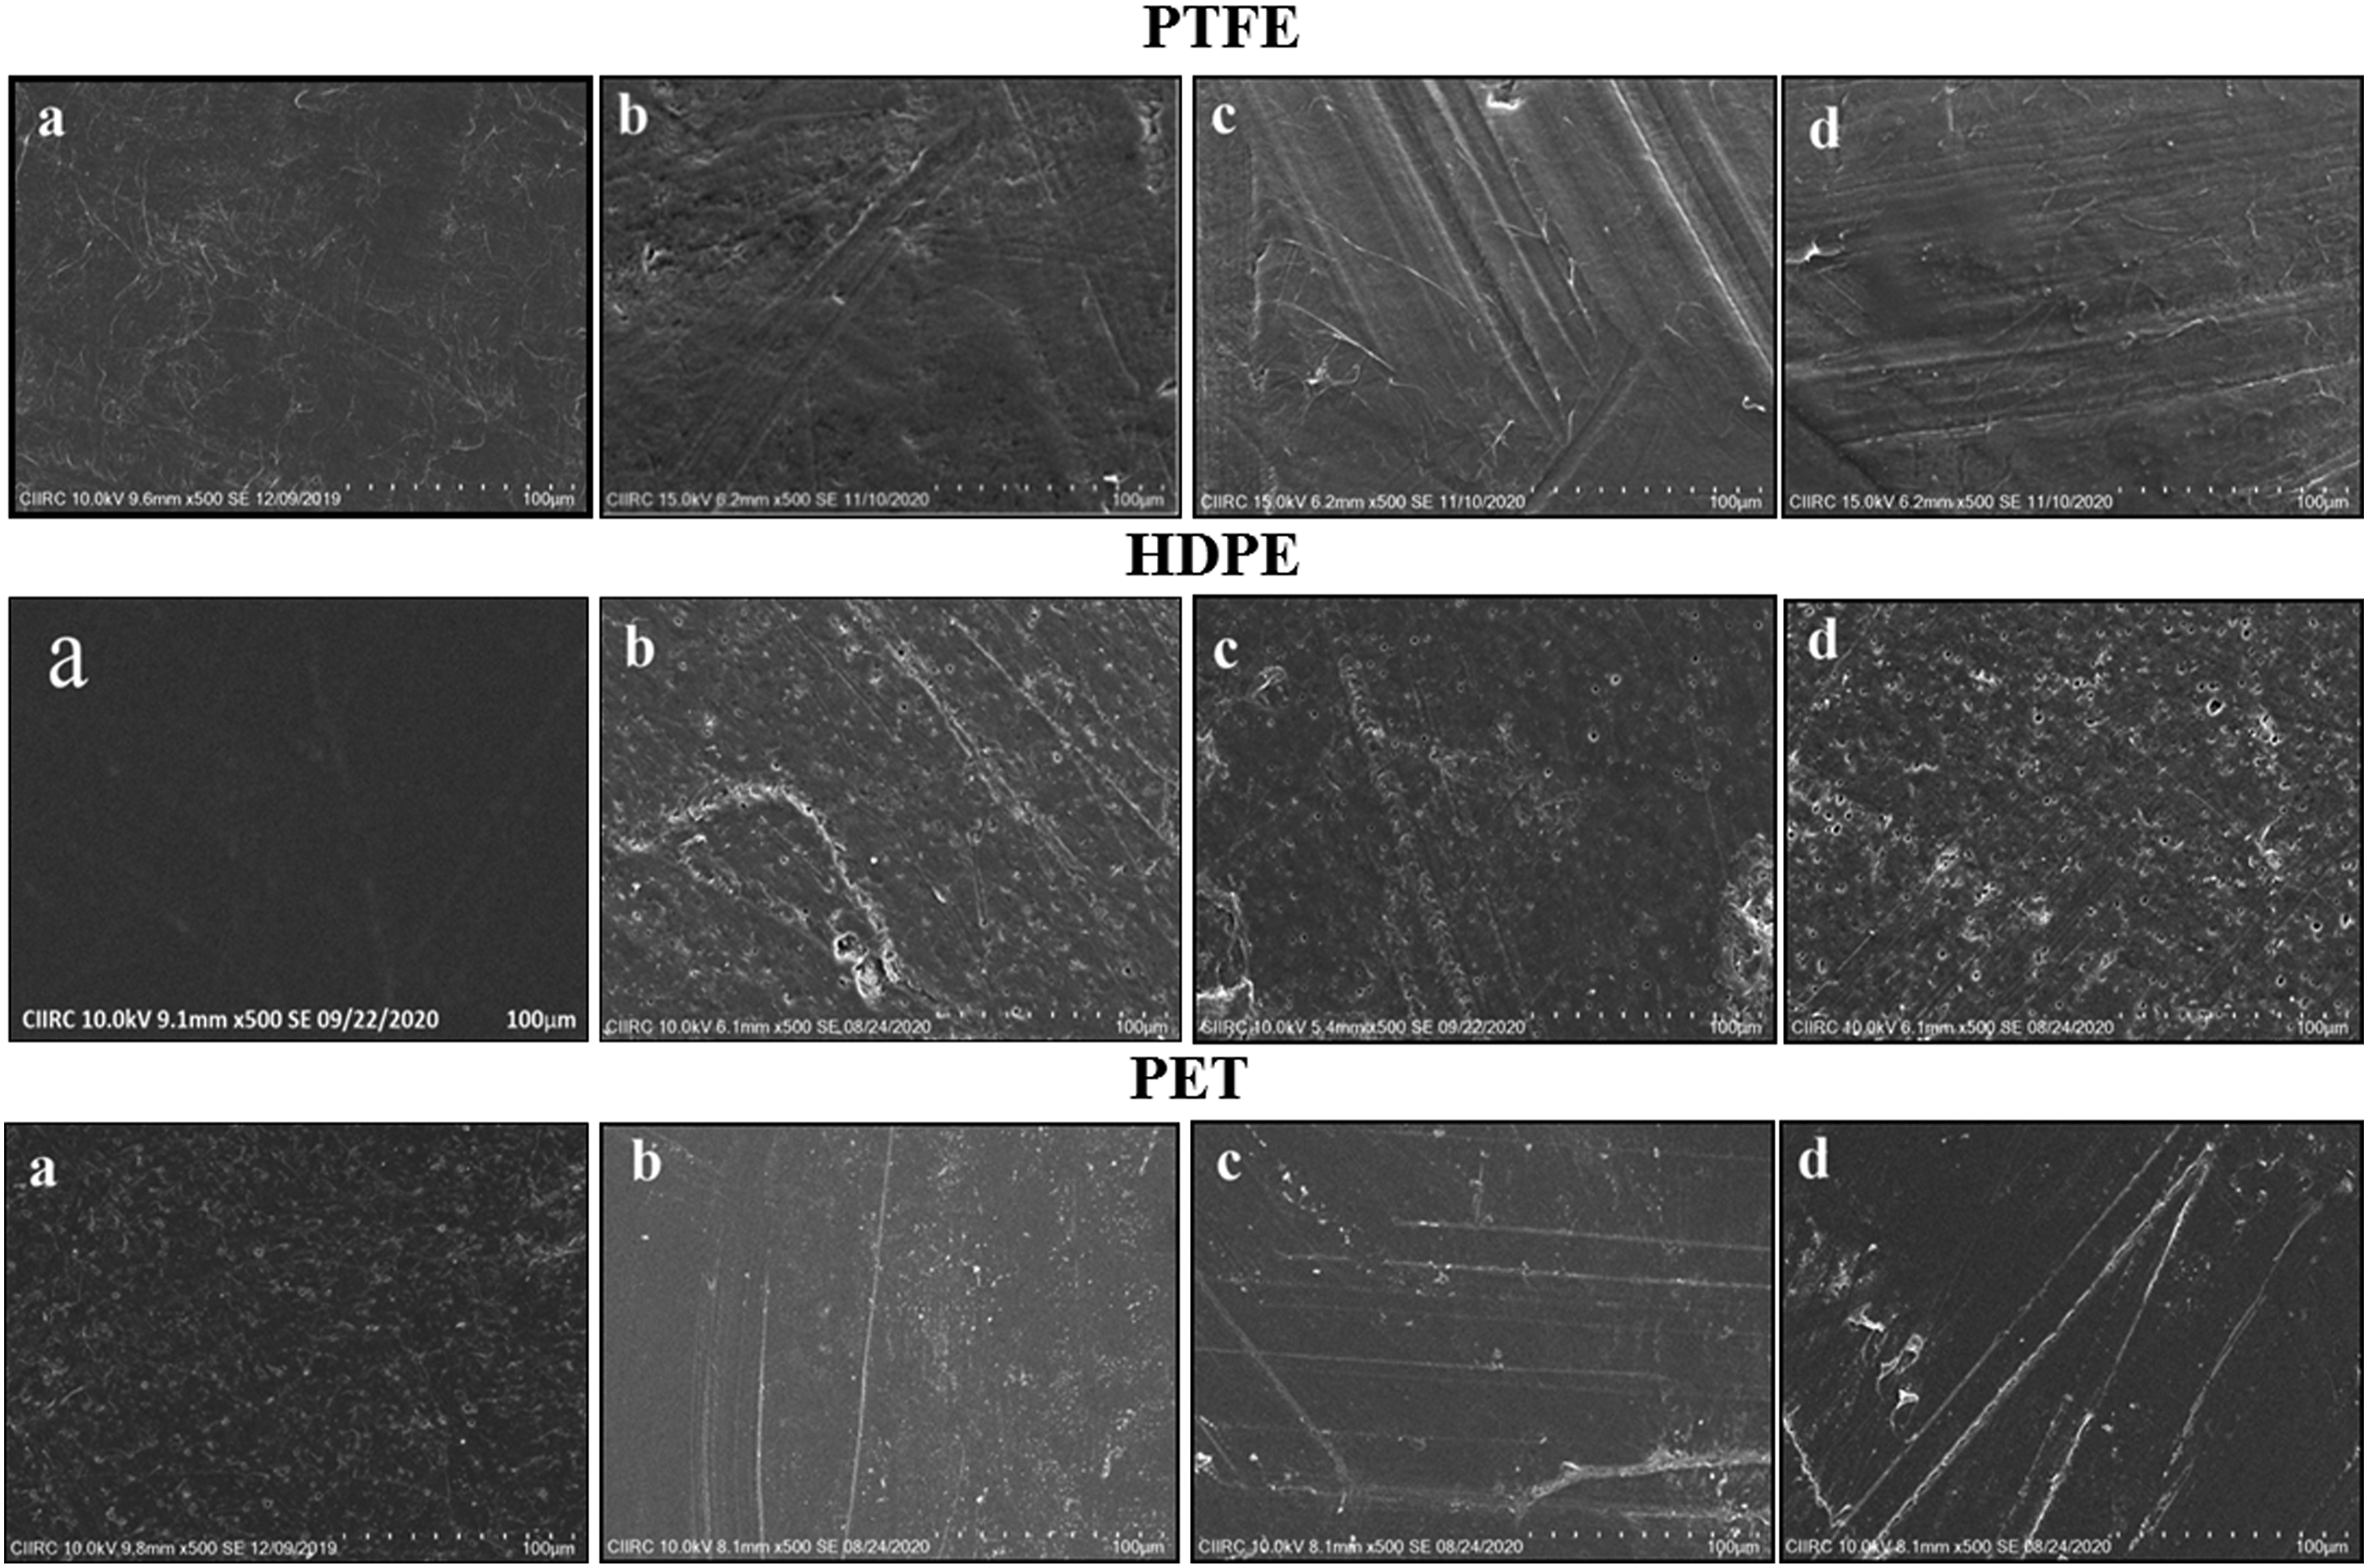
The SEM images of HDPE coupons immersed in P100, M15, and M30 blends showed rough surfaces with formations of small pits and cracks. This cracking is an indication that is a point of weakness in the matrix of the coupons. These surfaces showed cracks propagating from pits resulting in the material degradation when in contact with fuel. Degradation is more in M30 when compared to other fuel blends. Also, an increase in size of pits indicates that HDPE has degraded more in M30 due to the large concentration of methanol.
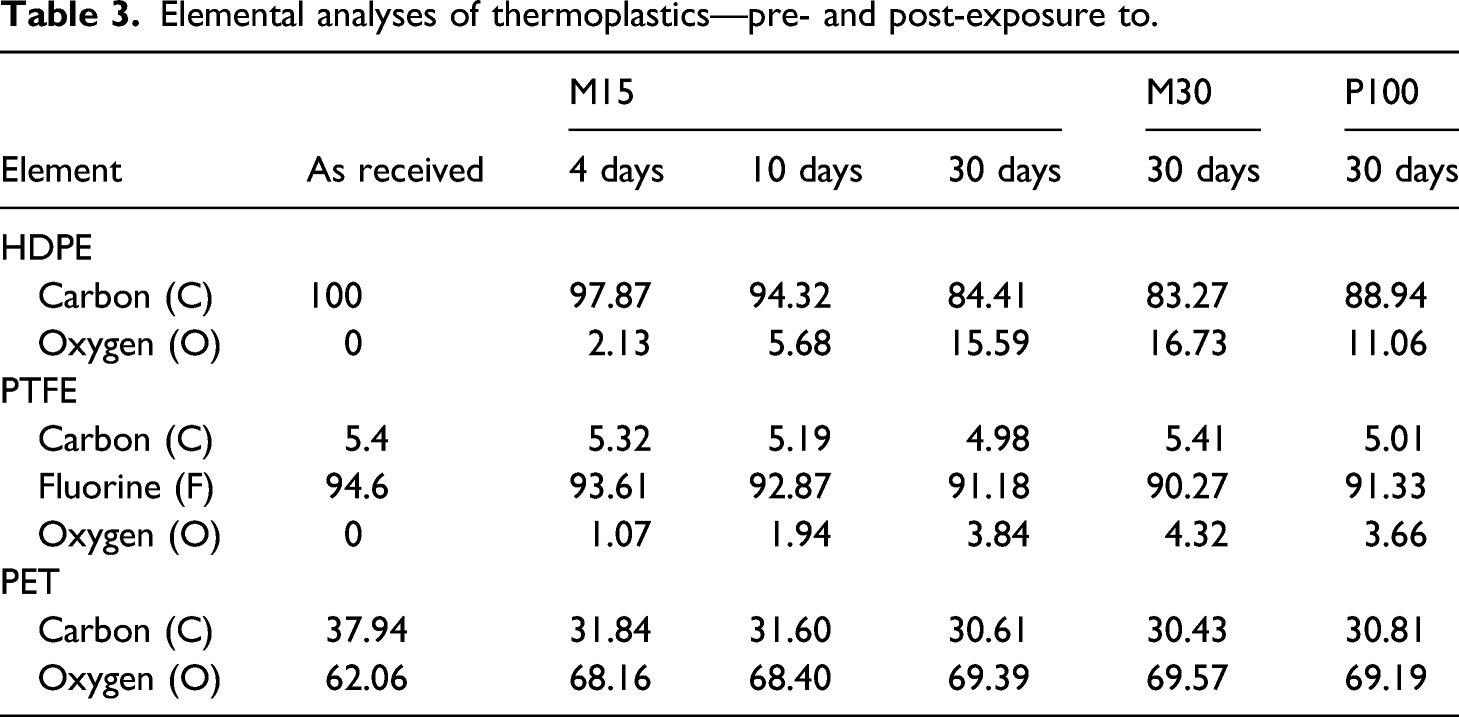
Elemental analyses of thermoplastics—pre- and post-exposure to.
Fuel Analysis
Conductivity measurements
The conductivities of fuel blends before and after immersion of coupons (PTFE, HDPE, and PET) have been depicted in Figure 8. Conductance of the fuel blends before and after immersion of thermoplastic coupons.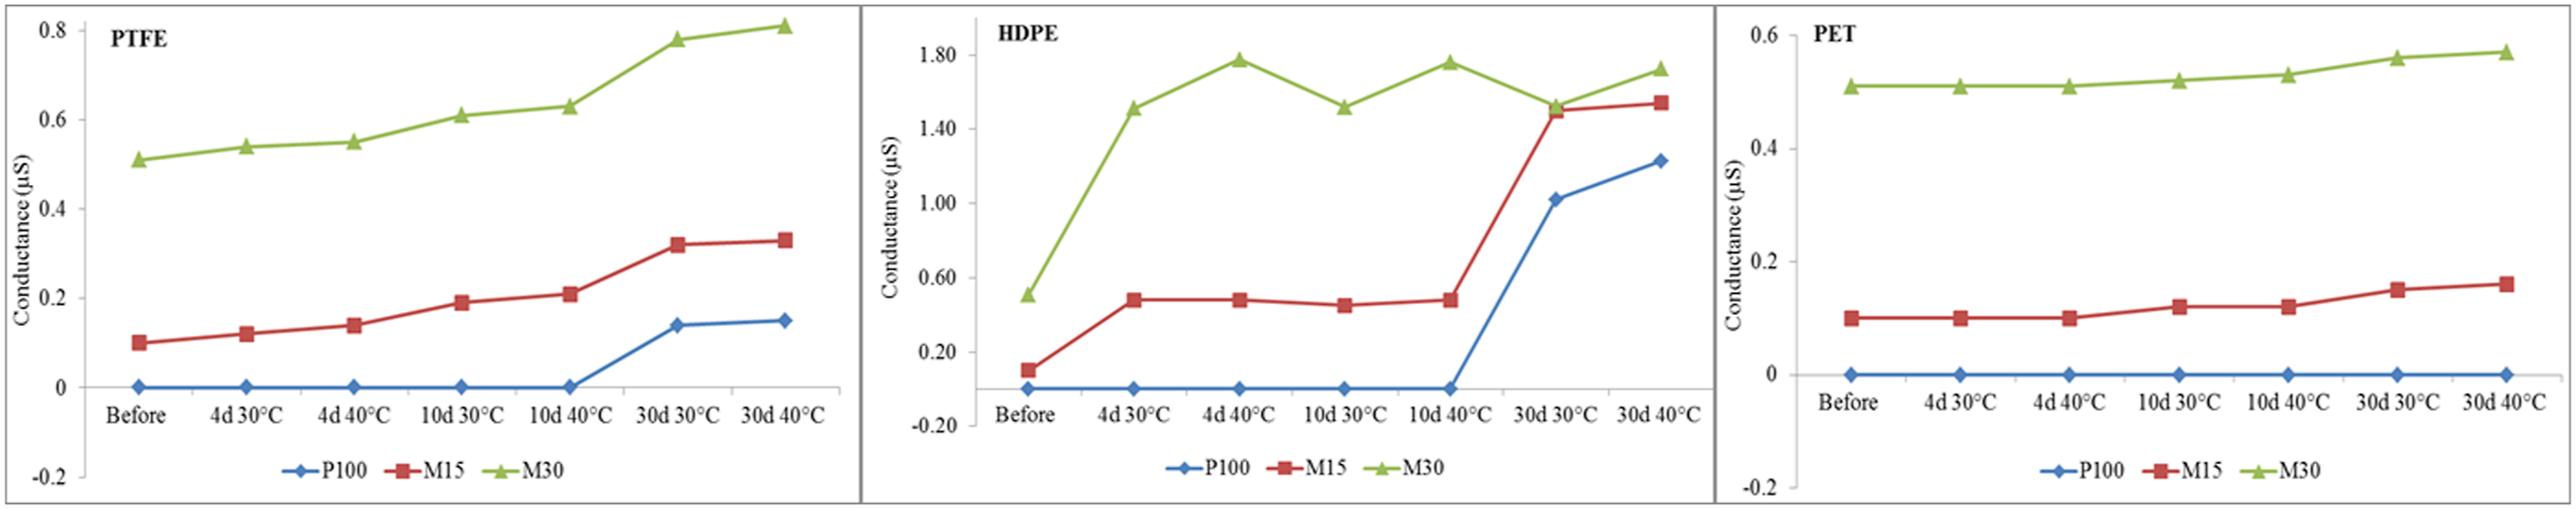
Higher conductivity after immersion of polymeric materials is a result of increase in ionic content due to material degradation. The highest conductivity (1.78µS) was measured in M30 after immersion of HDPE followed by PTFE (0.81µS) and PET (0.57 µS) in the same blend. Pure gasoline has low conductivity due to its nonionic nature. It was observed that the conductivity of the blends before immersion was less than after immersion of the specimens. The values of conductivity were found to increase with increasing percentage of methanol due to the ionic nature of alcohol. Methanol being hygroscopic in nature tends to absorb moisture from atmosphere; oxidation of methanol results in formation of formic acid which probably results in increase in conductivity of the fuel blend. 20 Proper correlation was observed between surface morphology of degraded polymeric materials and conductivity in all the studied conditions.
FTIR analysis
FTIR analyses of P100, M15, and M30 fuel blends were conducted before and after immersion of PTFE, HDPE, and PET coupons exposed to 30 days and those spectra were given in Figure 9. The functional groups observed in the spectrum for pure gasoline are terminal (vinyl) C-H stretch at 3021 cm−1, methyl C-H asymmetric or symmetric stretch at 2951 cm−1, methylene C-H asymmetric or symmetric stretch at 2931 cm−1, methylene (CH2)n rocking at 729 cm−1, aromatic ring stretch at 1454 cm−1, and meta-di-sub benzene at 882 cm−1. There are no absorption peaks in the OH stretching region between 3000 and 3600 cm−1 and in the CO stretching region from 1020 to 1120 cm−1. The spectra of M15 and M30 fuel blends before immersion of plastic coupons exhibit distinct bands in those regions. The peak absorbance of the OH stretching band is observed at 3321 cm−1. The dominant peaks at 1018 and 1118 cm−1 can be assigned to the symmetric and asymmetric CO stretches, respectively. In the CH bending and stretching regions (1200–1600 cm−1 and 2800–3000 cm−1), overlapping vibrational bands of P100, M15, and M30 can be found. Similar functional groups have been observed for gasoline, methanol and M15 and reported.
21
FTIR spectra of methanol/gasoline fuel blends before and after immersion of thermoplastic coupons.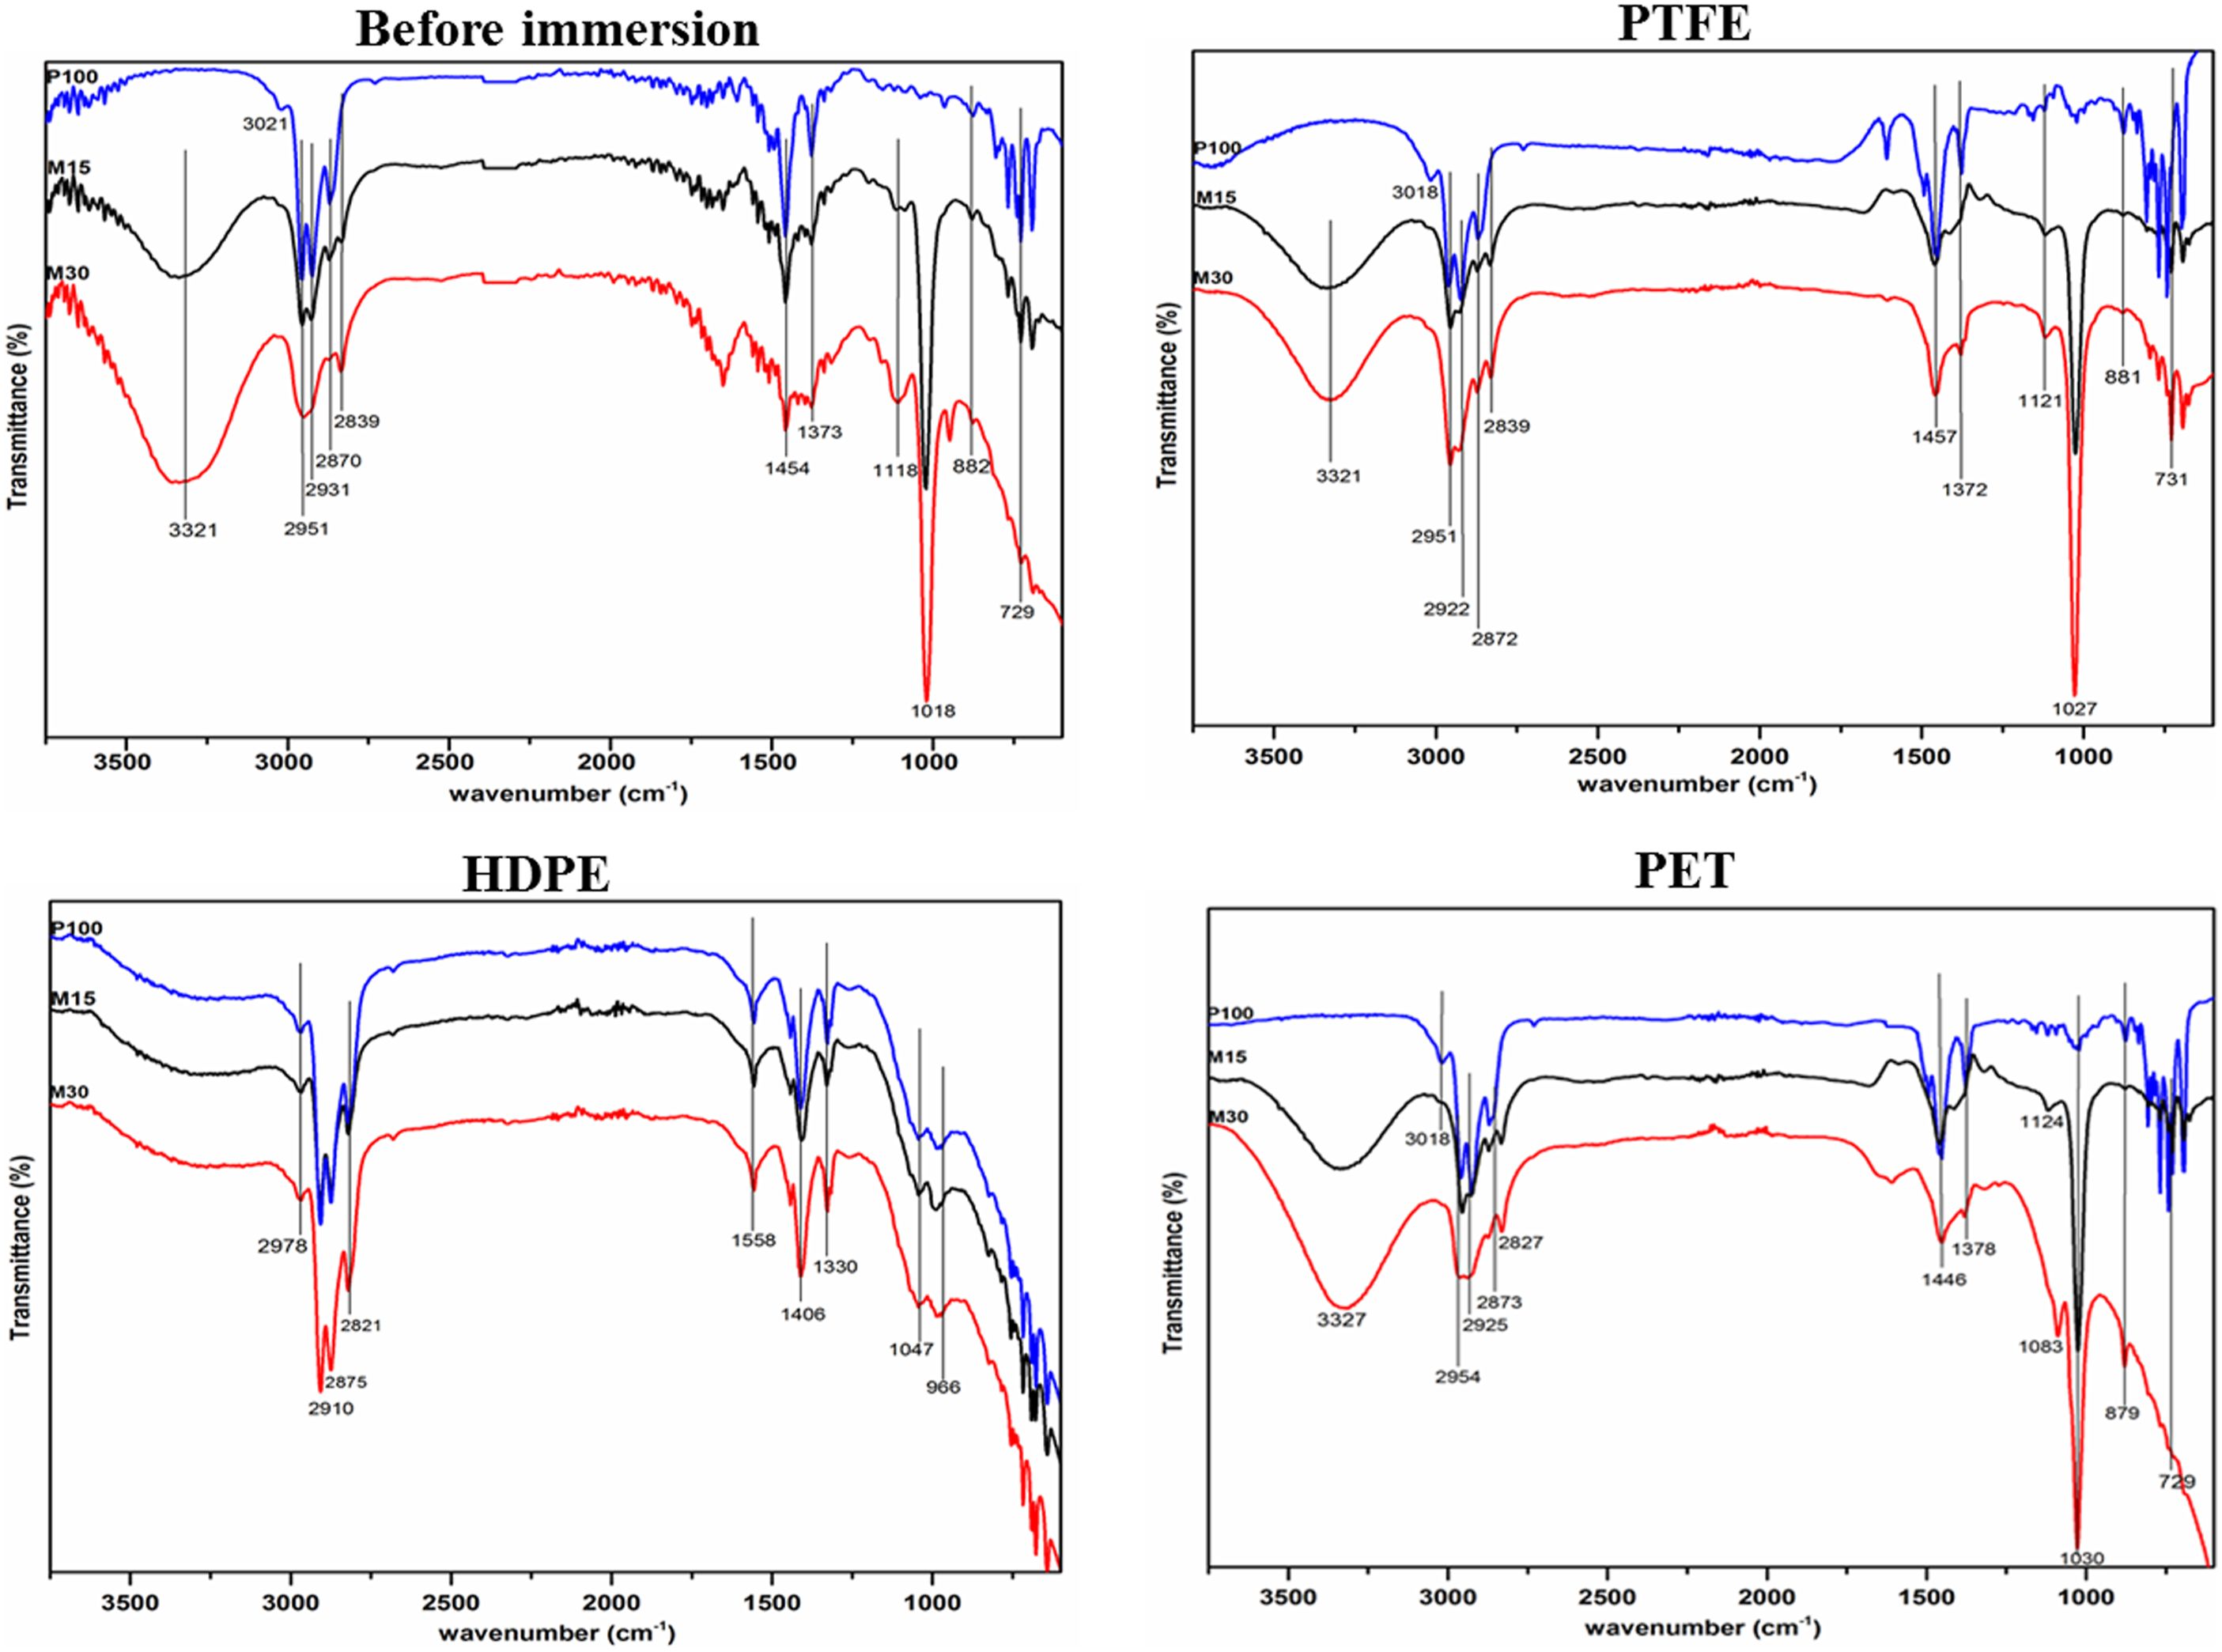
The spectra of P100, M15, and M30 after immersion of PTFE and PET coupons showed all dominant peaks as shown in before immersion fuel blends. There are no additions or deletions of peaks that appeared in pure fuel blends, but minor changes in the peak intensities and position were observed. Hence, it can be concluded that PTFE and PET coupons have not been attacked chemically by the fuels; hence, the fuel blends have not degraded much. After immersion of HDPE coupons, the obtained spectra for P100 showed the same dominant peaks same as pure P100. But spectra for M15 and M30, absence of peaks in the OH stretching at 3321 cm−1, and in the CO stretching at 1018 and 1118 cm−1 were noticed. The hydroxyl group (OH) in methanol has two reactive C–O and O–H covalent bonds. The electronegativity of oxygen is greater than that of carbon and hydrogen. The polar nature of the O–H bond makes methanol more acidic. Degradation in M15 and M30 after immersion of HDPE coupons took place due to chemical attack of methanol on HDPE surface.
Thermoplastics when immersed in methanol–gasoline fuel blends tend to degrade by gaining mass, loosing hardness and tensile strength, and by reduction in elongation. These changes could be attributed to relaxation of the polymer chains and absorption of the solvent which leads to increase in mass. The degradation of studied coupons is mainly due to the interaction between the coupon and the fuel since the fuel blends are not able to solubilize the materials and are retained in it. This phenomenon is observed in the presence of chemical affinity between the polymeric coupons and fuel blends. PTFE and PET have both polar as well nonpolar groups; the polar part of the fuel blends interacts with polar group of the polymer through dipole–dipole interaction and causes them to degrade. The fuel absorption can be majorly attributed to this than to the extraction of soluble components from the polymers. 22
Absorption of fuel and change in chemical structure caused by oxidative damage is the two main reasons for HDPE degradation. 23 A nonpolar HDPE is easily absorbed on nonpolar compound like gasoline. HDPE is a semicrystalline polymer having amorphous phase and crystalline phase. Crystalline phase is formed by long molecular chains folding and packing into lamellae and these are connected with one another through amorphous phase consisting of tie molecules and physical entanglements. 24 The size and distribution of crystalline regions are determinants of the tensile strength and the amorphous phase determines the elongation. 25 Fuel is absorbed more into the amorphous phase where the molecular chains are loosely arranged causing the degradation of polymer.
Conclusions
In this work, a study was undertaken to analyze the variation of the physical–chemical behavior of a PTFE, PET, and HDPE as a function of the time and percentage of methanol in gasoline. The conclusions drawn from the experiments are enlisted below • The studied materials were found to gain mass in the order HDPE > PTFE >PET. Gradual increase in mass from 4 to 30 days of immersion was observed for thermoplastic coupons. The mass gain % increased with increase in methanol concentration but temperature and time were found to have a greater influence on the mass changes. The nonpolar nature of HDPE causes it to absorb maximum gasoline. • The decrease in hardness was found to be more in HDPE followed by PTFE and PET. It was found that increase in time of exposure in fuel blends further decreases the hardness for all studied materials. • PTFE and PET showed reduction in tensile strength but an increase was observed for HDPE in fuel blends. • Highest % change in elongation was found in HDPE followed by PTFE and PET. The least (1%) and the highest (21%) reductions in elongation were observed for HDPE immersed in P100 for 4 days and in M30 for 30 days, respectively. • The SEM images of PTFE and PET showed least damage, whereas that of HDPE showed rough surfaces with formation of small pits and cracks.
The information generated in this study on compatibility of polymers with various methanol–gasoline blends will help all the stake holders to arrive at informed decisions thereby furthering the cause of usage of alternate fuels.
Footnotes
Acknowledgments
The authors would like to thank the Centre for Incubation, Innovation, Research, and Consultancy, Jyothy Institute of Technology for all the support extended. The financial support from the Department of Science and Technology (DST), Government of India through project TMD/CERI/MDME/2016/019 is gratefully acknowledged.
Conflict of Interests
The authors declare that there is no conflict of interests regarding the publication of this paper.
Funding
The author(s) disclosed receipt of the following financial support for the research, authorship, and/or publication of this article: This work was supported by Department of Science and Technology, Government of India (TMD/CERI/MDME/2016/019).