
Abstract
Conductive polymer composites, which are extensively applied in the fields of sensors, batteries, memory materials, etc. possess some significant properties mainly high electrical conductivity and good mechanical performance. In this study, copper (Cu) was grafted onto the graphite surface according to a chemical process. The Cu-grafted graphite (Cu-g-graphite) was characterized via fourier transform infrared spectroscopy (FTIR), X-ray diffraction spectroscopy (XRD), thermogravimetric analysis (TGA), and scanning electron microscopy (SEM), where the analysis proved that Cu was successfully grafted onto the graphite surface. Subsequently, natural rubber (NR) composites were prepared by varying the Cu-g-graphite loading from 0 phr (parts per hundred rubber) to 10 phr at 2 phr intervals. The 8 phr Cu-g-graphite filled NR composite showed better physico-mechanical properties in comparison with the other Cu-g-graphite composites and the NR composite prepared without Cu-g-graphite (control). Also, the former composite showed better thermal ageing and electrical conductivity which are requirements for sensor applications. Further, electrical conductivity of the Cu-g-graphite/NR composites prepared with greater than 4 phr loading of Cu-g-graphite was at a high level. Furthermore, the Cu-g-graphite filled NR composites indicated a remarkable improvement in electrical conductivity compared to that of the control. Finally, the performance of NR composite prepared with 8 phr loading of Cu-g-graphite in overall showed a considerable level of applicability for high electrical, thermal and physico-mechanical polymeric applications.
Keywords
Introduction
Polymers based on conductive materials are a major topic today and in recent times many researchers have shown considerable interest in electrically conductive rubber.1–3 Generally, rubber-based polymeric materials are limited to electronic applications due to their inherent low thermal conductivity, low thermal stability, high electrical resistance, etc.1,4 However, rubber-based materials show a good demand for mechanical applications due to their high visco-elastic properties and, as well as their durability and ease of processing.1,5 Therefore, most of the research is focused to develop electrically conductive and high mechanical rubber related materials as a solution for the above problems. Literature suggested that insulating rubber can be converted to a conductive material by incorporating a conductive filler.6,7 There are different types of conductive fillers which are electrically conductive and they have been used for such composite processing. Some of them are carbon black (CB), graphite, carbon fiber, carbon nanotube (CNT), pure metal, metal-coated inorganic particles, metal powders etc.7,8
Among these different types of conductive fillers, the most commonly used material for rubber is carbon black due to its conductive properties and good reinforcement to the rubber matrix.9–11 Further, performance of CB filled polymer composites is affected by particle size, surface area and surface chemistry of CB. 12 Furthermore, due to the polymer-filler and filler-filler interactions, CB acts as a physical cross-linking agent and, especially at high filler concentrations, allowing the van der Waals forces to form a continuous filler network. 12 In addition, carbon-based fillers which are based on graphite derivatives are widely used in several polymer-based industrial applications such as solar cells, fuel cells, sensors, electromagnetic interference (EMI) shields and many more.1,5,13 Moreover, on the basis of functional groups, number of layers and crystallographic structures; graphite derivatives can be categorized into different types namely graphite oxide (GO), reduced graphene oxide (rGO), expanded graphite (EG), graphene quantum dots (GQDs), etc.12,14 Additionally, graphite derivatives illustrate good functionality on their surface, hence, it would be an acceptable reason for the increase in the dispersibility on polymer matrix. However, properties of polymeric materials are not enhanced by incorporating higher loading of graphite derivatives due to their high wettability and poor dispersibility. 15 Furthermore, low loading of graphite derivatives is not sufficient for better performance with polymer materials. Hence, researchers have given notable attention in regard to the development of metal coated graphite materials as a solution to the above problems. 16
Additionally, to achieve higher conductivity at lower loading, metal-coated materials such as copper-coated, silver-coated, nickel-coated fillers may be a better choice than a conductive graphite.7,17 Fe3O4/C was synthesized by the arc-discharge method with 1:3 wt ratio of iron oxide calcined at 250°C: graphite 18 and Fe3O4/C indicated better performance compared to the graphite material. Further, polypropylene (PP) composites prepared with nickel-coated graphite illustrated superior properties in terms of tensile strength and electrical conductivity than the graphite. 19 Furthermore, silica coated graphite incorporated polymer composites were found to have a superior effect on thermal and electrical properties including conductivity, dissipation, stability, and resistivity. 20 Composites prepared with silver grafted expanded graphite (EG) showed better improvement of thermal and electrical conductivity properties 21 and further, the conductivity properties enhanced with an increase in the silver grafted expanded graphite content. Alternatively, high thermal conductivity and high electrical insulation properties were achieved by incorporating EG and aluminium (Al) nanoflakes in aluminium-plastic package waste due to the synergistic effect of the hybrid filler framework. 22
However, details in regard to incorporation of metal-coated graphite or graphite derivatives to NR composites are limited since NR has been used as an insulation material. Further, NR has been extensively studied due to its wide usage in tyre production. 23 In this study, copper (Cu) grafted graphite was synthesised as a filler material to incorporate into the NR matrix. Cu is one of the most important components in next-generation flexible and wearable electronics due to their superior electrical conductivity and remarkable mechanical flexibility. 24 The electrical behavior of silicon has been investigated for CNT bundles mixed with Cu. 25 The results suggested that through silicon filled with a Cu/CNT composite exhibit more homogeneous distribution of current with reduced skin effect compared to the ones filled only with copper. 25 Therefore, in this study, Cu coated graphite is used to enhance the performances in terms of conductivity and physico-mechanical properties and proper dispersion on NR matrix.
Experimental
Materials
Natural Rubber (RSS-2) with a plasticity retention index of 64 was supplied by the Rubber Research Institute of Sri Lanka. Graphite with mean particle size of 40 micron was used as the conductive filler and was received from Bogala Graphite Lanka PLC, Sri Lanka. Zn granulates with an average molecular weight of 65.38 gmol−1 and tartaric acid was purchased from the local market. N, N-dimethylformamide (DMF) and all rubber compounding ingredients were obtained from local suppliers.
Synthesis of Cu-g-graphite
Graphite particles were heated in air at 400оC for 2 h to activate their surfaces. Then a slurry was prepared by adding 5 g of activated graphite particles, 1.5 mL of N, N-dimethylformamide (DMF), 35 g of CuSO4.5H2O, 10 g of Zn granulates and 5 mL of distilled water. Then the slurry was stirred at 50 r/min for about 1 h at room temperature (27°C) for proper mixing. The coated particles were soaked in a mixture of 75% of water, 10% H2SO4, 10% H3PO4 and 5% Tartaric acid for 20 min. Then the particles were sucked using a Buchner funnel and washed by using ethanol. 26 Finally, Cu coated graphite particles were dried by using a vacuum oven at 60°C for 20 min 26
Preparation of Cu-g-graphite/NR composites
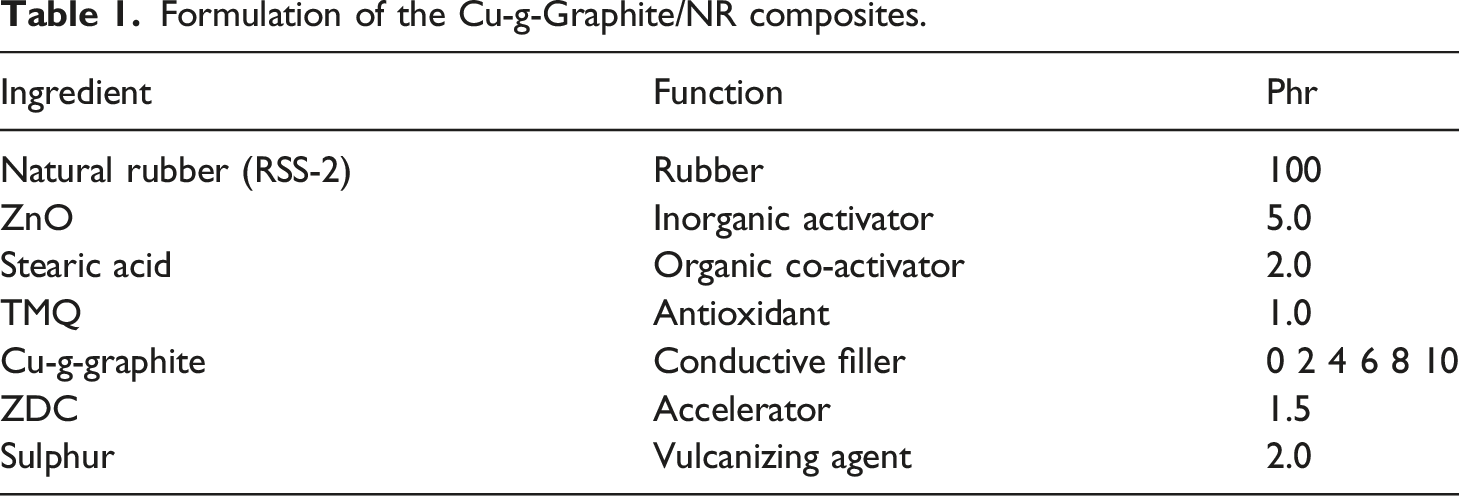
Formulation of the Cu-g-Graphite/NR composites.
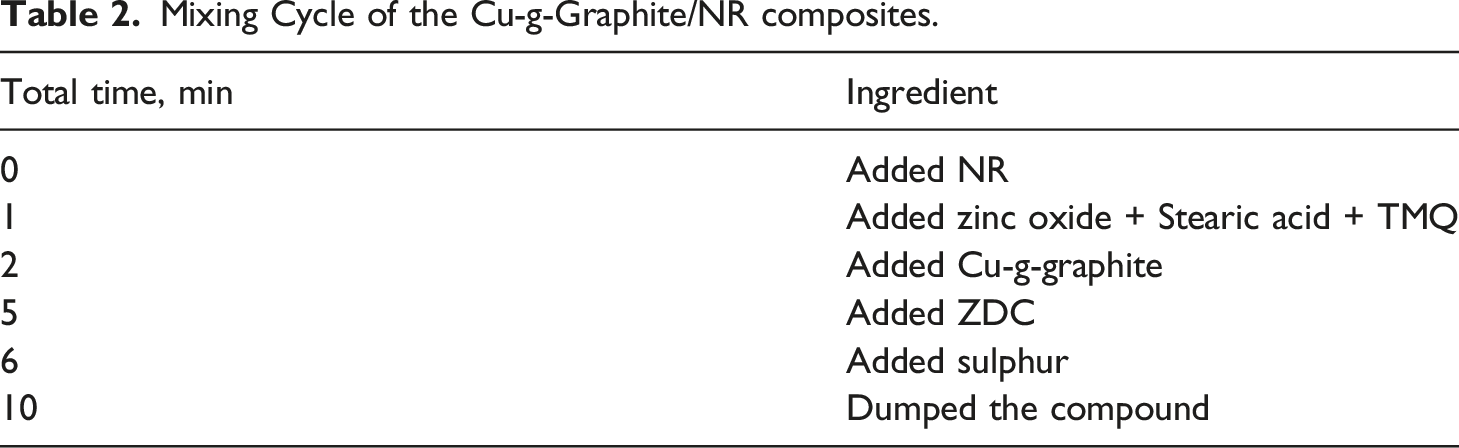
Mixing Cycle of the Cu-g-Graphite/NR composites.
Characterization
X-ray diffraction (XRD) analysis was conducted using X-ray diffractometer (Ultima, Japan) to confirm the crystallographic nature of graphite and Cu-g-graphite materials. The Cu-g-graphite and graphite materials were scanned in continuous mode by varying the scanning angle from 0.50 to 90.0° at a scanning speed of 3° per minute in 2θ (degrees). Further, chemical structures of graphite and Cu-g-graphite were characterized using the Nicolet 380 FTIR spectrometer. Spectra were recorded in the range of 400 –3500 cm−1 operated at 4 cm−1 resolution. Surface morphology of graphite, Cu-g-graphite and tensile fracture surfaces of Cu-g-Graphite/NR composites were examined by Scanning Electron microscopy (SEM) using a ZEISS EVO LS 15 Microscope. The specimens were sputter coated with a thin layer of gold to avoid electrostatic charging during examination. Further, thermal stability of the two materials were investigated through thermogravimetric analysis (TGA) (TGA 400, Perkin Elmer) at a heating rate of 10°C per minute from room temperature to 600°C in a nitrogen atmosphere.
Physico-mechanical properties
Tensile properties and tear strength of Cu-g-graphite/NR composites were determined using Instron tensile testing machine according to BS ISO 37:2017 and BS ISO 34-1:2015, respectively. Dumbbell shaped tensile test specimens and angle shaped tear test specimens were used. Cross-head speed was maintained at 500 mm/min. Hardness of the composites was determined using Digi Test hardness tester according to BS ISO 48-4:2018. Resilience of the vulcanisates was measured by a Wallace Lupke pendulum in accordance with ISO 4662:2017. Disc shaped hardness and resilience test specimens (12.5 mm thickness and 36 mm diameter) were used and three test specimens were tested for each composition.
Ageing properties
Accelerated ageing of the composites was carried out at 70°C for 72 h in an air circulating oven according to ISO 188:2017. Tensile properties were evaluated after ageing and percentage retention of these properties were calculated according to equation (1).
Electrical conductivity
Sheet resistance of Cu-g-graphite/NR composites was assessed using a four-probe electrical conductivity meter (Jandel RM 3000). The specimens were cut into 1 mm thick square-shaped pieces of 10 mm x 10 mm.
Results and discussion
Characterization of graphite and Cu-g-graphite
TGA was used to analyze the thermal stability of Cu-g-graphite by observing the weight change which occurs when the sample is heated at a constant rate. The TGA curves of Cu-g-graphite and graphite are shown in Figure 1. Graphite does not show any significant weight loss up to 500°C. This plot shows that the weight loss of Cu-g-graphite particles takes place in two systematic steps. The primary weight loss of the Cu-g-graphite sample has occurred in the temperature range of 80–100°C. This weight loss up to 100°C may be due to the elimination of water adsorbed on the surface.
27
The secondary weight loss of the Cu-g-graphite sample has occurred in the temperature range between 100°C and 235°C. There is a slight weight loss up to 100°C and it may be due to the decomposition of Cu.
28
TGA curves of graphite and Cu-g-graphite.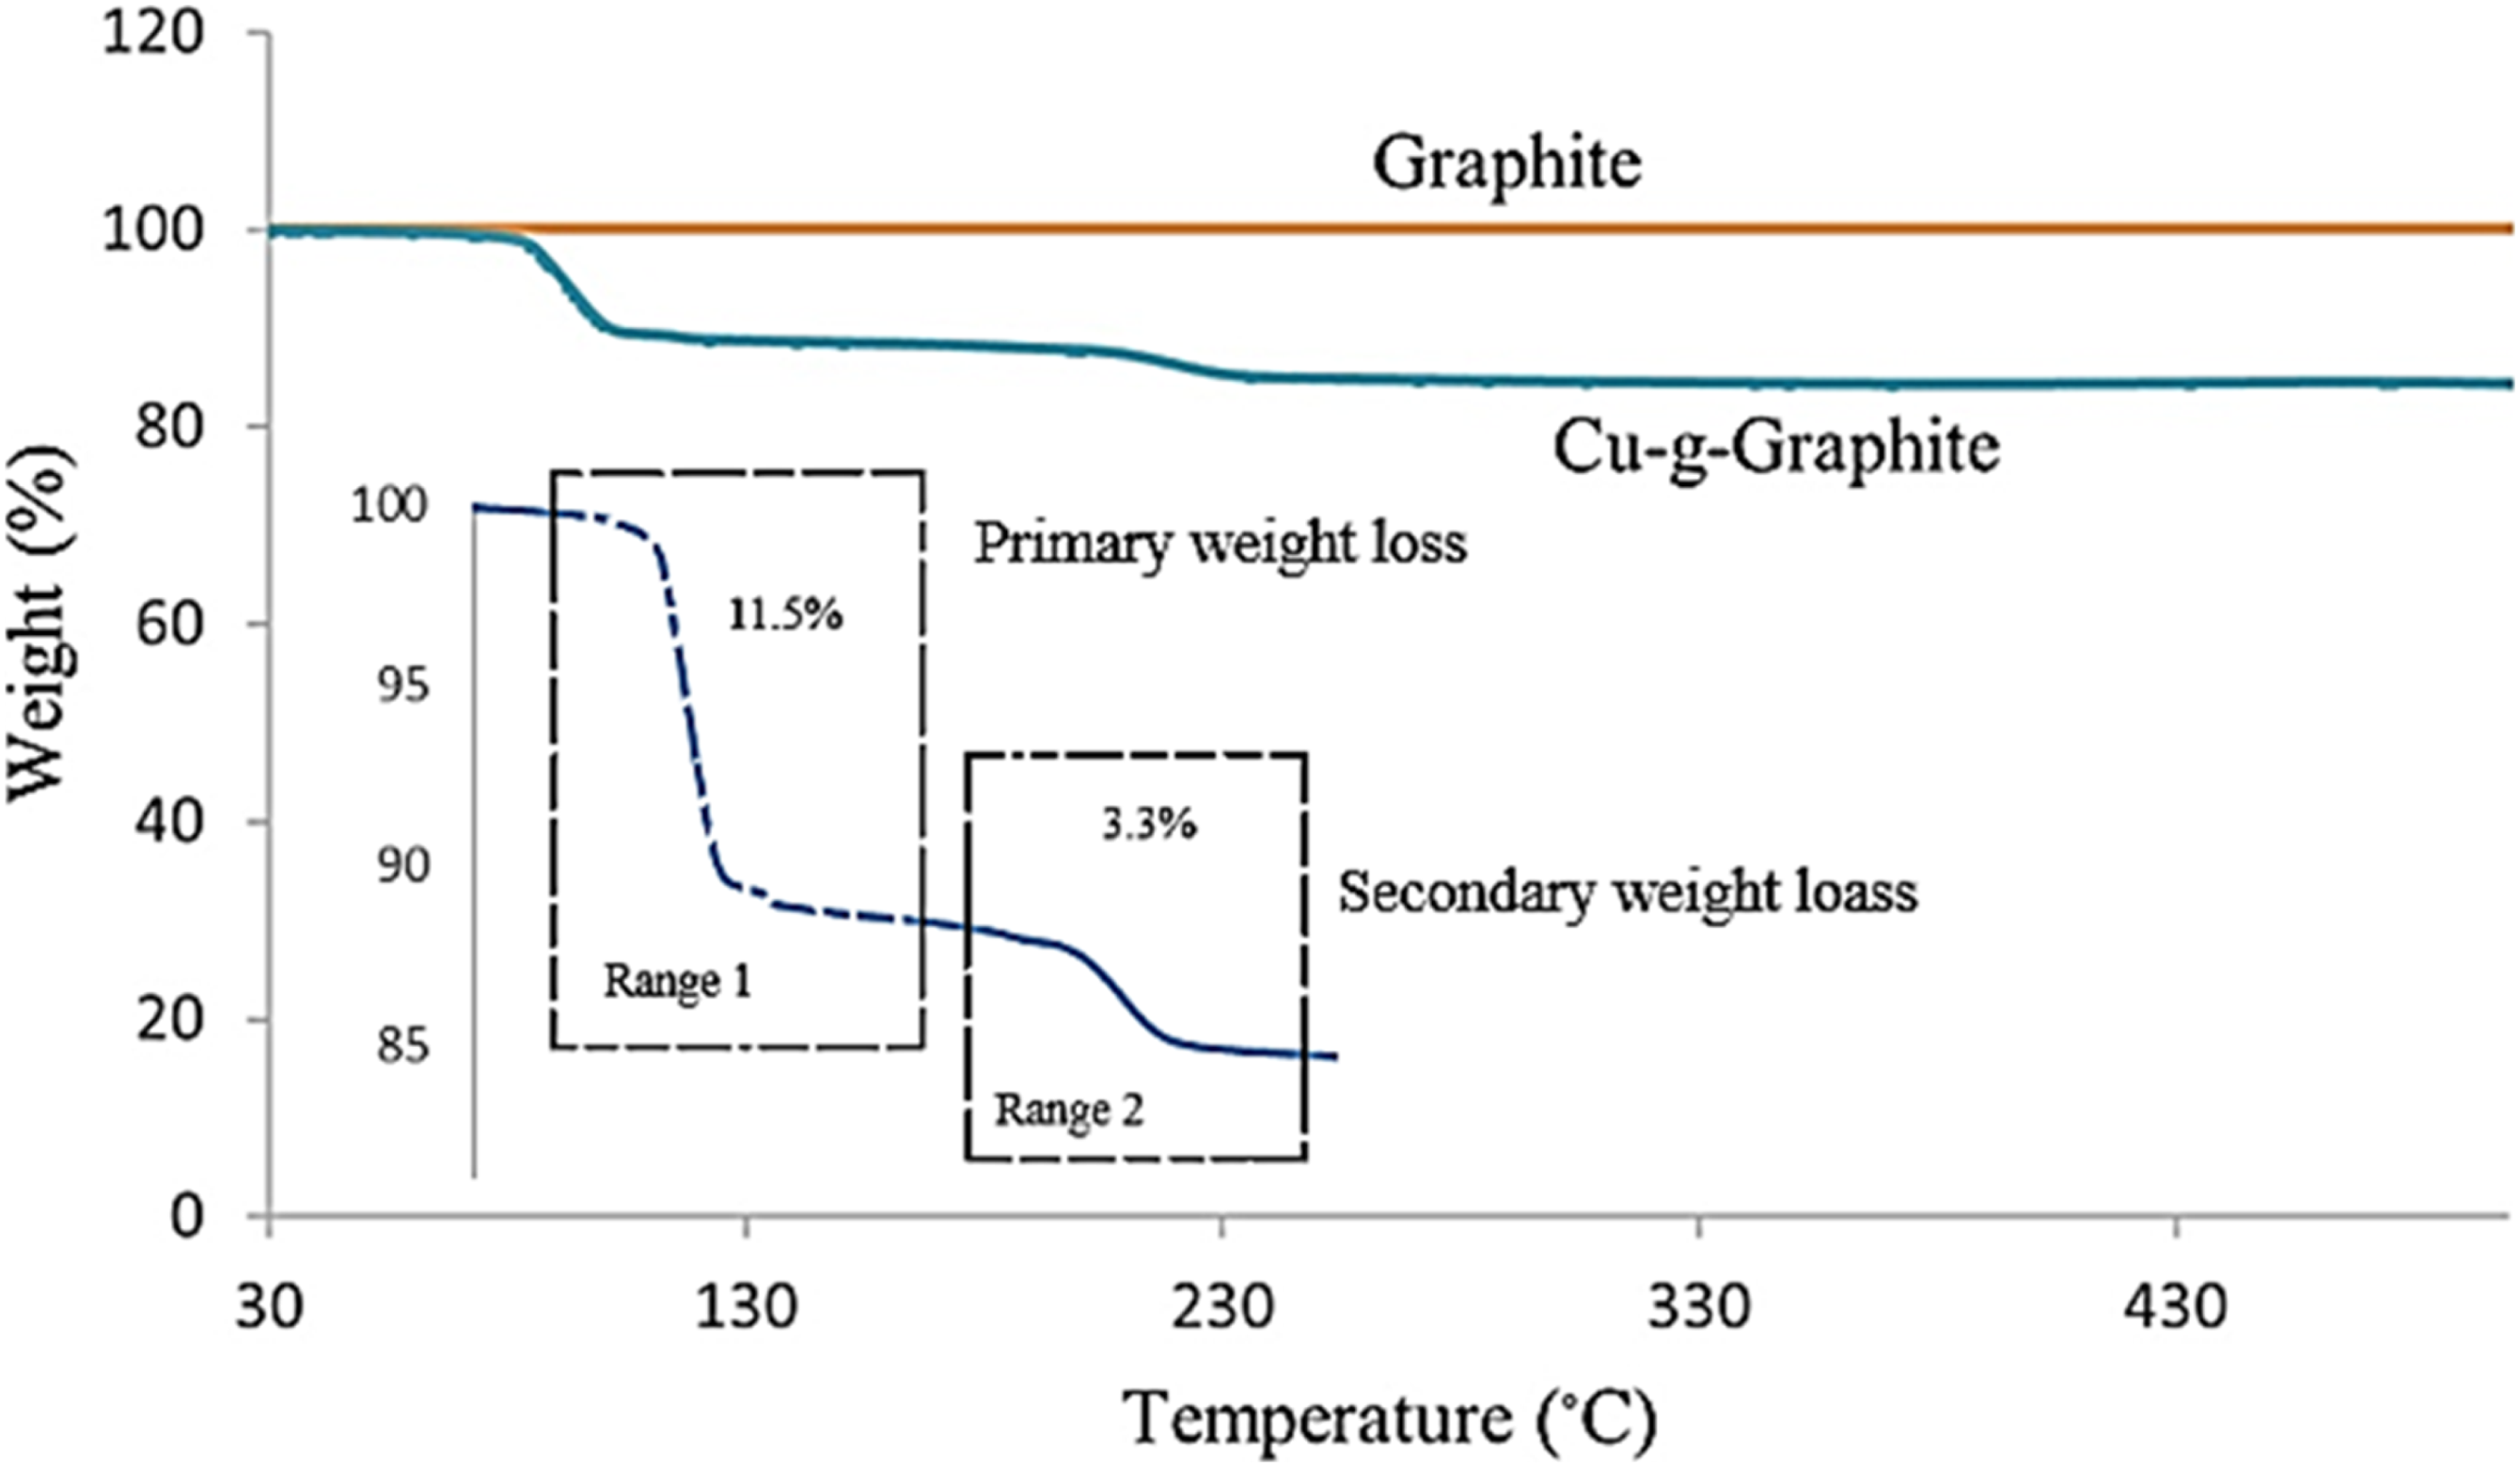
The FTIR spectra of graphite and Cu-g-graphite are shown in the Figure 2. As seen in the Figure 2, the natural graphite powder shows a weak peak at 1766 cm−1, which indicates the stretching vibration of aromatic C=C bond.
29
However, Cu-g-graphite shows better functionality compared to the graphite powder. The C–H stretching for Cu-g-graphite shows two peaks between 2900 cm−1and 3000 cm−1. Further, the Cu element indicates a peak at 1610 cm−1.
30
and, it confirms from the figure that Cu has been grafted onto the graphite surface. Compared to the graphite powder, the surface coated with Cu powder is characterized by new weak peaks between 800 cm−1 and 1500 cm−1. Hence, Cu-g-graphite illustrates better functionality and, it would be highly advantageous for enhancement of dispersibility in the NR matrix. FTIR spectrum of graphite and Cu-g-graphite.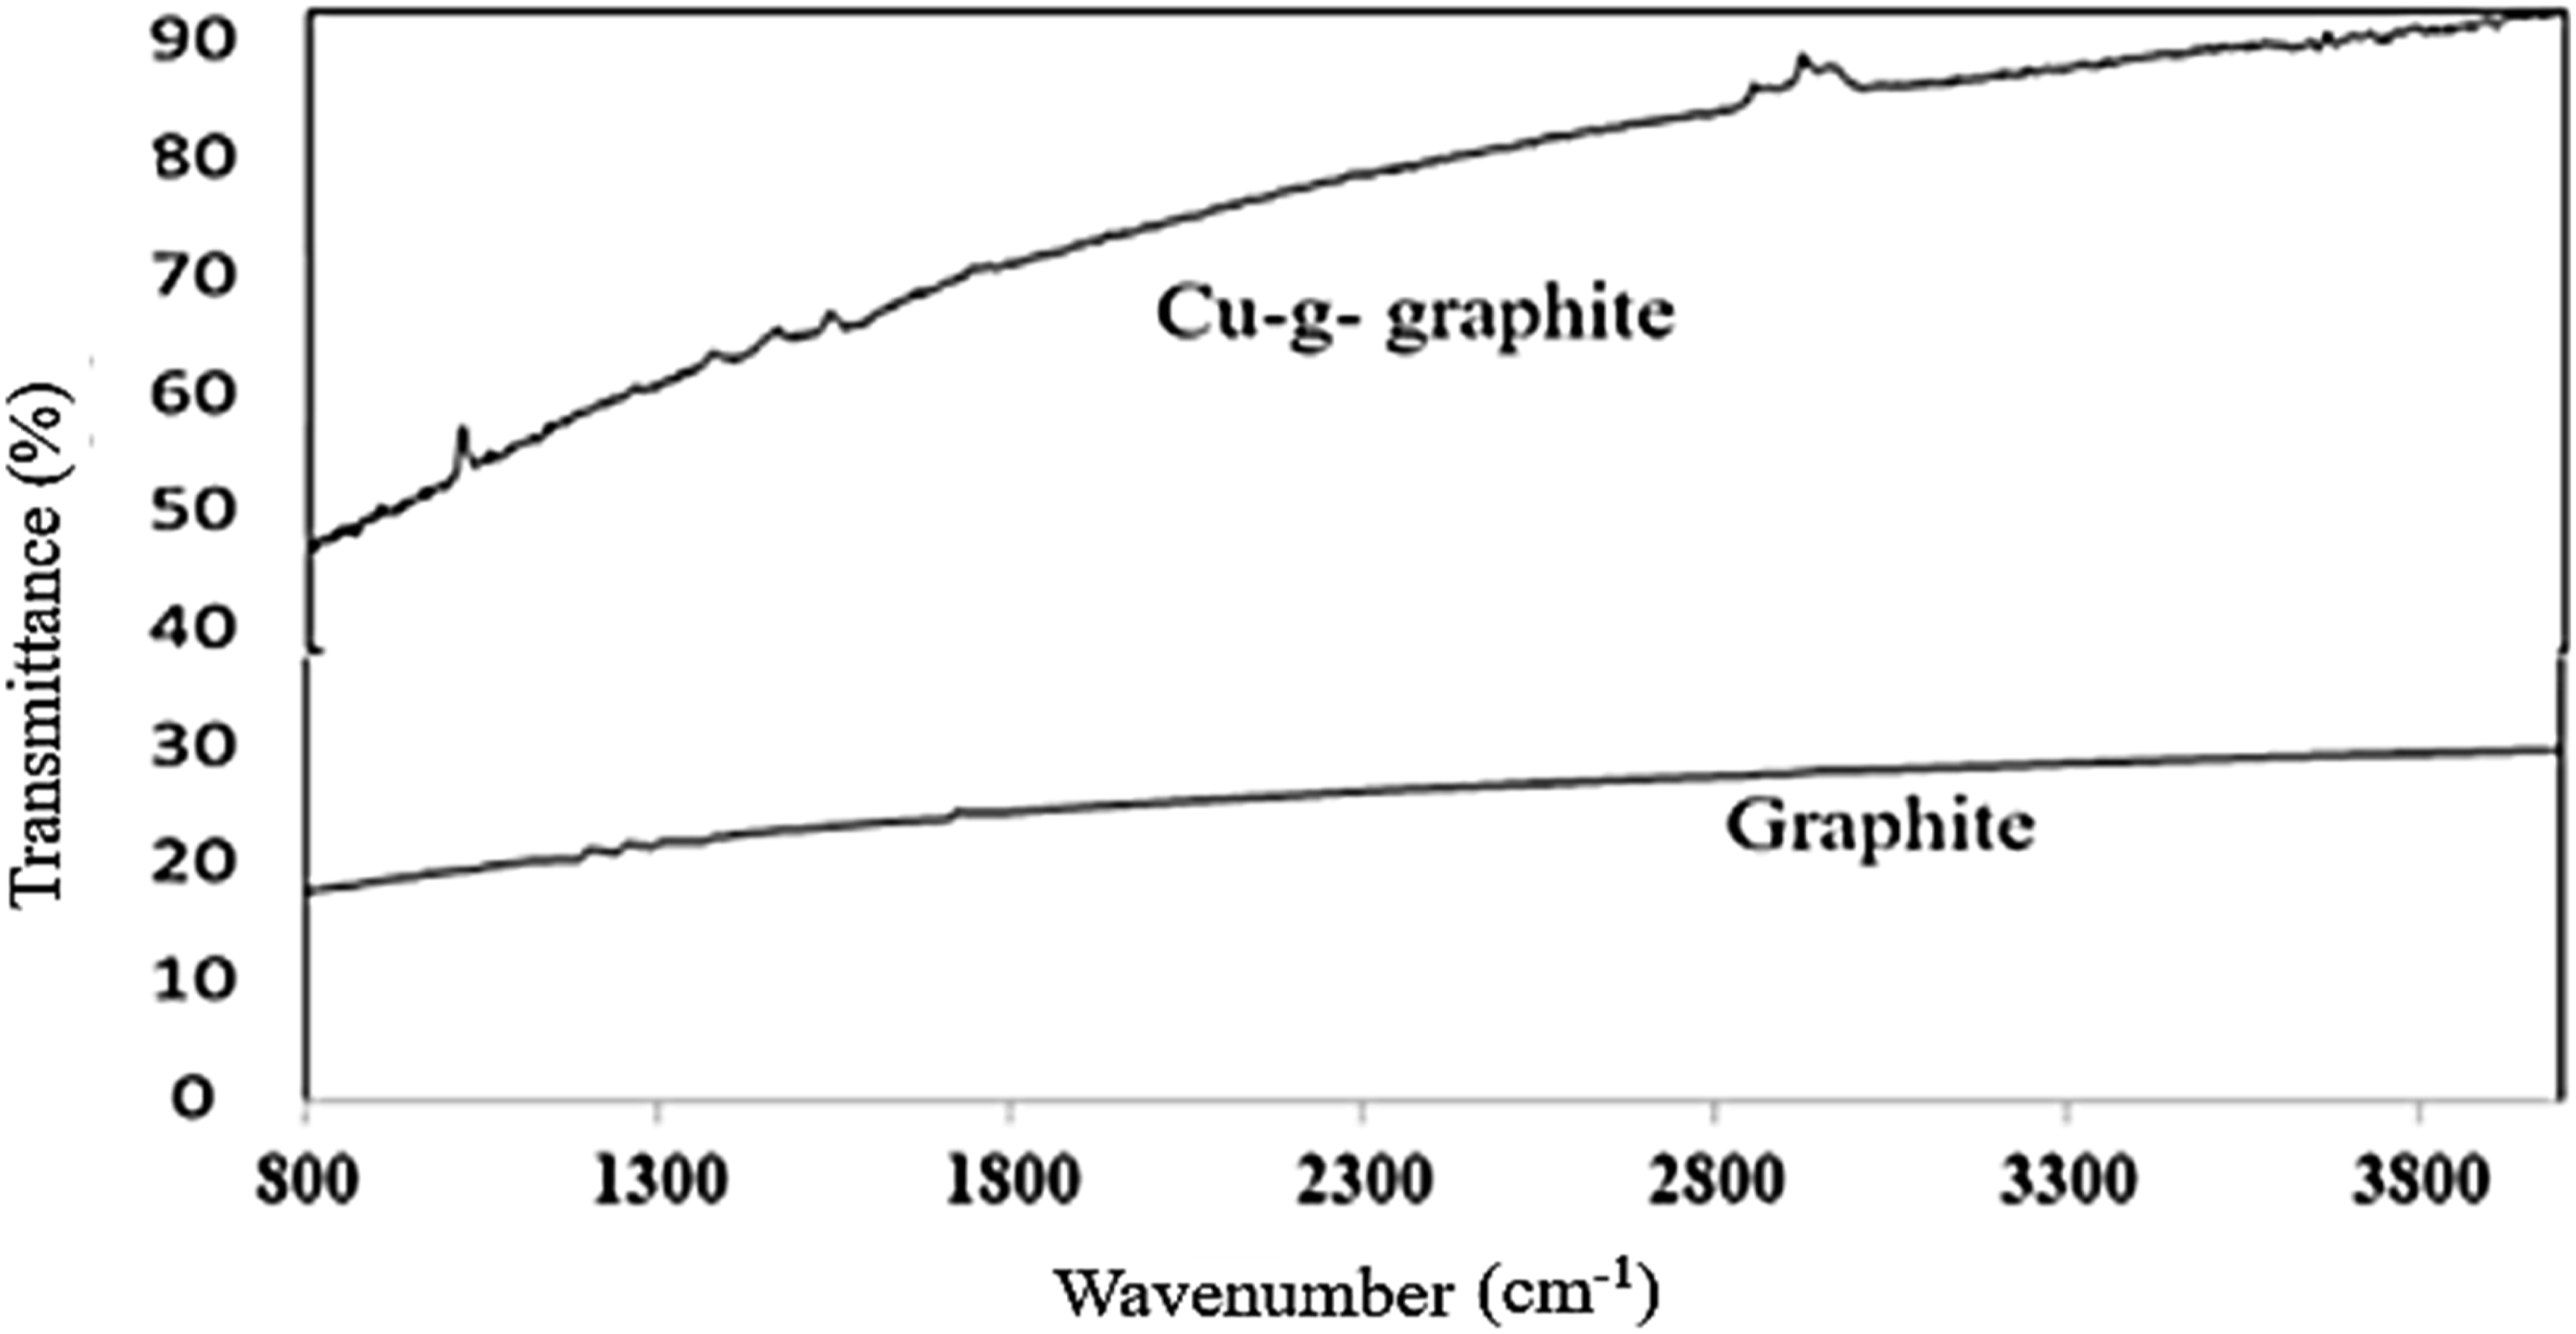
The surface morphologies of the graphite and Cu-g-graphite were studied using SEM as shown in Figure 3. According to Figure 3, the surface between graphite particle does not show better adhesion as the free volume among the graphite particles is very high. Cu-g-graphite also shows some adhesion between graphite particles and illustrates a crystal form Figure 3(b). Cu-coated particles are almost irregular in shape and they are bigger than natural graphite particles. As a result, Cu particles accumulate on the graphite surface. Jang et al. reported that, shape and consistency of Cu-g-graphite particles would depend on several factors such as size of Cu particles, size of displacement particles (zinc (Zn)), loading of Cu and Zn particles, etc.
26
SEM images of surface of (a) graphite and (b) Cu-g-graphite.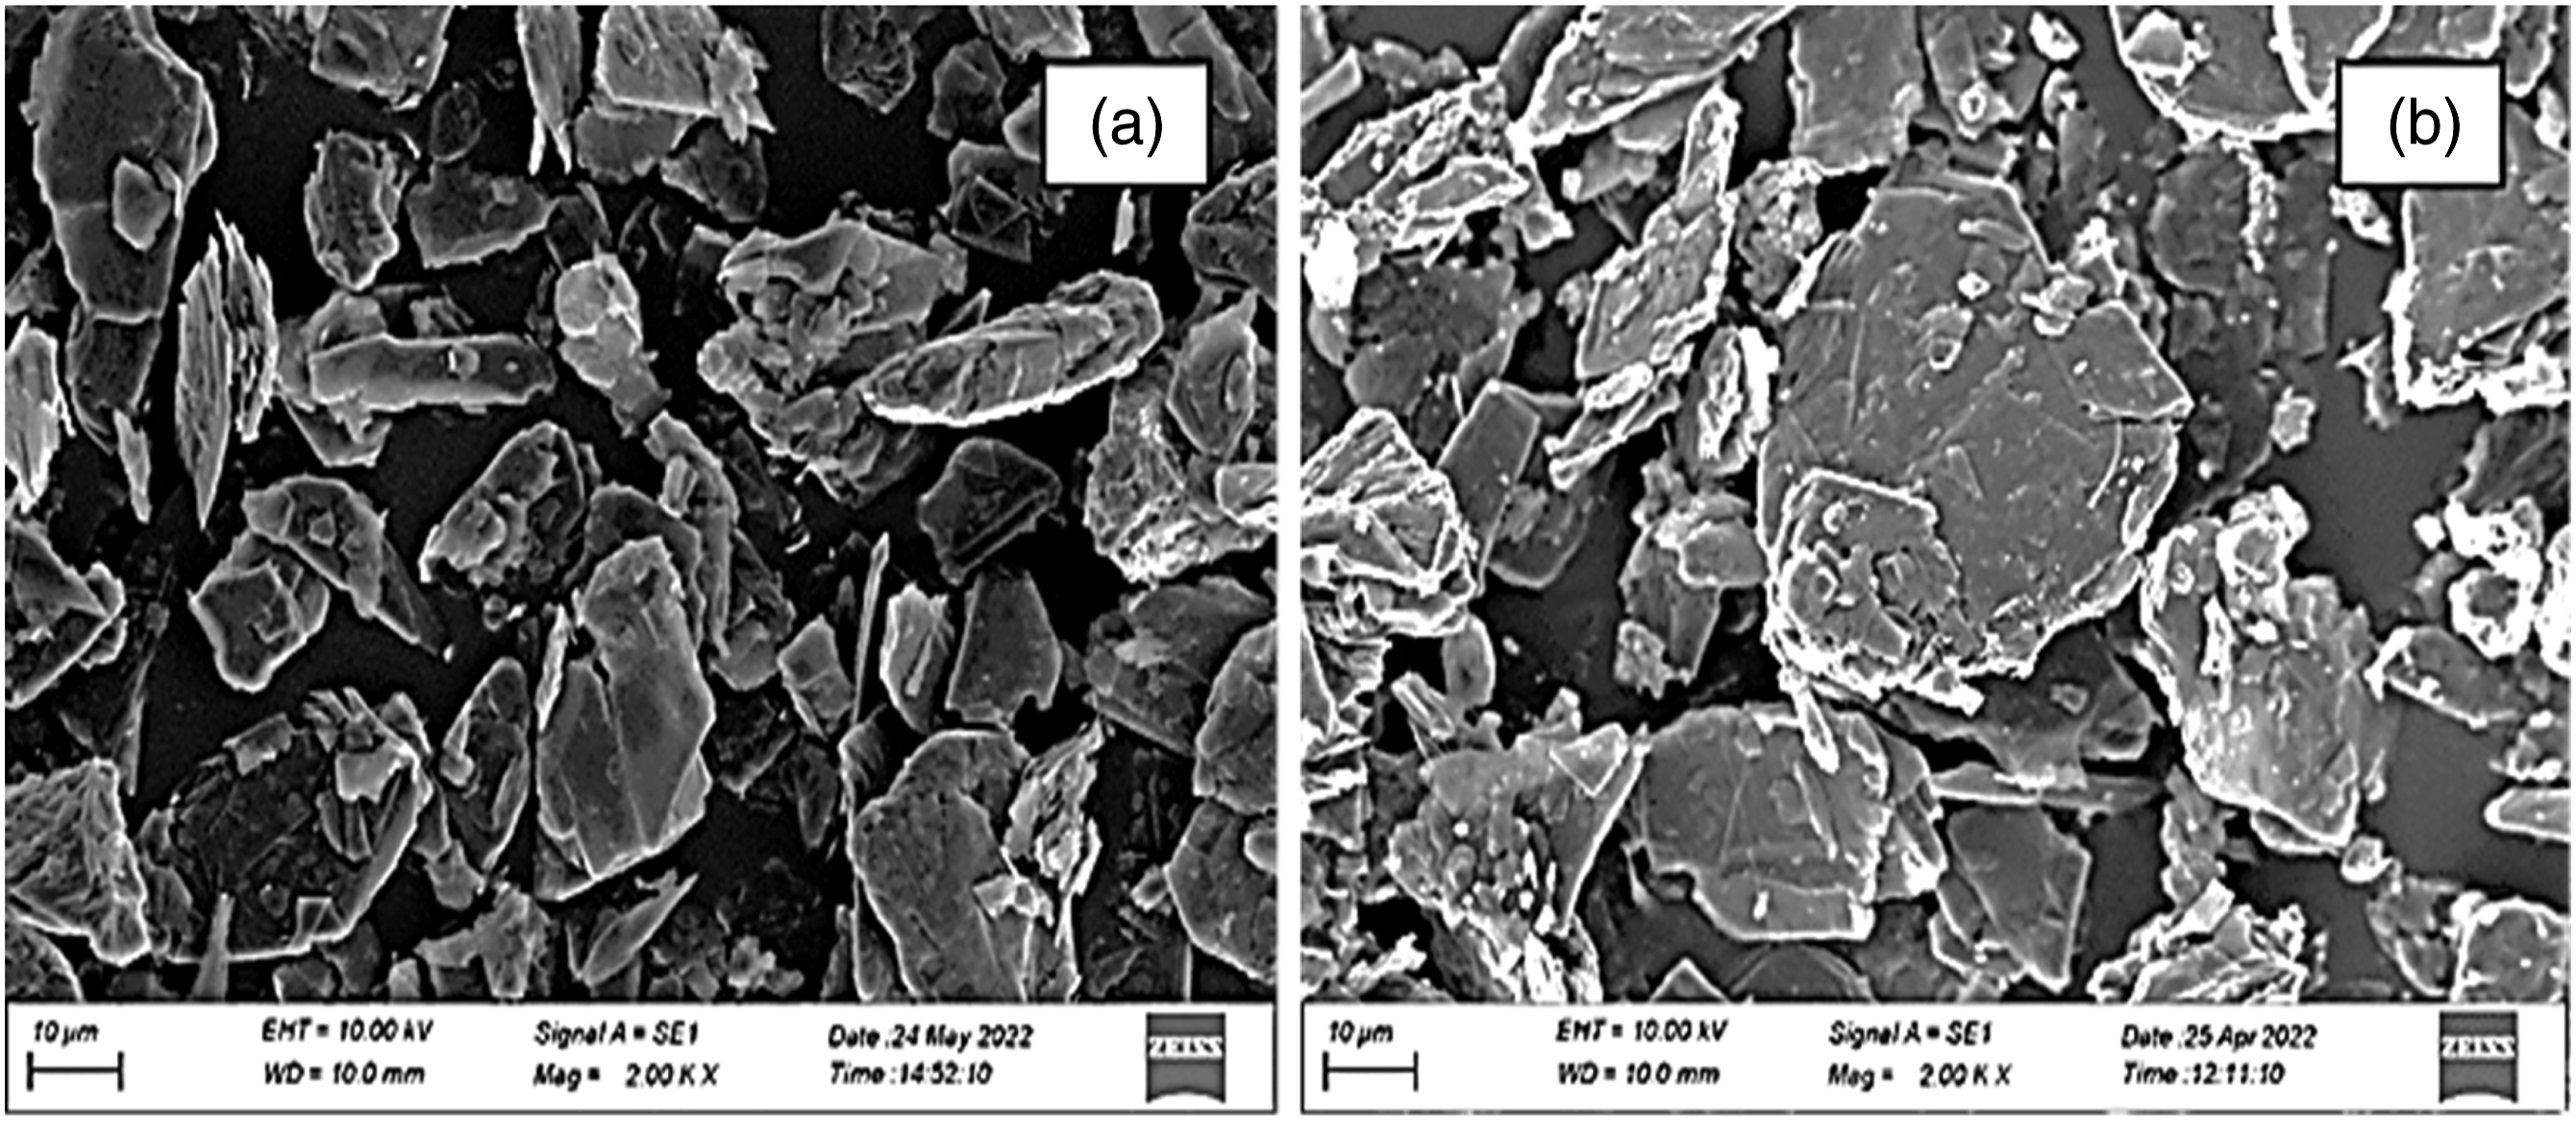
XRD patterns of graphite and Cu-g-graphite are shown in Figure 4. Graphite powder shows a characteristic peak at 2θ = 26.5o.
31
When Cu is grafted to graphite, the graphitic peak shifts to 2θ = 26.7o. In addition, few extra narrow peaks have appeared at 2θ = 20o, 40°, 36.5° and 55° due to grafting of Cu and further, similar observation for Cu films has been reported by Zhang
32
and team. In addition, graphite shows two other very low peaks at 2θ = 44.65o and 2θ = 54.67o. However, these two peaks are shifted to 2θ = 44o and 2θ = 55o, respectively due to incorporation of Cu. XRD diffractogram of (a) graphite (b) Cu-g-graphite.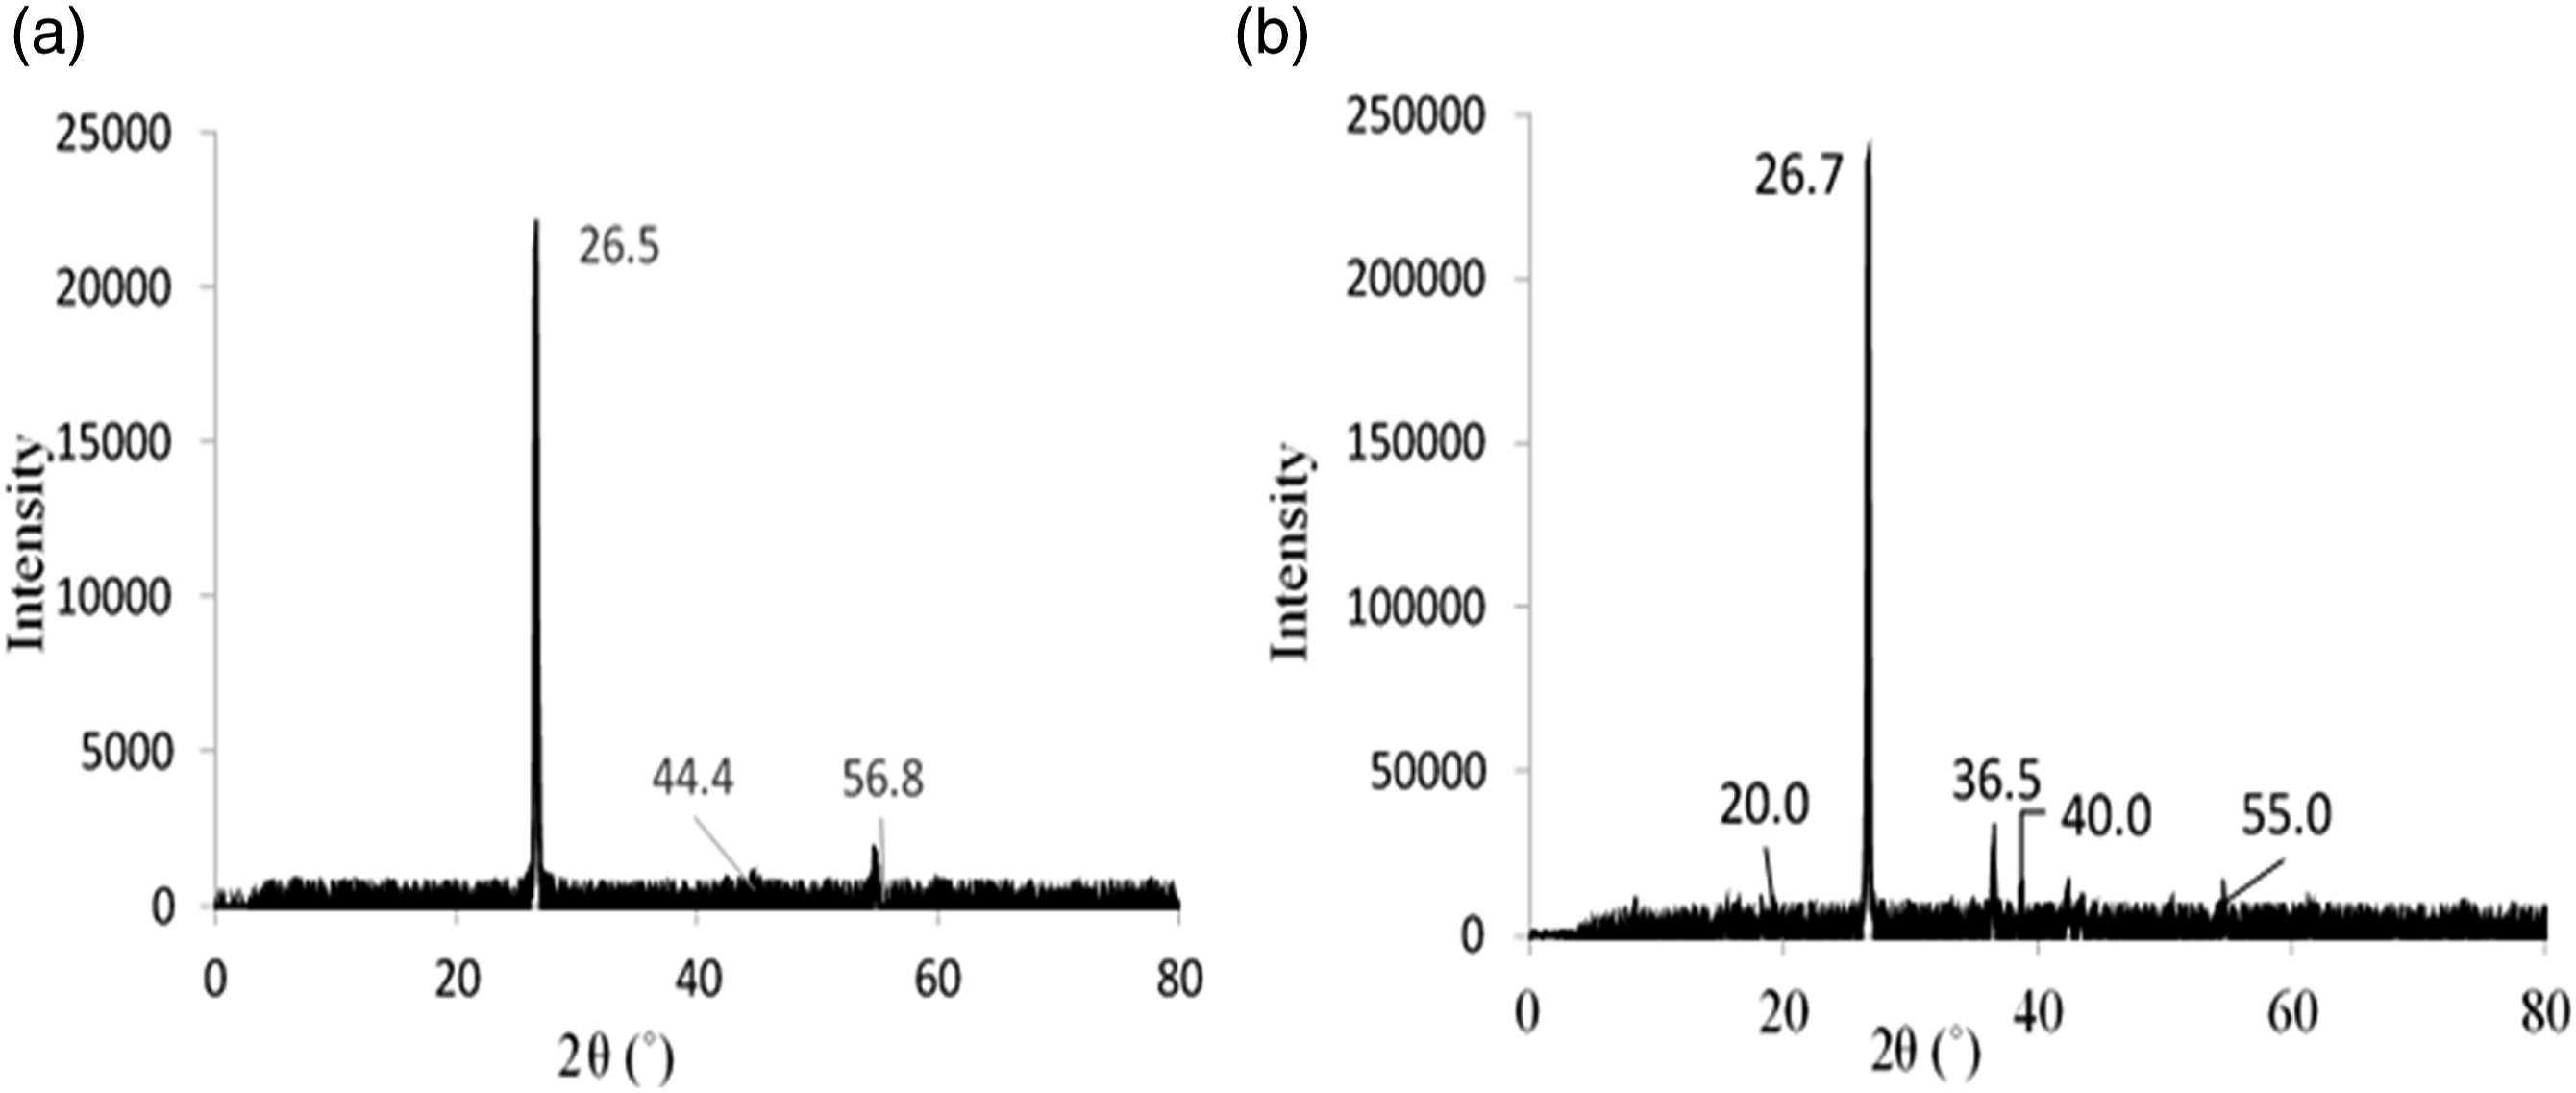
Physico-mechanical properties of Cu-g-graphite/NR composites
Stress-strain curves are an extremely important graphical measure of mechanical properties of a material such as tensile strength, modulus and elongation at break and, these parameters are highly important to explain the elastic behavior of a rubber material. Figure 5 shows the stress-strain behaviour of NR composites with and without Cu-g-graphite. Further, composites prepared with Cu-g-graphite show higher stresses compared to the control (without Cu-g-graphite). Generally, stiffness of rubber composites increases with filler loading.
33
Hence in this study, the stiffness or toughness which is indicated by the area under the stress-strain curve has increased in all the Cu-g-graphite composites. In addition, the area under the stress-strain curve represents the elastic potential energy of a polymeric material.
23
Hence, the composite prepared with 8 phr loading of Cu-g-graphite shows a higher elastic potential energy per unit volume (3831.8 x 106 Stress-strain curves of Cu-g-graphite/NR composites.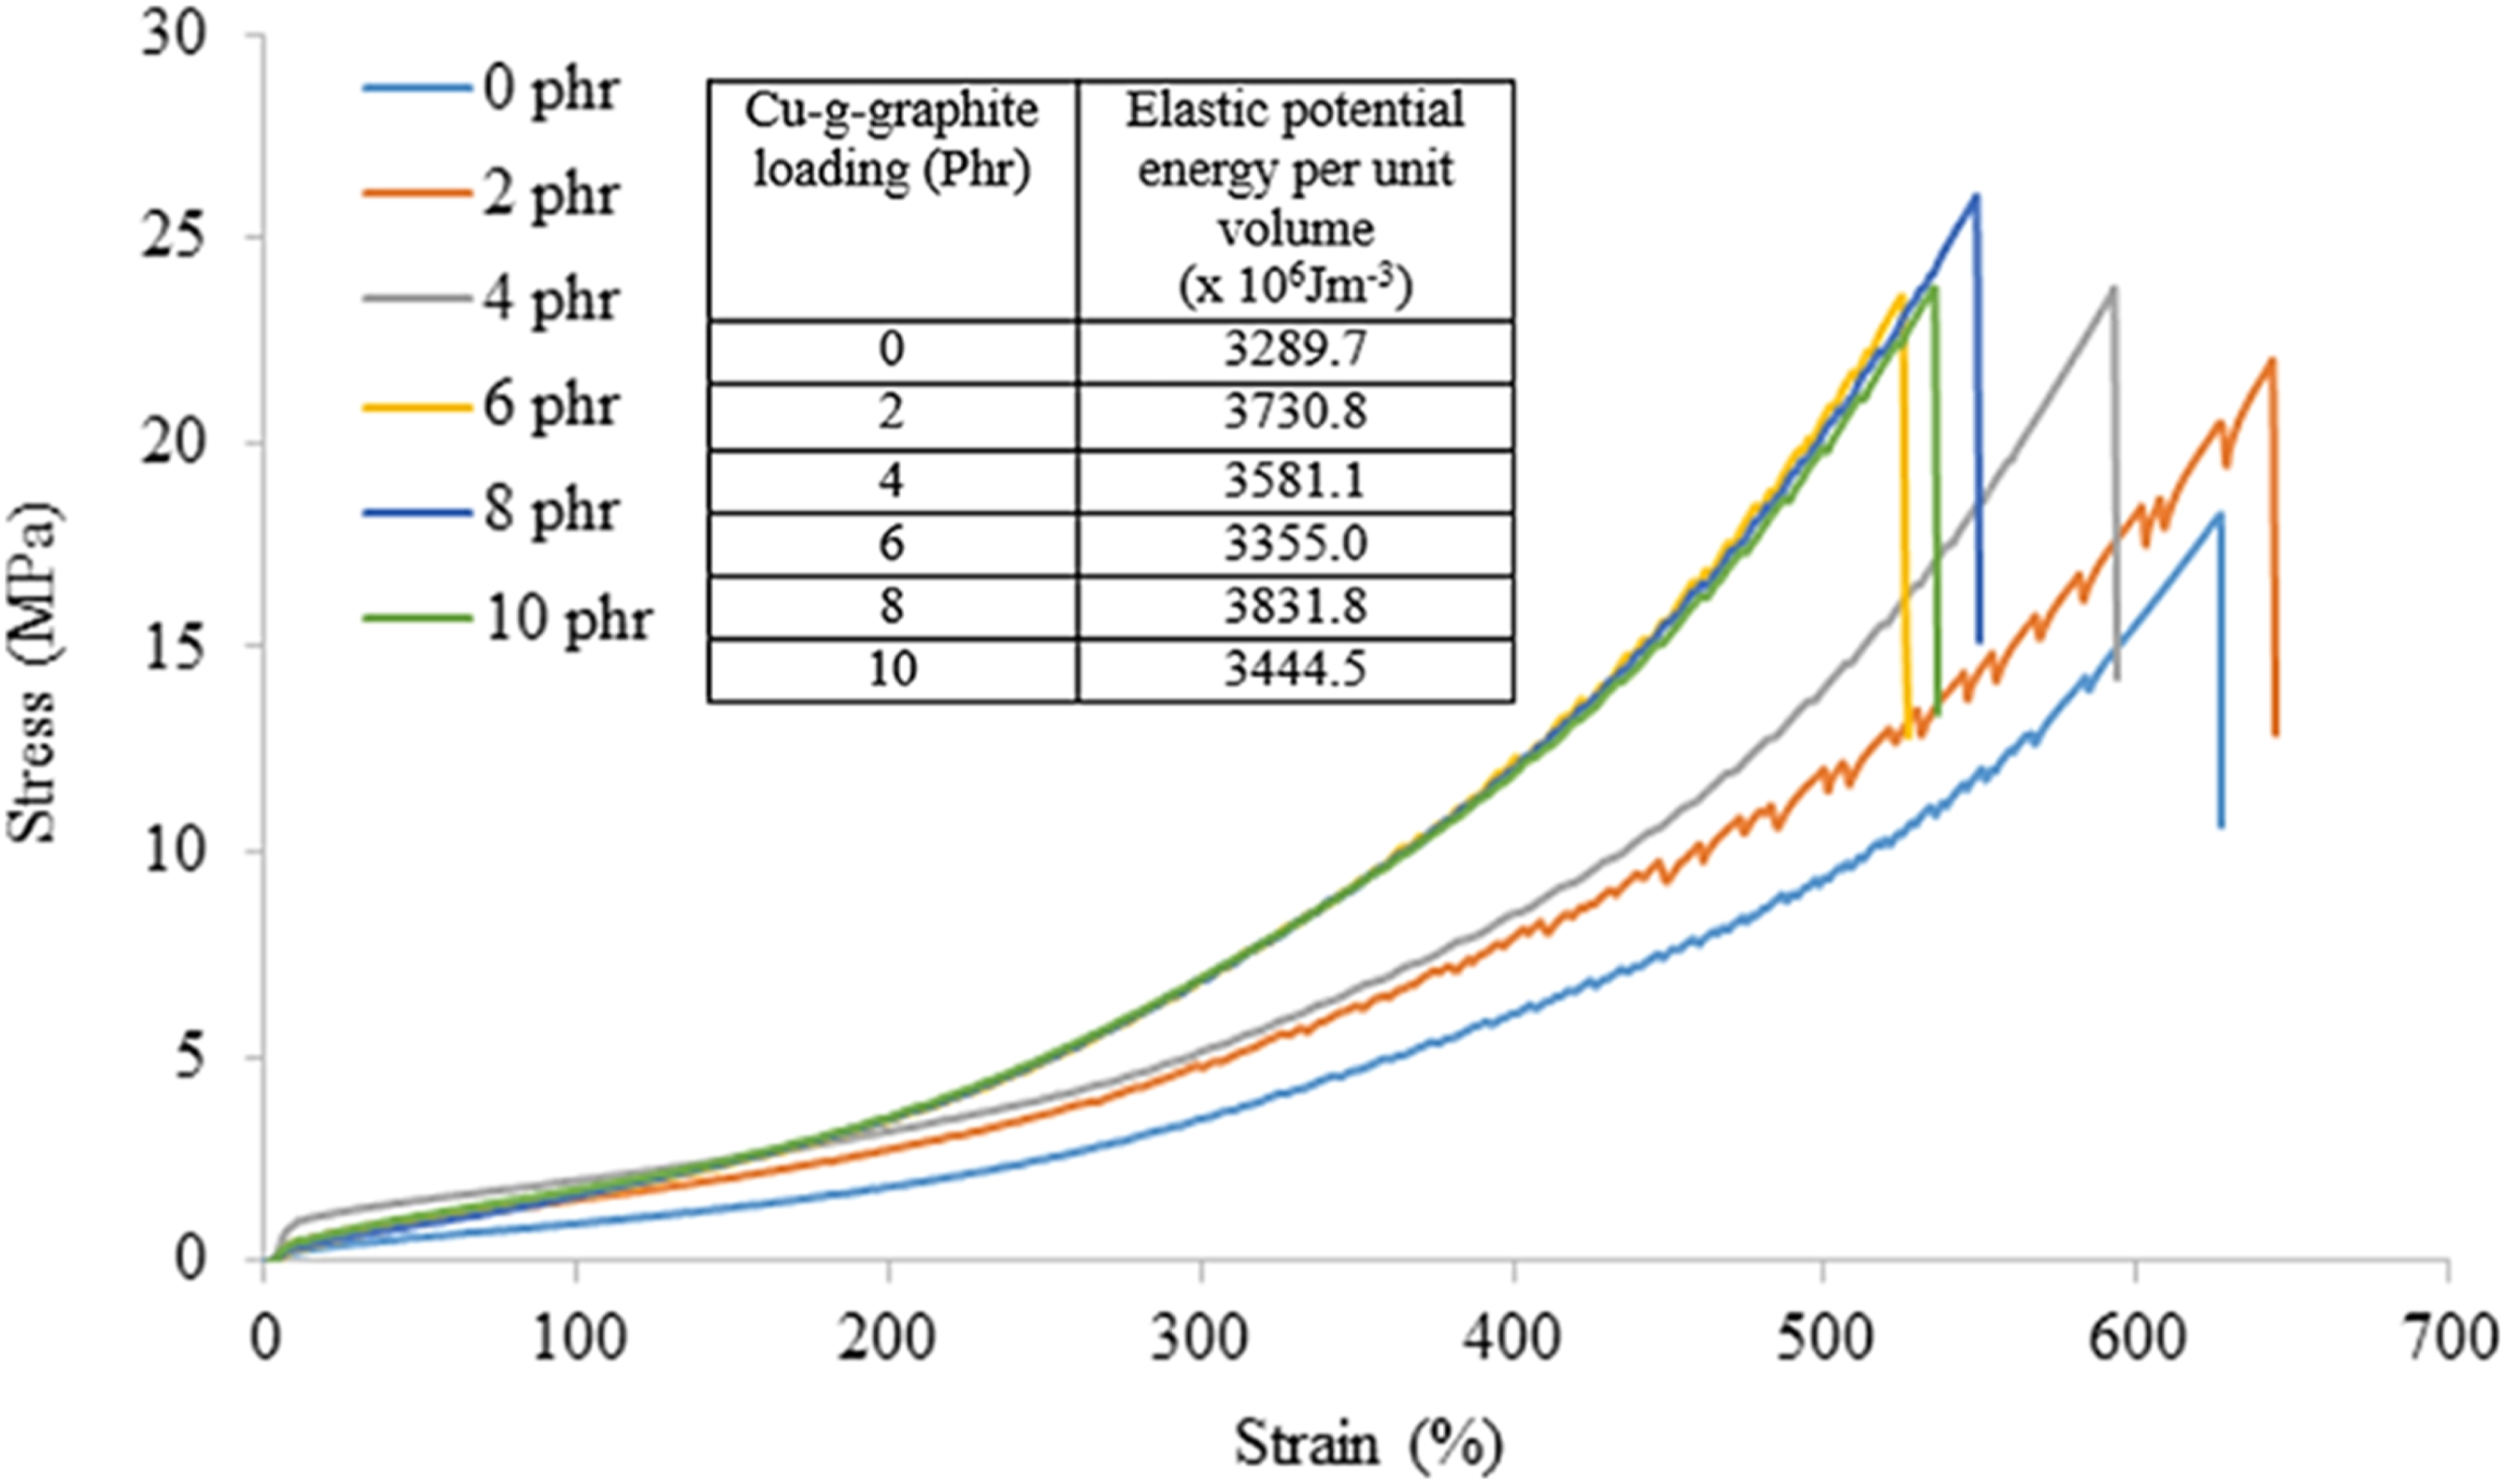
Variation of hardness of NR composites with Cu-g-graphite loading is shown in Figure 6. Hardness of all six composites is observed in the range 41 – 48 IRHD. Hardness of all the composites prepared with Cu-g-graphite is higher than that of the control. Hardness of a polymeric material is a measure of its stiffness.
34
The composite prepared with 8 phr loading of Cu-g-graphite shows the highest hardness and it can be attributed to the highest toughness. Further, hardness is a measure of resistance to applied deformation and it is correlated to the degree of crosslinking of a rubber composite.
34
The hardness of composites increases with increasing Cu-g-graphite loading up to 8 phr. Hence, the composite prepared with 8 phr loading of Cu-g-graphite would represent a higher crosslink density. Literature reports that both hardness and tensile strength of rubber composites increase with crosslink density at lower crosslink densities.23,34 Therefore, an increasing trend in tensile strength is also expected with the increase of Cu-g-graphite loading. Hardness of Cu-g-graphite/NR composites.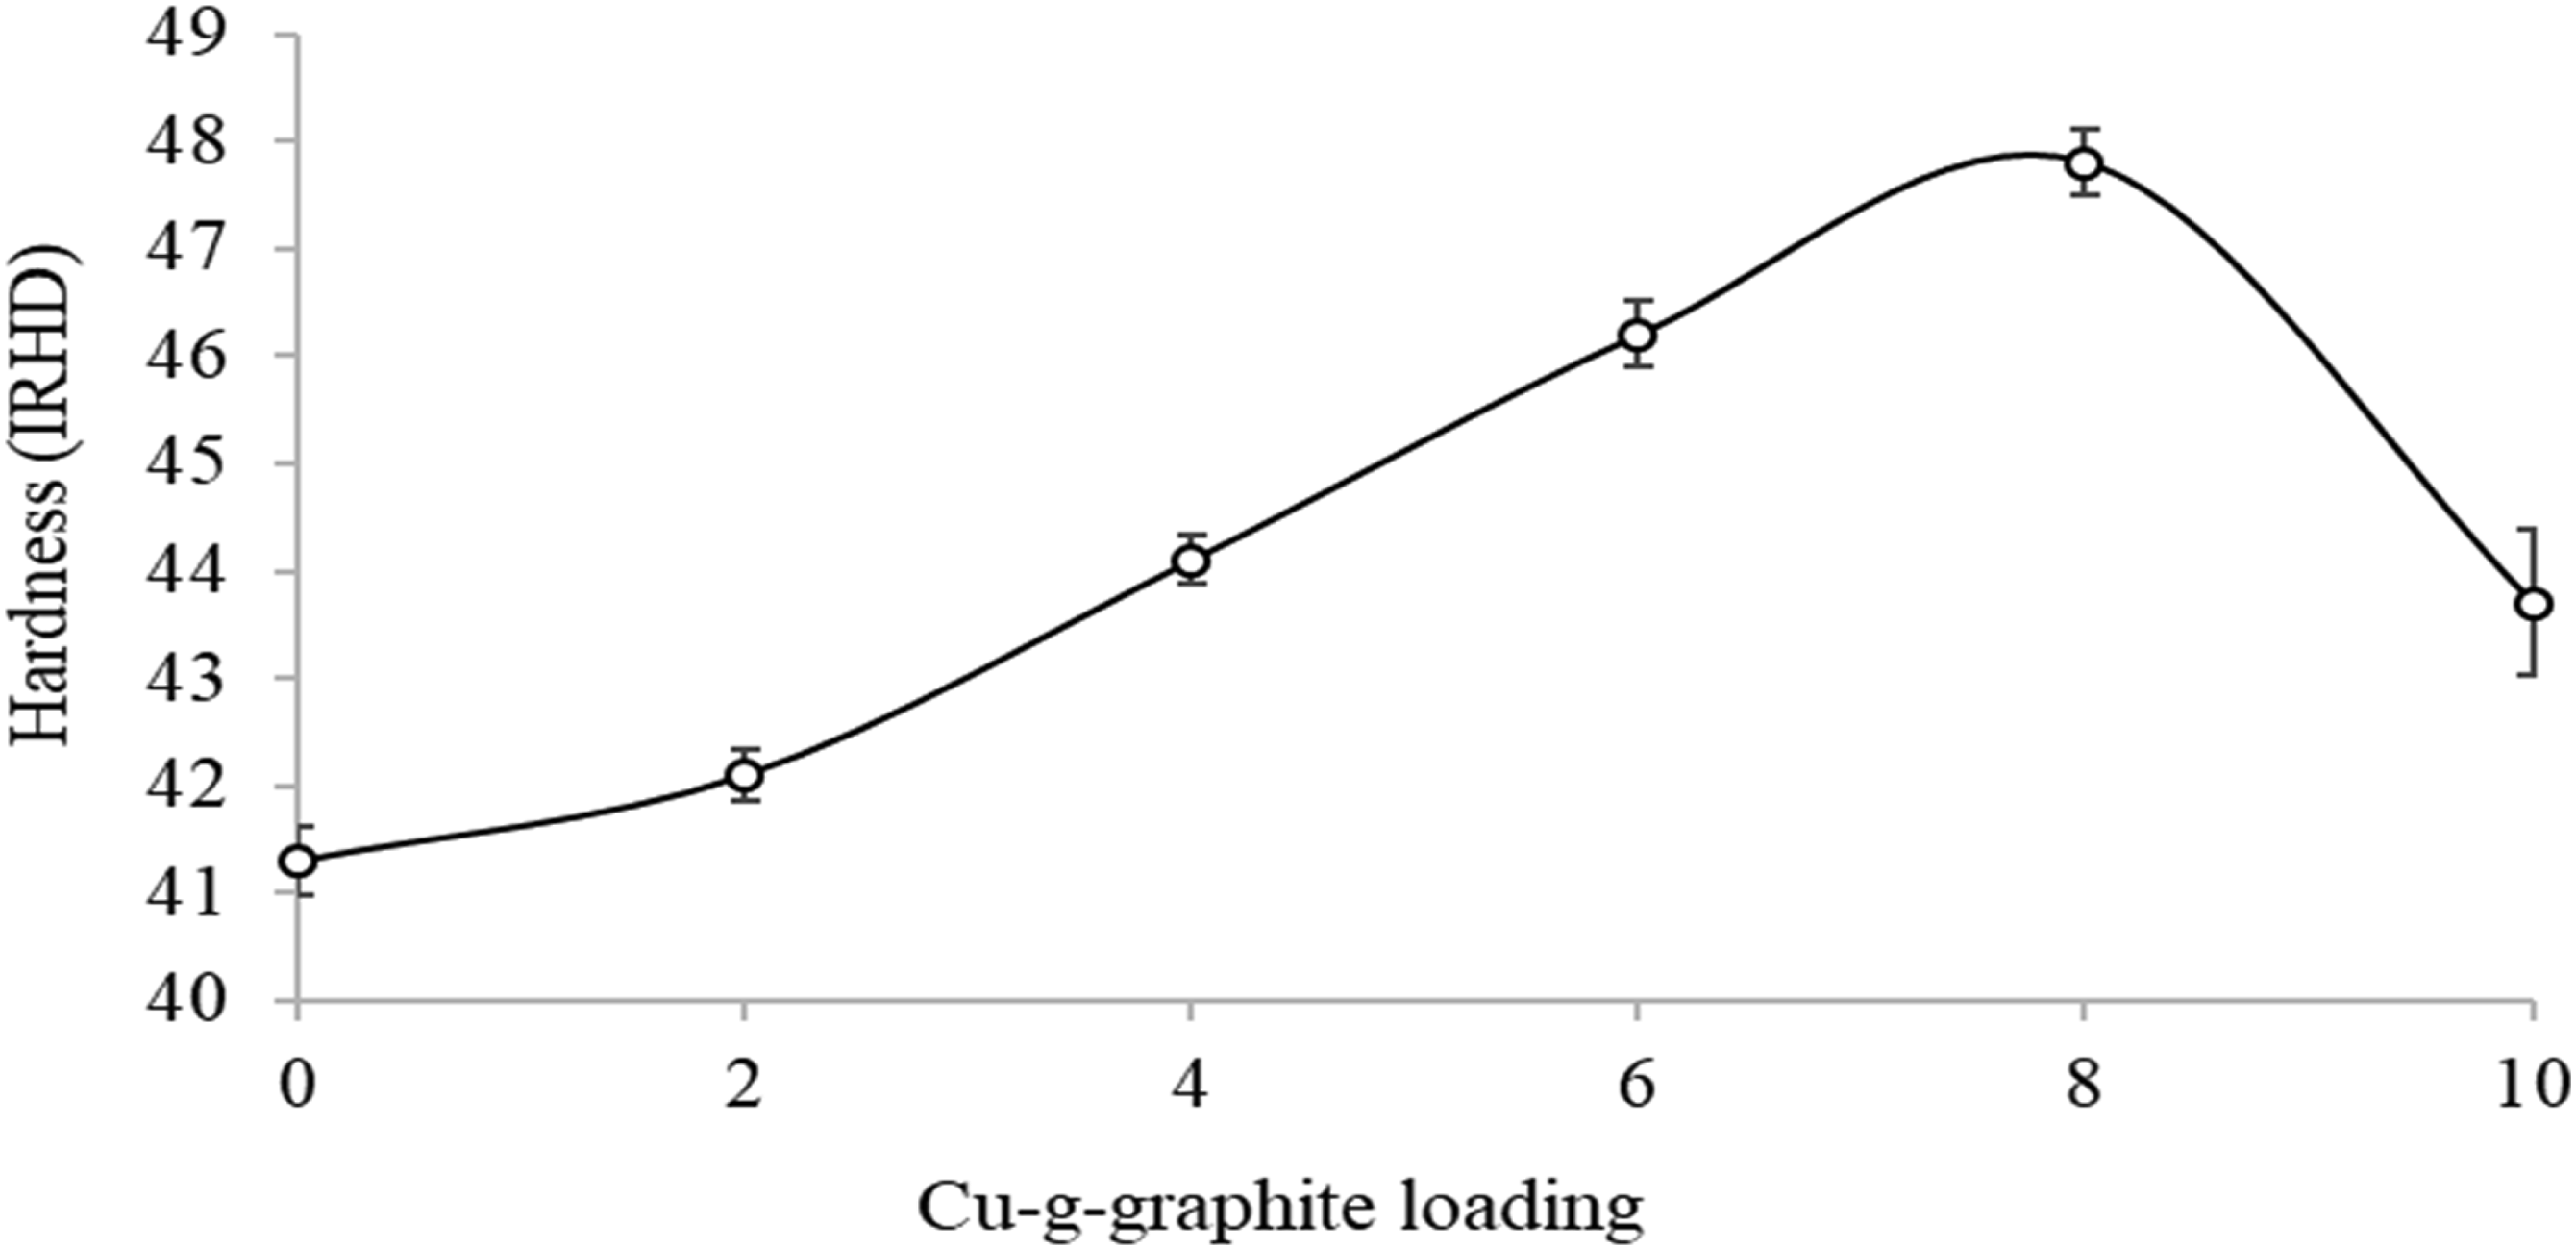
Modulus at 100% elongation, modulus at 300% elongation and modulus at 500% elongation of the NR composites increase with the increase of Cu-g-graphite loading as shown in Figure 7. The composite prepared with 10 phr loading of Cu-g-graphite shows the highest modulus at 300% elongation and can be attributed to the highest crosslink density.
35
However, all the composites exhibit similar tangents at 100% elongation (Figure 5) and hence, modulus at 100% elongation of NR composites has not shown a significant variation with the increase of Cu-g-graphite loading (Figure 7). Further, modulus at 100% elongation illustrates linear correlation with increment of Cu-g-graphite loading. Additionally, all the Cu-g-graphite-filled NR composites show a slight improvement of modulus at 100% elongation compared to the control. Furthermore, modulus at 500% elongation shows a better improvement above 6 phr loading of Cu-g-graphite (Figure 7). This can be attributed to the low loading of Cu-g-graphite which is not sufficient for proper adhesion with the NR matrix. Modulus of Cu-g-graphite/NR composites.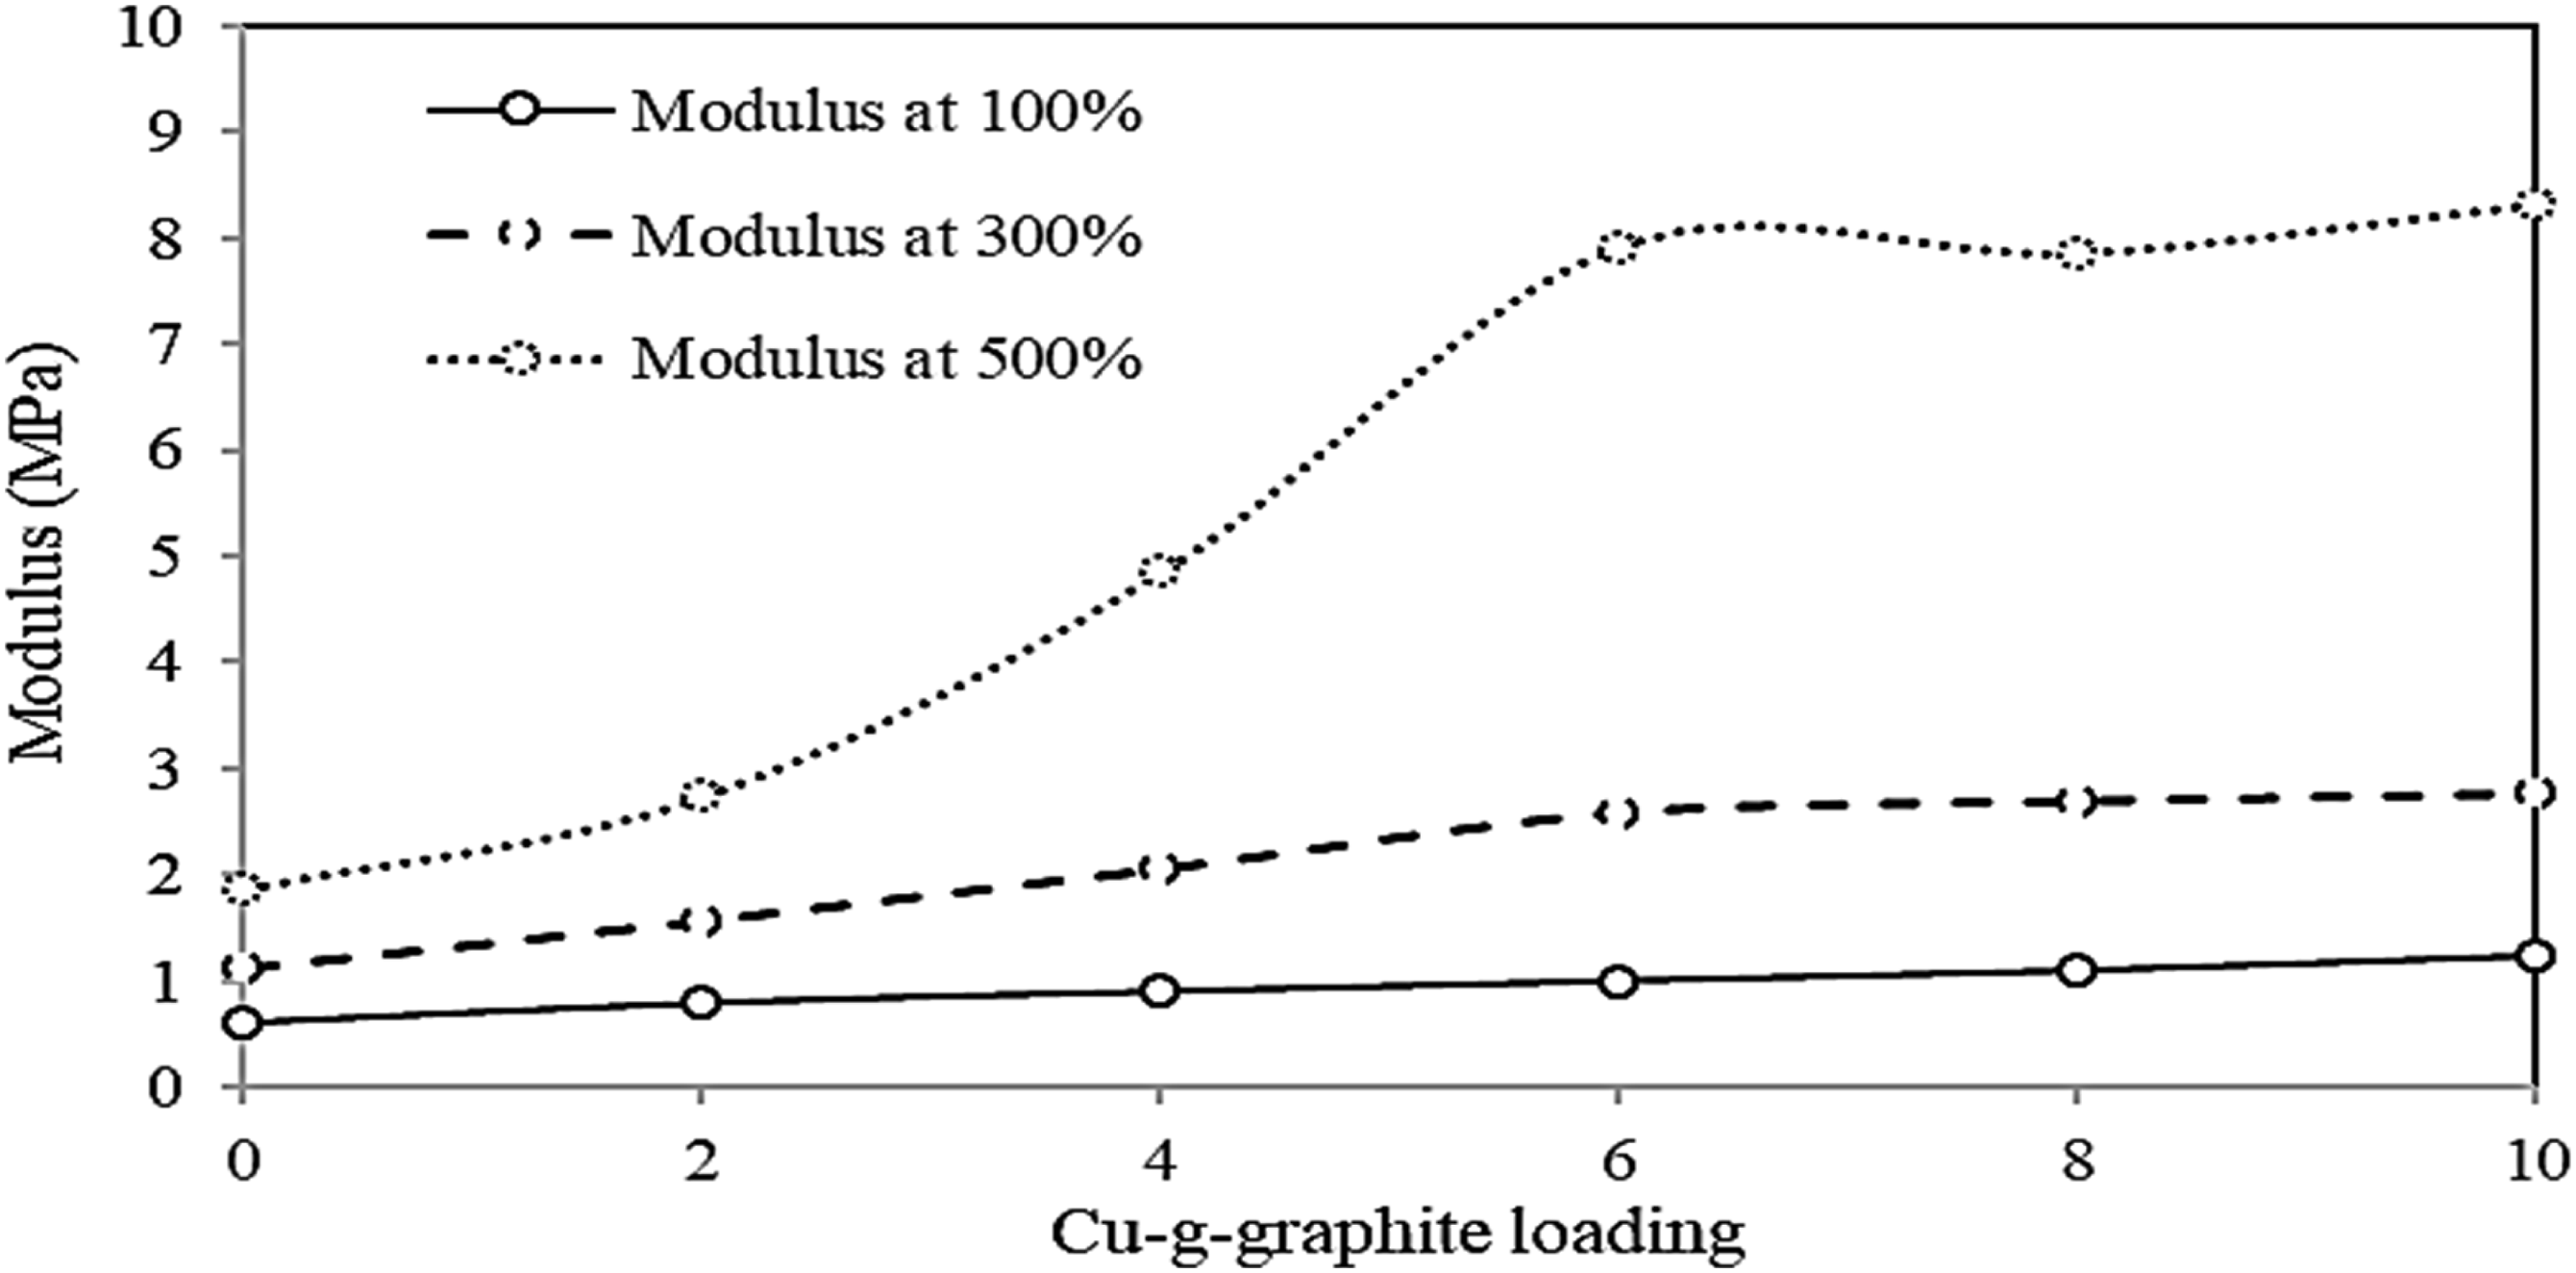
Tensile strength of the NR composites varies according to a cyclic pattern with the increase of Cu-g-graphite loading as shown in Figure 8. Tensile strength of Cu-g-graphite based composites is higher than that of the control due to better adhesion between NR and Cu-g-graphite phases. Further, the highest value of tensile strength is observed when 8 phr Cu-g-graphite is incorporated into the NR matrix. Miranda
36
and team reported about the tendency to form aggregates with the increase of the Cu nanoparticle loading in the polyurethane (PU) matrix. Hence, the composite prepared with 10 phr loading of Cu-g-graphite shows a slight reduction of tensile strength in comparison to the composite prepared with 8 phr loading of Cu-g-graphite. In addition, the composite prepared with 10 phr loading of Cu-g-graphite shows a weak interface of fracture surface and hence indicate poor surface adhesion compared to the composite prepared with 8 phr loading (Figure 8). Further, Figure 8 shows the FTIR spectra of the control and the composite loaded with 8 phr Cu-g-graphite. The composite prepared with 8 phr loading of Cu-g-graphite shows two extra peaks at 1610 cm−1 and 2835 cm−1. However, these two peaks have not appeared in the spectrum of the control. The peak at 1610 cm−1 has been assigned to the Cu – C bond
30
and the other peak at 2835 cm−1, to the stretching vibration of C-C bond.
36
Thus, the formation of these bonds confirms that interaction between NR, Cu-g-graphite, and other ingredients is better in the composite prepared with 8 phr loading of Cu-g-graphite. This would also support the observed increase in tensile strength and hardness at 8 phr loading of Cu-g-graphite. Tensile strength of Cu-g-graphite/NR composites.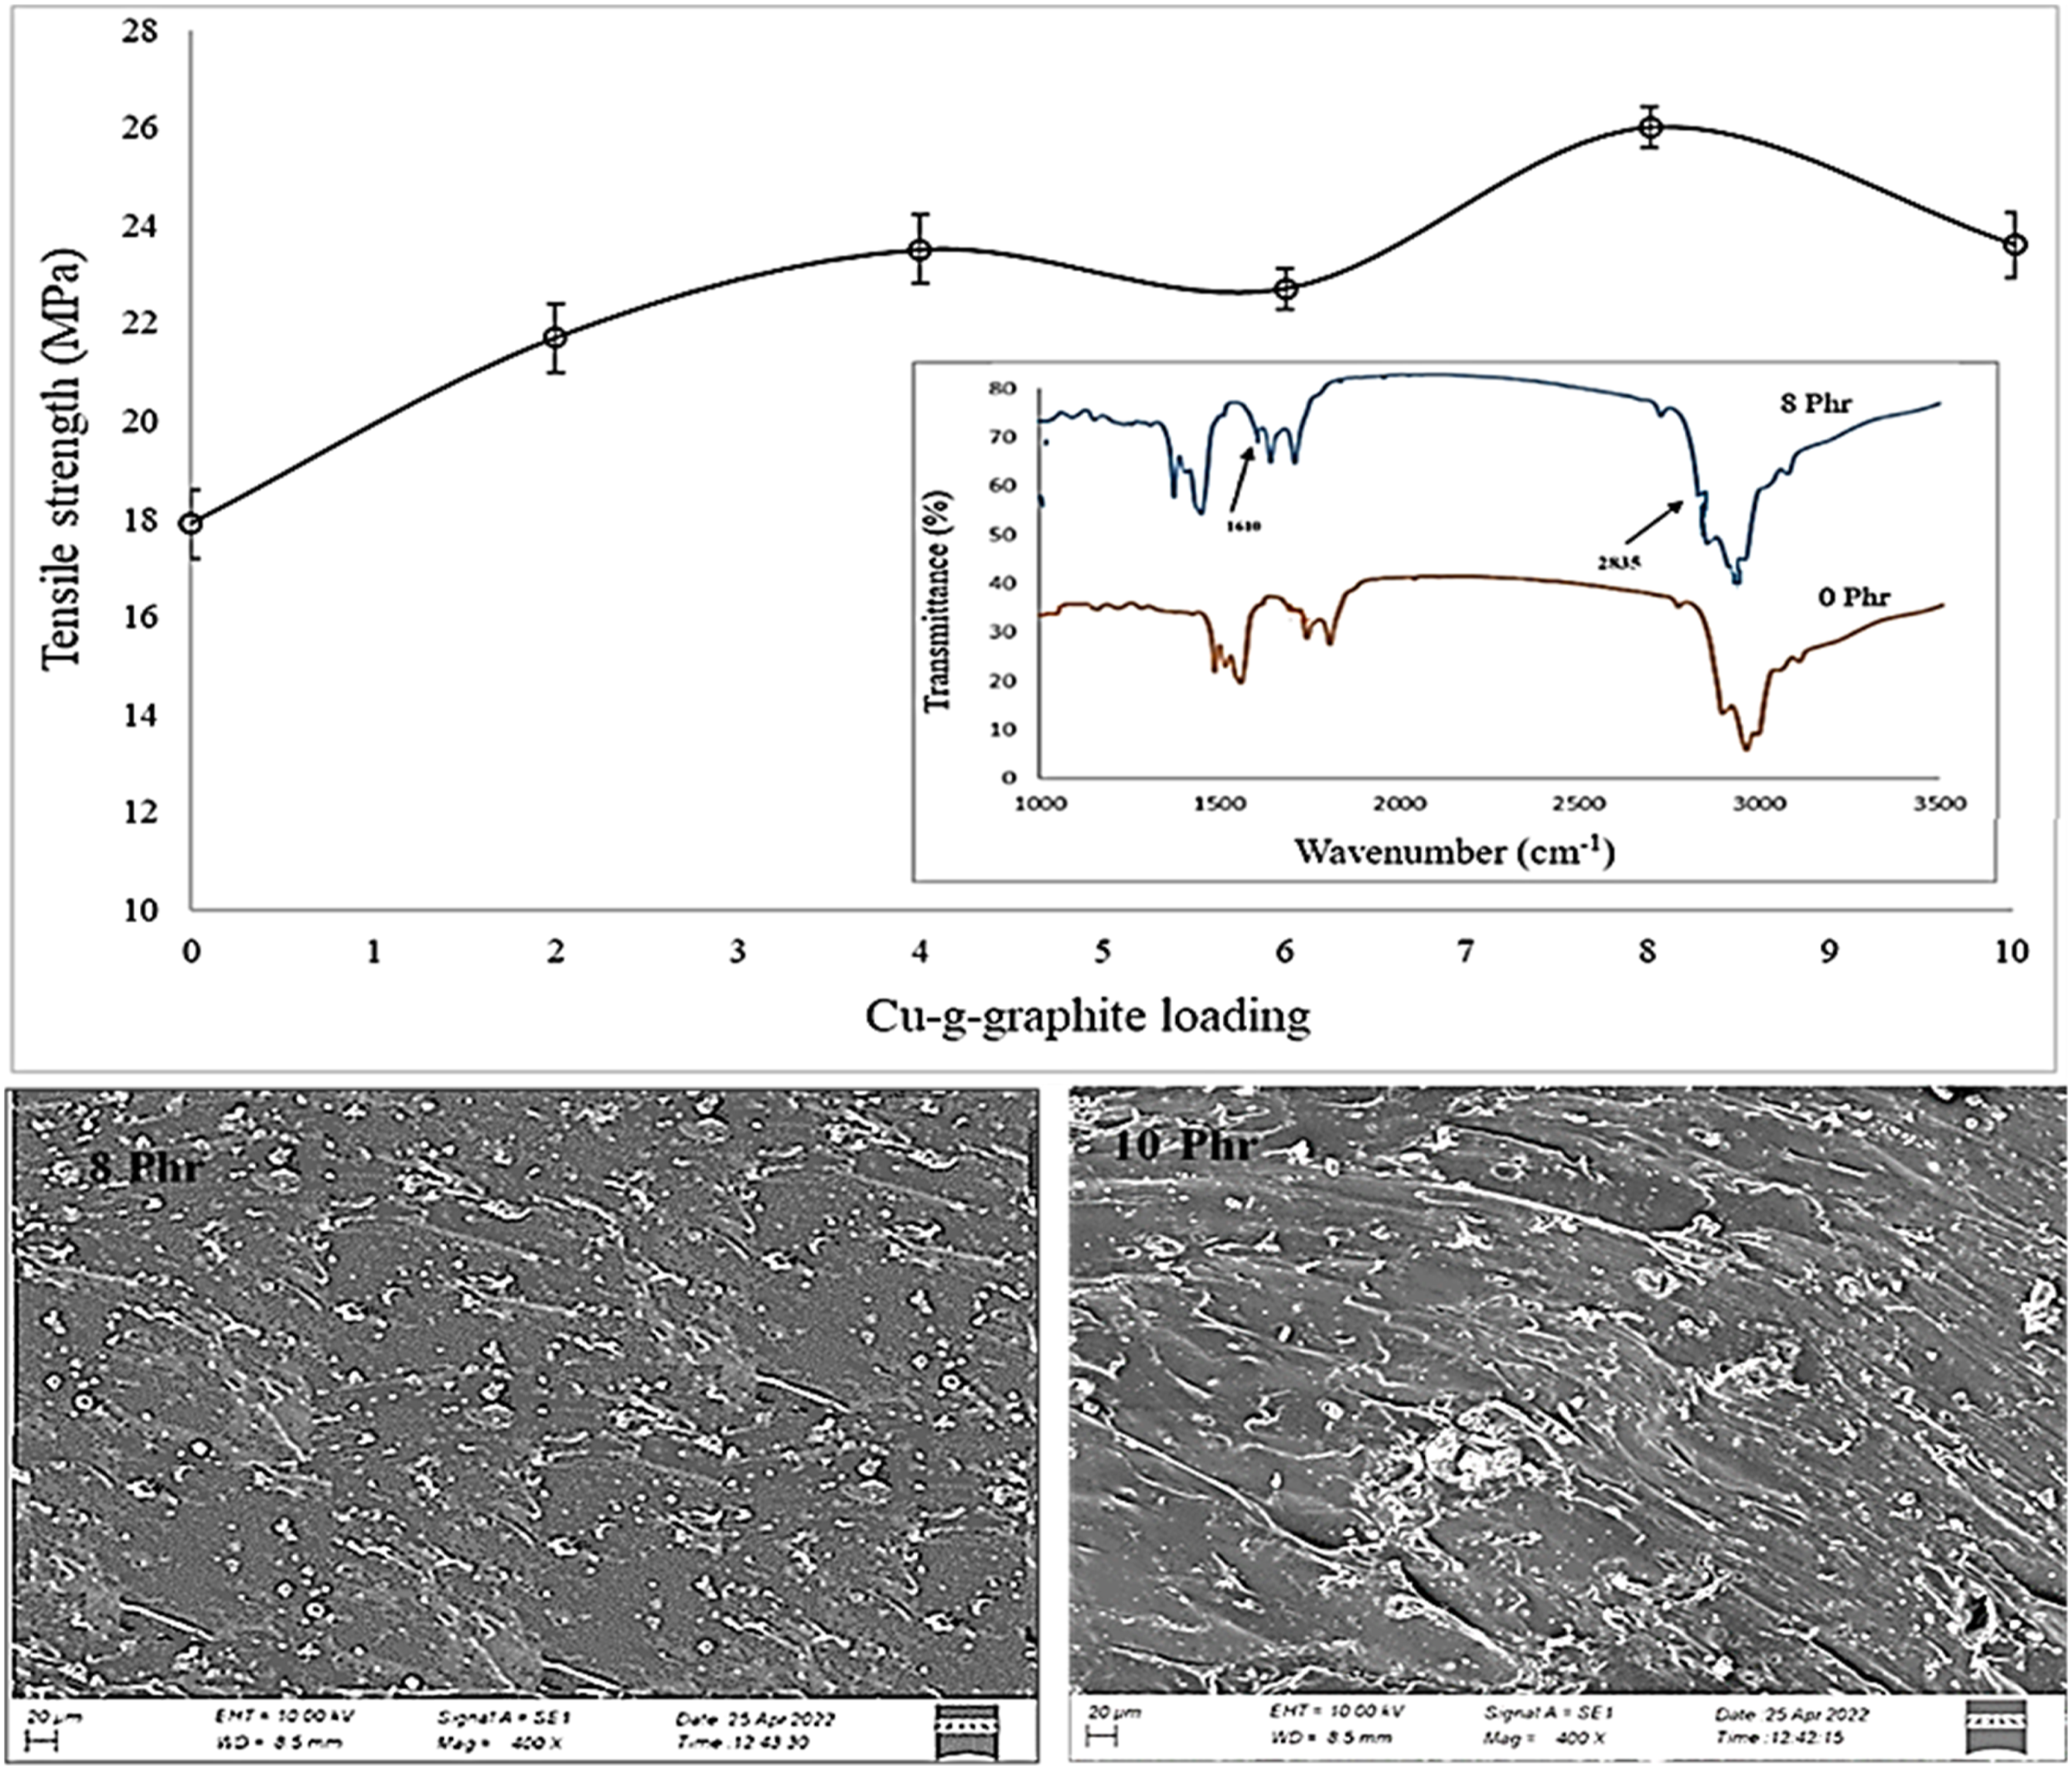
Elongation at break of the composites has also varied in a cyclic pattern with the increase of Cu-g-graphite loading (Figure 9.), however a decreasing trend is observed. Further, the composite prepared with 6 phr loading of Cu-g-graphite shows the lowest elongation at break and it can be attributed to the lack of adherence between the NR matrix and the reinforcement or to the poor distribution of the Cu-g-graphite in the NR matrix due to the tendency to form aggregates.
37
In contrast, all composites illustrate good elastic nature due to they indicate high elongation at break values and all are greater than 500%. In addition, the composite prepared with 2 phr loading of Cu-g-graphite shows the highest elongation at break since its fracture surface is smooth and flat without any visible imperfections to initiate stresses (Figure 9). Furthermore, low loading of Cu-g-graphite homogenously disperses in the NR matrix and this has led to an improvement of the elastic nature in 2 phr Cu-g-graphite loaded composite. Elongation at break of Cu-g-graphite/NR composites.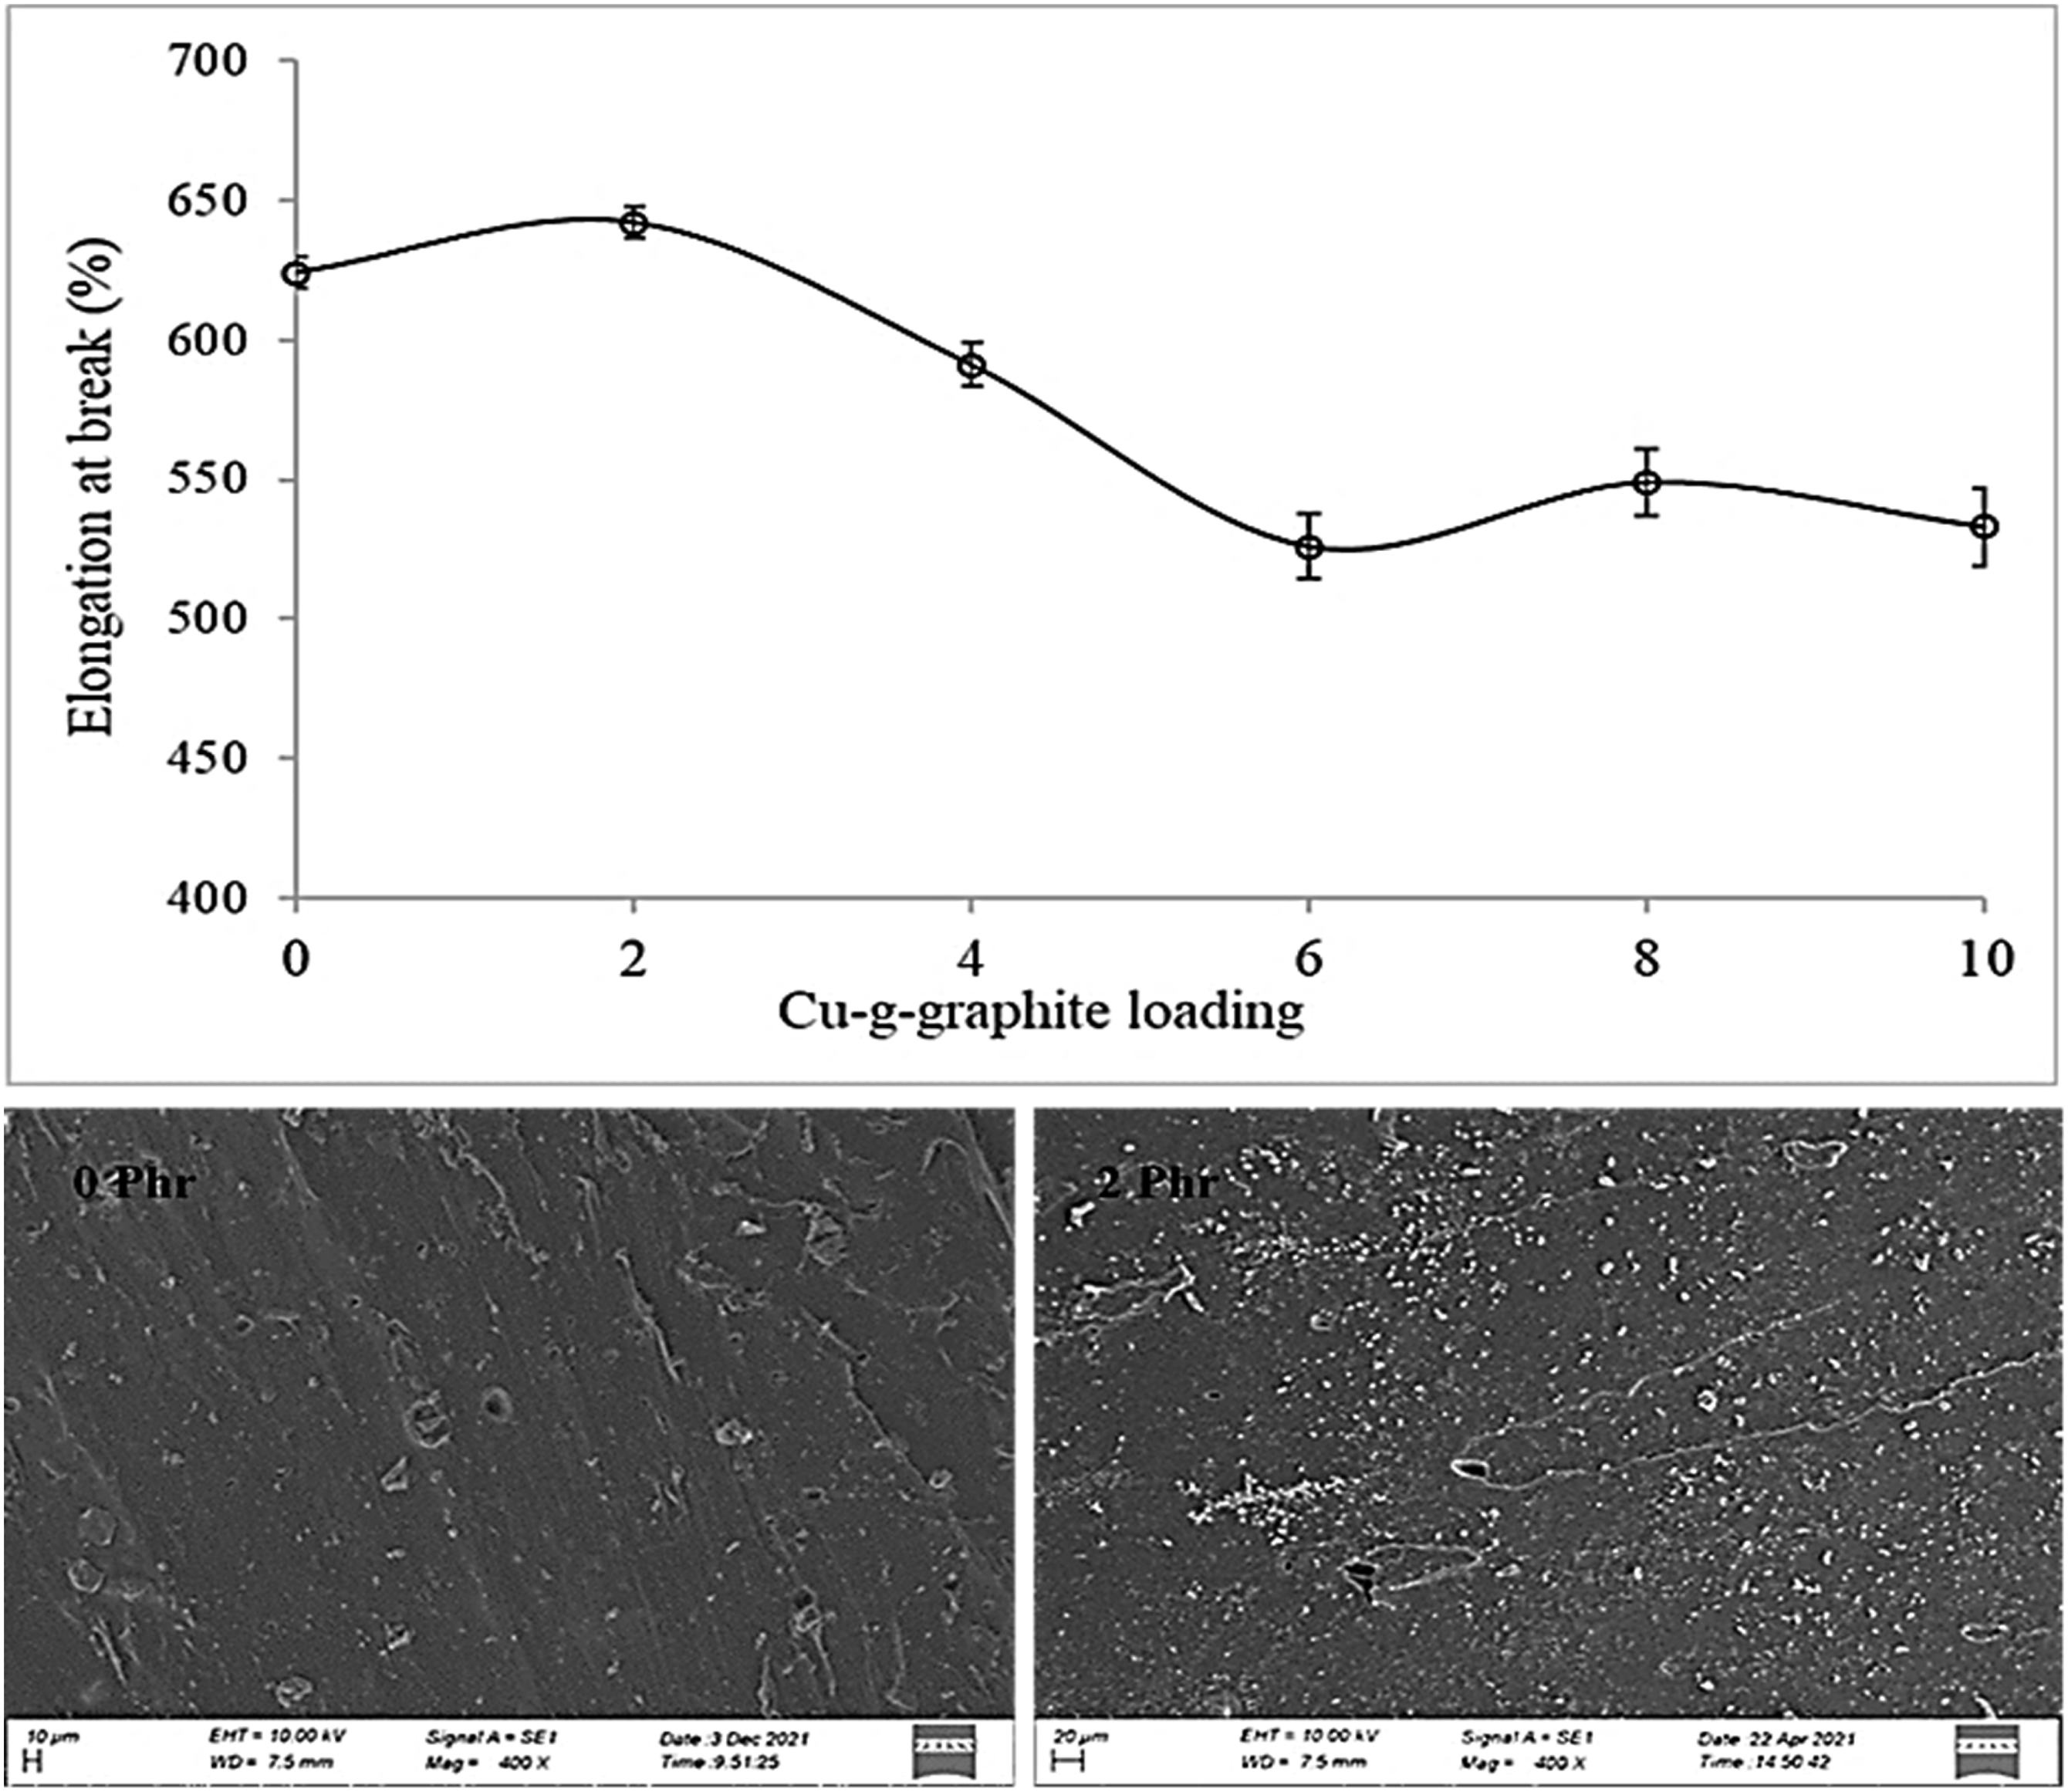
The resistance to initiate and propagate a crack is measured by tear strength. Tear strength of the composites has also varied in a cyclic pattern with the increase of Cu-g-graphite loading (Figure 10), however an increasing trend is observed. Tear strength of all NR composites prepared with Cu-g-graphite is higher than that of the control and may be due to existence of a strong interface between the NR matrix and Cu-g-graphite due to improved adhesion between the two materials. Tear strength of Cu-g-graphite composites is observed in the range 39 – 44 N/mm and do not show a significant variation. Alternatively, the control indicates the lowest tear strength due to the presence of weak surface boundaries and poor adhesion among the NR and other chemicals as observed from its morphology (Figure 10). Tear strength of Cu-g-graphite/NR composites.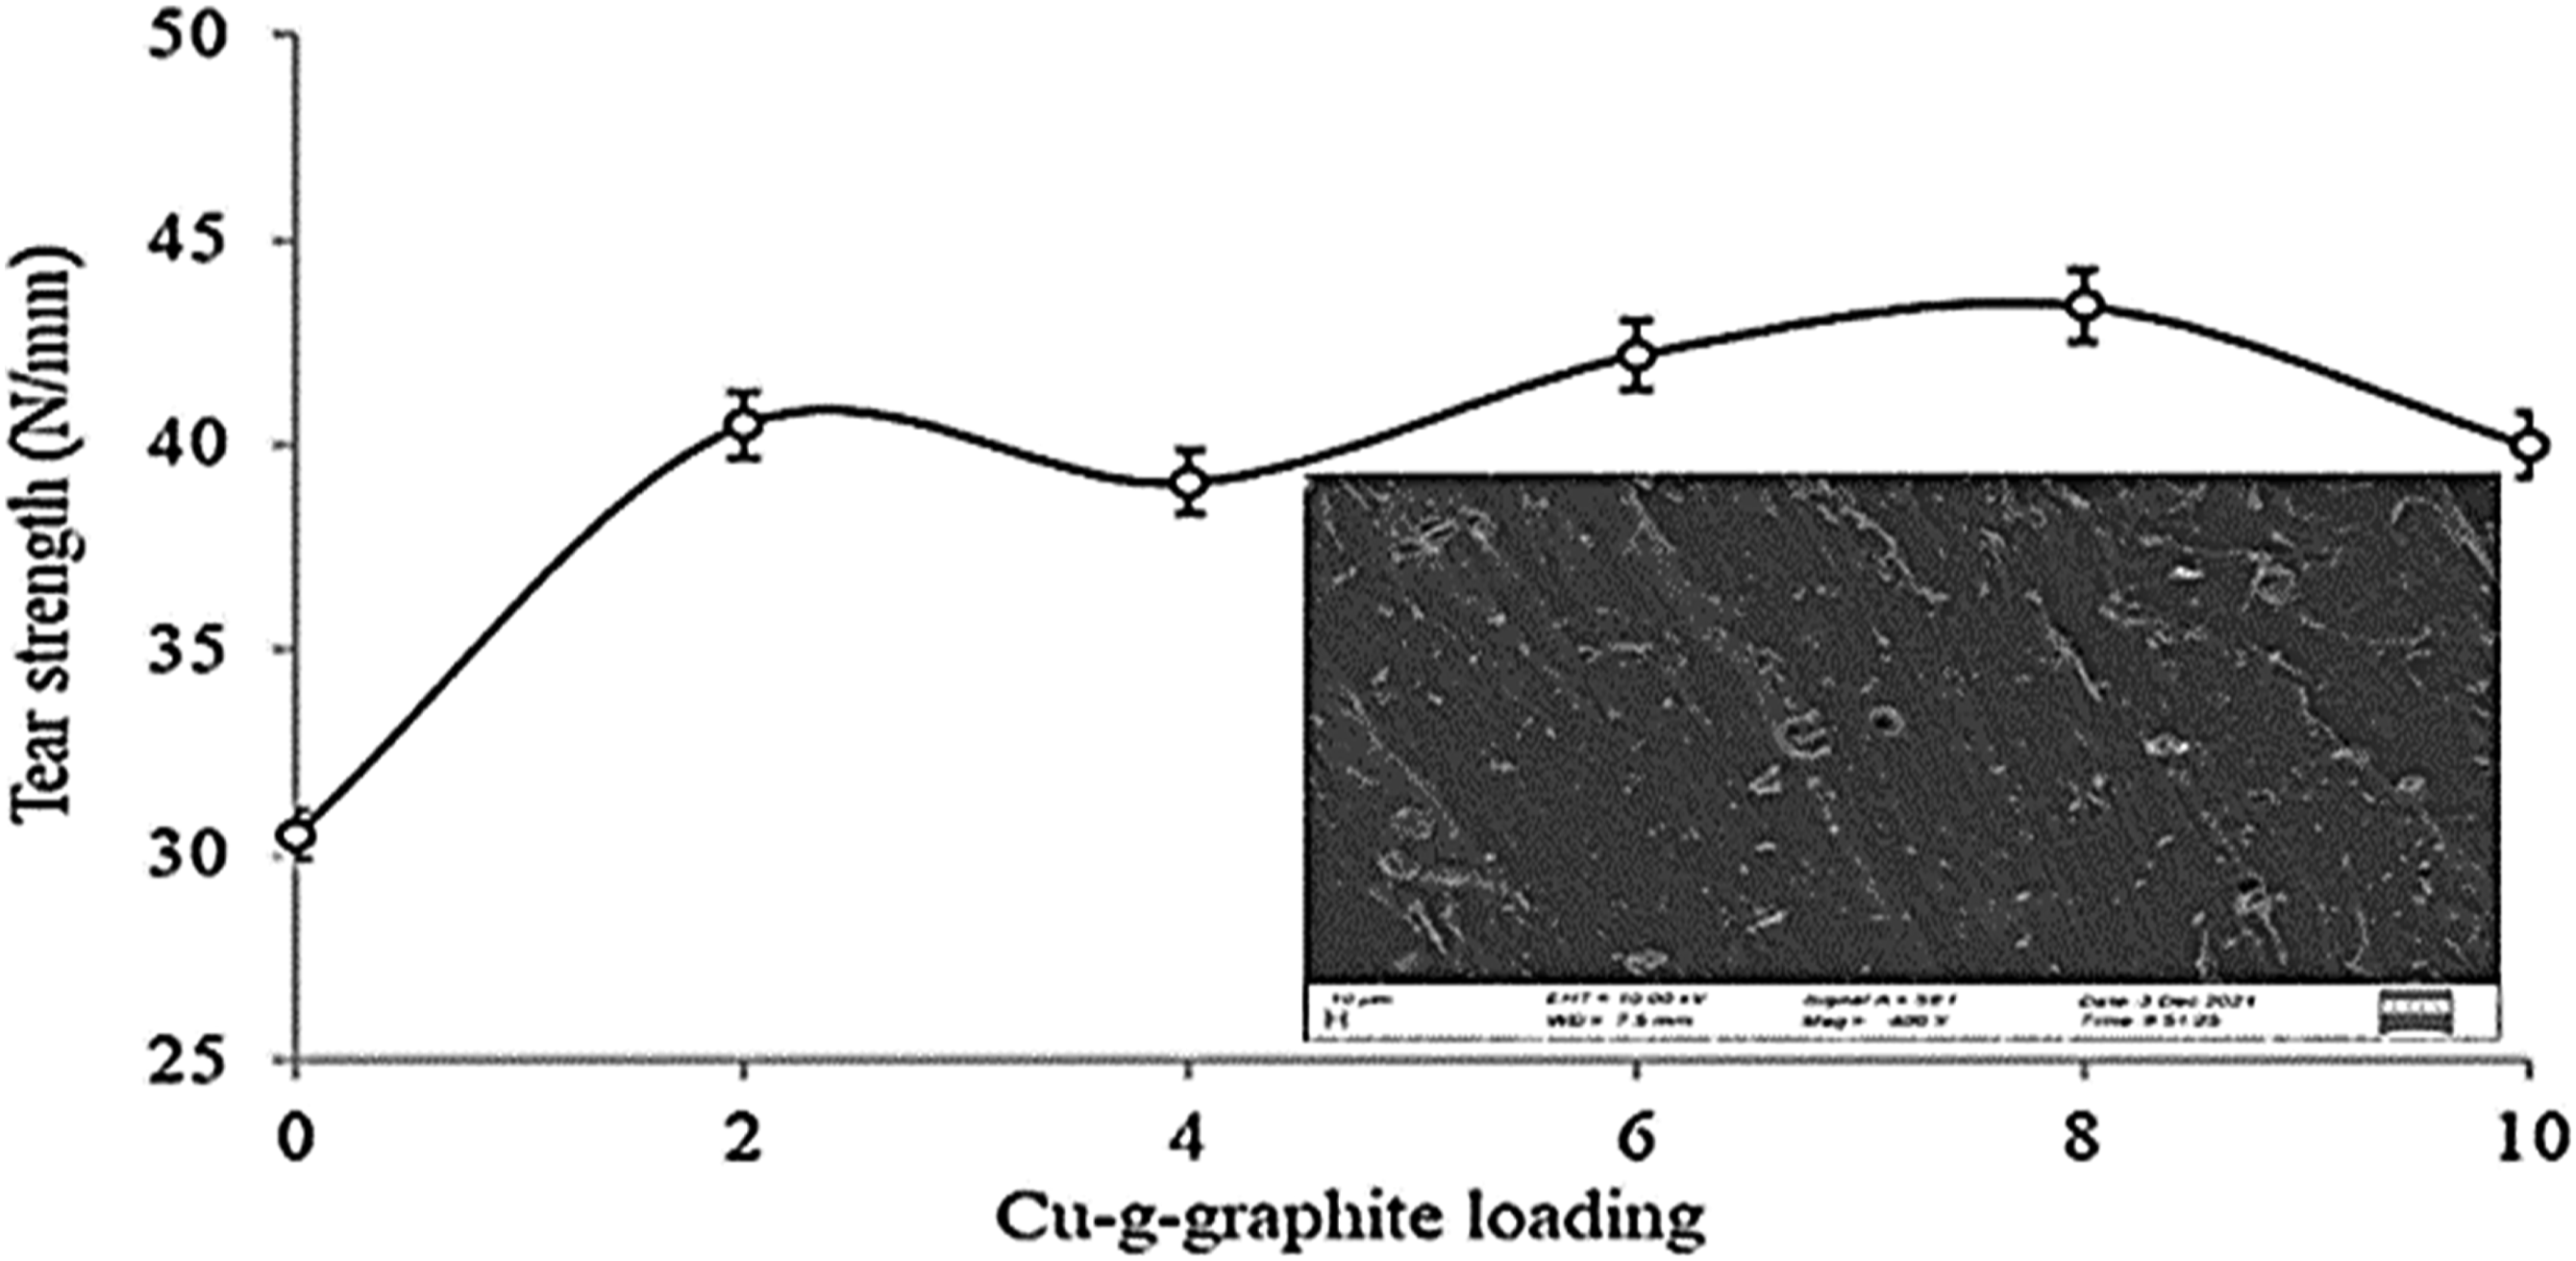
The resilience of a polymeric material emphasizes the flexibility and elastic behavior of a material. The control composite has indicated the highest resilience due to the absence of Cu-g-graphite as the filler material (Figure 11). There is no marked difference in resilience between the Cu-g-graphite composites and the control, however all the values are at a high level. The reason may be the high elastic nature represented by elongation at break values above 500%. Low hardness of the composites can also be attributed to the high resilience of the same Resilience of Cu-g-graphite/NR composites.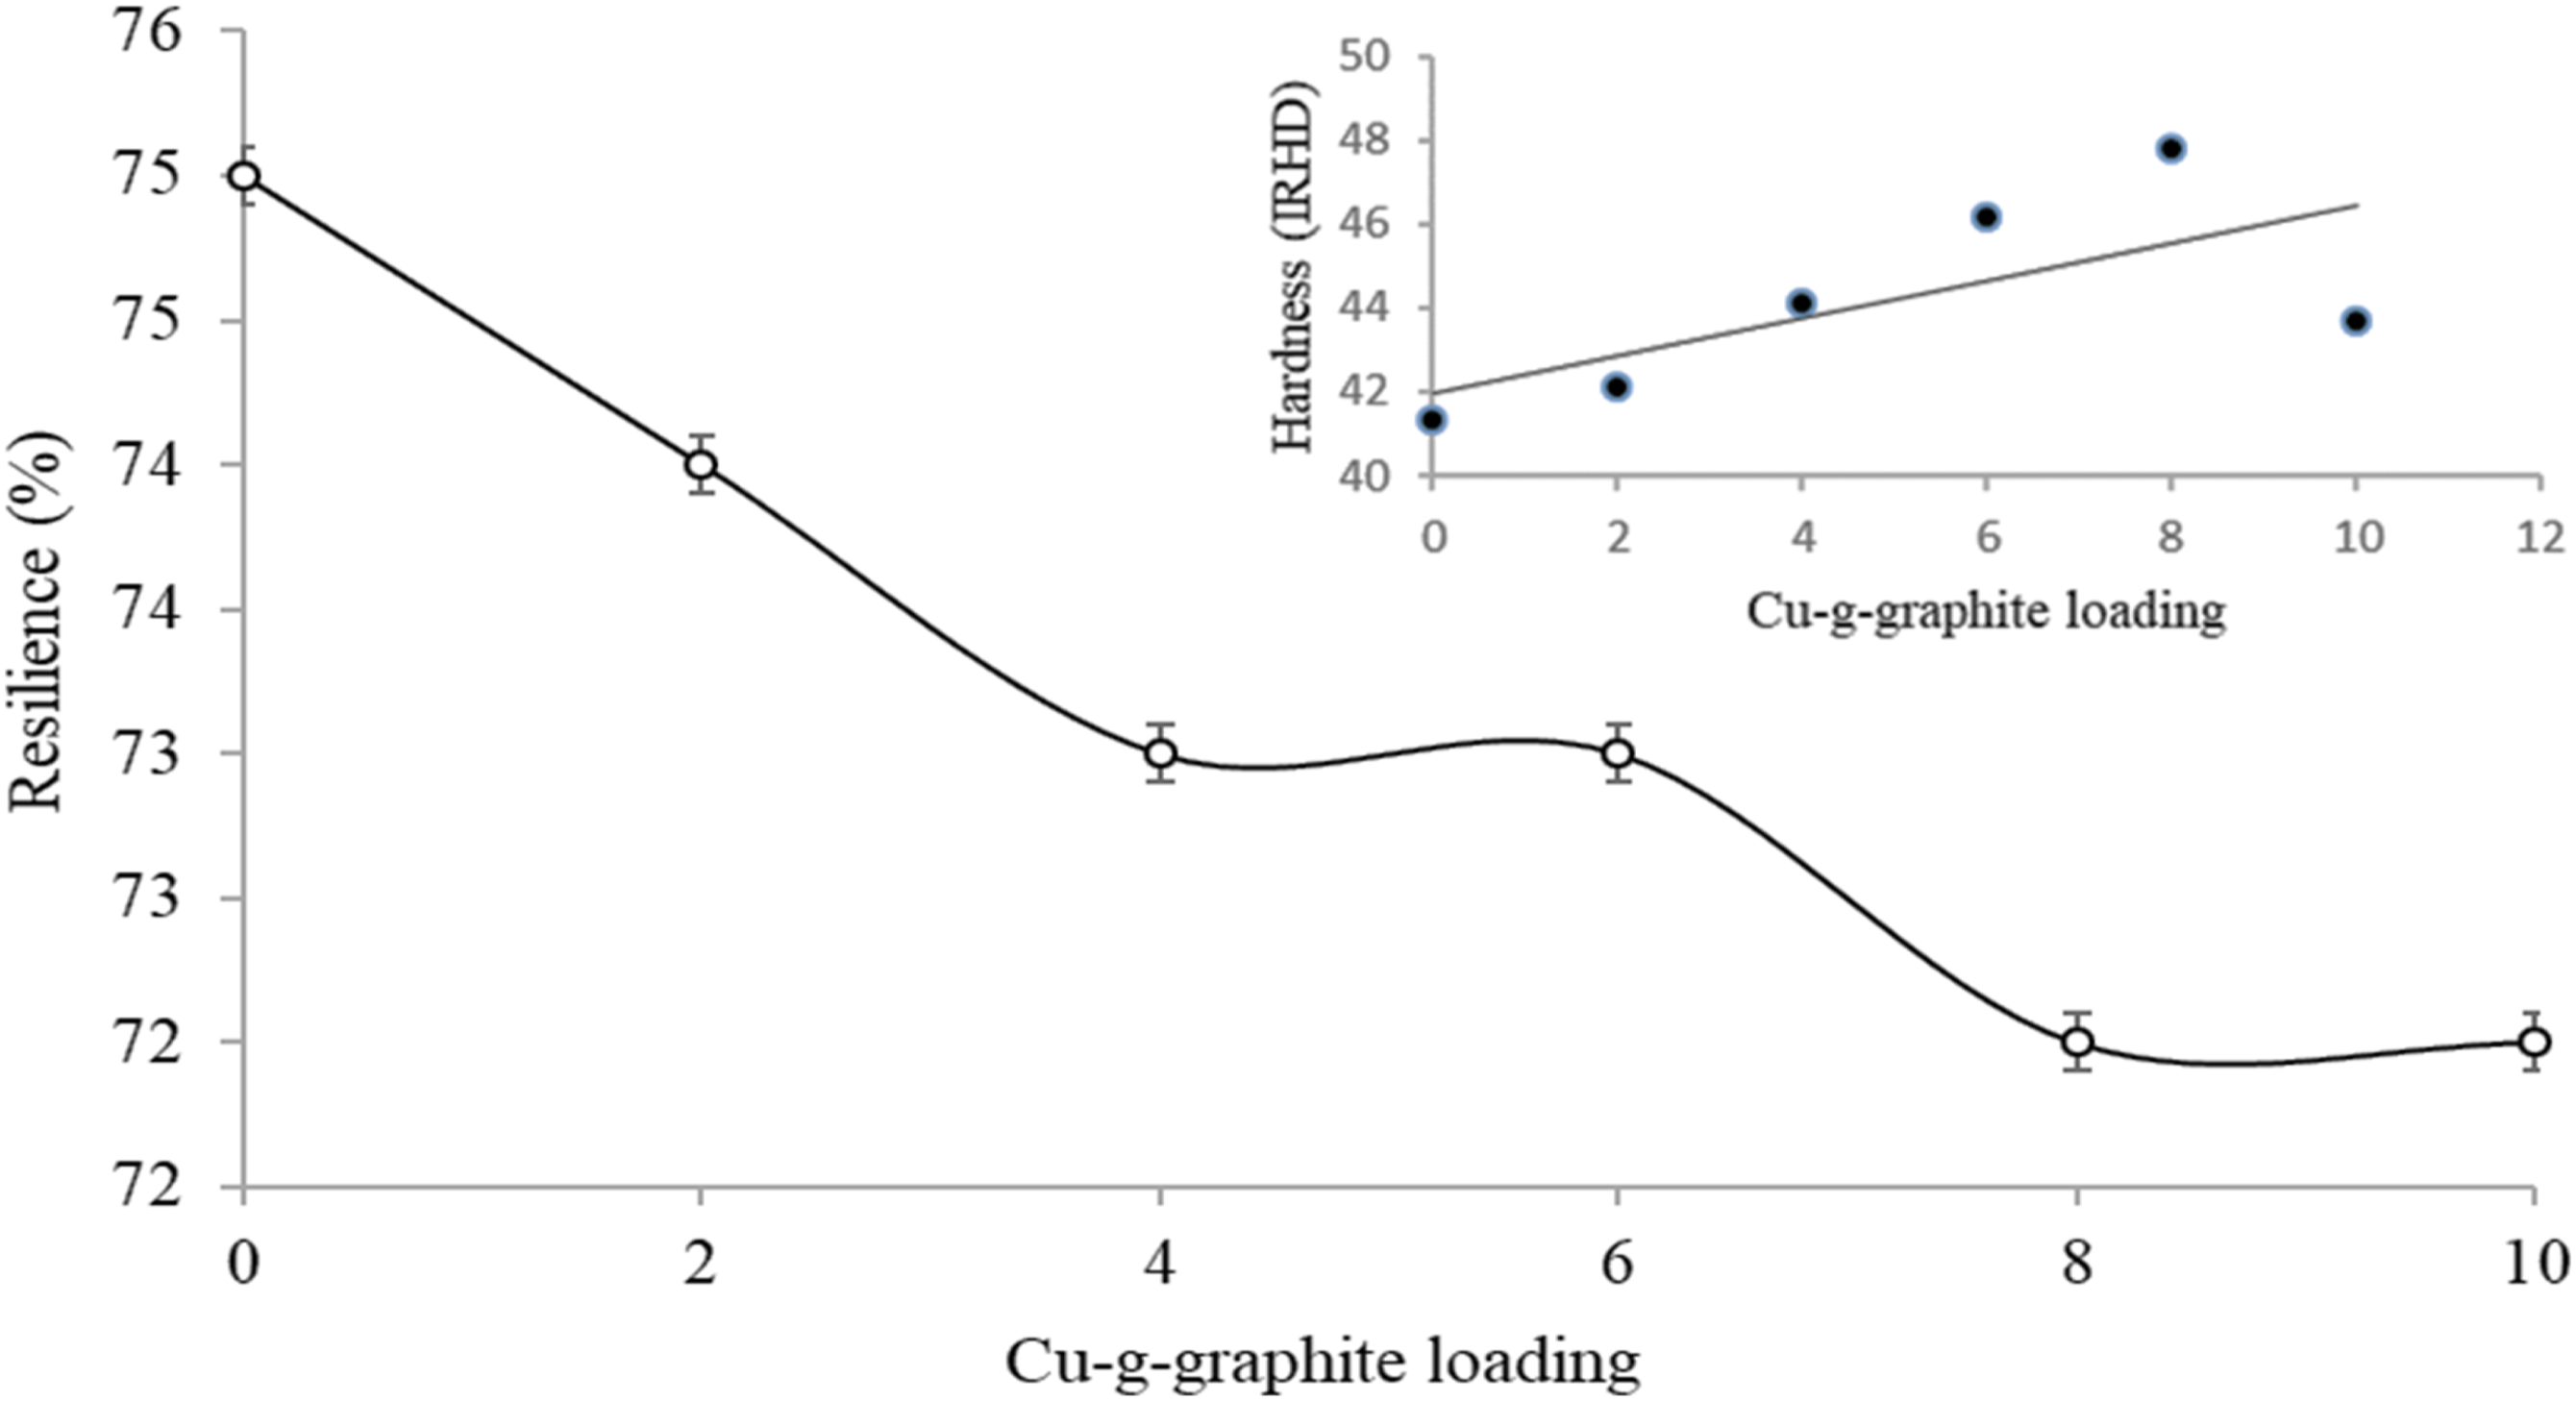
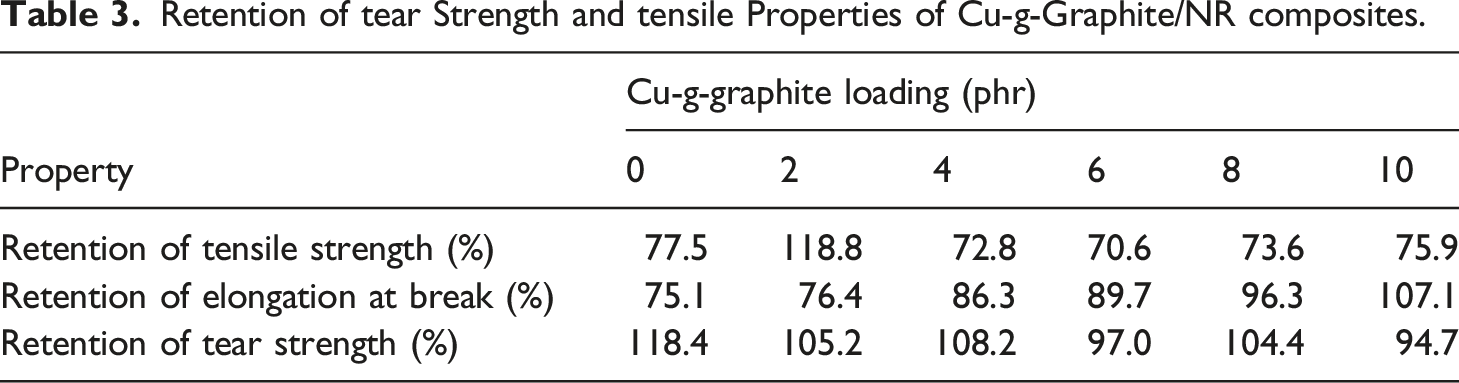
Tear strength and tensile properties of Cu-g-graphite/NR composites after ageing
Retention of tear Strength and tensile Properties of Cu-g-Graphite/NR composites.
Electrical conductivity of Cu-g-graphite/NR composites
Electrical conductivity of Cu-g-graphite filled NR composites varies from 0.258 to 99.2 µs/m as shown in Figure 12. The Figure 12 clearly illustrates that the electrical conductivity increases with the increase of Cu-g-graphite content. With the increase in filler loading, conductive networks gradually form and penetrate into the insulating polymeric matrix.
42
Huang et al, reported a similar observation for poly(ethylene glycol)-grafted graphene filled poly(lactic acid) nanocomposites.42,43 Cu-g-graphite has become considerably effective in enhancing the electrical conductivity of NR, as depicted in Figure 12. However, a significant variation could not be seen in the electrical conductivity of Cu-g-graphite filled NR composites between 4 to 10 phr loading.Hence, 4 phr loading of Cu-g-graphite would be sufficient to generate better electrical conductivity for NR composites. On the other hand, the control composite indicates higher electrical resistivity since NR is a high insulating material. As expected, variation of electrical resistivity of NR composites shows an opposite trend to that of electrical conductivity (Figure 12). Furthermore, the electrical conductivity of the 10 phr loaded Cu-g-graphite and NR composites is 9.92 x 10⁻⁵ and 2.58 x 10⁻⁷ Sm−1, respectively. Cu-g-graphite has improved the electrical conductivity of the composites by two orders of magnitude, owing to the uniform dispersion of Cu-g-graphite in the NR matrix. Electrical conductivity of Cu-g-graphite/NR composites.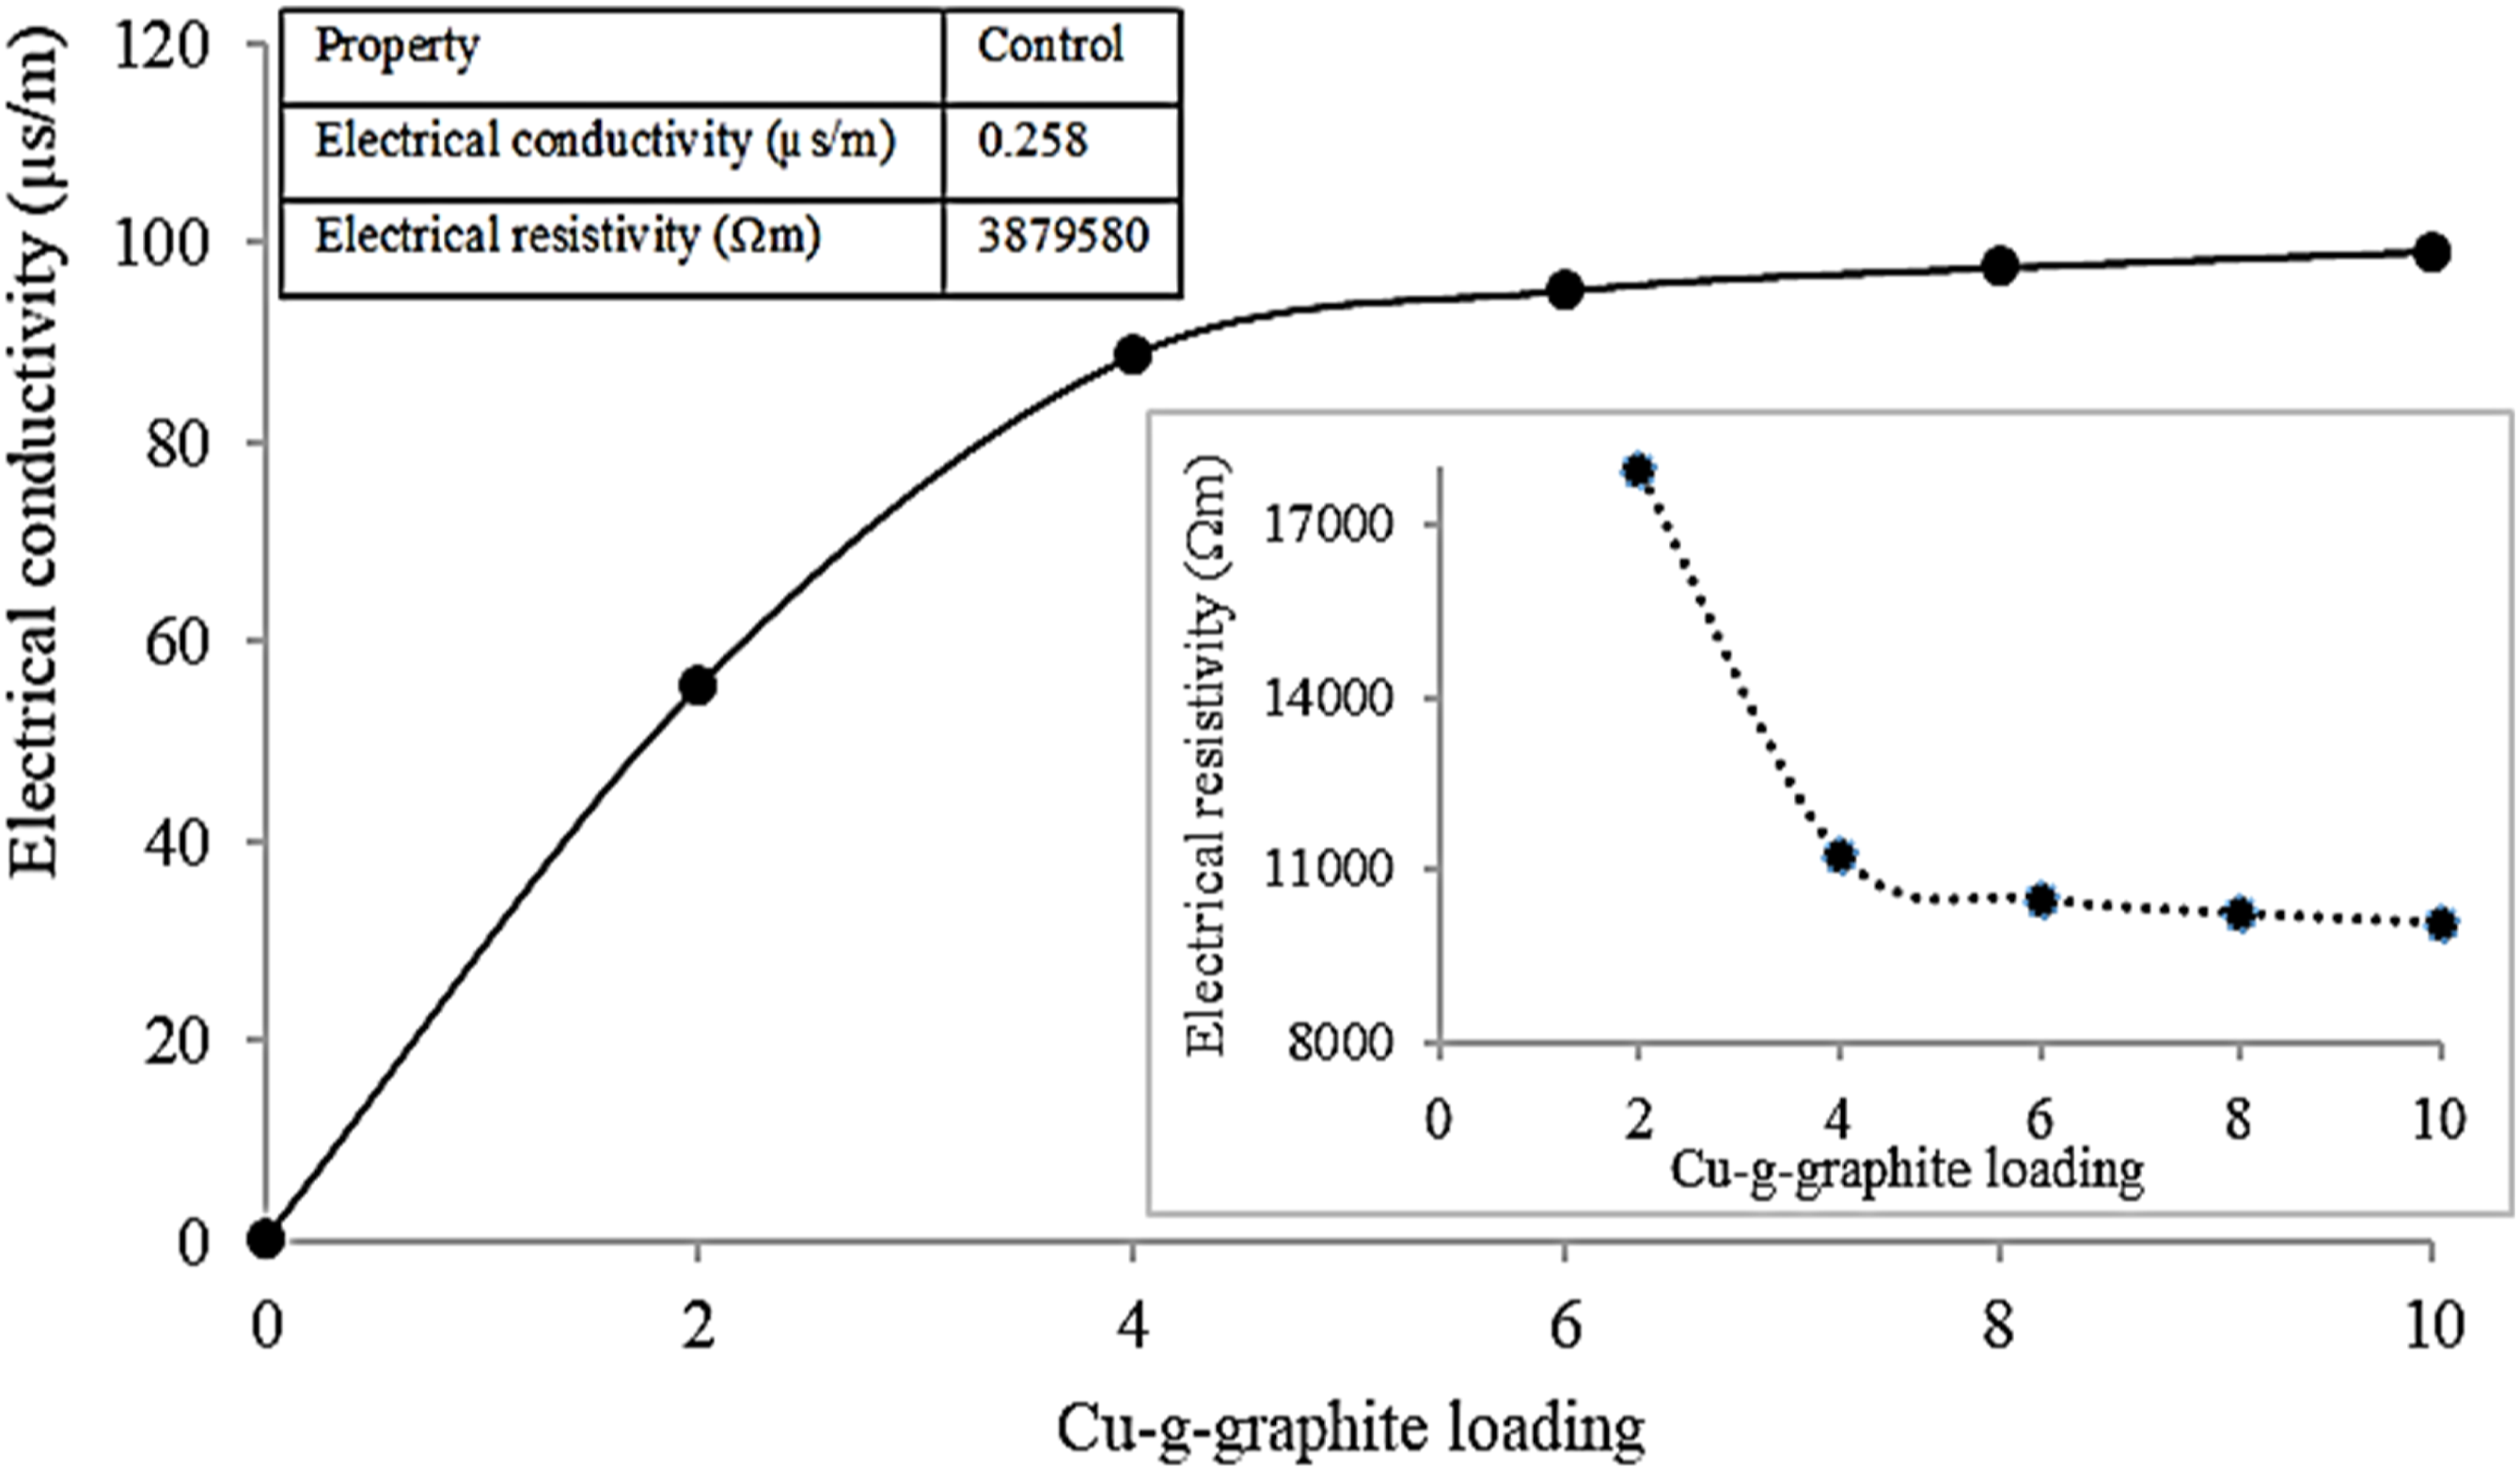
Conclusions
Cu-g-graphite was synthesized successfully according to a chemical reaction process. Transformation of graphite to Cu-g-graphite was confirmed by FTIR, XRD and TGA techniques and SEM analysis. The 8 phr Cu-g-graphite filled NR composite showed a better improvement of physico-mechanical properties in terms of hardness, modulus, tensile strength and tear strength. The composites prepared with Cu-g-graphite illustrated remarkable flexibility as the values of elongation at break and resilience. Further, retention of ageing properties of Cu-g-graphite filled NR composites after ageing was greater than 70%. Moreover, the Cu-g-graphite filled NR composites showed a remarkable improvement in electrical conductivity when compared to the control. Overall, the NR composite prepared with 8 phr loading of Cu-g-graphite exhibited moderate properties and hence it could be suitable for electrical conductive polymeric applications especially for polymer-based sensor applications.
Footnotes
Declaration of conflicting interests
The author(s) declared no potential conflicts of interest with respect to the research, authorship, and/or publication of this article.
Funding
The author(s) received no financial support for the research, authorship, and/or publication of this article.