
Abstract
Utilization of industrial by-products to develop novel value-added materials while mitigating their environmental impact is a crucial issue. Fly ash (FA) microparticles are a common component of power plant waste. This work aims to investigate the impact of varying concentrations of neat/silver-coated FA on the morphology and thermal properties of styrene-butadiene-styrene/FA composites. Composite materials based on styrene-butadiene styrene triblock copolymer (SBS) with various volume fractions of as-received and silver-coated FA were prepared using a solution mixing method. Silver-coated cenosphere particles were prepared using an electroless plating method. Scanning electron microscopy and optical microscopy showed that the solution mixing method obtains composite materials characterized by uniform dispersion of filler without large particle aggregates and predominantly unbroken cenospheres. The tensile strength of the composite with 10% of both as-received and silver-coated fly ash remains at the level of the unfilled SBS sample. However, at higher filler concentrations (20% and 30%), a decrease in strength by 27% and 42% respectively is observed, possibly due to the agglomeration of FA, which leads to a poorer interface and dispersion at higher filler weights. Additionally, thermal analysis in an oxygen atmosphere showed that the introduction of both as-received and metallized cenospheres in the same quantity increased the thermal stability of the tested composition. The temperatures at 5% mass loss of SBS/FA composites were on average 70°C higher than those of the original SBS.
Keywords
Introduction
The use of fillers in rubber and thermoplastic elastomer manufacturing processes is a widely used method for improving the properties of materials such as mechanical strength, thermal stability, and wear resistance. Moreover, it is important to reduce the cost of material production, when it is possible. For instance, to improve the elastomer properties, the following fillers are widely used according to literature data: carbon black, precipitated silica, calcium carbonate, kaolin, alumina trihydrate, montmorillonite clays, talc, mica, and wollastonite. 1 Apart from these fillers, the fly ash (FA) cenospheres can also be successfully used for reinforcing rubbers and to gain certain desirable features, e.g. oil resistance. 2
FA is the by-product from coal-fired power stations during the production of electricity and is generated globally on the order of millions of tons. Despite the desire to abandon coal-fired power plants as part of the transition to green energy, the reserves of already accumulated ash and slag waste are so vast that this resource for large-scale applications can be considered inexhaustible. Fly ash cenospheres are chemically inert 5-500 μm particles, which are obtained from FA by, for example, dry or wet separation techniques 3 and have unique properties such as low weight, hollow spherical shape, inertness, smooth surface, low thermal conductivity, high compressive strength, 4 and is less dense than water. 5 A broad application area of cenospheres is construction 6 (e.g. for reducing concrete unit weight, or as a component of thermal insulating bricks 7 ), a component in the aircraft/aerospace industry and as a polymer composite filler. Specifically, they could be introduced to another material for acoustic insulation, electromagnetic shielding, damping (e.g. for automobile brakes), etc. 8
Various researchers have previously studied applications of FA as a filler for construction materials: cement/concrete,9,10 ceramic, 11 and brick. 12 From the literature, it follows that FA as mineral filler could be used with different polymer matrices such as polystyrene, 13 polyester, 14 epoxy,15,16 polyethylene, 17 polypropylene,18,19 nylon, 20 and acrylonitrile butadiene styrene. 21 However, there is a lack of systematic studies with a focus on the usage of FA in elastomeric materials.
FA can be used as filler in different commercial products including rubber-based products. Reusing the FA in this manner is an efficient way to help prevent air pollution which takes place if such particles are released freely to the landfills when they are carried by wind and other weather factors into the surrounding area. 22
FA cenospheres and elastomers
Silicon Rubber and nitrile rubber. From the studies carried out by several authors23,24 it follows that a significant increase in the thermal stability of silicon rubber and nitrile rubber vulcanizate was recorded for vulcanizates filled with cenospheres compared to other mineral fillers.
Polyester thermoplastic elastomers
Sreekanth et al. 25 investigated the effects of FA concentrations on the properties of polyester thermoplastic elastomer, and it was found that the strength and elongation properties decreased with the addition of filler, while melting temperature, shear viscosity, and dielectric strength increased with filler concentration and reached a maximum at 30% FA mass. Particle size range influence in polyester-cenosphere composites was thoroughly discussed in the work of Cardoso, Shukla and Bose. 26 Here, about ∼100%-200% fracture toughness fracture increase was evidenced compared to neat polyester.
Chlorinated styrene butadiene
Ramesan 27 studied cure characteristics, mechanical properties, thermal stability, flame and oil resistance of polymer composite based on chlorinated and dichlorocarbene-modified styrene butadiene rubber (DCSBR) and different amounts of FA (10, 20, 30, 40 and 50 phr). It was shown that FA filler in dichlorocarbene-modified DCSBR polymer matrix improves thermal stability, flame, and oil resistance. Filler content up to 30 phr was estimated as the optimal filler concentration. In CSBR the mechanical features (tensile and tear strength, modulus, hardness and compression set) increase with filler content being optimal at 30 phr. 2 Elongation at break and resilience decreases with the loading of filler.
Polyurea elastomers
Qiao et al. 28 demonstrated that the uniform distribution of FA and good interface adhesion between FA and the polyurea elastomer matrix was obtained in the concentration range of FA up to 30%. It was found that the storage and loss moduli of the composites increased as the FA volume fraction increased.
Styrene triblock copolymer
Ren and Sancaktar 22 investigated the reinforcement efficiency of FA for partial replacement of carbon black and silica fillers in styrene-butadiene rubber compounds and it was shown that partial addition of up to 10 phr fly ash to rubber compounds resulted in the increase of elongation at fracture, adhesion to reinforcement steel cord, wet-grip, as well as lower rolling resistance.
Natural rubber
Composite films based on uncured natural rubber (NR) and coal fly ash (CFA) were recently obtained. 29 These authors concluded that the mechanical properties of composites were enhanced significantly at the filler content of 20 phr compared to neat NR. In addition, ternary composition based on elastomer, polyolefin and FA was described. Sombatsompop et al. 30 investigated the effect of FA concentration (up to 30 phr) on the properties of natural rubber (NR) and styrene–butadiene rubber (SBR) compounds. It was concluded that FA can be recommended as a filler for NR compounds due to the improved mechanical and rheological properties of rubbers.
Polyolefin elastomers
Yao et al. 5 developed a three-phase composite, based on polyolefin elastomer/fly ash/polypropylene, and it was shown that FA (concentration 5-20 phr) can be well dispersed in the composite and could improve their thermal stability and mechanical properties.
Epoxy resin syntactic foams get better compressive modules and improved modulus and strength in flexural mode. 31 Chaitanya and Rao 32 investigated tribological features of cenosphere-filled epoxy syntactic foams. The samples with a 40% cenosphere volume fraction exhibited optimal friction coefficient and wear rate.
Metal-covered FAC and elastomers
Other investigations were aimed at modifying cenospheres incorporating them into polymer matrix as functional fillers. Incorporation of metal-covered fly ash cenospheres as a filler into polymers allows the expansion of the application of polymers as a conductive material for electromagnetic shielding, and electronic and radar applications. 33 One could even change polymer properties from insulator to conductor by applying metal-coated cenospheres. 34 Fly ash cenospheres can be covered by various metals like copper, 35 cobalt, 36 and nickel. 37 The modified cenospheres are made by creating a metal layer on its surfaces by electroless coating. Electroless plating is one of the simplest methods for generating silver coatings on the surface of fly ash cenospheres and was previously described in the literature.38–41 Hu et al. 42 introduced silver-coated fly ash cenospheres to silicone rubber to form conductive composites, and conductivity was obtained as a function of strain.
In this work, composite materials based on styrene-butadiene-styrene triblock copolymer (SBS) with various volume fractions of native and silver-covered fly ash cenospheres were prepared by a solution mixing method. The effect of the concentration of the native and Ag-coated fly ash cenospheres was determined. The study included the estimation of structure, morphology, and thermal properties in comparison with those of neat SBS. Silver-coated cenosphere particles were prepared by an electroless plating method. According to the literature data described above, the maximum concentration of fly ash cenospheres was set as 30%. The investigation of peculiarities of the solution method for CS/Ag-coating systems will elucidate its further applications and the prospects of similar CS/Me-coating systems. Because compounding of SBS and FA with a standard rotation mixer crashed a significant amount of FA and induced filler agglomeration, we used a solution technique for composite preparation.
Experimental
Materials
The radial styrene-butadiene styrene triblock copolymer (SBS) was used as a polymer matrix. SBS (grade SBS R 3000A) was supplied by Sibur, Russia. (styrene/butadiene ratio of 30/70, MFR <1 g/10 min (200°C, 5 kg). SBS R 3000A is commonly used for bitumen and plastic modification, shoe compounds, rubber goods and protective coatings. Figure 1 Chemical structure of styrene-butadiene-styrene copolymer (SBS).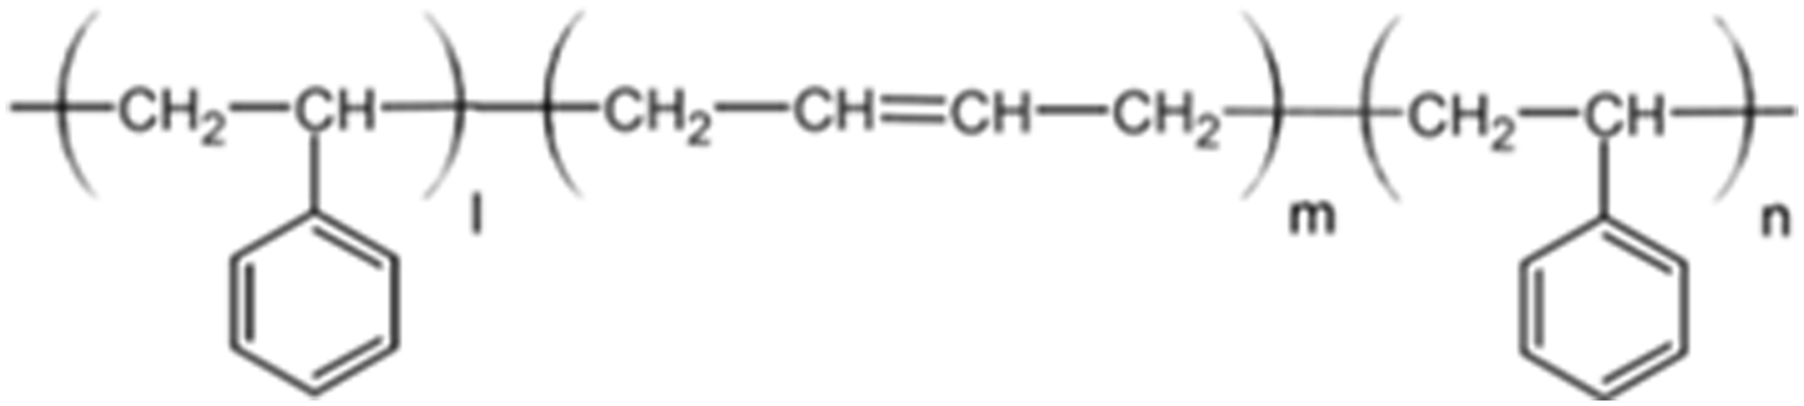
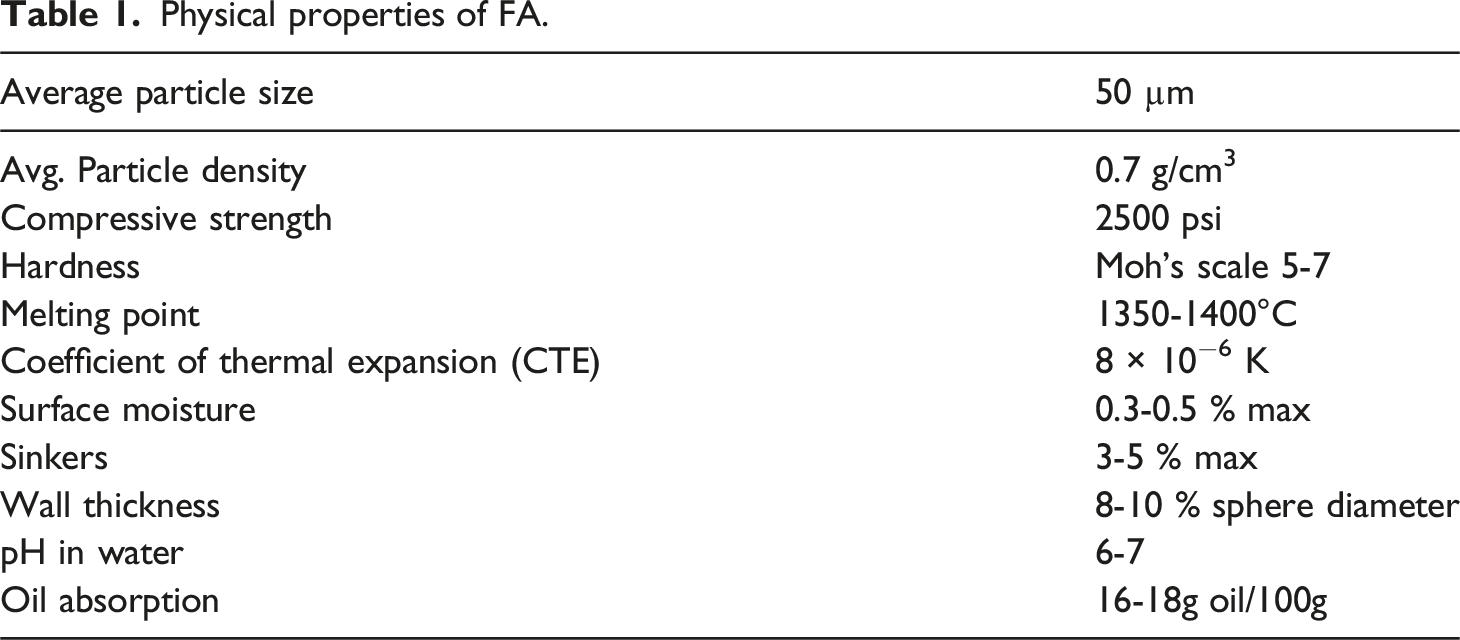
Physical properties of FA.
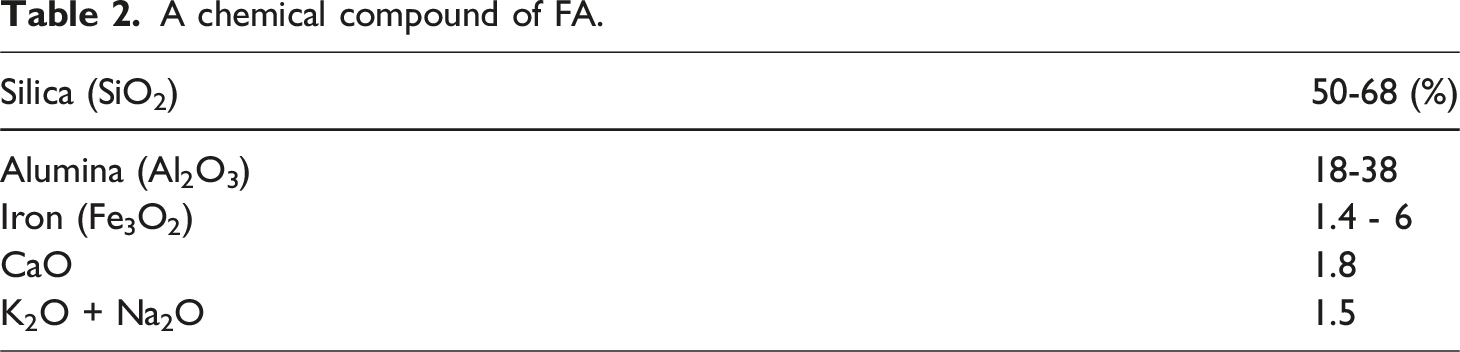
A chemical compound of FA.
Fly ash cenospheres (FA) were coated with silver by the electroless method as described by Cao and Zhang. 40
The chemicals used for the electroless Ag-coating of cenospheres particles included AgNO3 (99.9+%), NaOH (99.3%), HCHO (37 wt%), C2H5OH (99.9%), and NH4OH (28.0–30.0% NH3), which were of analytical grade. Deionized water was used throughout the work.
Compounding
SBS/FA composites were prepared by incorporating various amounts of FA (10, 20, 30 w/w%) using the solution blending compounding method. Silver-coated FA were dispersed in the elastomer matrix at an amount of 10 w/w%. A total of 43.2 g of SBS was swelled in 300 mL of toluene (analytical reagent grade) for 24 h at room temperature. FA was added to the SBS-toluene solution and stirred at 200 r/min for 60 min. The SBS/FA solutions were cast into a glass Petri dish. The solvent was then evaporated at 25°C until a constant weight was obtained Figure 2. Digital image of SBS/FA-10, SBS/FA-20, SBS/FA-30.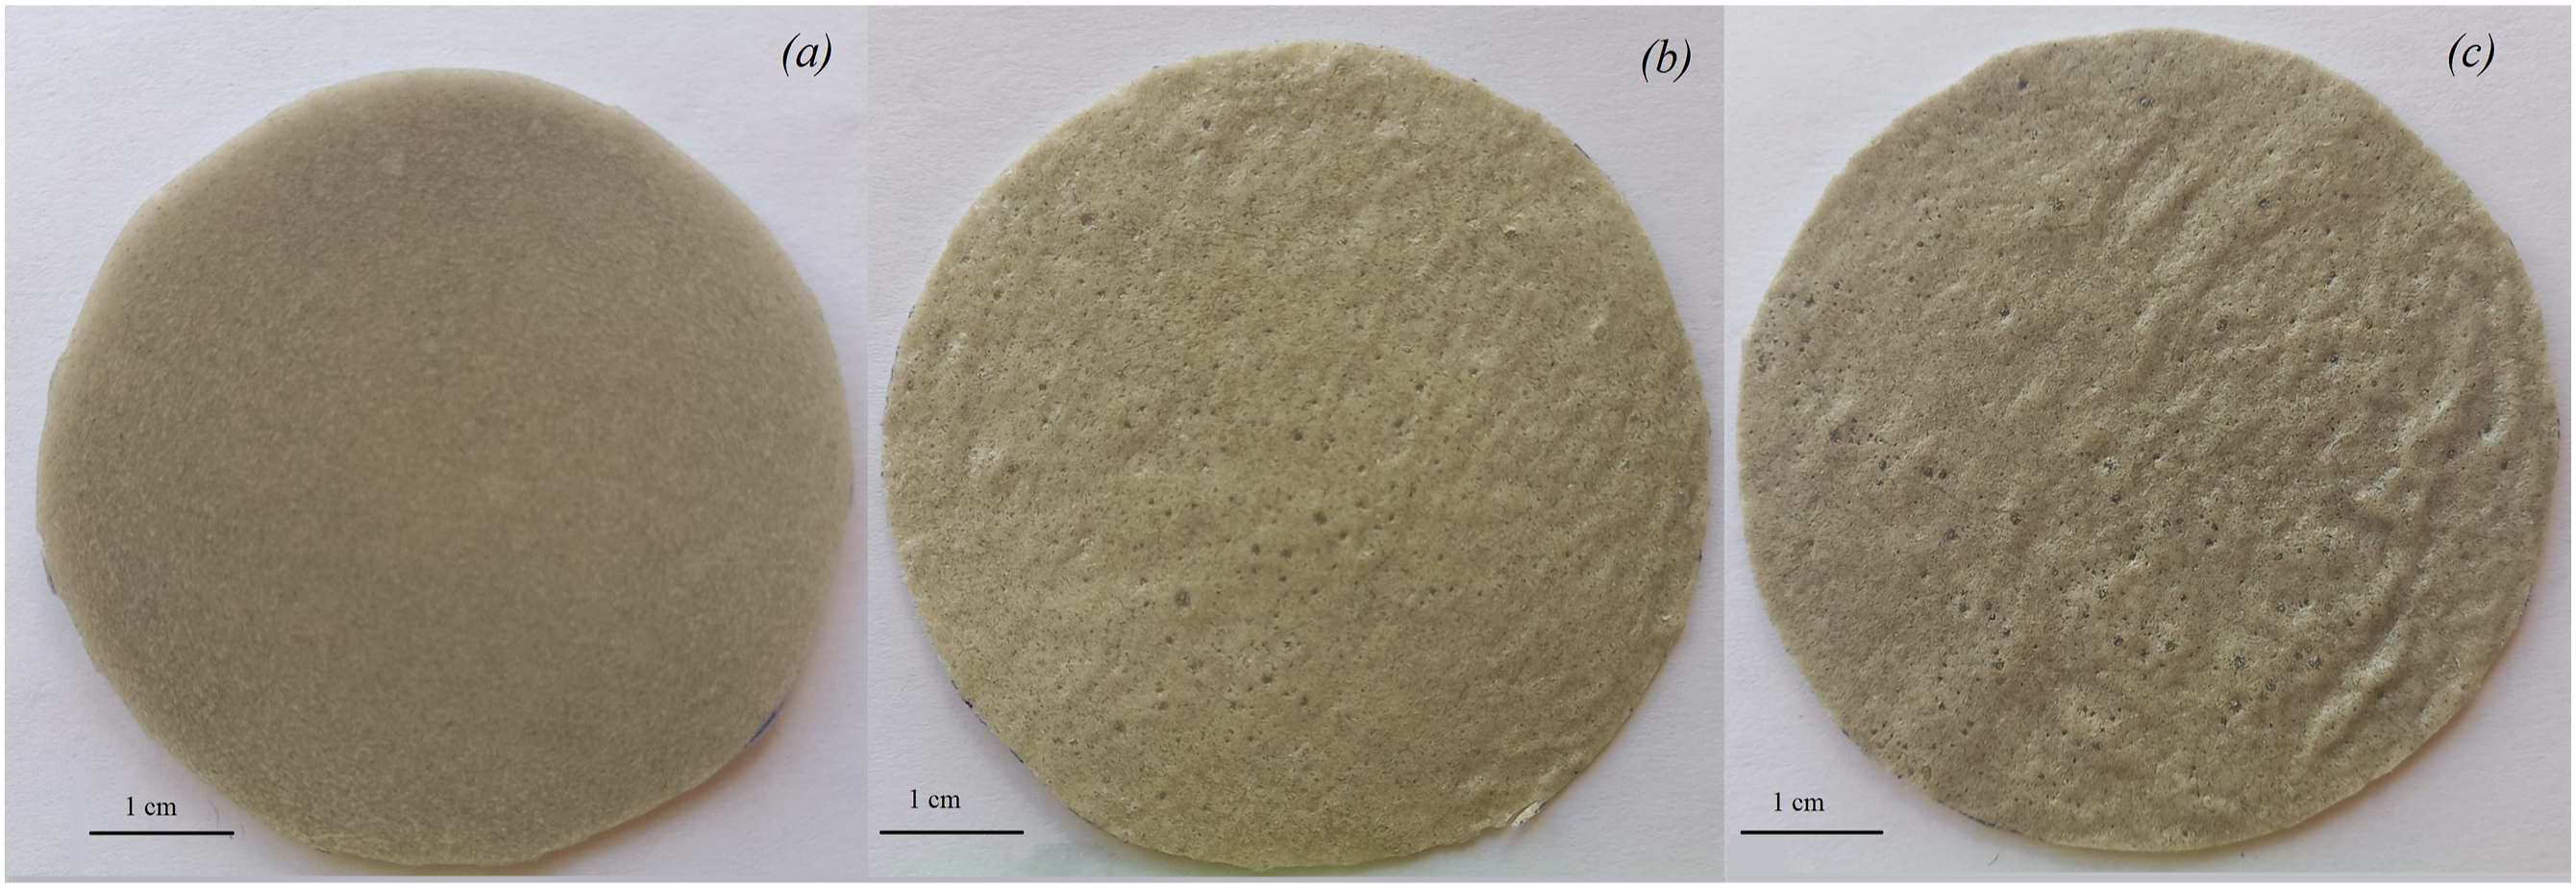
Scanning electron microscopy (SEM)
The structure of neat cenospheres as well as cenospheres covered with silver and composites based on SBS with different amounts of cenospheres were investigated by a scanning electron microscope Tescan Vega 3 (Czech Republic) with a thermo-emission tungsten cathode. The results were operated using the TESCAN Essence™ software. The elemental analysis of the SBS/FA films was conducted using X-Act Oxford Instruments EDX equipment. To obtain high-quality images, platinum was sputter-coated onto the sample surfaces using a Joel JFC-1600 magnetron sputtering system, with an estimated coating thickness of 20 nm.
Optical microscopy
Optical photographs of the SBS/FA composites were obtained by Olympus BX43 optical microscope (Tokyo, Japan) in transmission mode.
Thermogravimetric analysis
The thermal stability of samples was investigated through thermogravimetric analysis (TGA) on a thermal analyzer Mettler Toledo TGA/DSC3+ (Mettler Toledo, Switzerland). Each sample was heated from 25°C to 800°C at a rate of 10°C/min. The weight of the sample was 4-5 mg.
FT-IR spectroscopy
The chemical composition of SBS/FA composites was studied using an FT-IR Lumos BRUKER (Berlin, Germany) spectrometer at a temperature of (22 ± 2) °C in the range of wavenumbers of 4000 ≤ ν ≤ 600 cm−1 using the ATR method (diamond crystal).
Electronic paramagnetic resonance
EPR spectra were obtained on an automated EPR-V spectrometer (Semenov Federal Research Center for Chemical Physics, RAS, Moscow, Russia). The experiment was performed at a temperature of 22°C; modulation amplitude <0.5 G; microwave power 2.1 mW; a sweep width of 100 G and 1024 points recorded. 2,2,6,6-tetramethylpiperidine-1-oxyl (TEMPO) was chosen as a spin probe. The concentration of radiсal was not more than 1 × 10⁻³ mol·dm−3. The TEMPO, which was initially in the vapor phase, was then introduced into the sample at a temperature of 30°C. The EPR spectra data was obtained with no saturation, which was verified by the dependence of the signal intensity on the power of the microwave field. The character of probe rotation correlation time was found. The equation, which includes the width (from peak to peak) of the low-field spectral component (∆H+1) and I±1 – intensities of high (low) field components is:
The uncertainty of the experiment was ±7%. To perform the mathematical treatment of the data the WINEPR and SIMFONIA (Bruker) software were used.
Density
Density measurements of neat SBS and composites were conducted according to ASTM D792-08, using a single-pan electronic weighing balance using equation (2)
Raman spectroscopy
The spectra were obtained using a Raman Station 400F spectrometer (PerkinElmer, USA) with a 785 nm laser wavelength. The probes were a small amount of spheres wetted with a drop of distilled water and put on the stainless steel plate.
Mechanical properties
The examination of tensile strength properties was conducted using a GOTECH testing machine (Turkey) at a testing rate of 200 mm/min. Samples were prepared in the form of strips measuring 7 cm × 1 cm. Each data point was confirmed with five measurements.
Results and discussion
Morphology of filler dispersion
SEM images of initial cenospheres and cenospheres covered with silver are presented in Figure 3. SEM pictures of electroless Ag-coated cenosphere at different magnifications.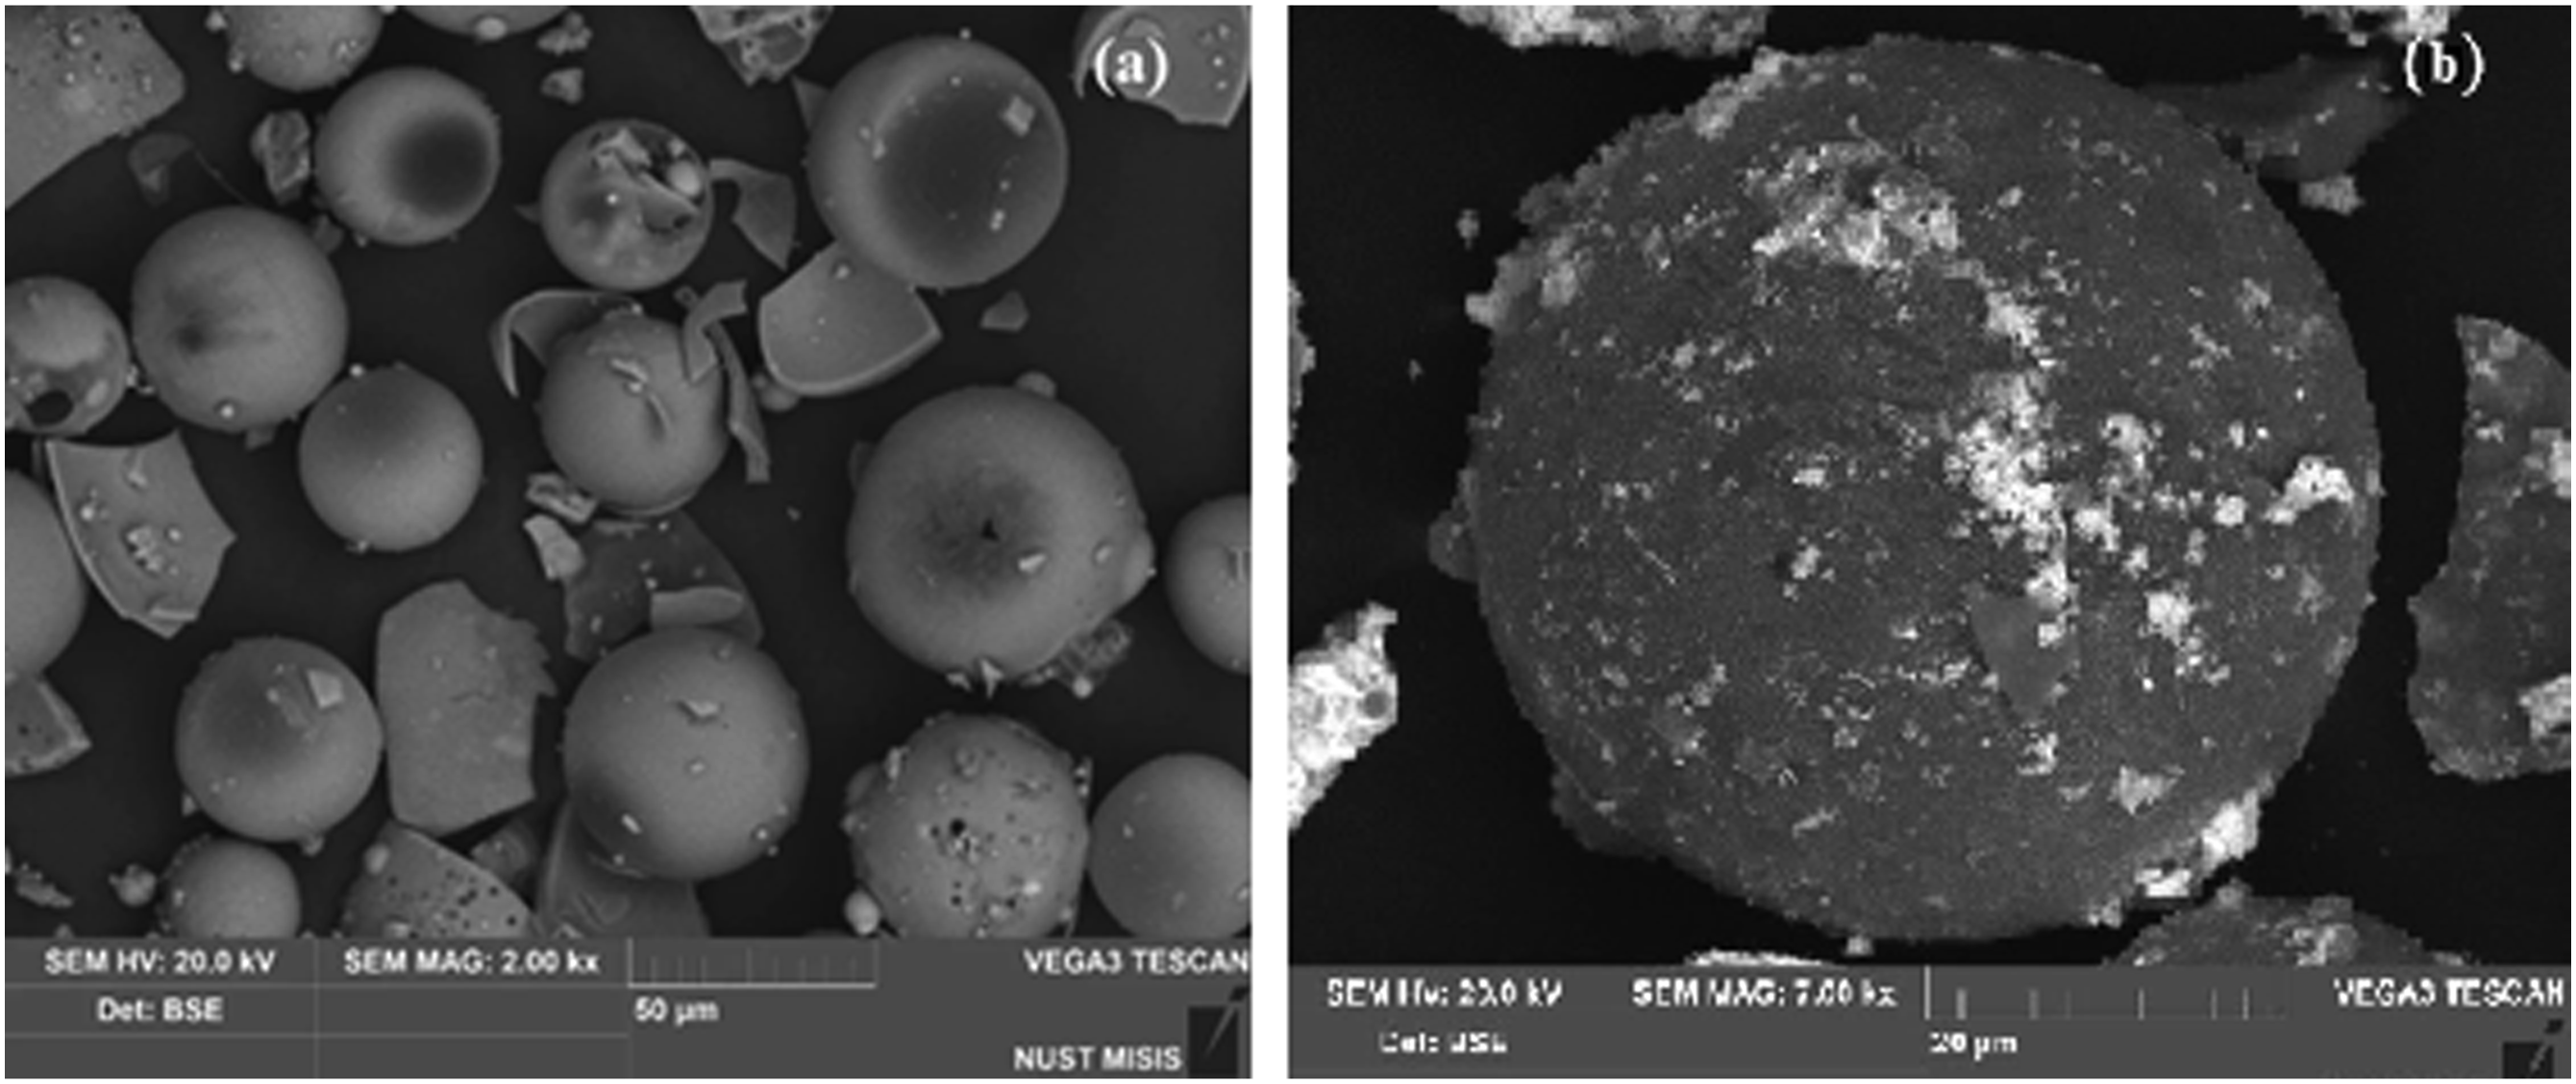
The powder of cenospheres is represented mainly by particles of a regular spherical shape with a smooth surface and a small amount of irregularly shaped fragments, as shown in Figure 3(a). The particle size approximately ranges from 50 μm to 60 μm. Ag-coated cenospheres, fabricated via electroless silver plating, display an integrated silver layer, as shown in Figure 3(b). The presence of silver Ag (M = 108 g/mol) particles deposited on the surface of cenospheres (Si, Al, O with M = 28, 27, 16 respectively) are visible because of their lighter shade of gray in the back-scattered electron mode of SEM (materials with a higher average atomic weight compared to lower typically appear lighter).
Figure 4 shows Raman spectra of pure cenospheres and silver-coater cenospheres. The spectra of pure cenospheres show a wide peak centered at 1346 cm−1 and a broad peak centered at 1530 cm−1. Both peaks are observed with the background of strong fluorescence typical for most samples. The spectra of silver-coated cenospheres have two narrow peaks at 244 cm−1 and 1047 cm−1. The peak at 1047 cm−1 may refer to CO2 adsorbed at the oxidized silver surface, as was noted earlier
43
the strong peak in the range of 240-250 cm−1 is characteristic of silver nanoparticles either in colloidal solution or deposited on SiO2 spheres as stated in previous studies.44,45 As for the neat fly ash, a similar Raman spectrum for neat cenospheres was presented by Guedes et al.
46
based on power plant particles. It has peaks at 1300 cm⁻1 and 1600 cm⁻1 very close to those shown in Figure 4. Similar peaks were obtained in the work of Ref. 47. Raman spectra of neat cenospheres and silver-coated cenospheres.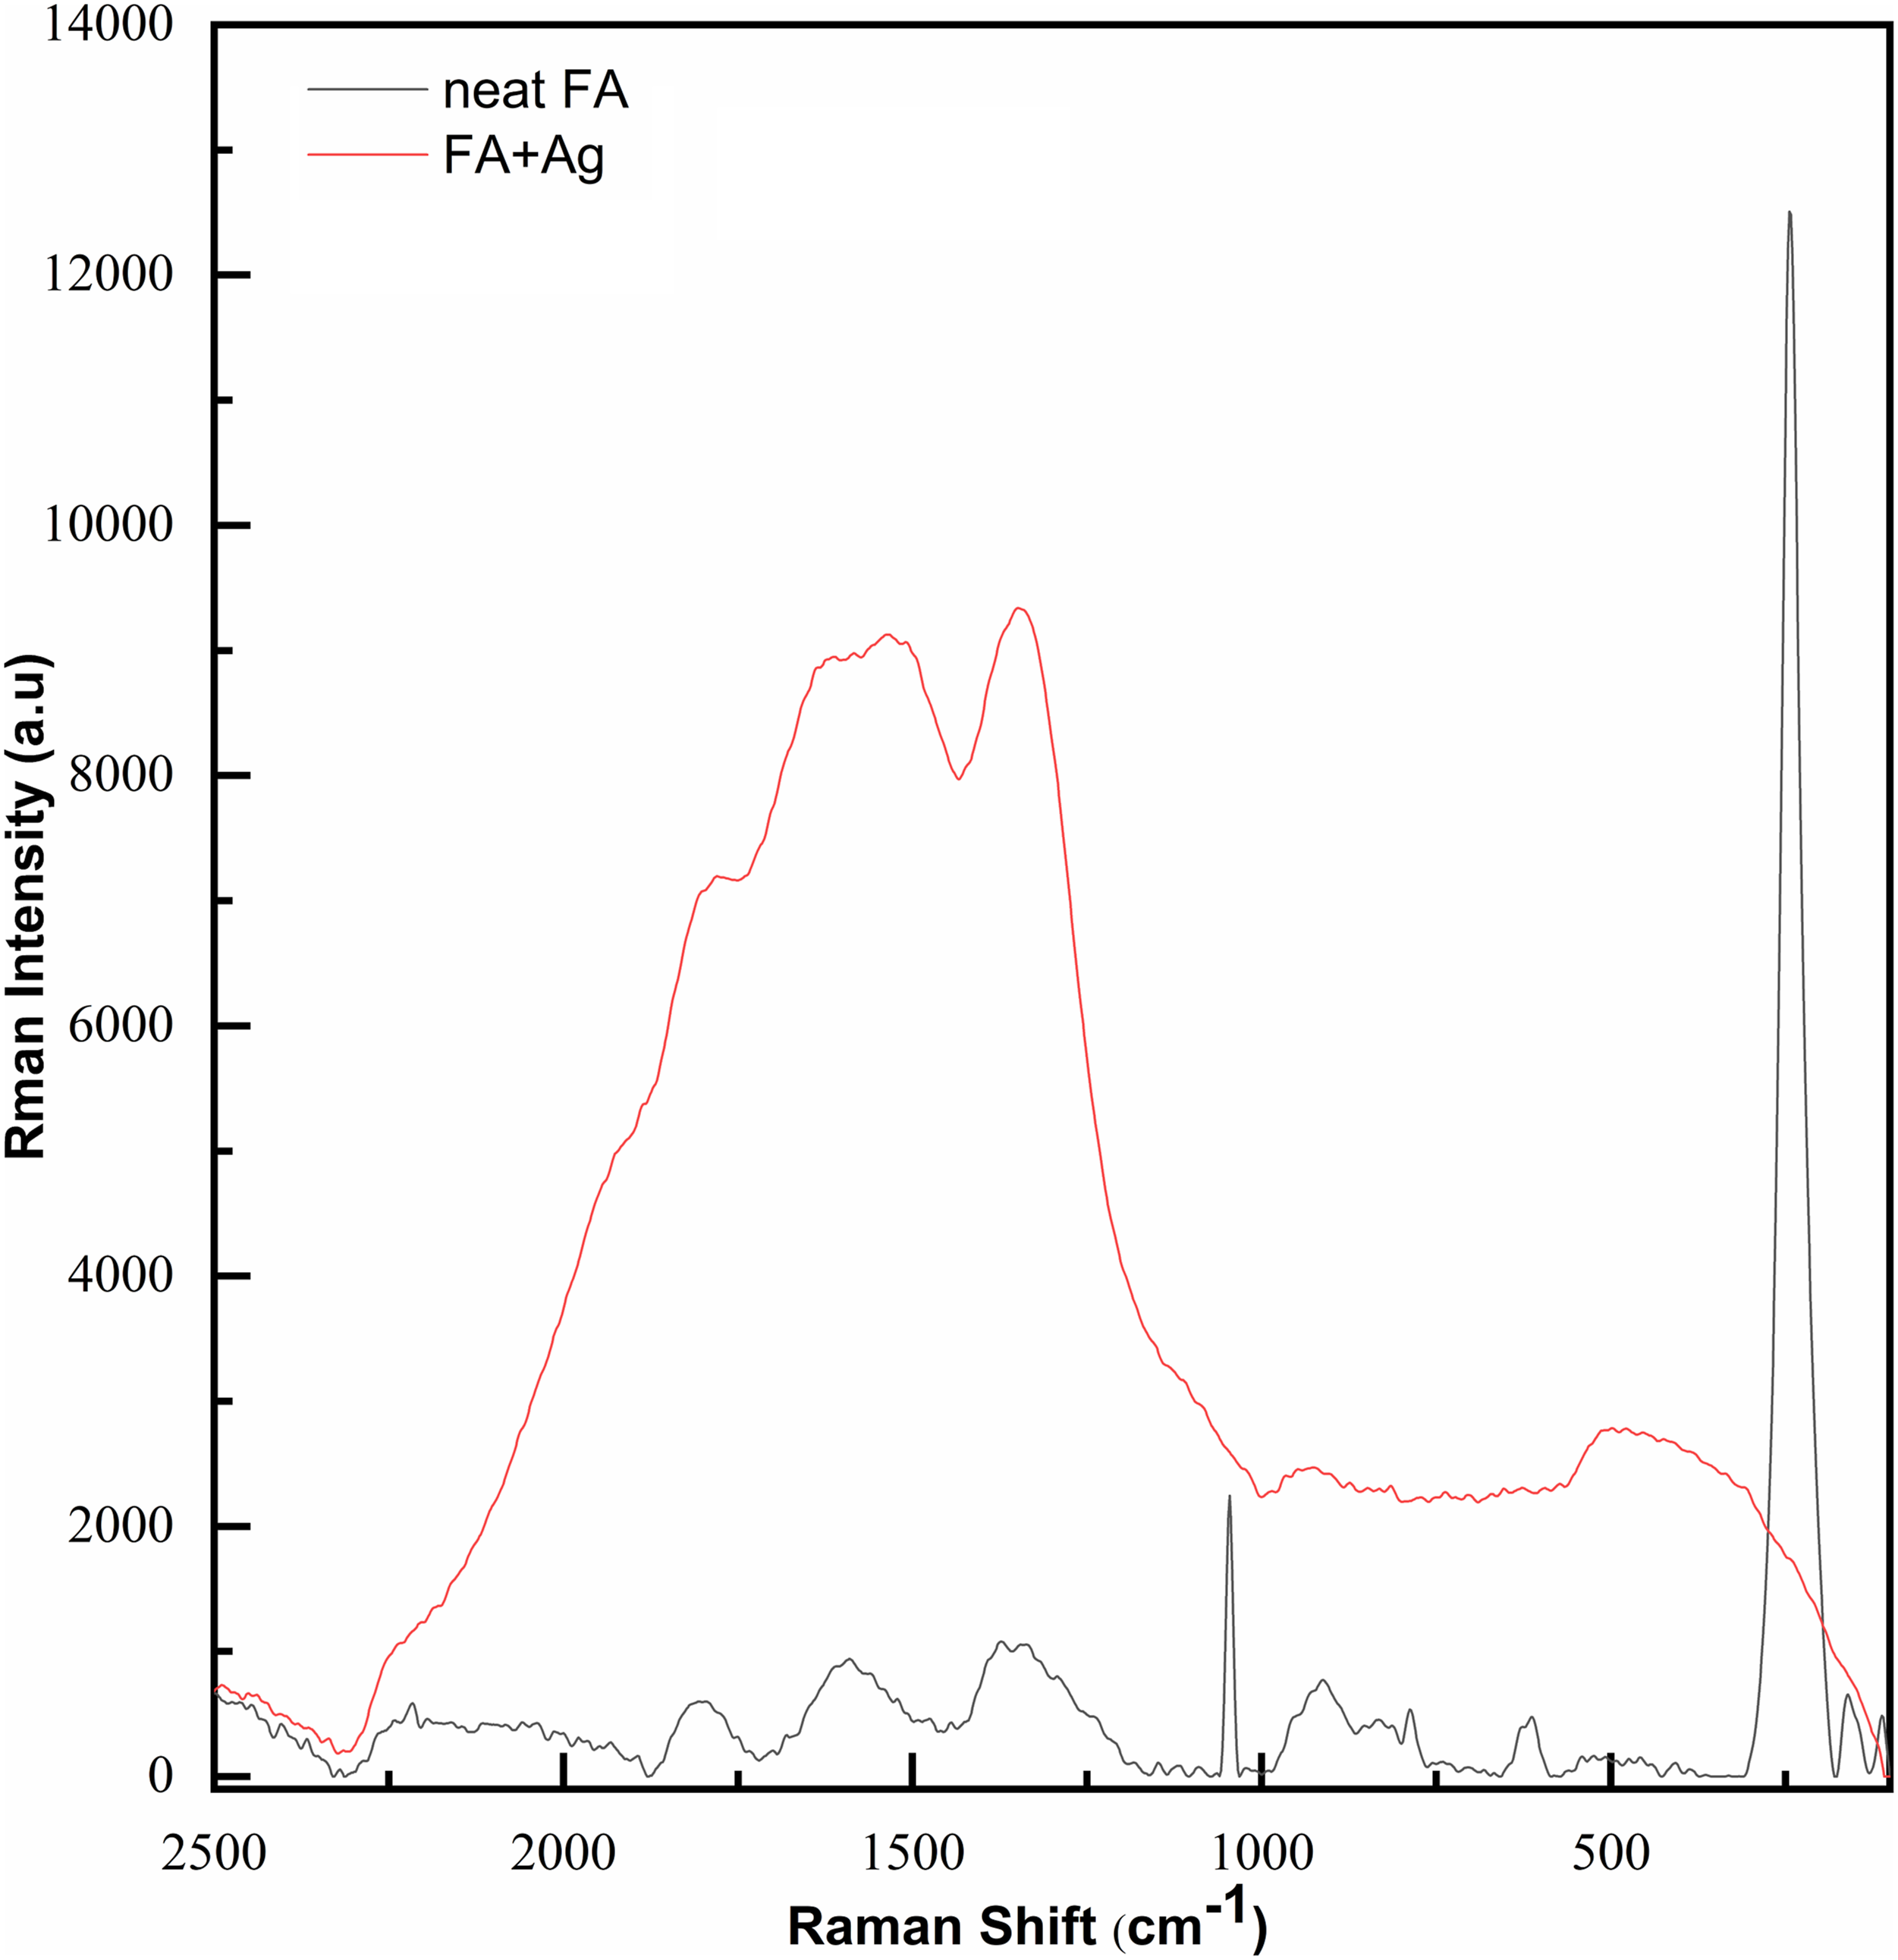
Dispersion of fly ash (10 and 20 wt%) in a styrene-butadiene thermoplastic elastomer matrix was examined by SEM. The morphologies cross-sectional plane of the films is presented in Figure 5. SEM micrograph of the cross-section of 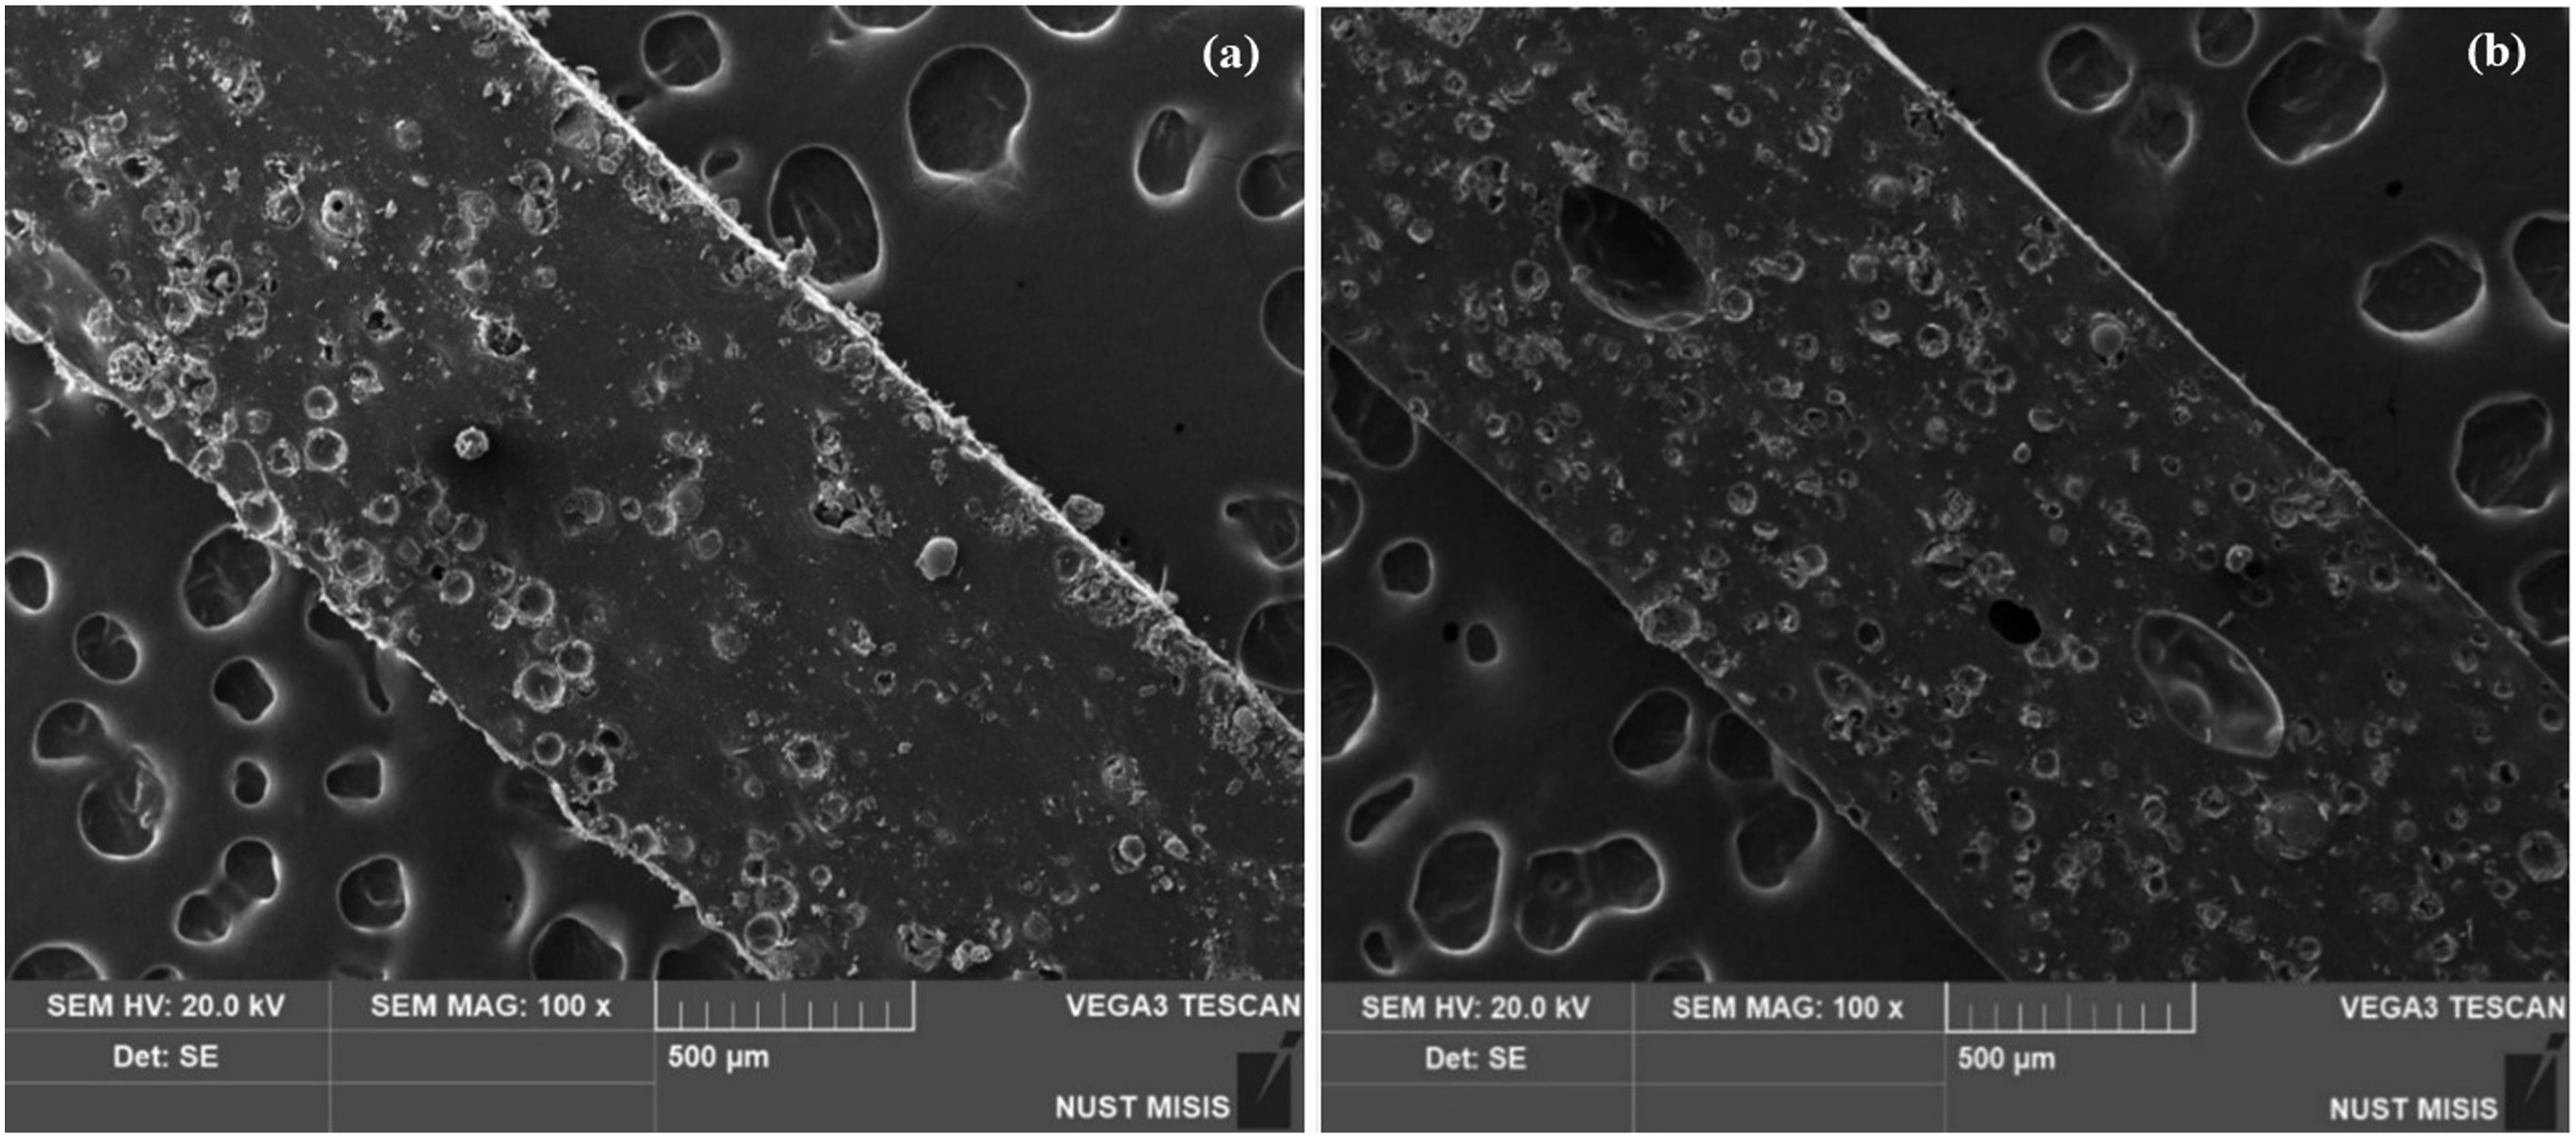
SEM revealed a uniform distribution of spherical FA particles, demonstrating excellent adhesion between the fillers and the SBS-polymer matrix. Composites featuring hollow cenospheres exhibited a homogeneous matrix structure, as shown in Figure 5. However, the composite fabrication process caused fragmentation of microspheres in several regions. The sliced cenospheres on the surface are a result of using a scalpel to obtain a slice of the polymer composite film. The voids on the cut surface of the polymer film are most likely the result of the film drying process, given that the composites were derived from a toluene solution. The polymer matrix shows good dispersion of filler particles, with numerous dispersed spherical particles embedded within. Figure 6 shows the SEM micrographs of composites with 30% fly ash cenospheres. SEM micrographs of SBS/FA-30 with different magnifications (a and c – thin film cut surface, b – thick film cut surface, d – thin film fracture surface).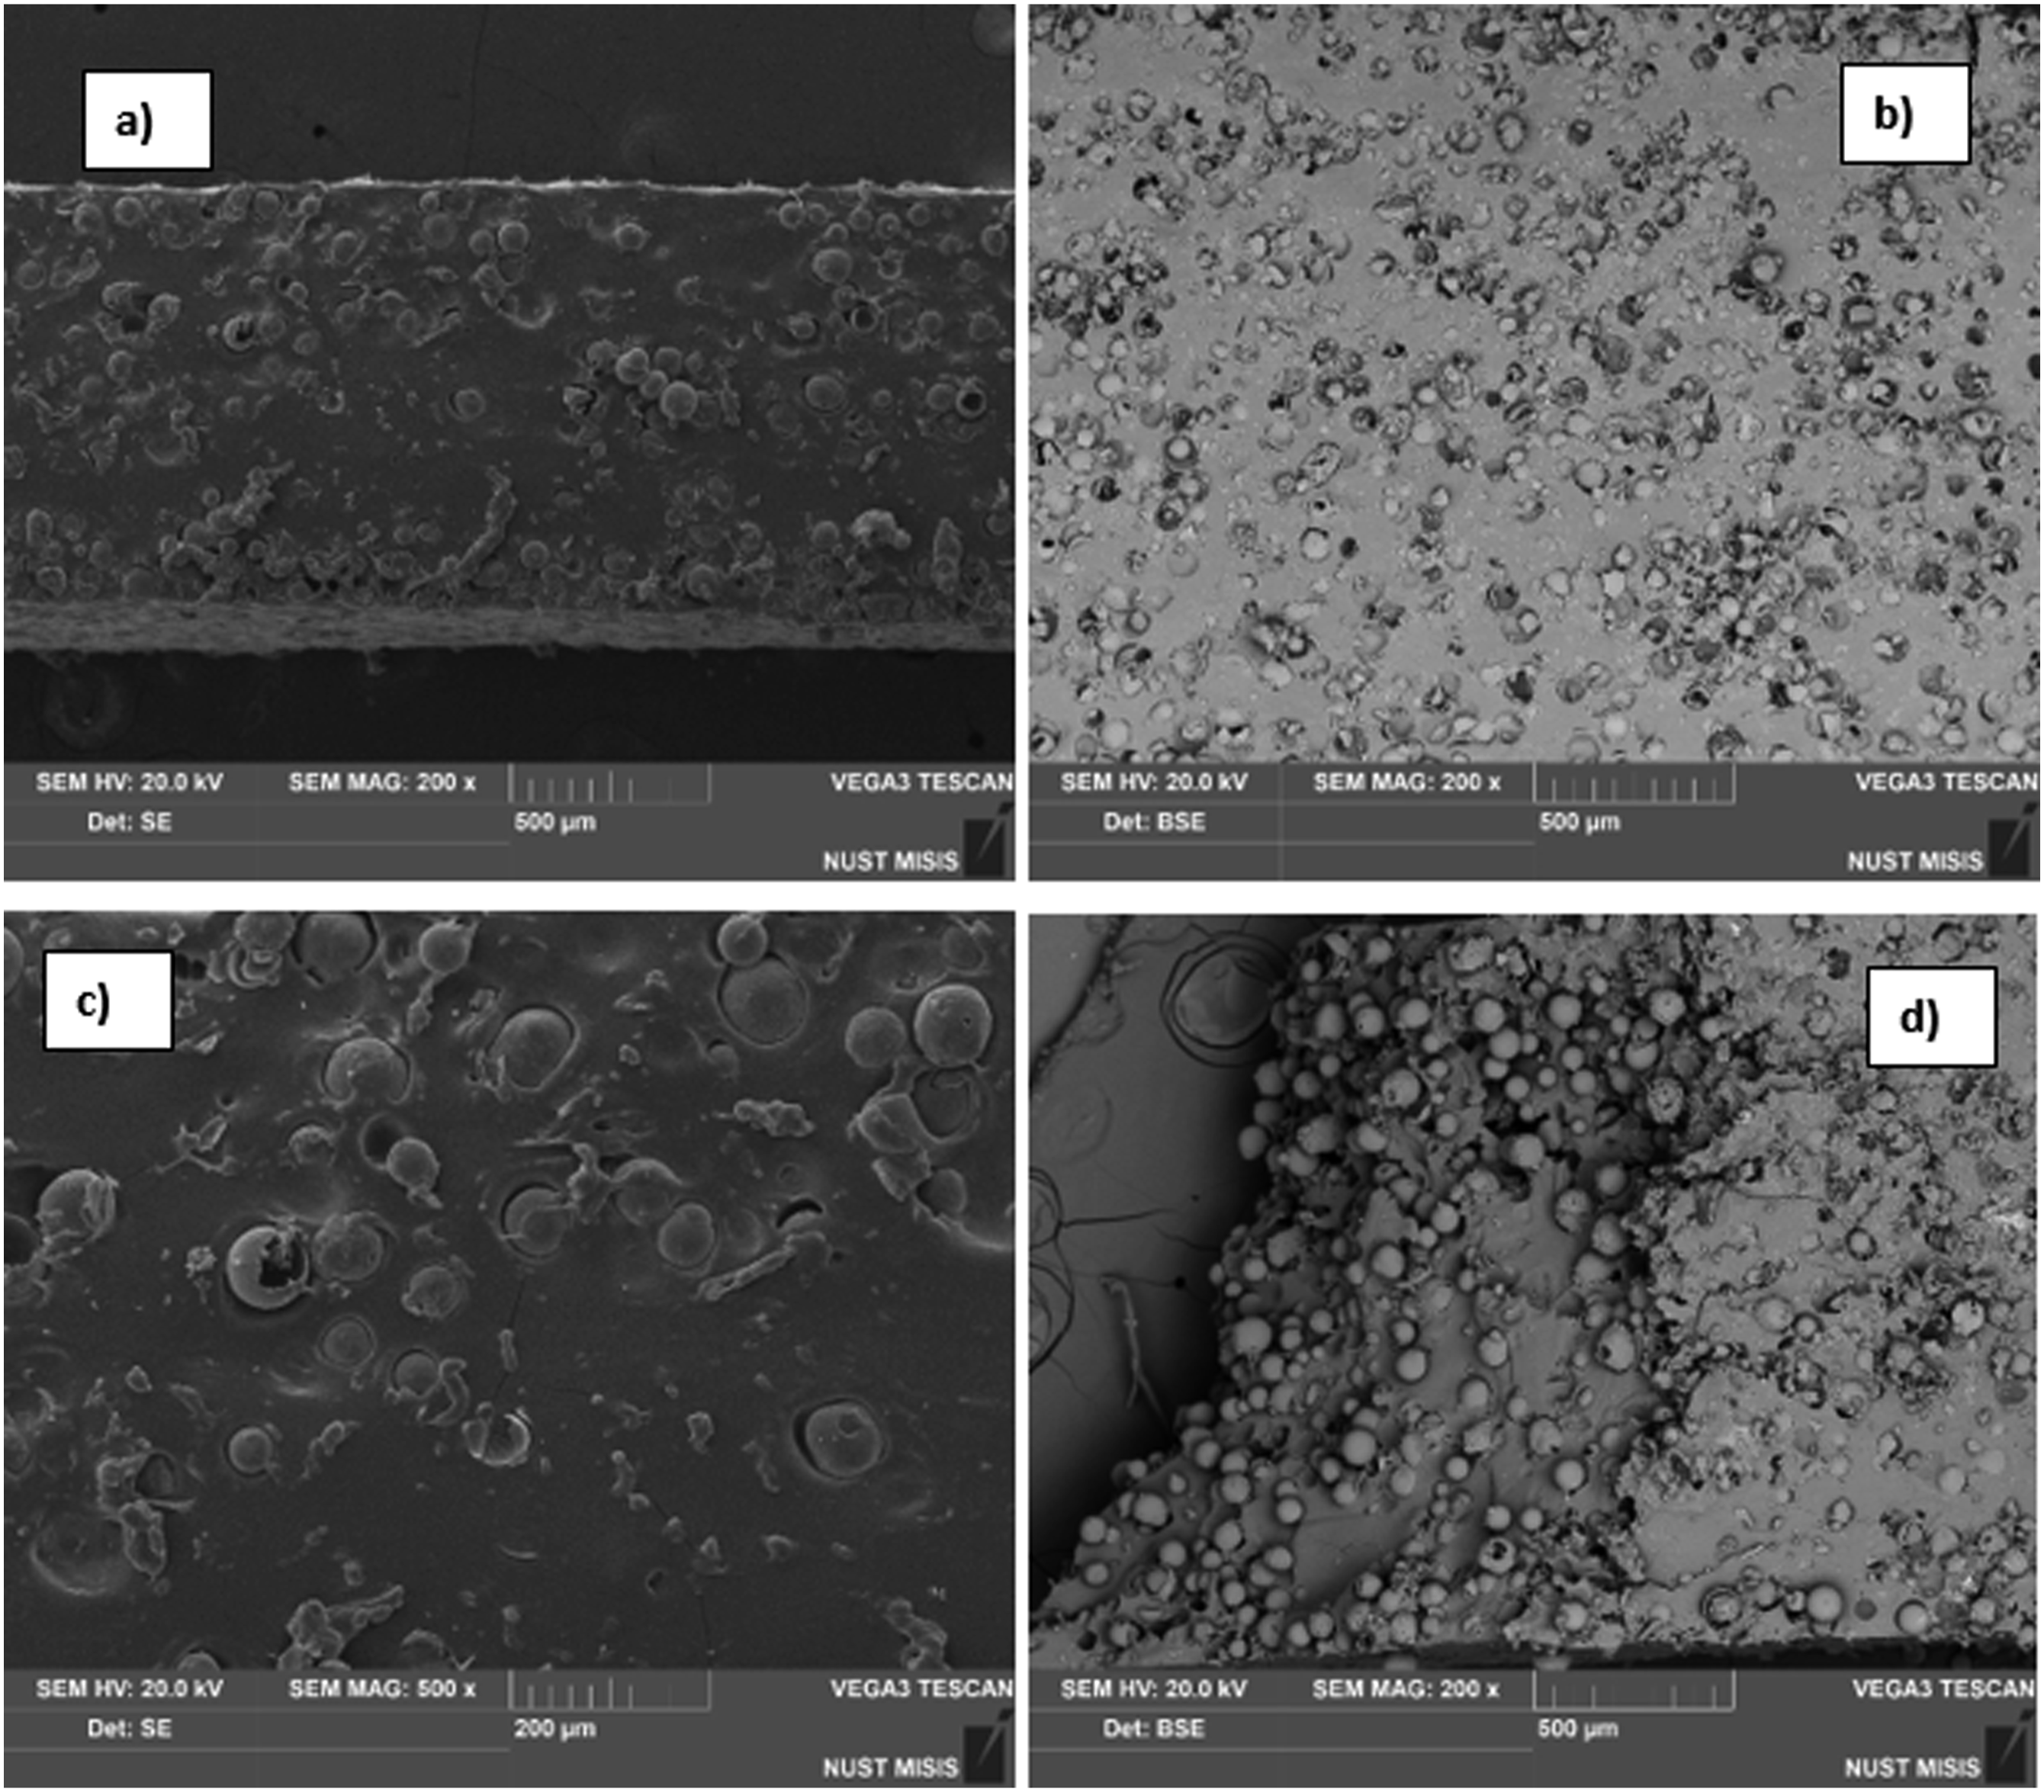
The fracture surface of the composites displays a uniform dispersion of filler (Figure 6(b)). The interaction between the filler and the matrix appears satisfactory, as evidenced by the SEM micrograph of composites containing 30 wt% of fly ash. The cut surfaces of the composites (Figure 6(a), (b), (c)) exhibit quite uniform dispersion of filler without large particle aggregates. Many broken spheres are found on the shear surface, but on the surface obtained by the fracture method (Figure 6(d)), the spheres are predominantly unbroken. These results closely align with some reinforcements reported for fly ash-reinforced unsaturated polyester composites as was previously described. 48
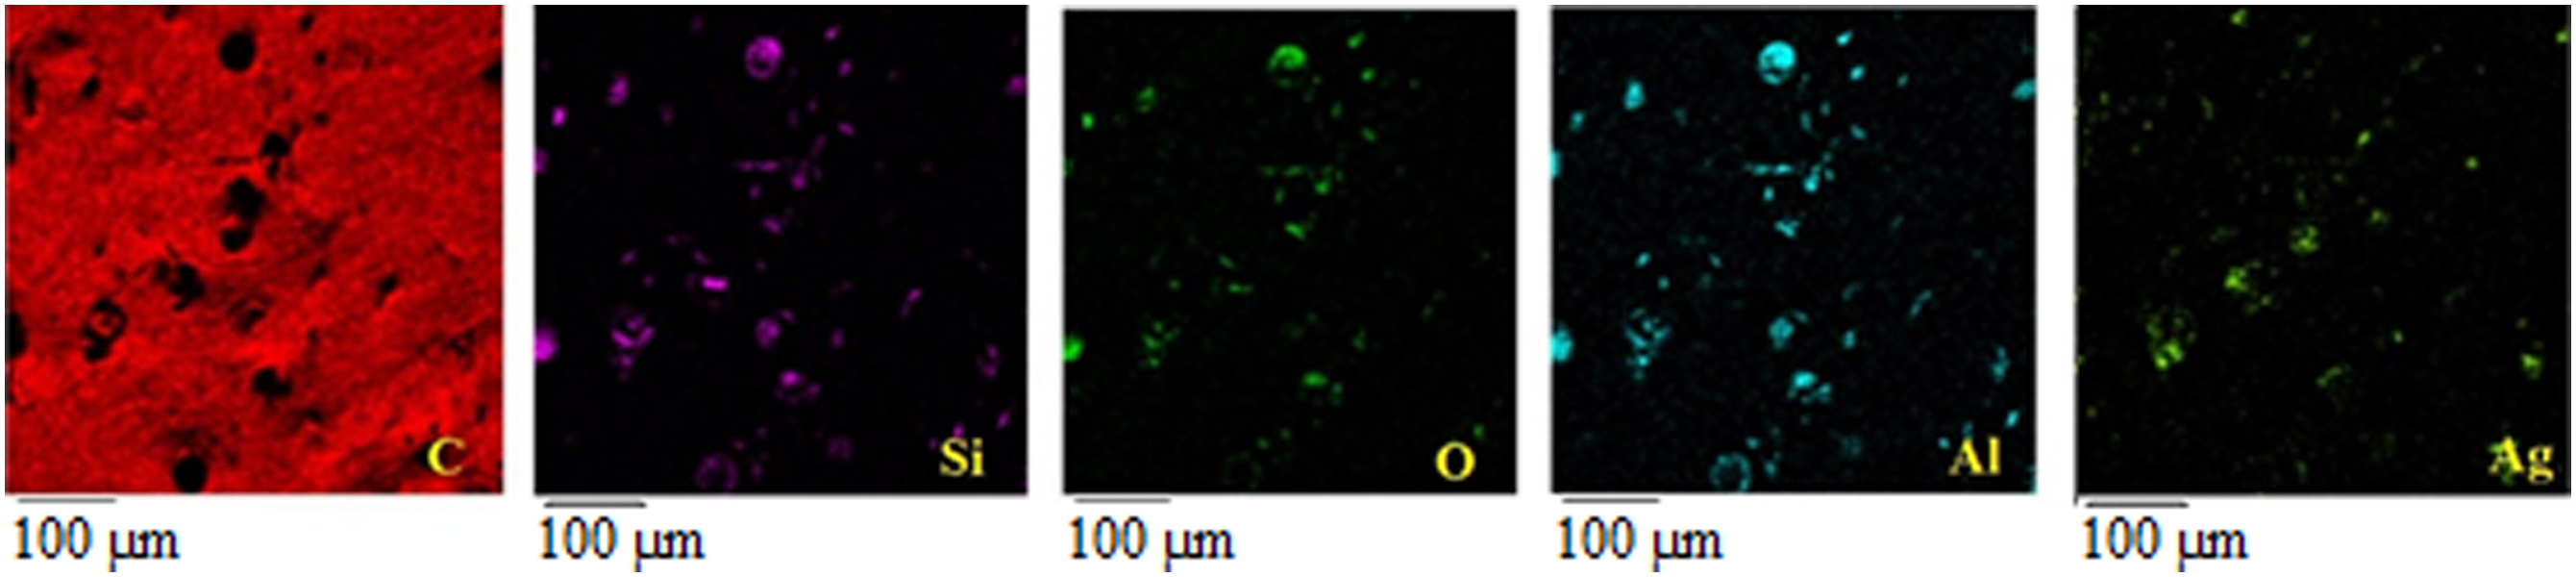
To investigate the compositional analysis and distribution of major elements (C, Si, O, and Al) in SBS/FA-30 films and the presence of Ag in SBS/FA-10/Ag films, EDS elemental maps were obtained for both composites (Figures 7 and 8). Uniform elemental distributions of Si, O, and Al were observed in the SBS matrix. A comparison of the morphology of SBS/FA-10/Ag and SBS/FA-30 showed a significant increase in the number of spheres uniformly distributed in the polymer matrix. Meanwhile, the EDS elemental maps of SBS/FA-10/Ag revealed that Ag is present on the surface of most spheres, with only a small portion of spheres remaining uncovered with Ag. This indicates a successful Ag-coating of the cenosphere particles using the modified electroless coating process. Energy dispersive X-ray spectroscopy (EDS) elemental maps (C, Si, O, and Al) obtained from SBS/FA-30. Energy dispersive X-ray spectroscopy (EDS) elemental maps (C, Si, O, Al, and Ag) obtained from SBS/FA-10/Ag.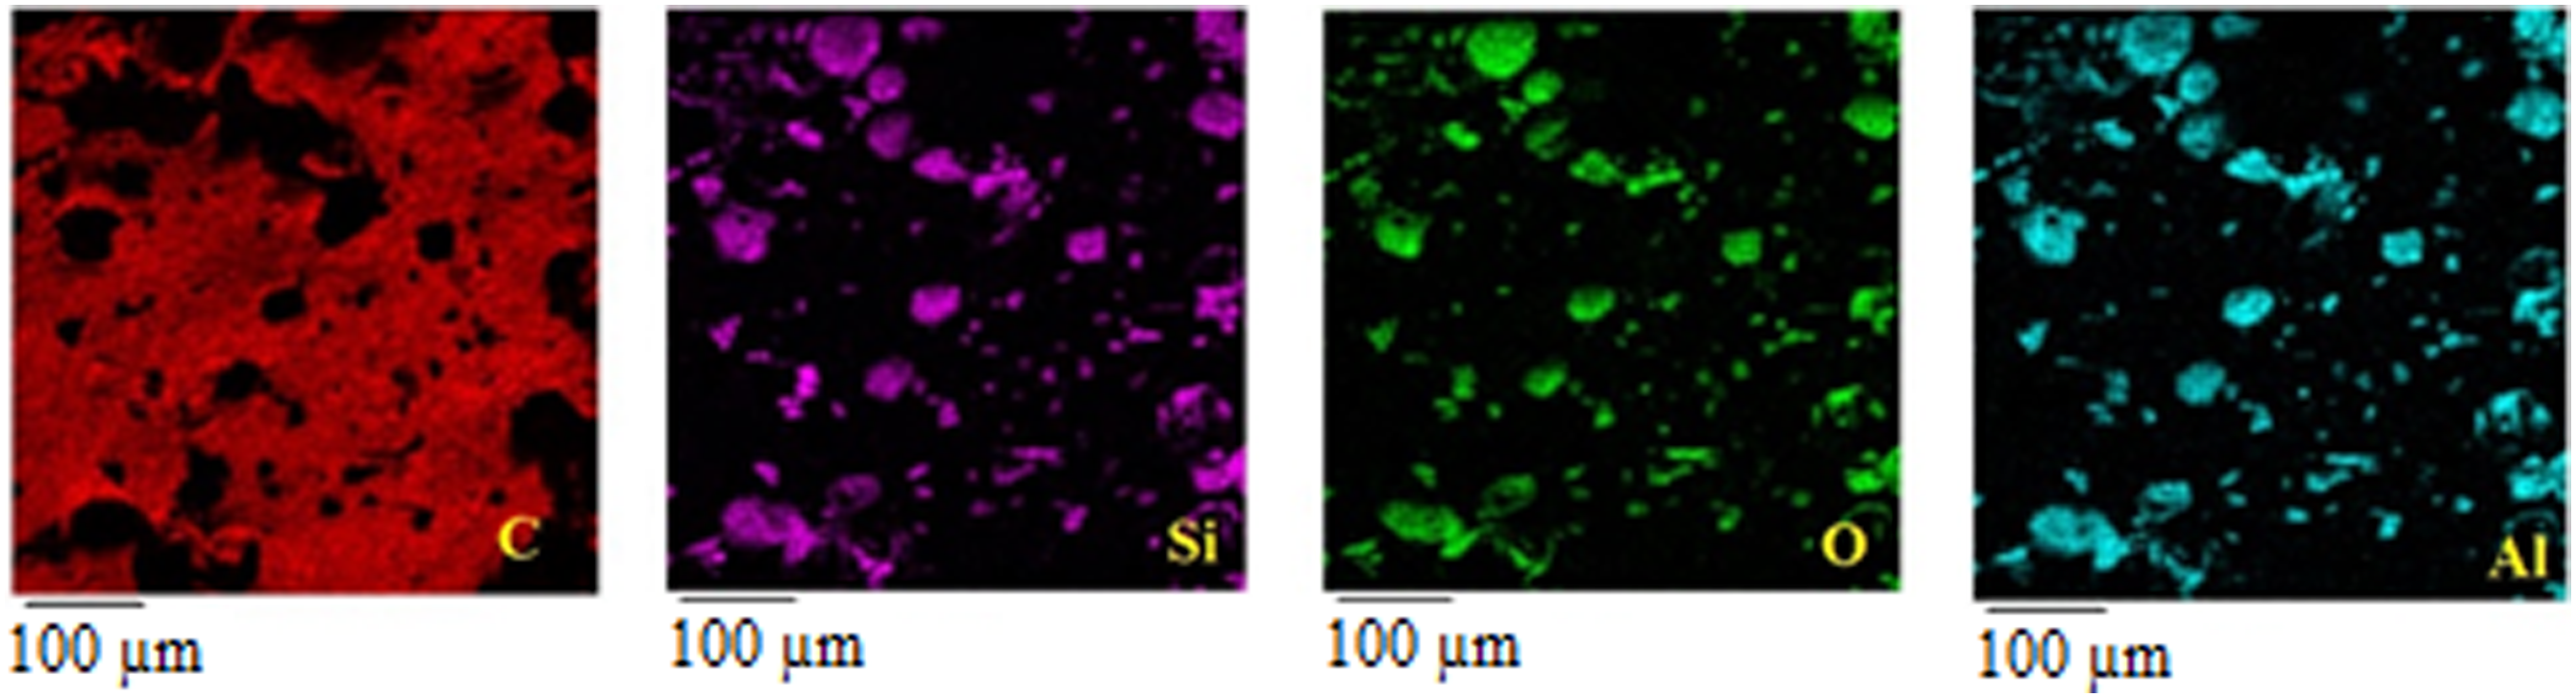
To compare the research results on the internal structure, cross-sections and fractures of the composite were examined using SEM, while the surface morphology of the sample was analyzed using optical microscopy (Figure 9). The optical microscopic images of SBS/FA composites: (a) SBS/FA-10, (b) SBS/FA-10/Ag (c) SBS/FA-20, (d) SBS/FA-30.
As seen in Figure 9 the concentration of cenospheres filler has a strong effect on the interfacial adhesion and compatibility between the filler and the SBS matrix. SBS/FA-10 and SBS/FA-10/Ag (Figures 9(a) and 9(b)) show a similar morphology, indicating that a small amount of FA can be well dispersed in the SBS matrix. From Figure 9, it was shown that the fly ash was homogeneously distributed within the SBS matrix. As seen in Figure 9(a) the cenospheres filler protrudes into the surface of the sample, which can affect the improvement of the wear resistance. With the increasing FA content up to 30 w% FA, interfacial separation and surface splits were observed (Figure 9(c) and (d)). It can be assumed that adding a large amount of FA (more than 20%) leads to the poor interfacial compatibility of filler/polymer and a partially fractured surface can be seen.
Density of composites
Density of neat SBS and SBS/FA composites. The mass percentage of cenospheres is given in accordance with P800/ % (TGA data).
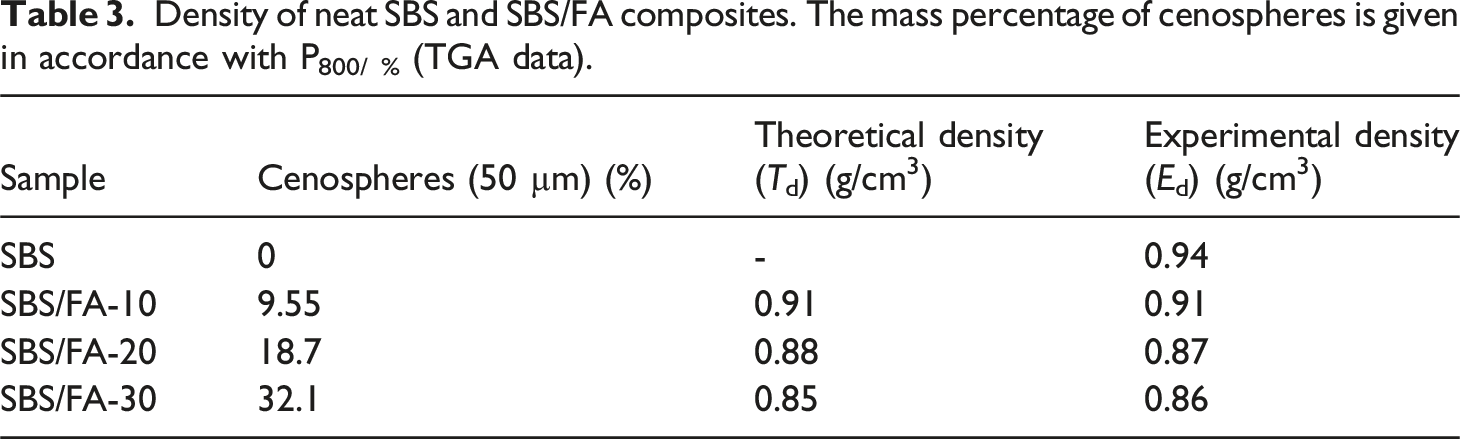
The more the weight percent of fly ash increases, the lower the density value of the sample due to the incorporation of the low-density filler. The density of the composite material with 10 w% of FA is only 0.91 g/cm3 and is about 3.4% less than that of the neat SBS. This decrease in density is attributed to the low density of fly ash particles, which is only 0.7 g/cm3, compared to the neat SBS at 0.94 g/cm3. When the volume fraction of the filler is 30%, the density of the composite is 8.7% lower than that of the SBS matrix. In comparing the values of the theoretically calculated and experimentally determined density of composites, it can be concluded that these are generally consistent. Variations in density values could be explained by changes in the proportion of broken cenospheres and cenosphere fragments in the samples of polymer composites, which can ultimately influence the density values. A similar study 28 was conducted on fly ash cenospheres filled composites based on polyurea elastomer. The results from that study were consistent with the density values found in this study.
Macromolecules’ dynamics
The change in the macromolecular mobility of SBS/FA composites was determined by the EPR method. The rotational correlation times of the TEMPO spin probe indicate molecular mobility and segmental motion of polymer chains (Figure 10). The higher the value of the correlation time, the lower the molecular mobility or flexibility of the chains of the polymer under study. The time of the probe-radical correlation for the SBS/FA composites with different concentrations of fly ash cenospheres is summarized in Table 4. EPR spectra of SBS/FA composites with fly ash cenospheres content (w%): (1) 10; (2) 10/Ag; (3) 20; (4) 30. The rotational correlation times of TEMPO spin probe in SBS/FA composites.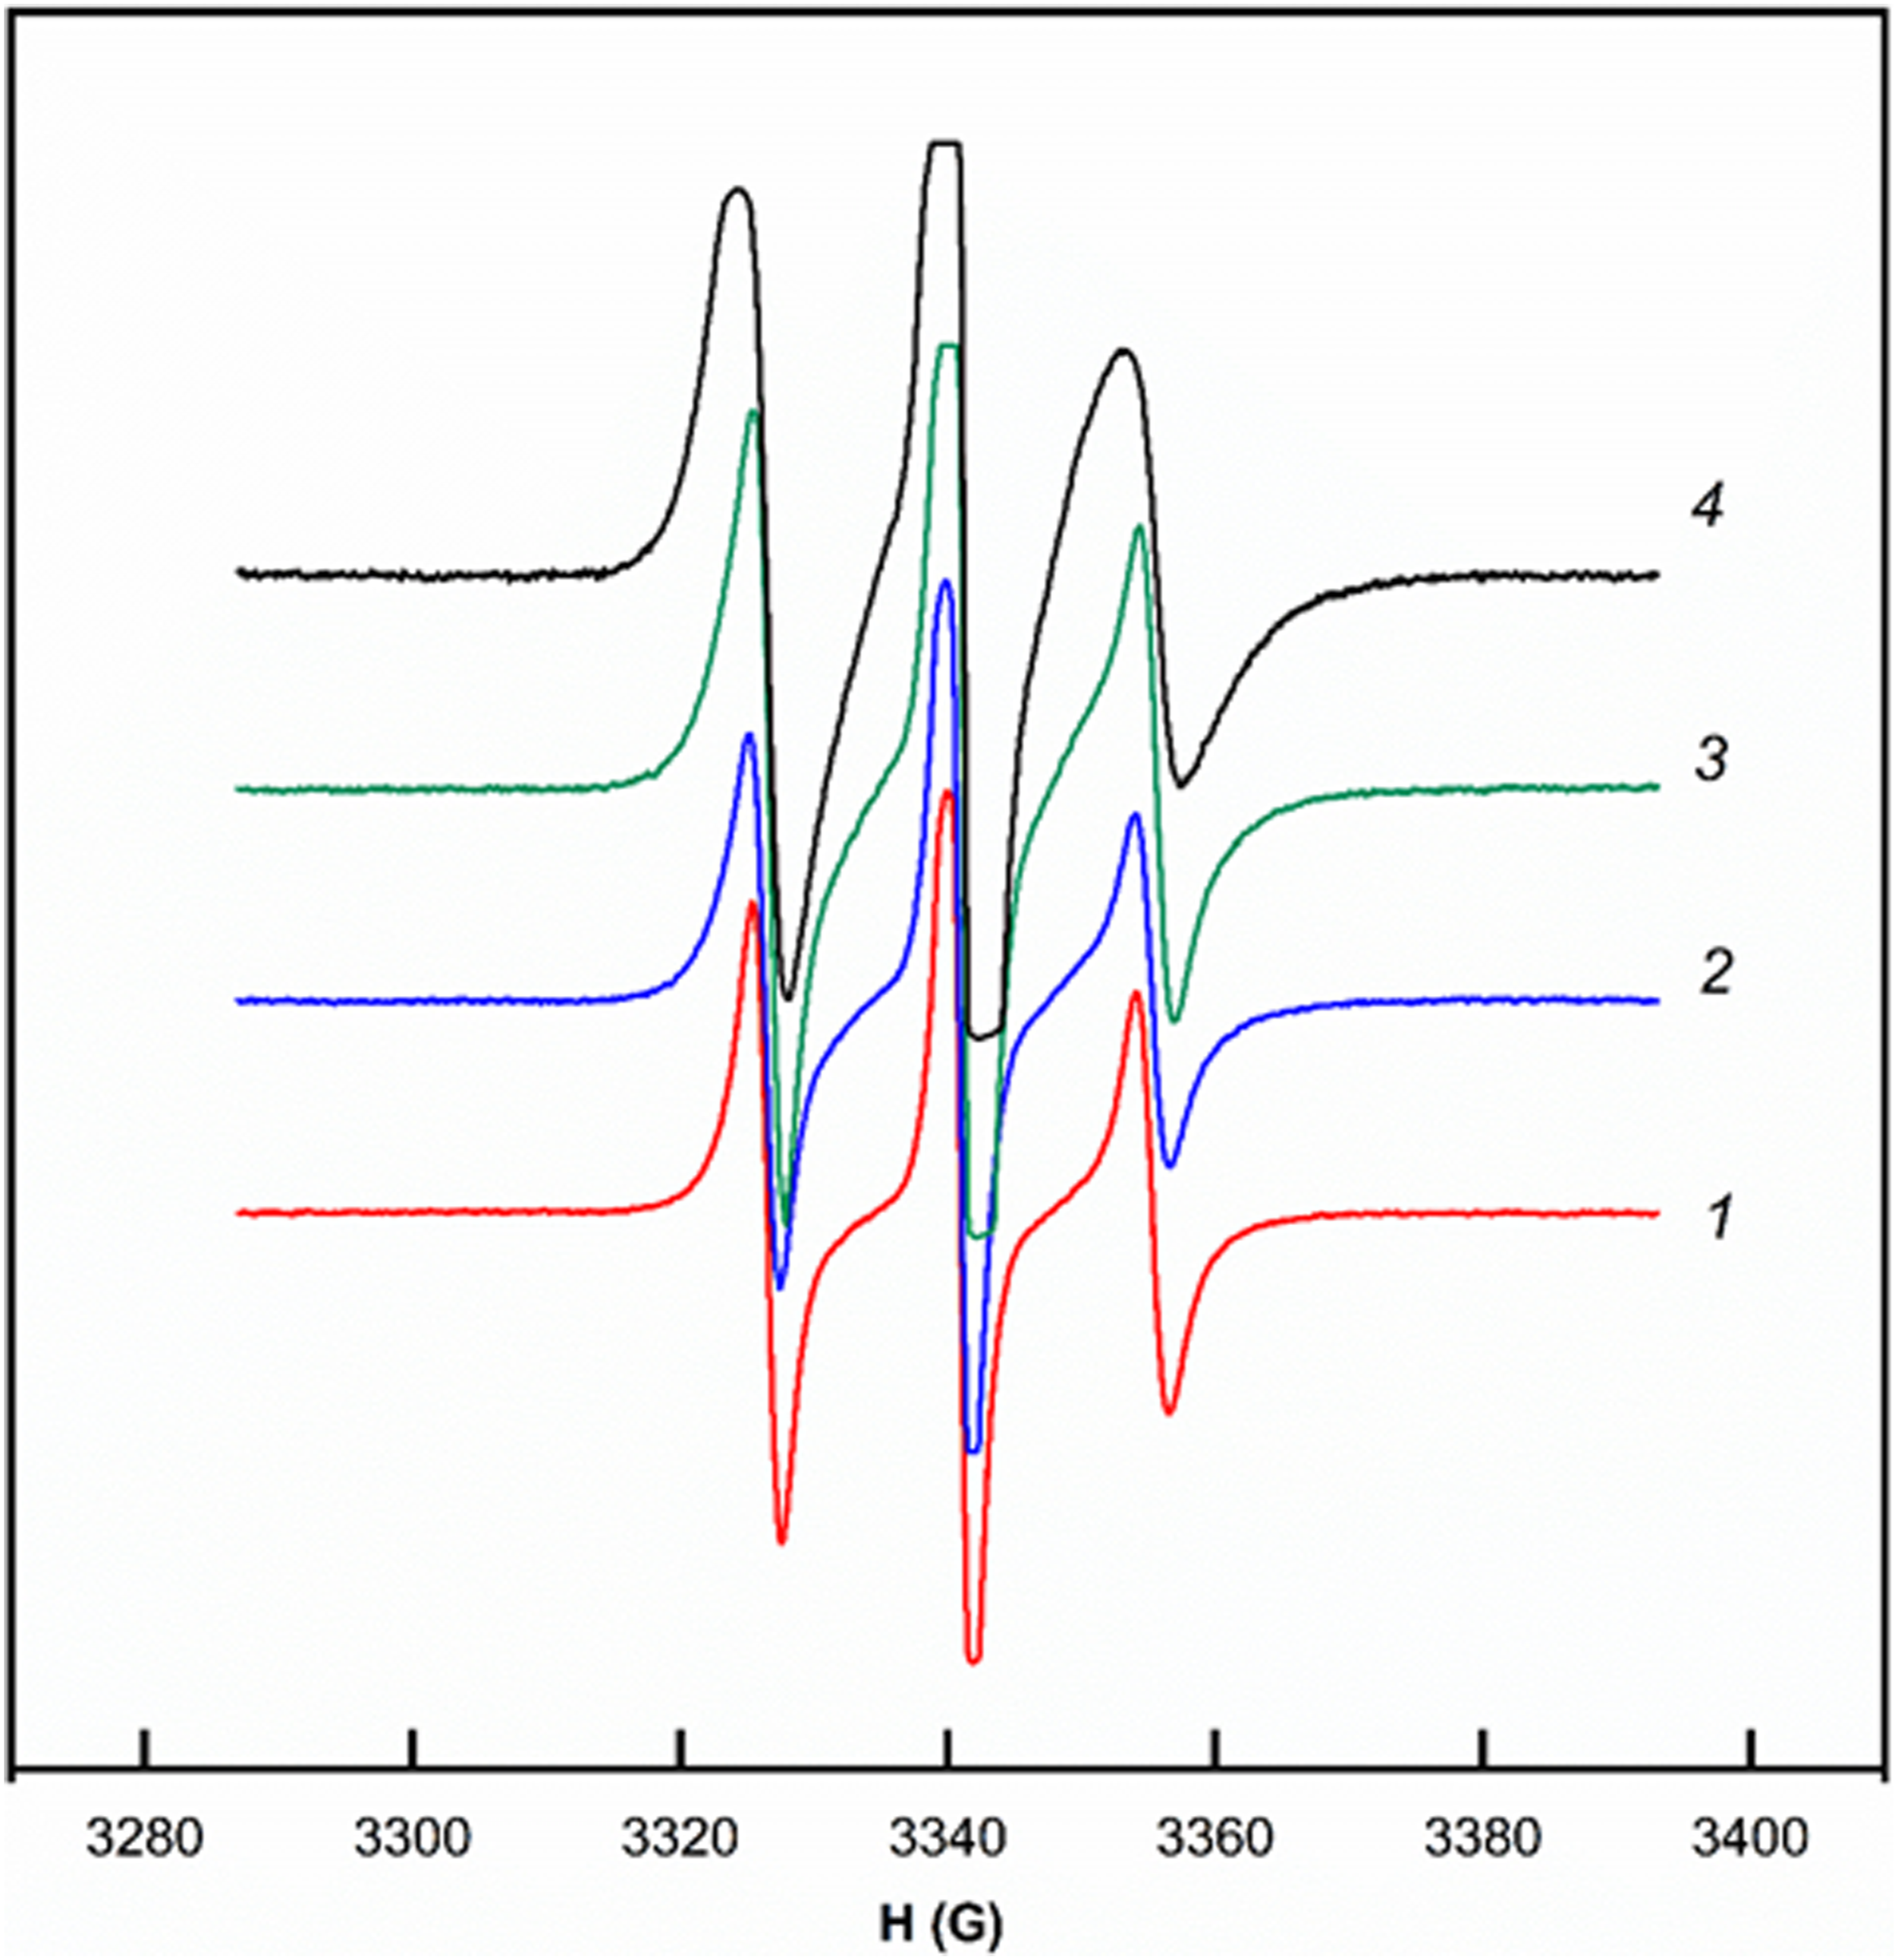
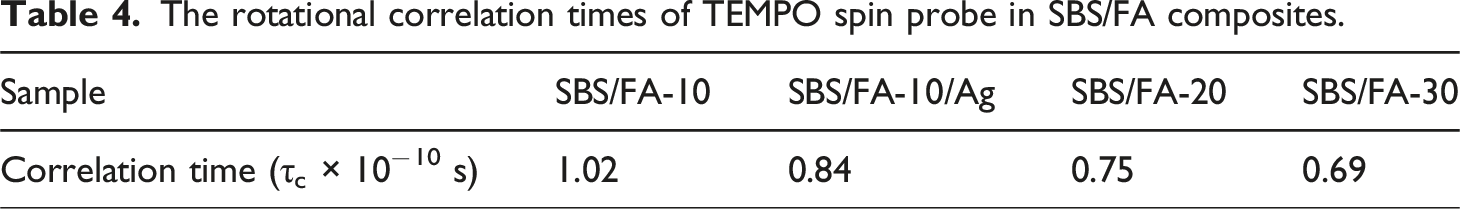
The initial SBS sample exhibits the lowest radical mobility (the highest correlation time 1.02 × 10⁻¹⁰ s), which may indicate the strongest interaction between polymer chains. As the filler is introduced into the system, the interaction between polymer chains weakens, and radical mobility increases with increased filler concentration in the composite. The correlation time for SBS/FA-20 samples (0.75 × 10⁻¹⁰ s) and SBS/FA-30 samples (0.69 × 10⁻¹⁰ s) decreases by 27% and 32%, respectively, compared to the SBS/FA-10 sample. This can be explained by the fact that the molecular mobility of polymer chains in composite materials may be increased by the incorporation of inorganic filler into the polymer matrix. It should be noted that the addition of fly ash cenospheres to the SBS polymer matrix leads to greater free volume and easier polymer chain mobility compared to the neat SBS without a filler. When comparing composites with the same amount of filler added, but in the first case, these are original cenospheres, and in the second, cenospheres with a silver coating, a decrease in molecular mobility is observed in the system with silver-coated cenospheres. This could be explained by the fact that if there are attraction forces between the filler and the interfacial polymer, the mobility of the polymer chains is reduced.
ATR/FT-IR analysis of the composites
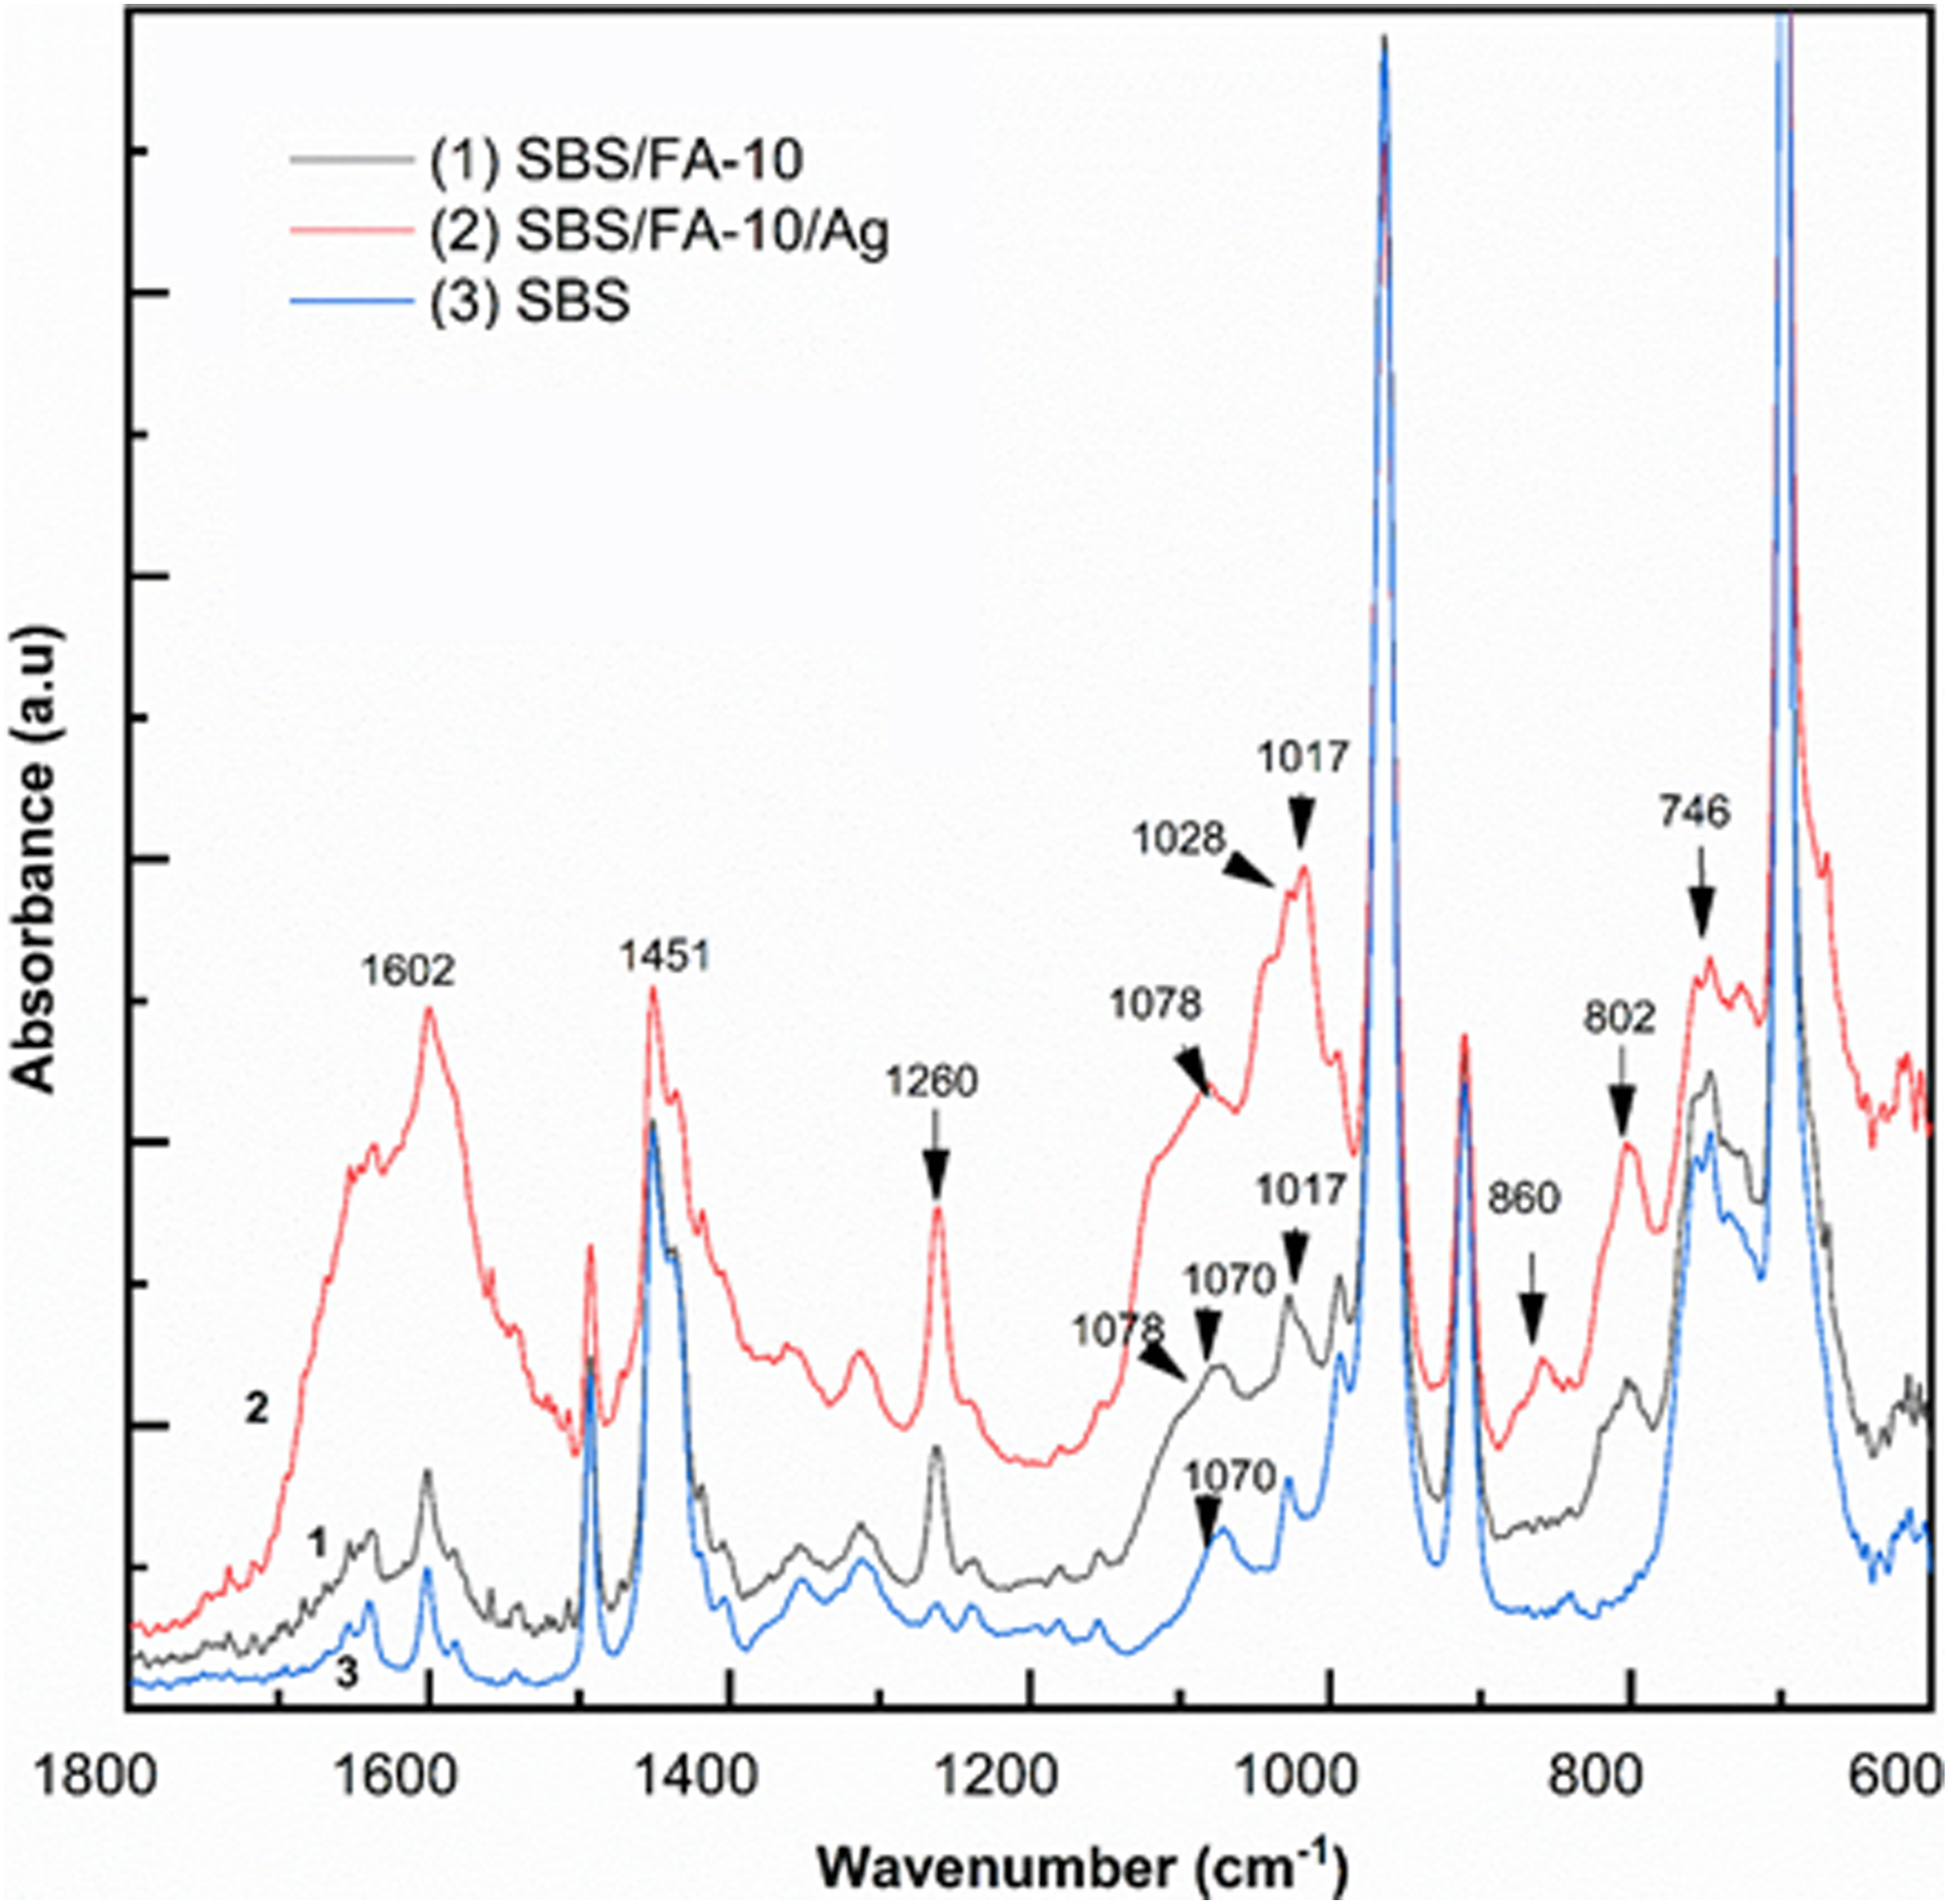
Figures 11–12 shows infrared spectra of SBS and SBS/FA composites. ATR/FT-IR spectra of (1) SBS/FA-10 (black line), (2) SBS/FA-10/Ag (red line), (3) SBS (blue line) in the wavelength range 800–3500 cm−1. ATR/FT-IR spectra of (1) SBS/FA-10 (black line), (2) SBS/FA-10/Ag (red line), (3) SBS (blue line) in the wavelength range 600–1800 cm−1.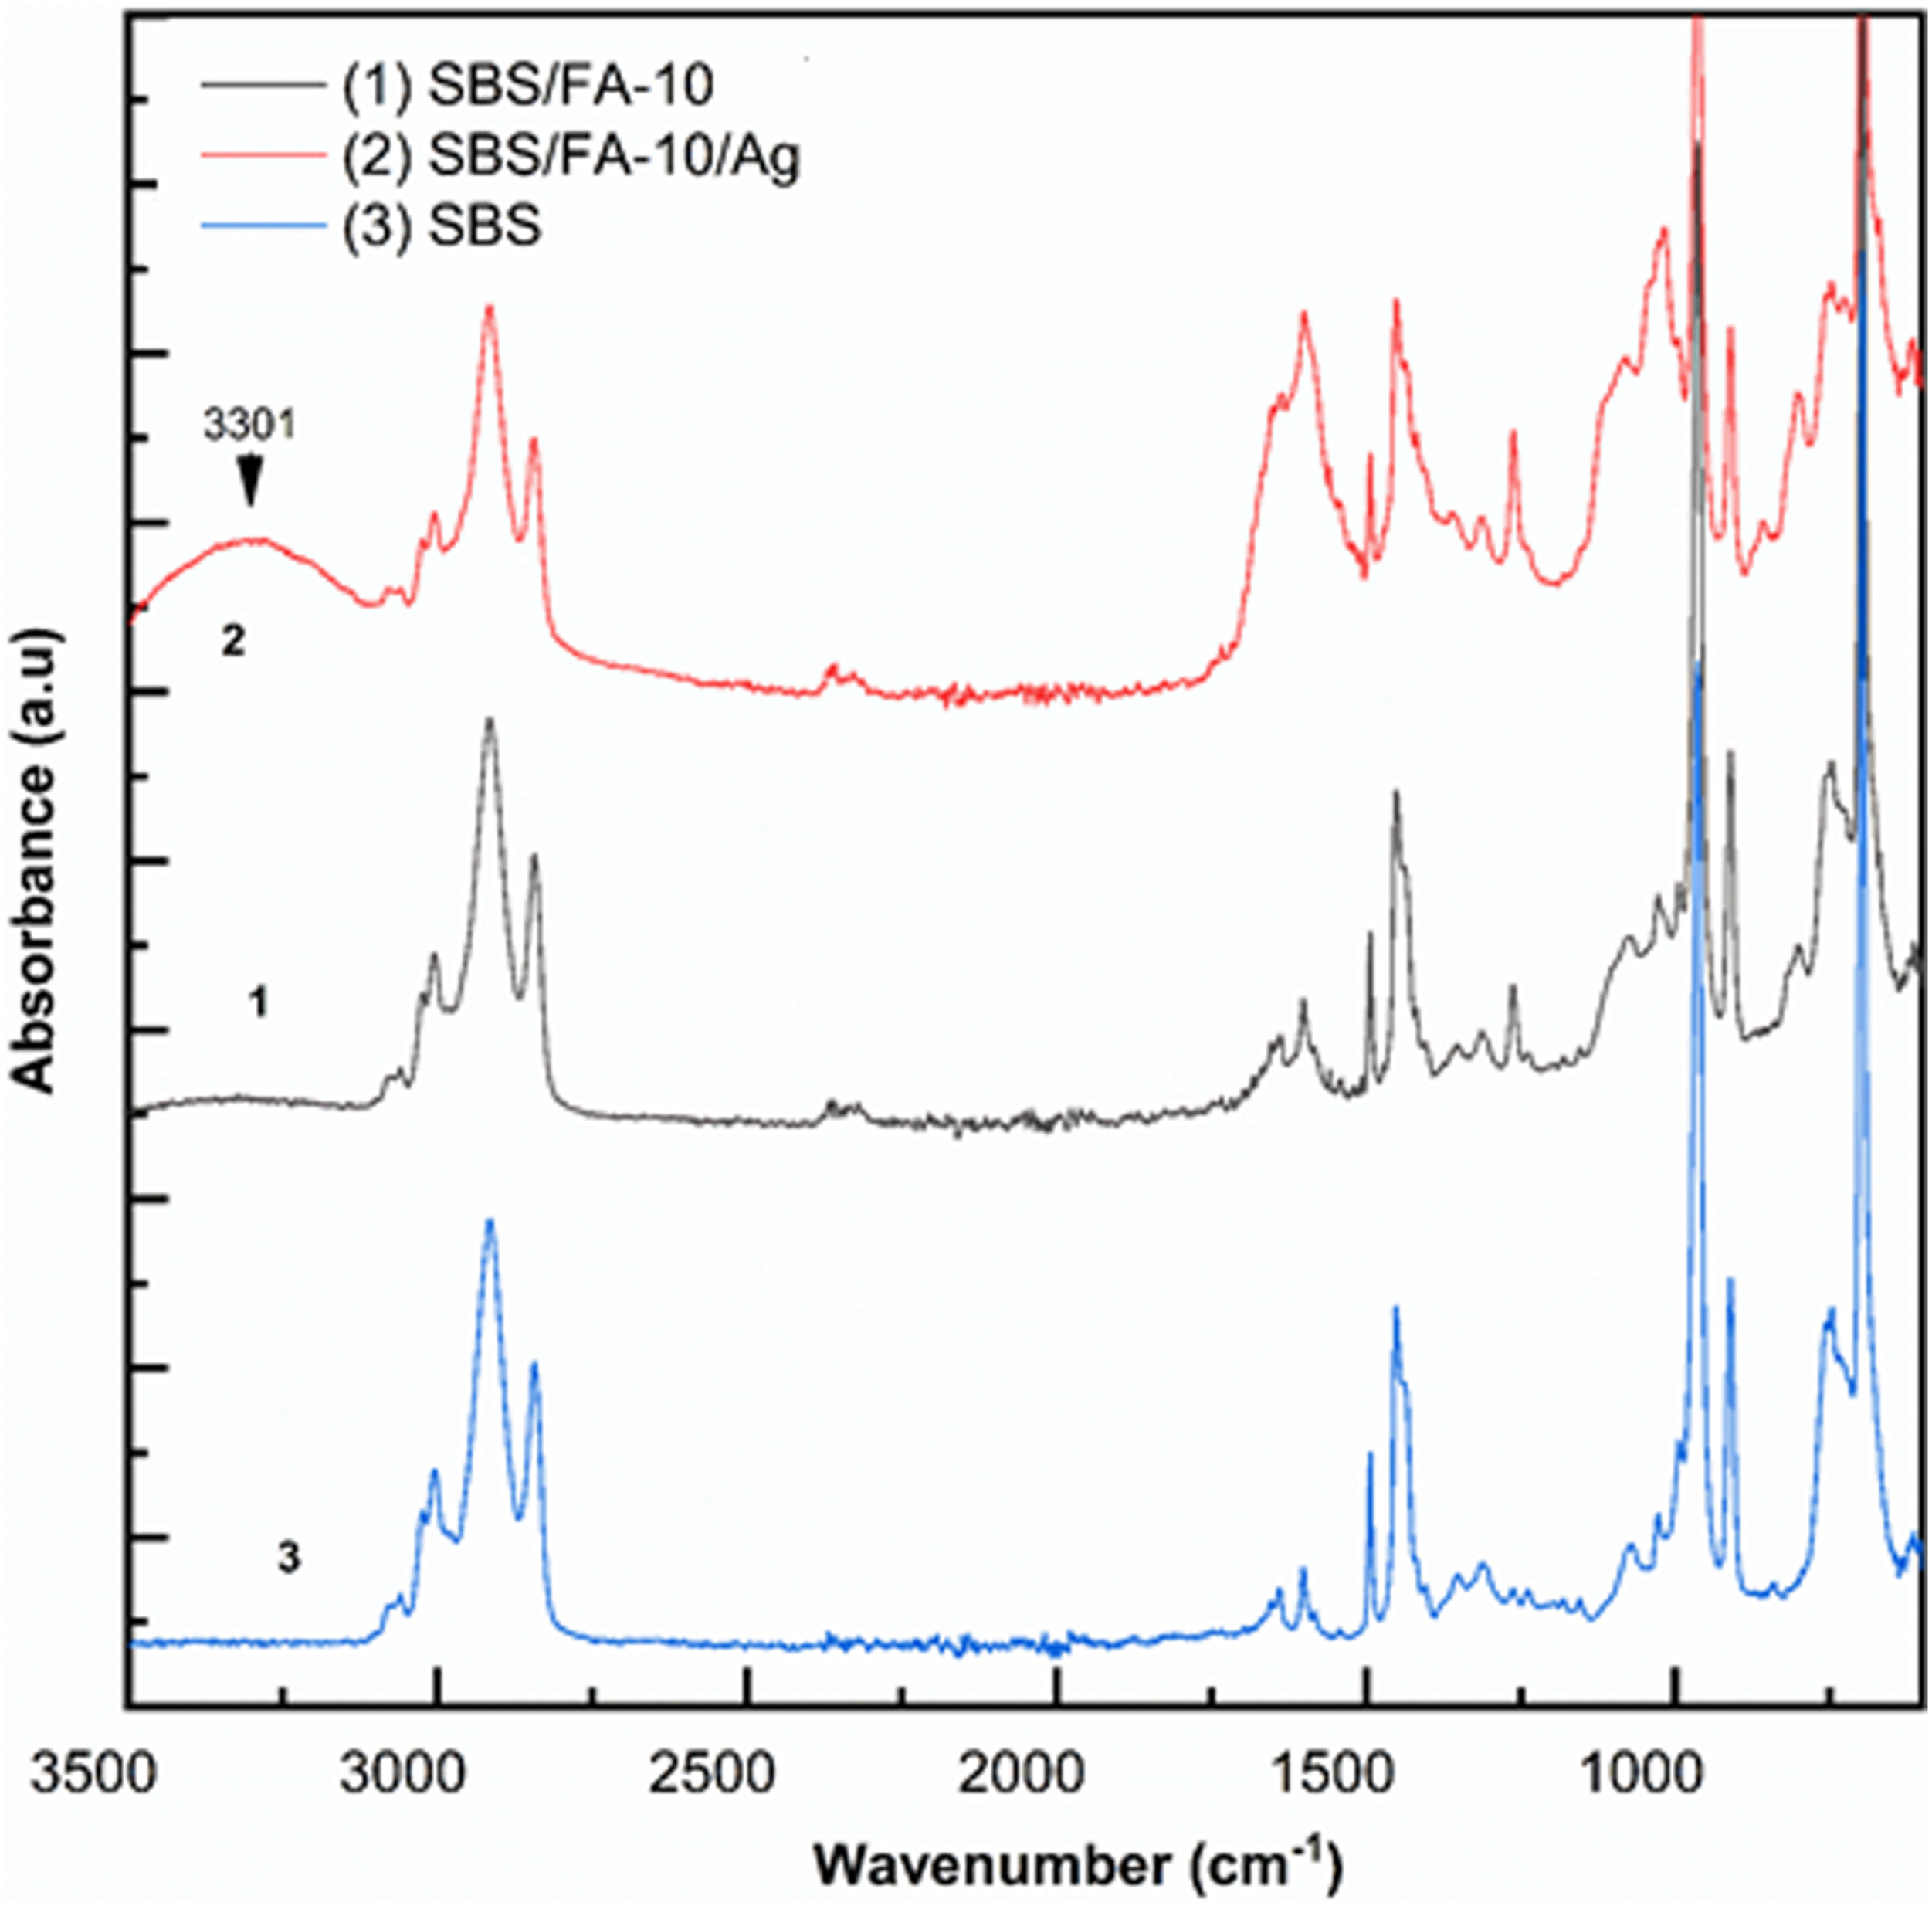
Band absorbance intensities (a.u.) in ATR/FT-IR spectra of neat SBS, SBS/FA-10, and SBS/FA-10/Ag composites and the ratio of A697 and A964 for different samples.
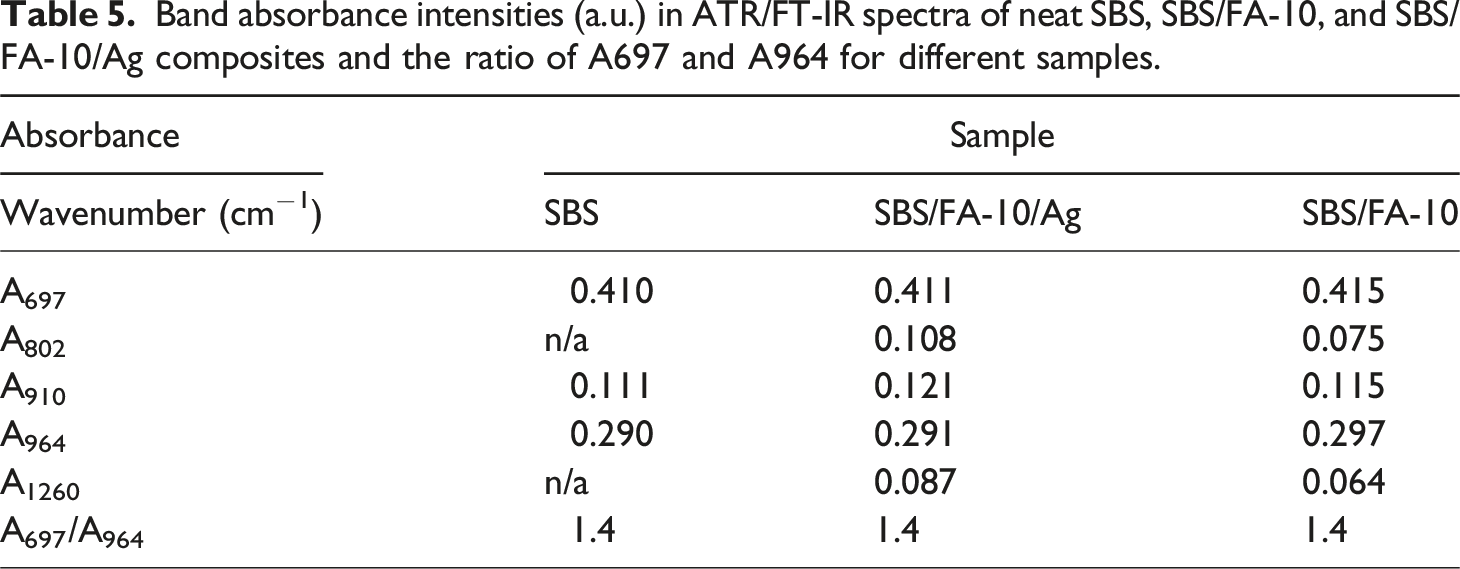
When compared to neat SBS, an increase in total intensity in the region of stretching vibrations of 1700 − 800 cm−1 was observed, which indicates the superposition of signals corresponds to the SiO2 and metal oxides stretching vibrations. In addition, new absorption bands were detected at 1260, 1078, and 802 cm−1. Fourier transform infrared spectroscopy studies revealed a wide absorption band between 1093 and 1062 cm−1, which can be attributed to the stretching of Si-O-Si as described previously. 35 Similar results have been reported in other studies 49 In further work, FTIR analysis of neat cenospheres was performed and revealed major peaks at 1065, 794, and 584 cm−1. The absorbance spectrum at 1065 cm−1 corresponds to Si–O–Si asymmetric stretching vibrations, while the peak at 794 cm−1 indicates Si–O–Si symmetric vibrations as was presented by Gohatre et al. 49 An absorption band at 1071 cm−1 was observed in the ATR/FT-IR spectra of neat SBS and attributed to the PS units of SBS. Compared to the spectra of neat SBS, the peak near 1071 cm−1 in SBS/FA composites broadens and intensifies, suggesting that the absorption band at 1078 cm−1 (corresponding to a cyclic Si-O-Si structure) partially overlaps with the band at 1071 cm−1. 50 The detected peak at 802 cm−1 is a characteristic frequency for symmetric valence oscillations of the Si–O and Al–O bonds. 51 Valence oscillations in the 798 cm−1 region can also be attributed to the Si–O bond of quartz. 52 The presence of FA in SBS/FA composites exhibits a net increase in the absorption intensity within the interval of 1062–700 cm−1, likely due to the presence of metal oxides (Al2O3, Fe2O3) according to Aziz et al. 53 In the ATR/FT-IR spectra of SBS/FA + Ag, the distinct broad band at 3200−3500 cm−1 and the robust absorption band at 1634 cm−1 corresponding to the stretching vibration of the -OH group in the crystal lattice water on the surface of silver-coated fly ash. The hydroxyl (–OH) group present on the surface of SiO2 may influence the formation of physical bonding and interfacial dipole-dipole interactions between the fly ash and the polymer matrix, particularly when polymers with polar groups and dipole moments are used as matrices (such as nitrile rubber, polyesters, and polypyrrole), as indicated by several authors.49,54
Raman analysis of the composites
Raman spectra of neat SBS copolymer are identical to spectra of styrene/butadiene copolymer (30% styrene) from the Wiley spectral database. Raman spectra of composites with pure cenospheres have all peaks that are characteristic of SBS on the background of pure cenospheres spectra Figures 13 and 14. Raman spectra of (1) SBS (black line), SBS/FA-10 (green line), (2) SBS/FA-20 (blue line), (3) SBS/FA-30 (red line). Raman spectra of (1) SBS (black line), SBS/FA-10/Ag (green line), (2) SBS/FA-20/Ag (blue line), (3) SBS/FA-30/Ag (red line).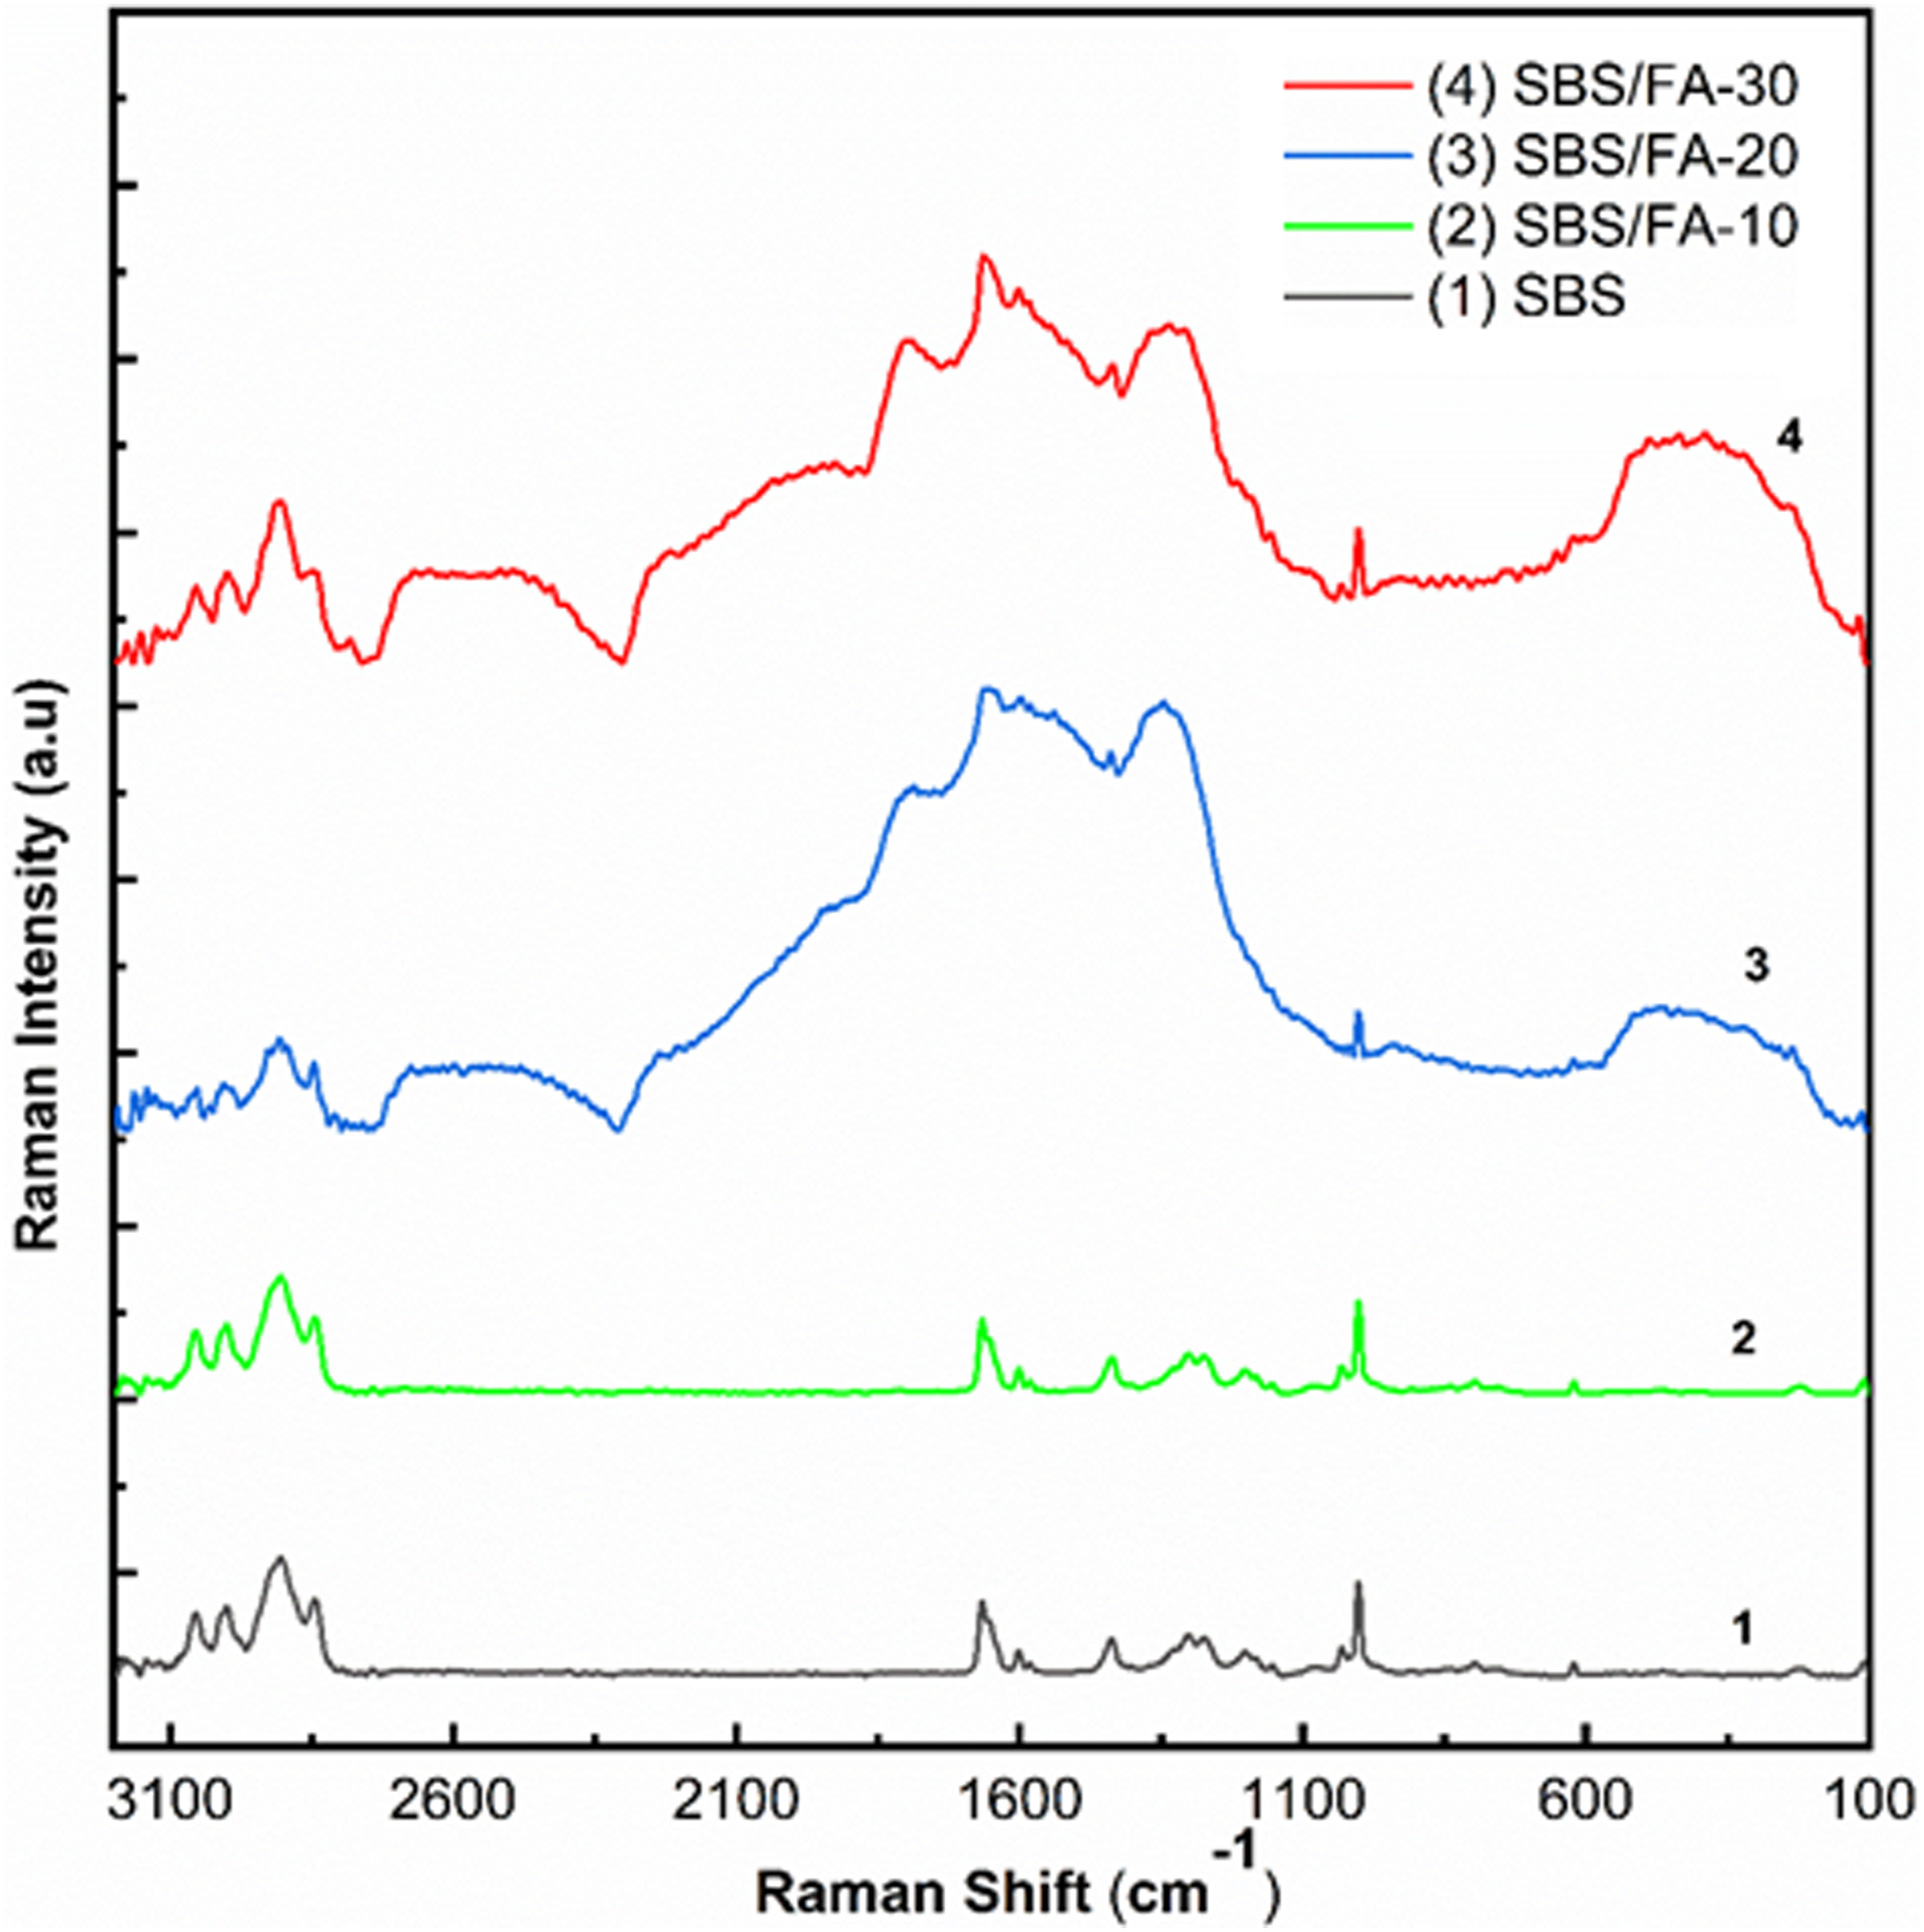
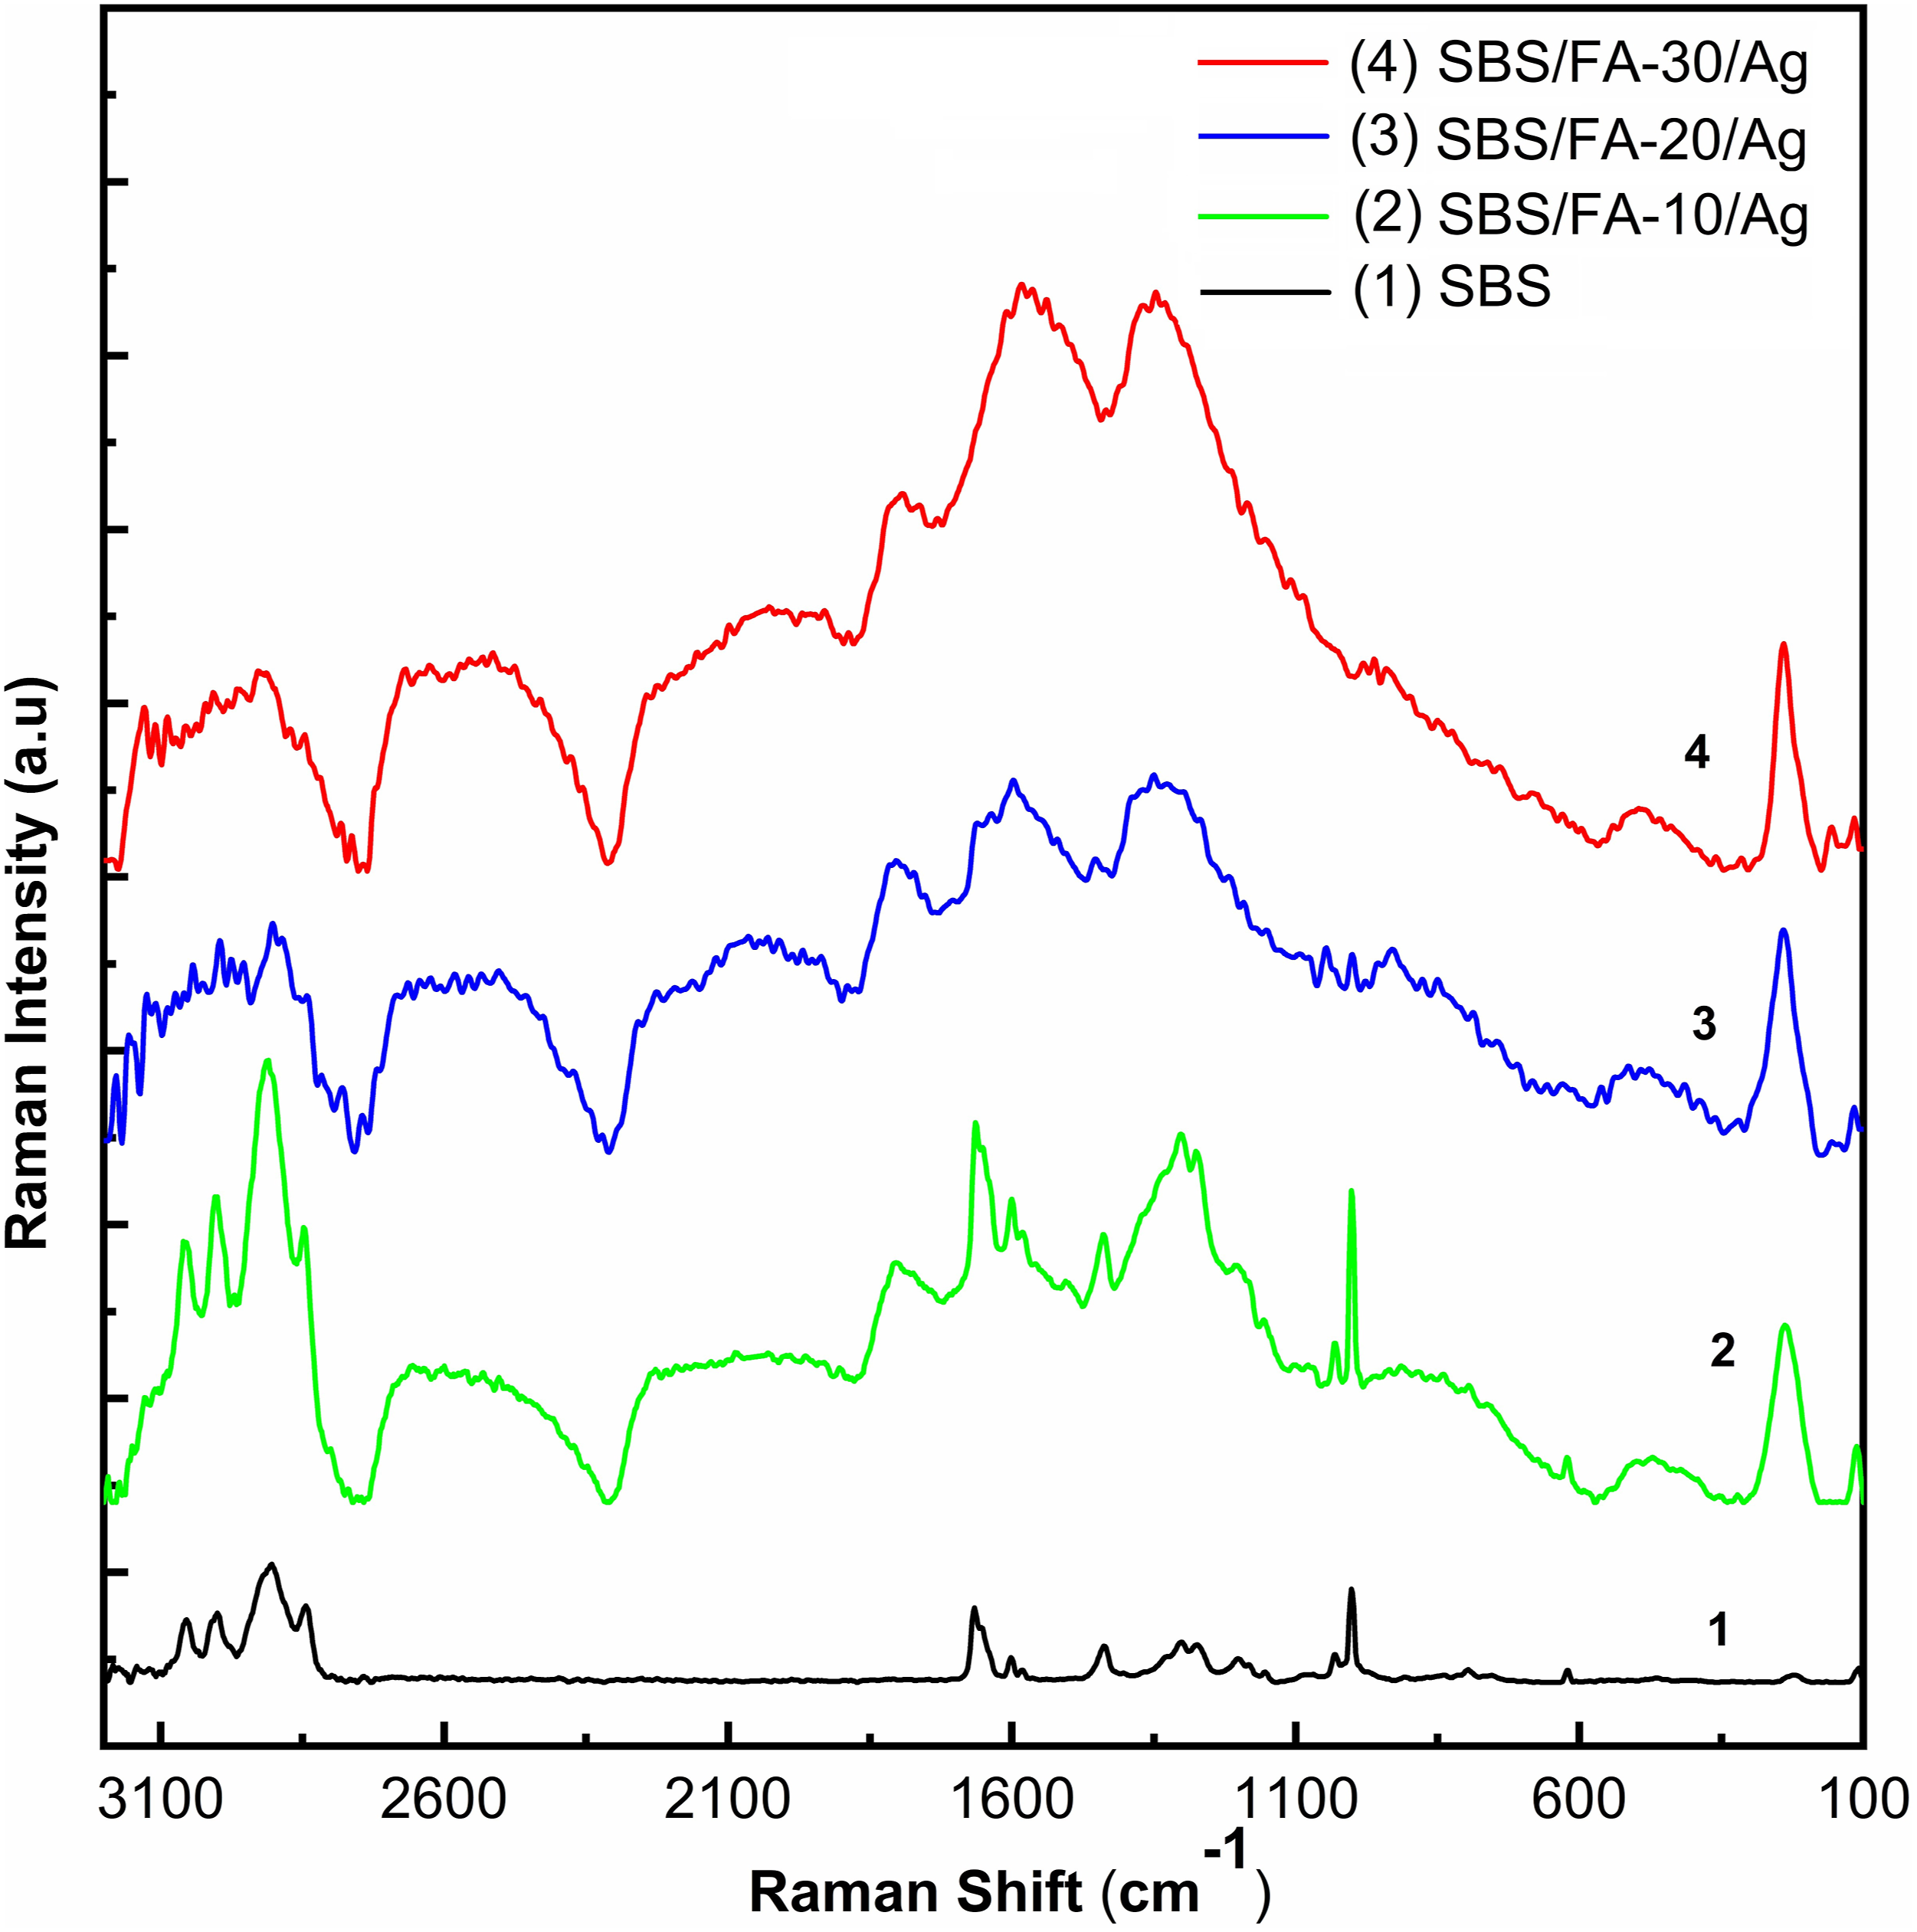
Composites filled with silver-coated cenospheres demonstrate other patterns of Raman spectra. Composite with 10% content of silver coated spheres have a spectrum with all peaks characteristic for SBS and peak at 241 cm−1 which is characteristic for silver coated spheres. Composites with 20% and 30% content of silver-coated spheres have spectra with almost zero intensity of SBS peaks. Bands at 1000 and 1030 cm−1 almost disappear, but weak bands at 981, 962, and 941 cm−1 appear. These bands may be hypothetically assigned to bands of trans-C = C bonds and benzene rings with a wavenumber lowered by π-complex formation with a free orbital in the Ag atom. The disappearance of a band at 1665 cm−1 also may occur, indicating a strong interaction of a double bond or benzene ring with a free orbital in Ag. This strong interaction of silver atoms at the outer layer with the polymer chain may be caused by the inhomogeneity of silver coating, which can be useful for the application of so-prepared silver-coated microspheres for SERS analysis of organic compounds. Also, the significant changes in Raman spectra of composites filled with silver-coated cenospheres may be a consequence of optical effects like non-Raman scattering, increased light absorption of composites and various effects connected with a too-high difference in refraction indices of polymer matrix and the thin metal coating of cenospheres.
TG/DTG analysis of the obtained composites
The TG and DTG curves obtained from the analyses of all SBS/FA composites are presented in Figures 15 and 16. For each composite material, the mass loss factors T5, T10, T50 (temperature at 5, 10 and 50% weight loss, respectively), Tmax (temperature of the maximal rate of decomposition) and the residue after heating to T = 800°C (P800) were calculated. The measurement data are additionally summarized in Table 6. TG curves of SBS/FA composites: (1) SBS (blue line), (2) SBS/FA-10 (black line), (4) SBS/FA-20 (green line), (3) SBS/FA-30 (purple line), (5) SBS/FA-10/Ag (red line). DTG curves of SBS/FA composites: (1) SBS (blue line), (2) SBS/FA-10 (black line), (4) SBS/FA-20 (green line), (3) SBS/FA-30 (purple line), (5) SBS/FA-10/Ag (red line). Thermal properties of SBS, SBS/FA and SBS/FA-10/Ag composites. T5, T10, T50 – temperatures of a sample at 5, 10 and 50% mass loss; P800/% - residue after heating to 800°C, Tmax (temperature of the maximal rate of decomposition).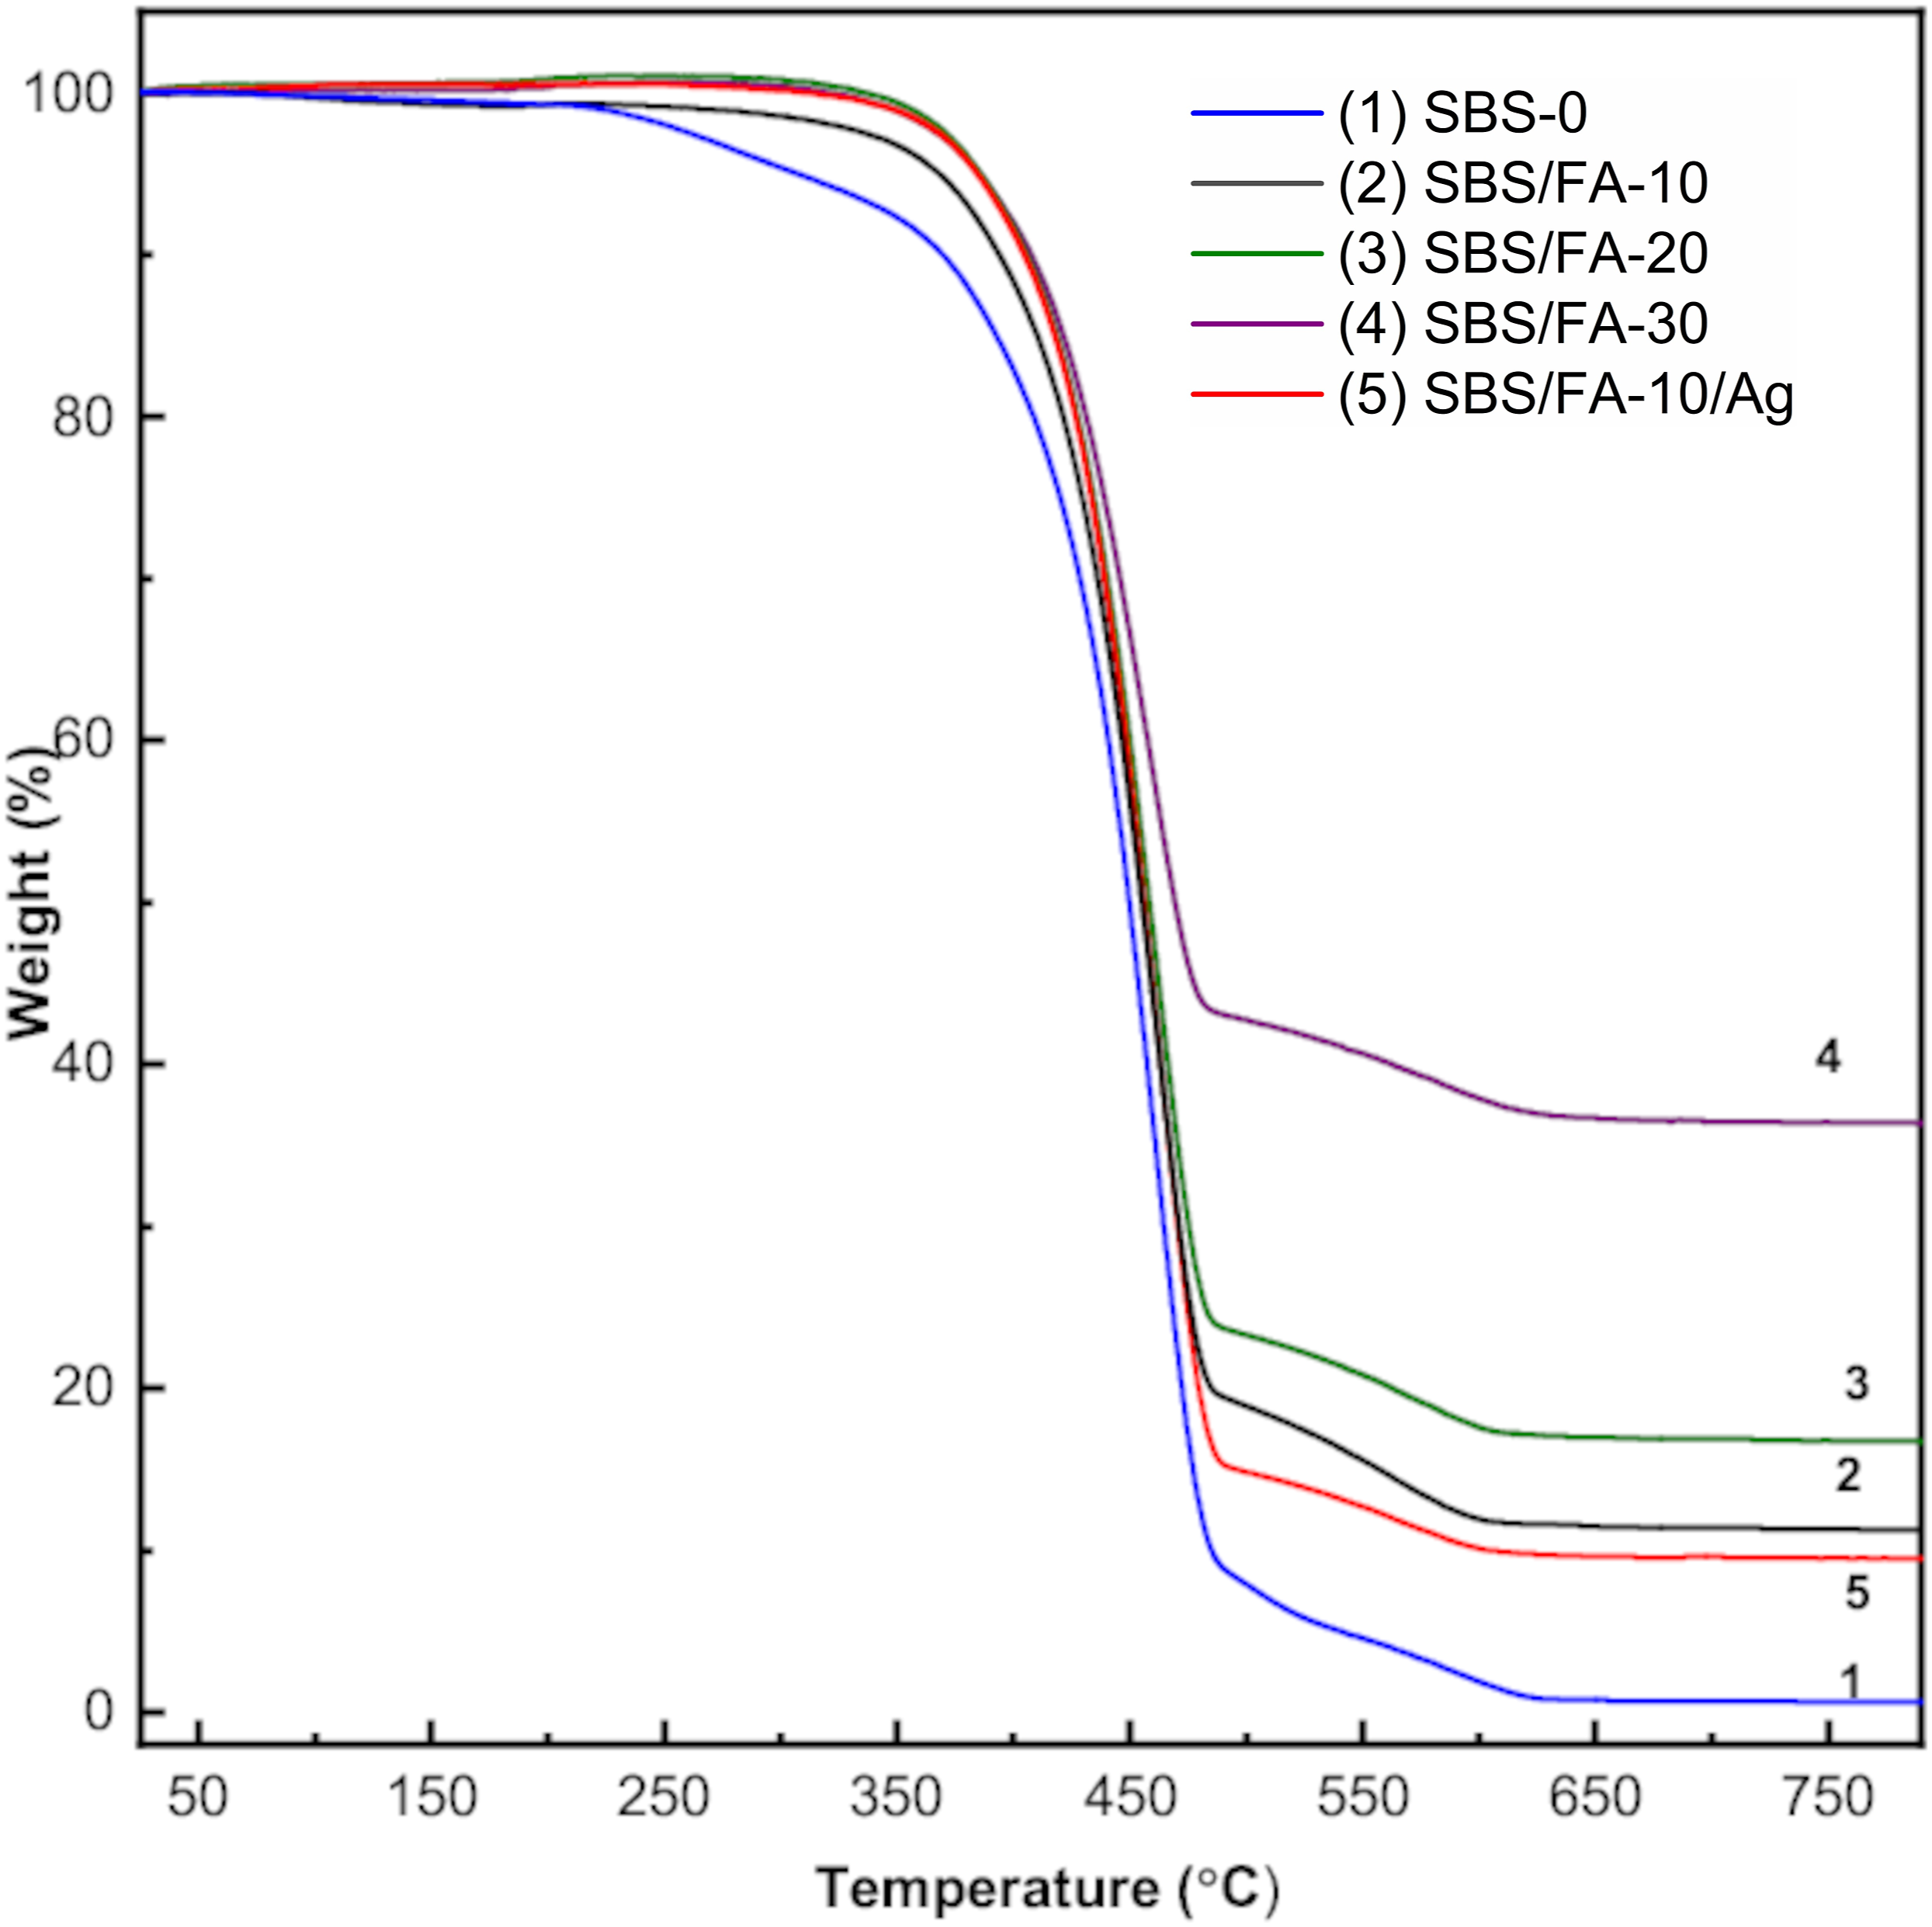
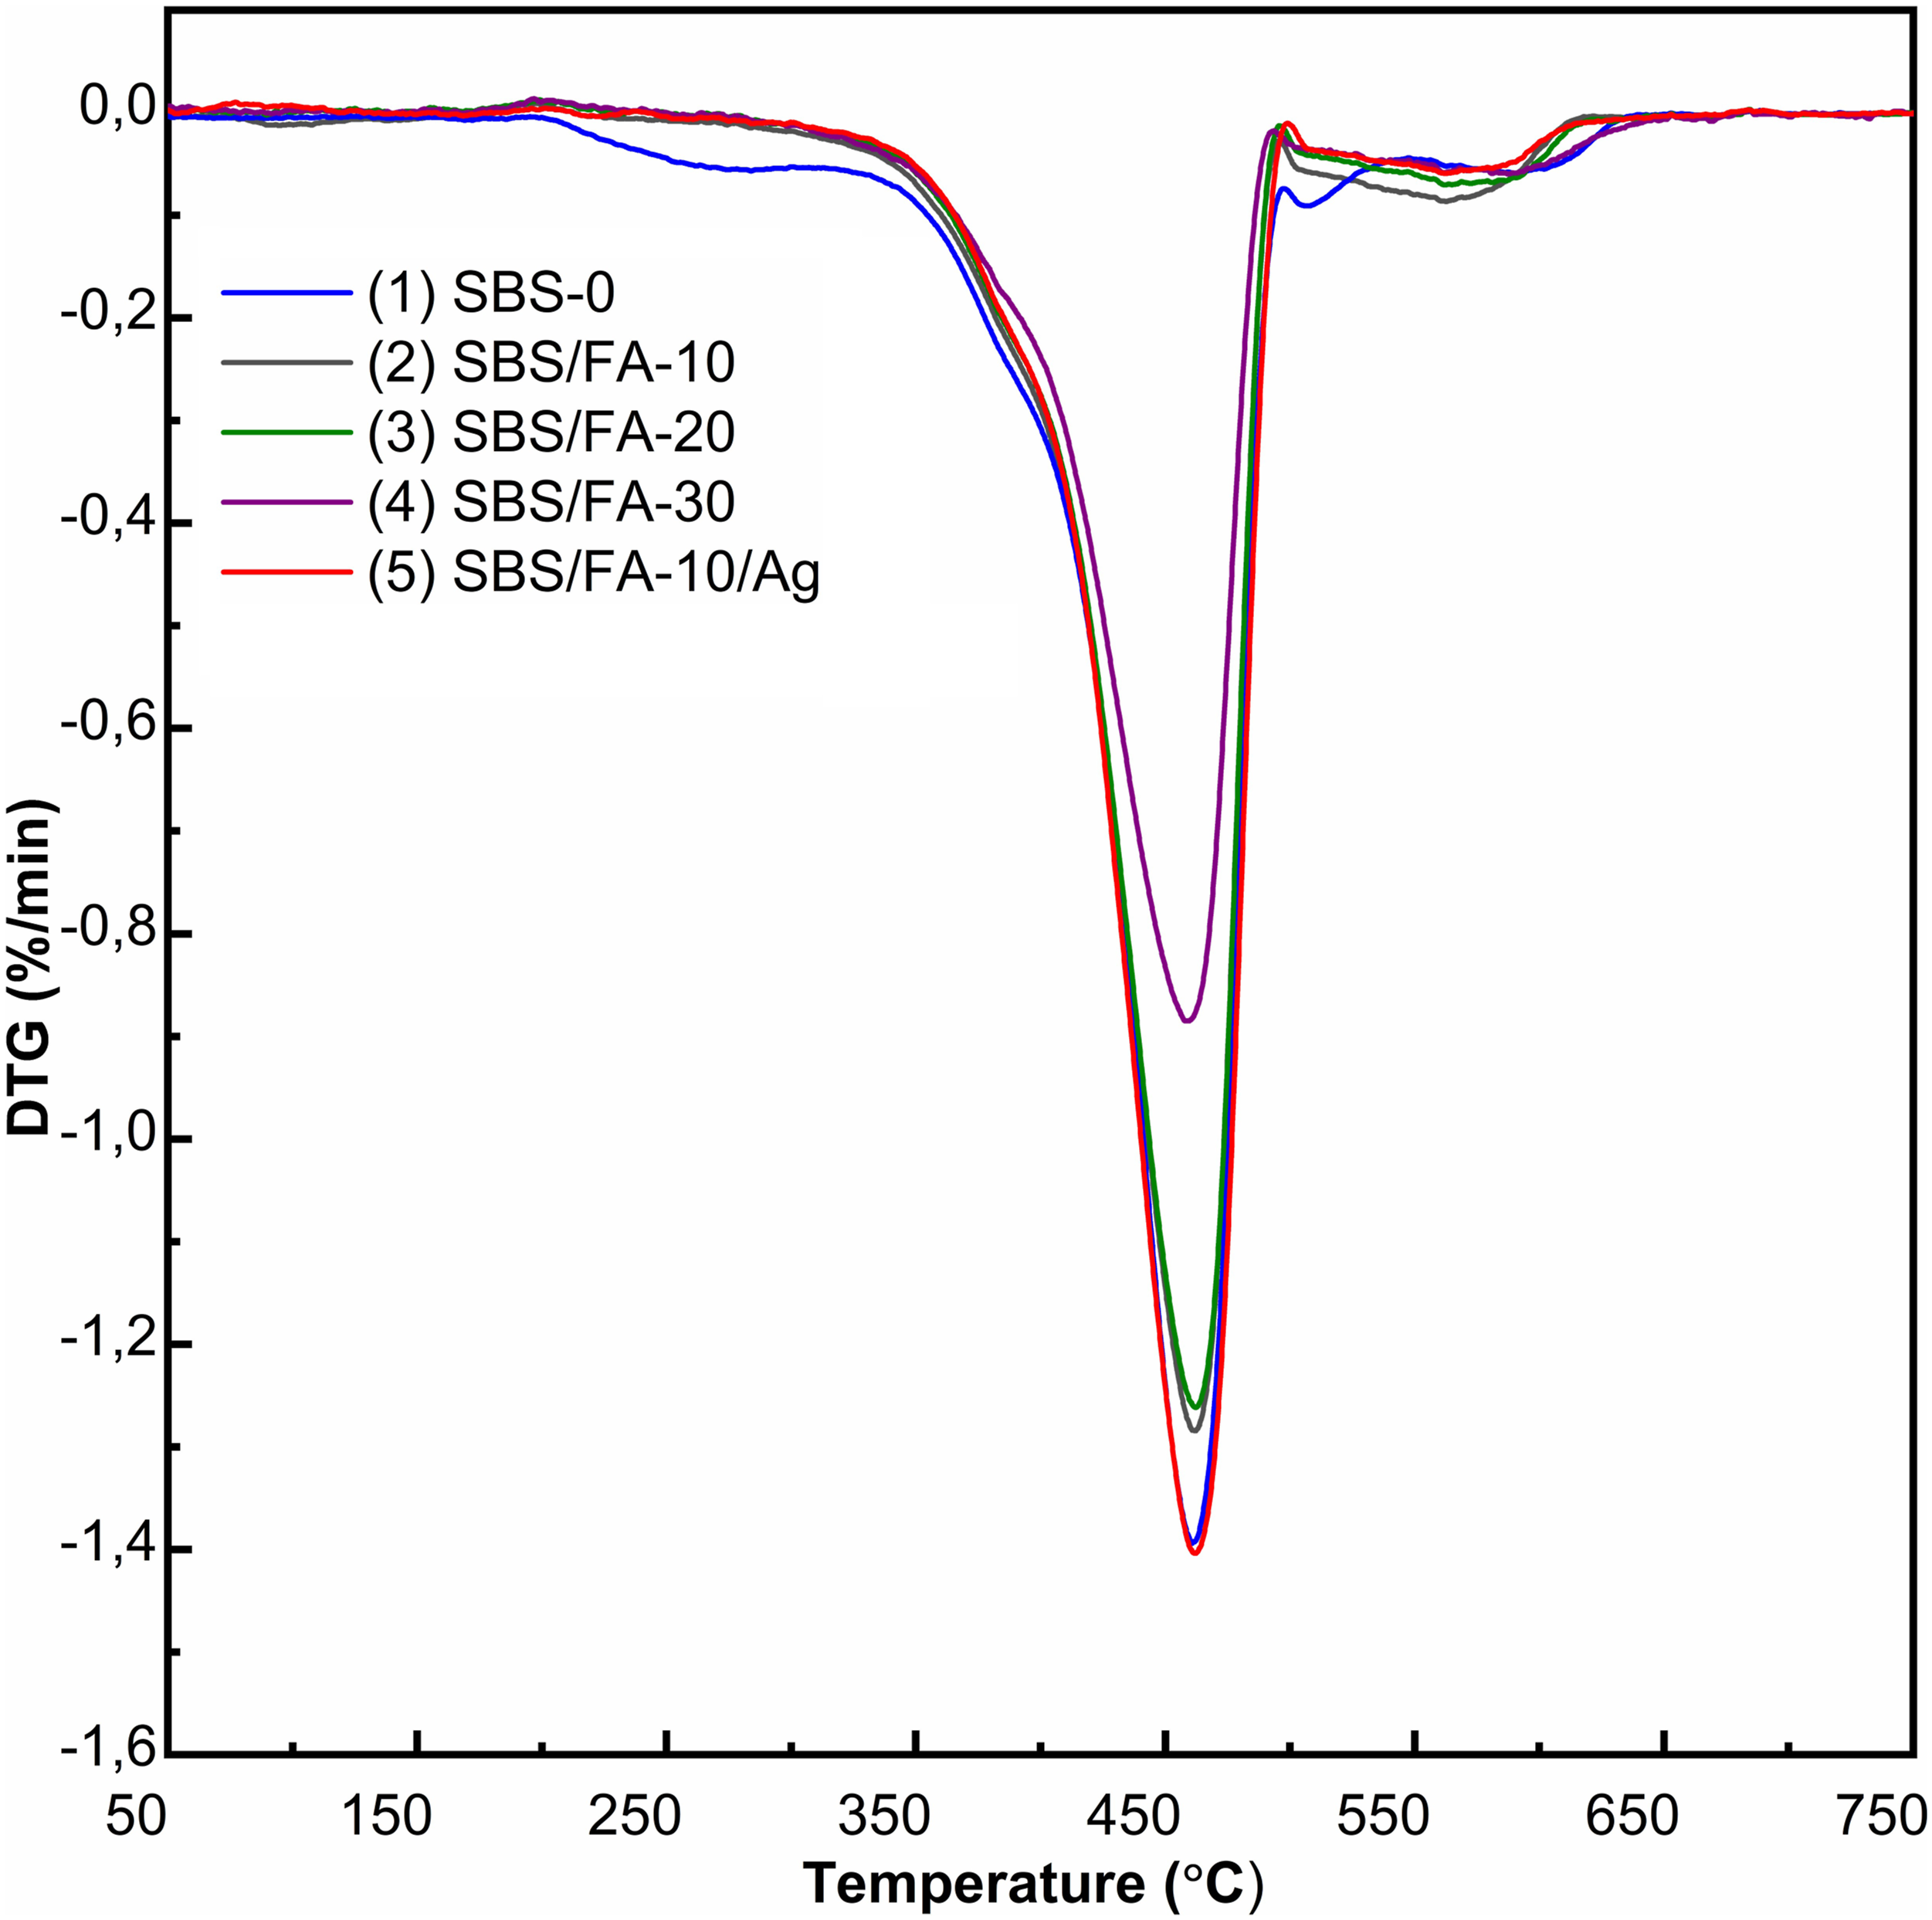
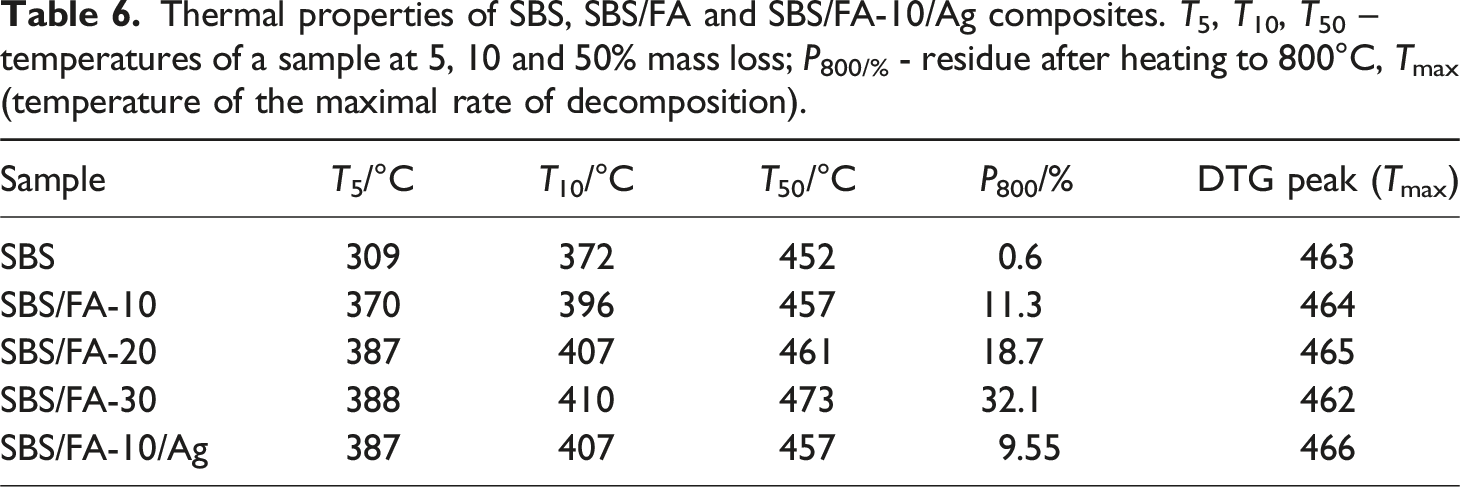
The decomposition process of SBS/FA composites has one major stage. Thermal analysis showed that the FA affects the thermal properties of the SBS/FA composites. The cenosphere filler increases the thermal stability of the tested composition. As shown in Table 4, the cenospheres raise the T5, T10 and T50 indices, and the increase in these thermal parameters is strongly correlated with the quantity of filler. Specifically, T5 considerably increased from 309°C to 370°C when 10% of FA was introduced. A further increase in the filler amount elevates T5 to 387°C and 388°C for SBS/FA-20 and SBS/FA-30, respectively. All SBS/FA composites exhibit the same degradation pattern with slight variation in degradation temperature. The highest thermal resistance was found in the composites with 30 w% of FA. The neat SBS sample without cenosphere filler demonstrated inferior thermal stability parameters. It can be inferred that the addition of fly ash cenospheres leads to the formation of cenosphere layers on the filled composites, and these formed layers can act as protective barriers. The cenosphere content in the filled composites does not change the decomposition pattern. It has been previously established that cenospheres are thermally stable materials, exhibiting no mass loss in the temperature range of 25 − 800°C. 24 The residue after heating to 800°C (P800) is approximately equal to the percentage content of the filler in the samples. The increase in char residue with the addition of FA may suggest enhanced flame resistance of the composite material. Fly ash residue char may form an insulating layer, thereby insulating the undecomposed polymer from degradation during the burning process due to the deceleration of pyrolytic flammable gaseous product evaporation as seen in previous studies2,23 Similar results were also observed in previous studies. 49
A comparison of composites filled with as-received and silver-coated cenospheres at 10% into the polymer matrix revealed that the introduction of silver-coated cenospheres slightly increases the thermal stability of the sample. This could be attributed to the silver on the surface potentially positively affecting the formation of an insulating layer, reducing oxygen transport to the polymer and the reverse transfer of combustion gases formed.
Mechanical properties
Mechanical properties of SBS, SBS/FA and SBS/FA-10/Ag composites.
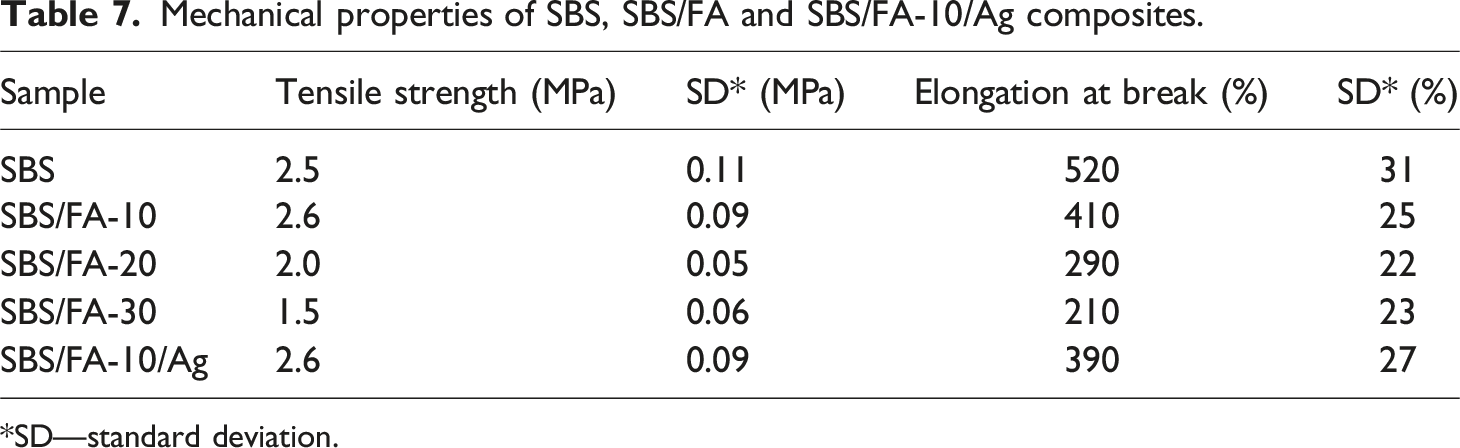
*SD—standard deviation.
Initially, the tensile strength of the composite exhibits a slight increase, reaching up to 10 w% of fly ash and further decreases at higher filler concentrations. This may be attributed to the uniform dispersion of fly ash in the matrix, granting a large interfacial area of content, resulting in better interfacial adhesion. However, beyond 10 w% of fly ash, there is a decrease in tensile strength, possibly due to the agglomeration of fly ash, resulting in a worse interface and dispersion at a higher weight percent of filler, leading to decreased stressed areas. Similar patterns were observed in previous studies25,55,56 indicating that as the filler concentration increases, fly ash cenospheres tend to aggregate, and the tensile strength decreases.
Additionally, the non-reinforced effect of fly ash cenospheres in the SBS matrix may be explained solely by the mechanism of physical interaction between the polymer and filler. The mechanical property of polymer-cenosphere composite is inferior owing to poor interfacial interactions between the hydrophilic cenosphere surface and hydrophobic polymer. 57 Surface treatment of cenospheres, especially with a silane coupling agent, is found to improve the interfacial interactions due to the mechanism of chemical interaction. 58
Elongation properties, as seen in Table 2, decrease with the addition of filler, indicating interference by the filler in the mobility or deformability of the matrix. This interference is created through the physical interaction and immobilization of the polymer matrix by the presence of mechanical restraints. Therefore, as the filler concentration increases, the elongation at break is reduced. The silver coating on the fly ash does not influence the change in strength characteristics compared to the SBS/FA-10 composite with the same percentage of fly ash filling. The elongation at the break due to the filler presence has approximately the same character as for ABS + FA as described. 21 Here, the drop in elongation at break is about 68-50% for 30% filler content, the results of the present work give a 59% drop for that filler mass percentage. The corresponding value of elongation at break drop for Polyester – FA (30%) composite is 95% as was proved in Sreekanth et al. 25 The approximate value is also obtained for the Methyl Methacrylate– Acrylonitrile-Butadiene–Styrene + FA system (32%) as was indicated in the work of Kulkarni and Mahanwar. 59
High-temperature stability of fly ash cenospheres and their hollow structure can improve the fire resistance of composite due to the concentration of filler in the destruction surface and defense of internal polymer from heat flow.
Conclusion
In this study, a possible way to utilize industrial residual products (fly ash) in elastomer composite materials based on SBS has been demonstrated. SBS/FA and SBA/FA + Ag composites containing different FA content were prepared by a solution mixing technique. The structure and morphology of composite materials were examined by Fourier-transform infrared spectroscopy (FTIR) in ATR mode, Raman scattering and scanning electron microscopy (SEM). From the test results above, it has been shown that the FA content has a great effect on the structure and properties of SBS/FA composites. Compared to the neat SBS, an increase in the total intensity was observed in the region of stretching vibrations of 1700 cm−1 - 800 cm−1. The ATR/FT-IR spectra of SBS/FA composites revealed new absorption bands at 1260, 1078 and 802 cm−1 corresponding to the Si-O-Si, Si–O and Al–O tetrahedra valence oscillations. The Raman study of composite materials shows the formation of an oxide layer on the surface of silver-coated cenospheres. Changes in Raman spectra of composites with 20% and 30% content of silver-coated cenospheres could be evidence of both physical and chemical interaction between polymer matrix and silver-coated cenospheres. The density of the composite material decreased with an increase in the mass fraction of fly ash.
SEM and optical microscopy showed that the solution mixing method allows for the production of composite materials characterized by uniform dispersion of filler without large particle aggregates and with predominantly unbroken cenospheres. Thermal analysis in an oxygen atmosphere showed that the fly ash (FA) caused an increase in the thermal stability of the tested composition. The temperatures of SBS/FA composites at 5% mass loss are on average 70°C higher than those of the unfilled SBS sample. The increase in char residue with the addition of FA suggests enhanced flame resistance of the composite material. Fly ash residue char may form an insulating layer, thereby protecting the undecomposed polymer from degradation during the burning process by slowing the evaporation of pyrolytic flammable gaseous products. The tensile strength of the composite exhibits a slight increase, reaching up to 10 w% of fly ash, and further decreases at higher filler concentrations possibly due to the agglomeration of fly ash, resulting in a poorer interface and dispersion at a higher weight percentage of filler. This study revealed that FA can be successfully used as a flame-retardant filler in composite material based on SBS.
Footnotes
Acknowledgements
This work was carried out using the equipment of the Center of Shared Usage “New Materials and Technologies” of Emanuel Institute of Biochemical Physics, Joint Research Center of Plekhanov Russian University of Economics.
Declaration of conflicting interests
The author(s) declared no potential conflicts of interest with respect to the research, authorship, and/or publication of this article.
Funding
The author(s) received no financial support for the research, authorship, and/or publication of this article.