
Abstract
The scholarly examination delves into Kinetic Analysis of Polypropylene Homopolymer (HPP) when augmented with Unmodified Minor Mineral Fuller’s Earth (UMMFE). UMMFE, HPP, and HPP composites were analyzed for their functional groups using FTIR. FTIR spectra of the FE-filled composites indicated a slight weakening, evident from the broadening of the absorption peak at 1376 cm-1, which is characteristic of polypropylene. Additionally, a peak at 1020 cm-1, corresponding to the Al-Si-O bond of clay, was also observed in the HPP composites. The various intricacies governing HPP degradation by loading of UMMFE were meticulously analyzed with the help of Thermogravimetric analysis (TGA) using single heating rate of 10°C/min and contrasted with those of unreinforced HPP employing congruent processing conditions to underscore the pivotal role played by UMMFE. The kinetic parameters were calculated using two methods: Coats–Redfern (CR), Broido’s (BR) method respectively. The activation energy values for HPP in first phase of degradation ranged from 104 to 286 kJ/mol in the conversion range of 0.2 to 0.9. Interestingly, the apparent activation energy from CR method in second phase of degradation universally in context to prepared compositions were observed to decrease in conversion range from 0.2 to 0.5, indicating a reduction in endothermic reactions. Conversely as observed in general from 0.6 to 0.9 degree of conversion, activation energy increased, suggesting occurrence of exothermic reactions during pyrolysis. Similarly, the activation energy values were calculated using BR which exhibited behavior analogous to that observed with CR Method. Despite obtaining similar trends in activation energy by both methods, the results were also revalidated by calculating standard deviation which fetched a result of 0.04 kJ/mol for first phase and 7.21 kJ/mol for second phase of degradation. The study revealed potential of the prepared composite for sustainable bio-fuel production, designing pyrolysis reactors and facilitate recycling after end-of-life from the products processed thereof.
Keywords
Highlights
• Activation energy for pyrolysis was determined using Coats–Redfern and Broido methods. • Statistical analysis was performed to validate the precision of the calculated activation energy values. • Novelty lies in the kinetic modeling of PP-based composites reinforced with unmodified Fuller’s Earth, integrating dual-method estimation and statistical validation to address environmental concerns related to commodity plastic waste.
Introduction
In the contemporary context of climate alteration and global-warming, exacerbated in certain areas by politico-social factors, the prudent use of both natural and fossil resources is paramount. With the population exponentially mounting, there is an increasing need to ensure the sustainability based on green ideologies. This entails not only responsible utilization of natural resources but also judicious consumption of fossil reserves. The concept of a circular economy emphasizes on the importance of adopting best practices across the entire lifecycle of products, from resource extraction to manufacturing, product usage, recycling and the reincorporation of materials into the production cycle to minimize waste. 1 The plastics processing industry, heavily reliant on fossil fuels, perpetuates a “carbon lock-in” across its value chain, contributing to substantial and growing CO2 emissions. 2
In recent decades, PP has emerged as one of the most extensively used thermoplastics, owing to its extraordinary properties, economic efficiency and ease of processing. Significant progress has been made in the development and utilization of PP, resulting in its widespread applications across various industries. 3
Polypropylene (PP) is widely utilized in diverse engineering domains including automotive, biomedical, energy, machinery components and electronic packaging. However, despite its versatility, PP frequently falls short in meeting specific engineering requirements, particularly regarding thermal properties and mechanical strength. Notably, PP exhibits a low melting point, susceptibility to flammability and restricted heat resistance. 4
Consequently, there has been ongoing efforts to enhance various properties of PP through matrix modification. One approach to achieve this is by incorporating reinforcements in the form of foreign bodies. Incorporating inorganic fillers such as glass fiber, carbon fiber, calcium carbonate, fly ash, among others, alongside organic natural fibers, offers an alternative means to reinforce Polypropylene (PP). 5
In the current study, Polypropylene Homopolymer (HPP) material combined with Unmodified Minor-Mineral Fuller’s Earth (UMMFE) – Matrix Modifier was used to carry out the study on the enhancement of properties of HPP/UMMFE composite which underwent melt processing using a co-rotational twin-screw extruder.
Fuller’s Earth primarily consists of Hydrous Aluminum Silicates, comprising attapulgite, montmorillonite, and kaolinite, with a marginal volume of additional minerals like calcite, dolomite and quartz. 6 Fuller’s Earth has been a distinct type of clay which has been employed for cleansing woollen garments, a practice with a heritage stretching back nearly seven millennia. The term ‘Fulling’ was originated to delineate the procedure of cleansing and densifying textiles, with practitioners of this craft being denoted as ‘Fullers,' thus attributing the designation ‘Fuller’s Earth’ to this clay. In addition to its cleansing properties, Fuller’s Earth was also utilized as an antidote for poison, owing to its extraordinary absorption capabilities. 7 Beyond its cleansing and adsorption abilities, it is also employed in cosmetics to tone the skin, soothe wrinkles and act as a deep pore cleanser, due to its capacity for oil and grease absorption. 8 Fuller’s earth has been used in environmental remediation efforts to remove contaminants from soil and water. Its ability to absorb and adsorb pollutants, makes it valuable in cleaning up contaminated sites, restoring ecosystems and protecting human health. 9 Moreover, UMMFE is suggested to offer wider industrial applications compared to modified nano-clay/clay given that the alteration process for the latter involves several commercial exigencies.
Considering its abundant availability, economic viability and thermal resilience, Fuller’s Earth presents a promising avenue for augmenting the characteristics of polymers, notably Polypropylene. Fuller’s Earth serves as a reinforcing filler in polymer composites with anticipation of elevating the mechanical attributes including tensile strength and flexural strength. This reinforcement effect can lead to the development of composites with improved structural integrity and durability. Moreover, Fuller’s earth possesses good thermal stability, which can help improve the heat resistance of polymer composites. This is particularly advantageous in applications where the composite material is exposed to high temperatures or thermal cycling. Fuller’s Earth is relatively abundant and cost-effective compared to some other filler materials used in polymer composites. Its availability and affordability make it an attractive option for enhancing the properties of polymers without significantly increasing production costs. 10 Overall, Fuller’s Earth could offer a versatile and cost-effective means to elevate the mechanical, thermal and functional properties of polymer composites, suggesting it to be a valuable additive in various industrial applications. Thermogravimetric analysis (TGA) emerges as the preferred technique for assessing combustion traits and kinetic parameters, esteemed for its simplicity and precision. Parameters derived from TGA analysis shed light on Activation Energies of materials. 11 It is evident to state that high activation energy correlates directly with enhanced flame retardancy, as it fosters the creation of a suitable char residue that fortifies resistance to flammability.12,13 Further investigation is warranted to address the gap in kinetics studies concerning UMMFE reinforced HPP composites, considering the ample availability of Fuller’s Earth. To the utmost extent of our understanding, exhaustive inquiries into the kinetics of thermal degradation within HPP/UMMFE composites have yet to be pursued. Therefore, this study aimed to provide an all-encompassing examination of the kinetics study of HPP/UMMFE composites using Thermogravimetric Analysis. The kinetic parameters were extrapolated from TG experimental data employing Coats-Redfern (CR) 14 and Broido’s (BR) methods. 15
Tiwari et al. 16 investigated the thermal degradation behavior and kinetics of epoxy composites containing varying fly ash contents (0, 2.5, 5 and 7.5 wt%). The thermal stability and degradation characteristics of the fly ash–modified epoxy systems were analyzed using thermogravimetric analysis (TGA). The kinetic parameters were determined using the Coats–Redfern, Broido, and Horowitz–Metzger models through best-fit analysis, and the results were validated using linear regression techniques.
Kumar et al. 17 carried out a comprehensive kinetic and thermodynamic analysis of cellulose components extracted from waste leaves of Butia monosperma using TGA. The Coats–Redfern method was applied across 21 different reaction mechanism models to identify the most suitable degradation pathway, highlighting the complex multi-step degradation behavior of lignocellulosic biomass.
The novelty of the present work lies in the comprehensive thermal degradation kinetics of Polypropylene reinforced with Unmodified Minor Mineral Fuller’s Earth (UMMFE), which has not been previously reported in literature. Unlike studies involving modified clays or synthetic fillers, this work employs an unmodified, naturally available clay, evaluating its role in altering thermal stability and reaction kinetics of the matrix. The dual-method approach (CR and BR) with detailed conversion-based activation energy assessment and statistical consistency analysis further enhances the analytical depth of the study. Furthermore, the rationale behind analyzing the pyrolysis suitability using these two kinetic methods is rooted in the dominance of Polypropylene (PP) among commodity plastics. PP constitutes a significant proportion of global plastic waste, contributing heavily to environmental pollution and municipal solid waste streams. 18 Thus, understanding the thermal degradation behavior of PP-based composites is essential for developing efficient recycling, waste-to-energy, and environmental mitigation strategies.
The selection of Fuller’s Earth as a reinforcement was based on prior evidence of its beneficial impact on thermal stability and mechanical integrity in HPP composites, as demonstrated in our earlier work. 10 While the earlier study reported on the processing, experimentation, and characterization of HPP/UMMFE composites, the present work advances beyond experimental reporting by providing a detailed kinetic interpretation of thermal degradation behavior through established analytical models and statistical validation, thereby constituting a deeper analytical study.
Materials and methods
PP Homopolymer (HPP) (Polysure M12RR) was provided by M/s HPCL-Mittal Energy Limited, India, boasting a Melt Flow Index (MFI) of 12 g/10 min (230°C/2.16 kg) and a density of 0.90 g/cm3.
Unmodified Minor Mineral Fuller’s Earth (UMMFE) is a sedimentary clay sourced from India and supplied by P.R. Corporation Pvt. Ltd., Baroda, Gujarat, characterized by a bulk density of 0.3584 g/cm3, a refractive index of 1.50 and an off-white coloration. UMMFE serves as the filler for the prepared composite. It’s worth noting that UMMFE exhibits a variable composition that may fluctuate depending on its source. Following our earlier methodology, details used in this study are taken from our previous work. 10
HPP and UMMFE underwent pre-drying/dehumidification in a Hot Air Oven (M.S. Scientific Instruments Work, New Delhi) at 80°C for 8 h to eliminate any moisture content prior to extrusion. The pre-dried sample was then stored in a zip lock carrier and subsequently melt-mixed in a co-rotating twin-screw extruder (Specific ZV 20, S.E.A. India), equipped with a screw length of 820 mm and integrated with a strand pelletizer and a volumetric feeder.
Classification and constitution of HPP/UMMFE composite materials.
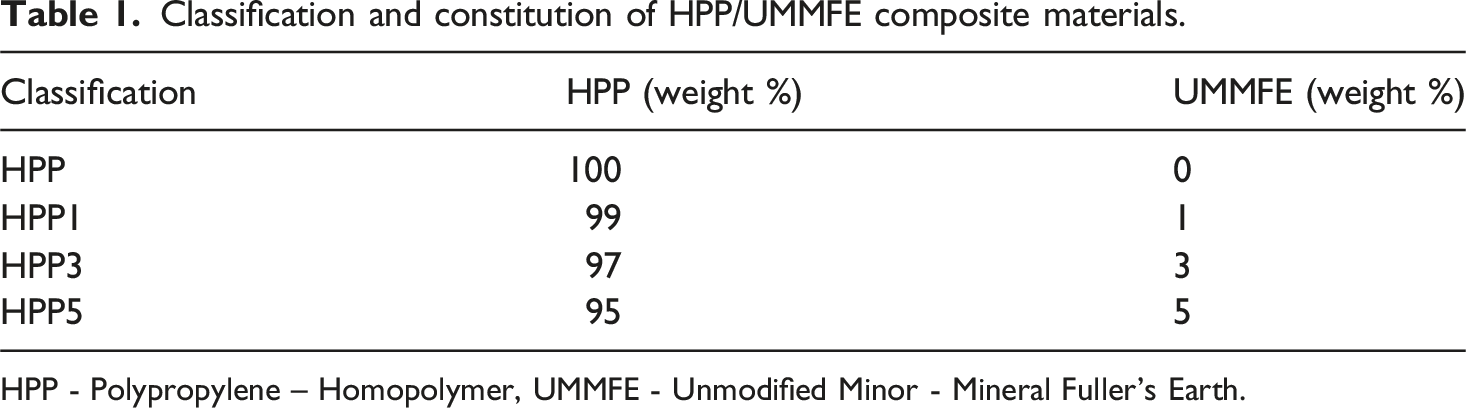
HPP - Polypropylene – Homopolymer, UMMFE - Unmodified Minor - Mineral Fuller’s Earth.
The process was conducted at a screw rotation speed of 40–42 rpm and temperatures ranging from 180°C to 215°C across different zones (from feed to die zone). The extrudate was subsequently cooled in water at room temperature, pelletized, and then dehydrated. Samples were prepared afterward using a Toshiba 80 Tons injection molding machine (Shibaura Machine Co., Ltd., Japan). 10
Testing & characterisation
Thermogravimetric analysis (TGA)
Thermal properties of HPP/UMMFE Composites were estimated using a TGA 8000 instrument (Perkin Elmer, USA). The samples, weighing between 10 and 12 mg, were heated from room temperature to 600°C at a rate of 10°C/min. The TGA apparatus comprised of a heating element, a precision analytical balance, a gas delivery system and a data acquisition module. During TG experiments, nitrogen gas, functioning as an inert non-reactive medium, was introduced at a flow rate of 50 mL/min. The various compositions might initially contain moisture, which evaporates at elevated temperatures during pyrolysis. To delineate the thermal decomposition pattern of HPP & HPP/UMMFE composite, specific temperature ranges were considered.
Fourier transform infrared spectroscopy (FTIR)
FTIR studies of UMMFE and PP Composites were evaluated using Fourier Transform Infrared Spectrophotometer (Perkin Elmer spectrum 2 FTIR with quest ATR) over a wavelength range of 4000-400 cm -1.
The compositional analysis along with TG/DTG thermograms of both the unfilled HPP (bare sample) and the composite samples reinforced with UMMFE was comprehensively reported in our previous experimental study on the same system. 10
Kinetic modeling
Thermal kinetics are analyzed via model fitting and model-free methods using TGA data. Iso-conversion techniques in model-free method to determine activation energy, which varies with the degree of conversion. 19
It has been depicted that the results of kinetic studies are affected by variables such as the surrounding atmosphere, gas flow rate, heating rate and the mathematical methods used to derive the data. This paper detailed the suitability to pyrolysis process of the HPP/UMMFE composite, employing the Coats-Redfern
14
model fitting method and Broido’s
15
method with a single heating rate across various decomposition phases.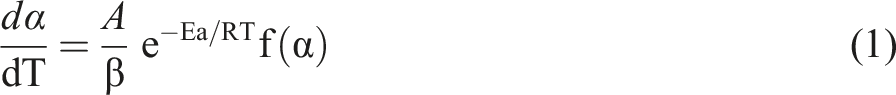
Coats-redfern (CR) method
The Coats and Redfern (CR) method is extensively utilized as a non-isothermal model-fitting technique in the kinetic assessment of thermal decomposition across a spectrum of polymeric materials and biomass substrates.
20
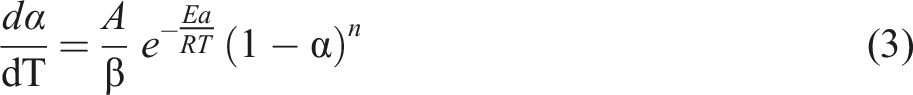
The mathematical expression for the rate of non-isothermal solid decomposition
21
can be represented as a function within this integral method as follows: f(α)

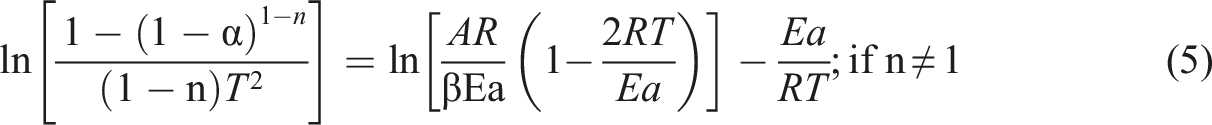

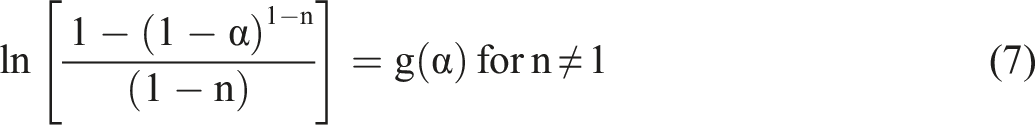

The linear graphs were plotted between ln[
These calculations of slope and intercept aid in estimating the activation energy Ea and pre-exponential factor A, utilizing the gas constant R = 8.314 J/(mol k− 1).
BROIDO’S method
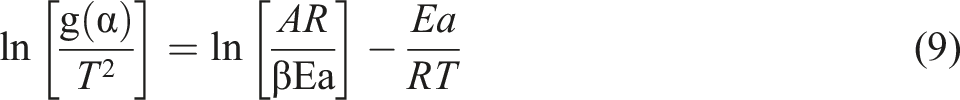
Broido introduced a straight-forward yet approximate mathematical model for determining the activation energy (Ea) under a single constant heating rate (β) during the pyrolysis process. In this approach, the thermal degradation process is assumed to follow first-order kinetics, and the computations are conducted accordingly.
15
The activation energy corresponding to each stage of decomposition was computed using the Broido’s method. The equation employed for the calculation of activation energy (Ea) is
Results and discussion
Fourier transform infrared spectroscopy
Characteristic absorption peaks of UMMFE, HPP, HPP/UMMFE composites using FTIR.
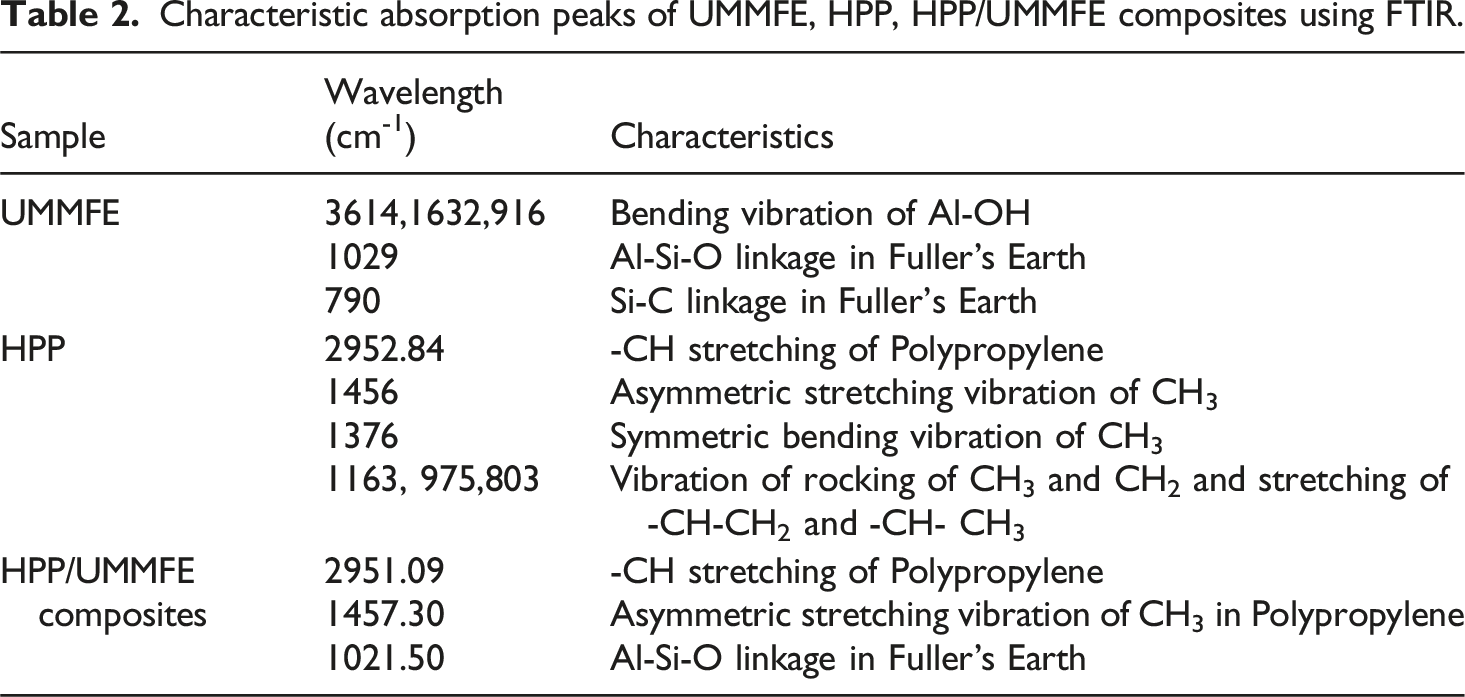
Polypropylene (PP) displays characteristic peaks at 1456 cm-1, corresponding to the asymmetric stretching vibration of CH3, and at 1376 cm-1, representing the symmetric bending vibration of CH3. 24 Additionally, characteristic bands at 1163 cm-1, 975 cm-1, and 803 cm-1 are associated with the rocking vibrations of CH3 and CH2 and the stretching vibrations of -CH-CH2 and -CH-CH3 groups. 21 In the FTIR spectra of fuller’s earth (FE)- filled composites, 26 a slight weakening and broadening of absorption peaks at 1376 cm-1 was observed. The peak at 1020 cm-1 corresponds to the Al-Si-O linkage present in the clay. 27
The FTIR spectra of the unfilled HPP and the UMMFE-reinforced composites have been previously presented and discussed in detail in our earlier publication. 10
Evaluation of the calculated kinetic parameter
The kinetic parameters of the formulated HPP/UMMFE composites, including activation energy and regression factor for pyrolysis, were ascertained utilizing the data obtained from Thermogravimetric analysis (TGA) conducted at a heating rate of 10°C/min.
The linear regression curves resulting from these methodologies have been tabulated and graphed for the conversion range α of 0.2 to 0.9. It is noteworthy that considered points were only between 0.2 and 0.9 conversion as a distinct fitting with low correlation were noticed in both methods beyond mentioned range similar findings were also observed in Damartzis, T et al. 28
Despite some datapoints being excluded due to poor correlation, the overall quality of the computed activation energy remains largely unaffected, as the assumption of constant activation energy across most experimental datapoints holds true.
Kinetic parameter evaluated through coats-redfern method
Activation energy Ea and correlation coefficient R2 of HPP and HPP/UMMFE composite calculated using Coats Redfern method.
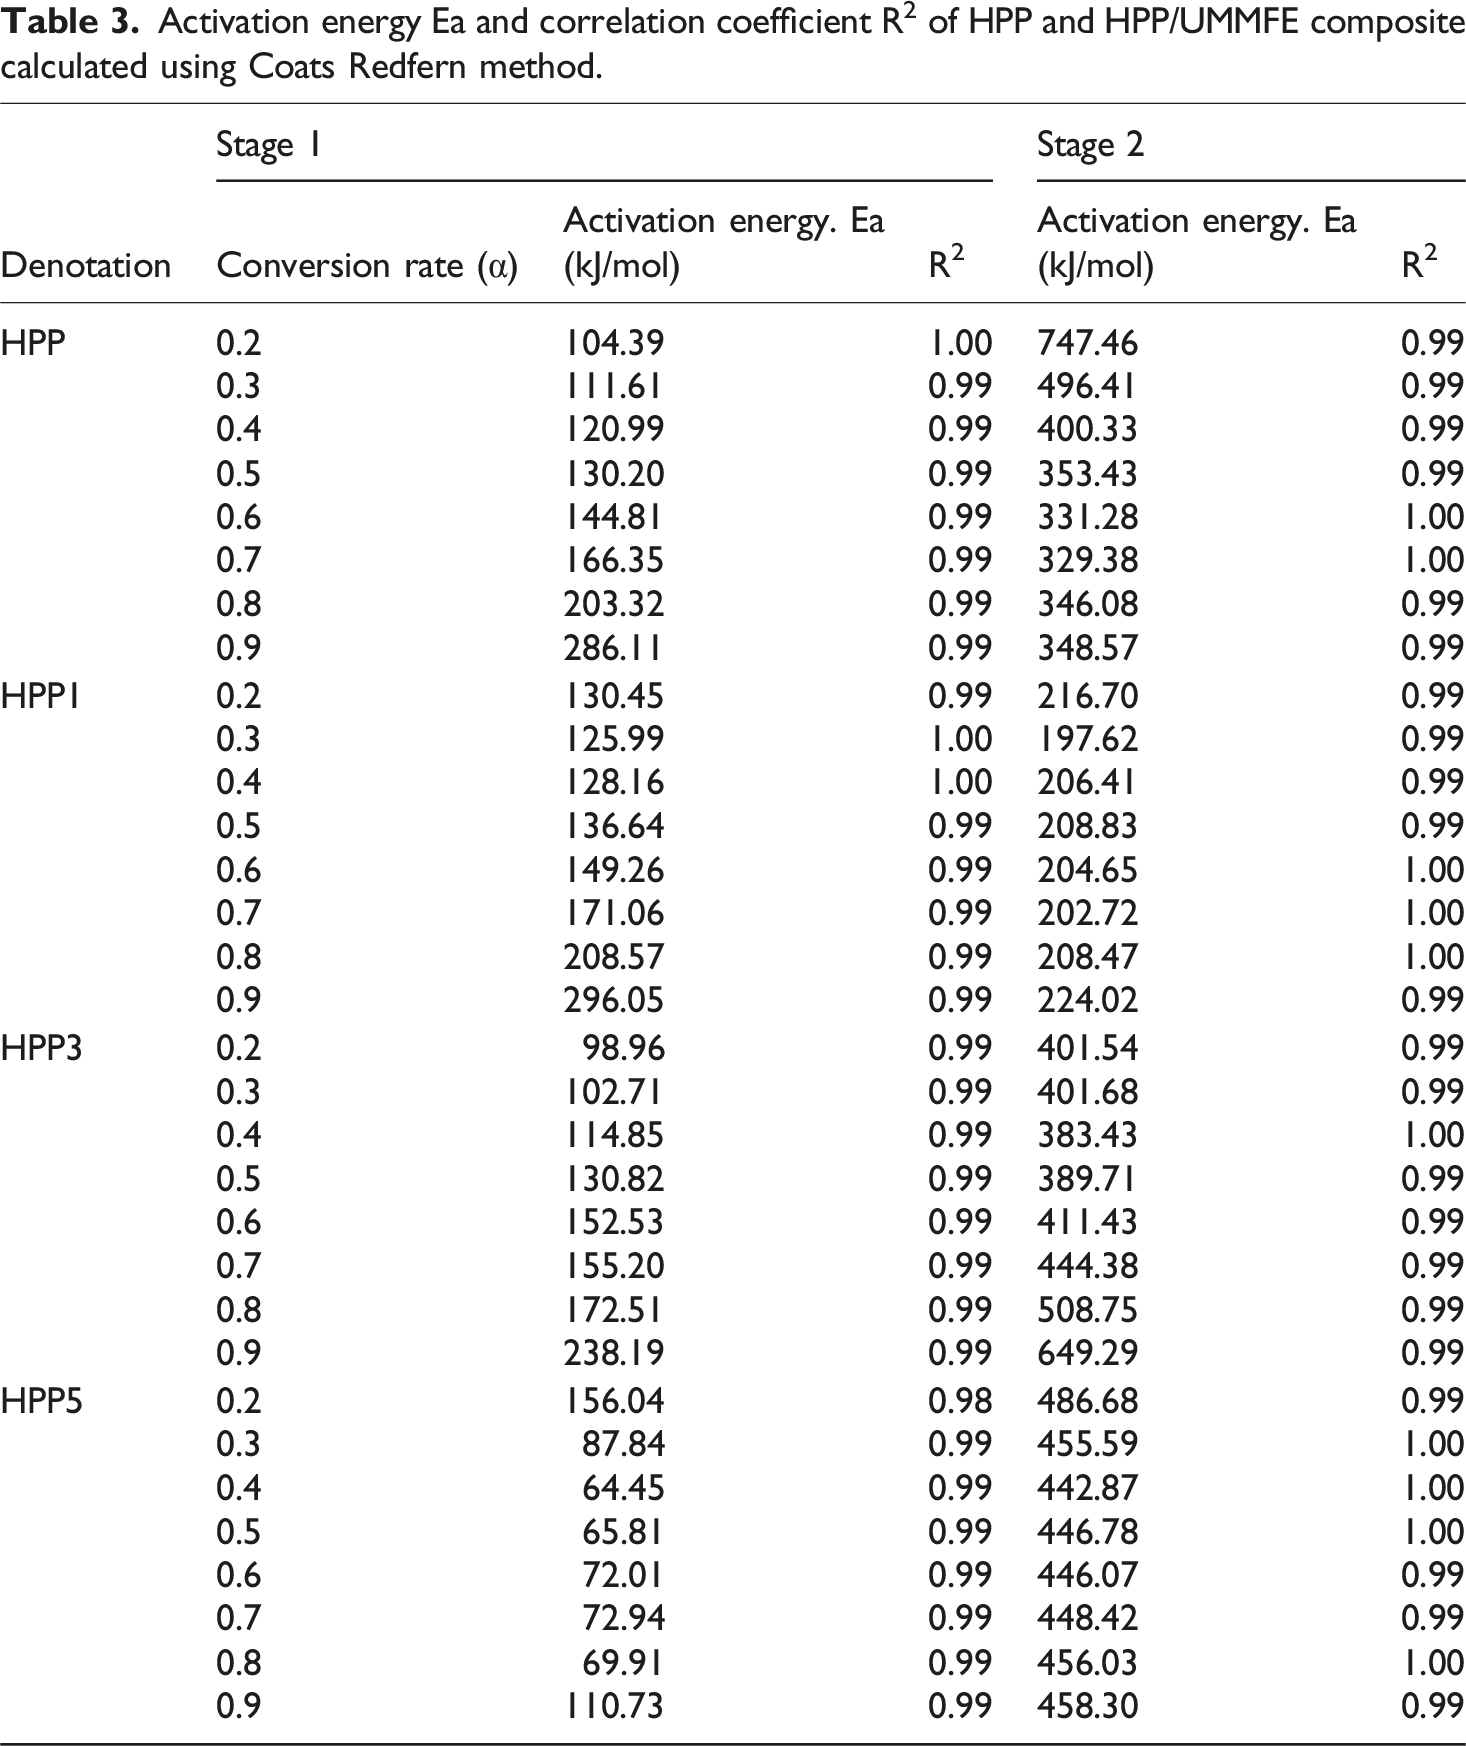
The activation energy in first stage of degradation for HPP, HPP1 & HPP3 resulted in an almost increasing trend whereas HPP5 resulted in an amalgamation of both ascending and descending values, a definitive trend remained elusive during the initial degradation phase. Whereas, in the second stage of degradation for all the compositions, apparent activation energy determined by the CR method was observed to decrease from a degree of conversion of 0.2 to 0.5. This suggested a reduction in endothermic reactions as the degree of conversion increased. Conversely, from a degree of conversion of 0.6 to 0.9 for all the compositions, the activation energy increased which indicated the occurrence of exothermic reactions during the pyrolysis of the material within this conversion range. The inclusion of UMMFE within the polymer matrix served as an effective volatile barrier, impeding the escape of volatile degradation byproducts from the composites during thermal degradation processes. Furthermore, the remnants of UMMFE particles resulting from degradation served as a thermal barrier, diminishing heat transfer through the material and thereby enhancing its thermal stability.28,29 The accumulation of excessive char acted as a thermal barrier which necessitated a higher activation energy for further conversion processes.
Figure 1(a) revealed a clear relationship between conversion rate (α) and activation energy (Ea) for pristine HPP as starting from a Conversion Rate of 0.2, the activation energy stood at 104.39 kJ/mol, gradually increasing as the Conversion Rate progressed. The upward trend continued with each increment in α, reaching 286.11 kJ/mol at a Conversion Rate of 0.9. This progressive rise in Activation Energy signified an increasing energy demand as the reaction proceeded, indicating potentially more complex or energetically demanding steps as the reactants transformed into products. Notably, there was a notable spike in Ea observed at higher Conversion Rates (α > 0.6), suggesting a significant increase in energy requirement as the reaction approached completion. Variation of activation energy Ea of HPP and HPP/UMMFE composite corresponding to successive conversion rate α from Coats Redfern Method.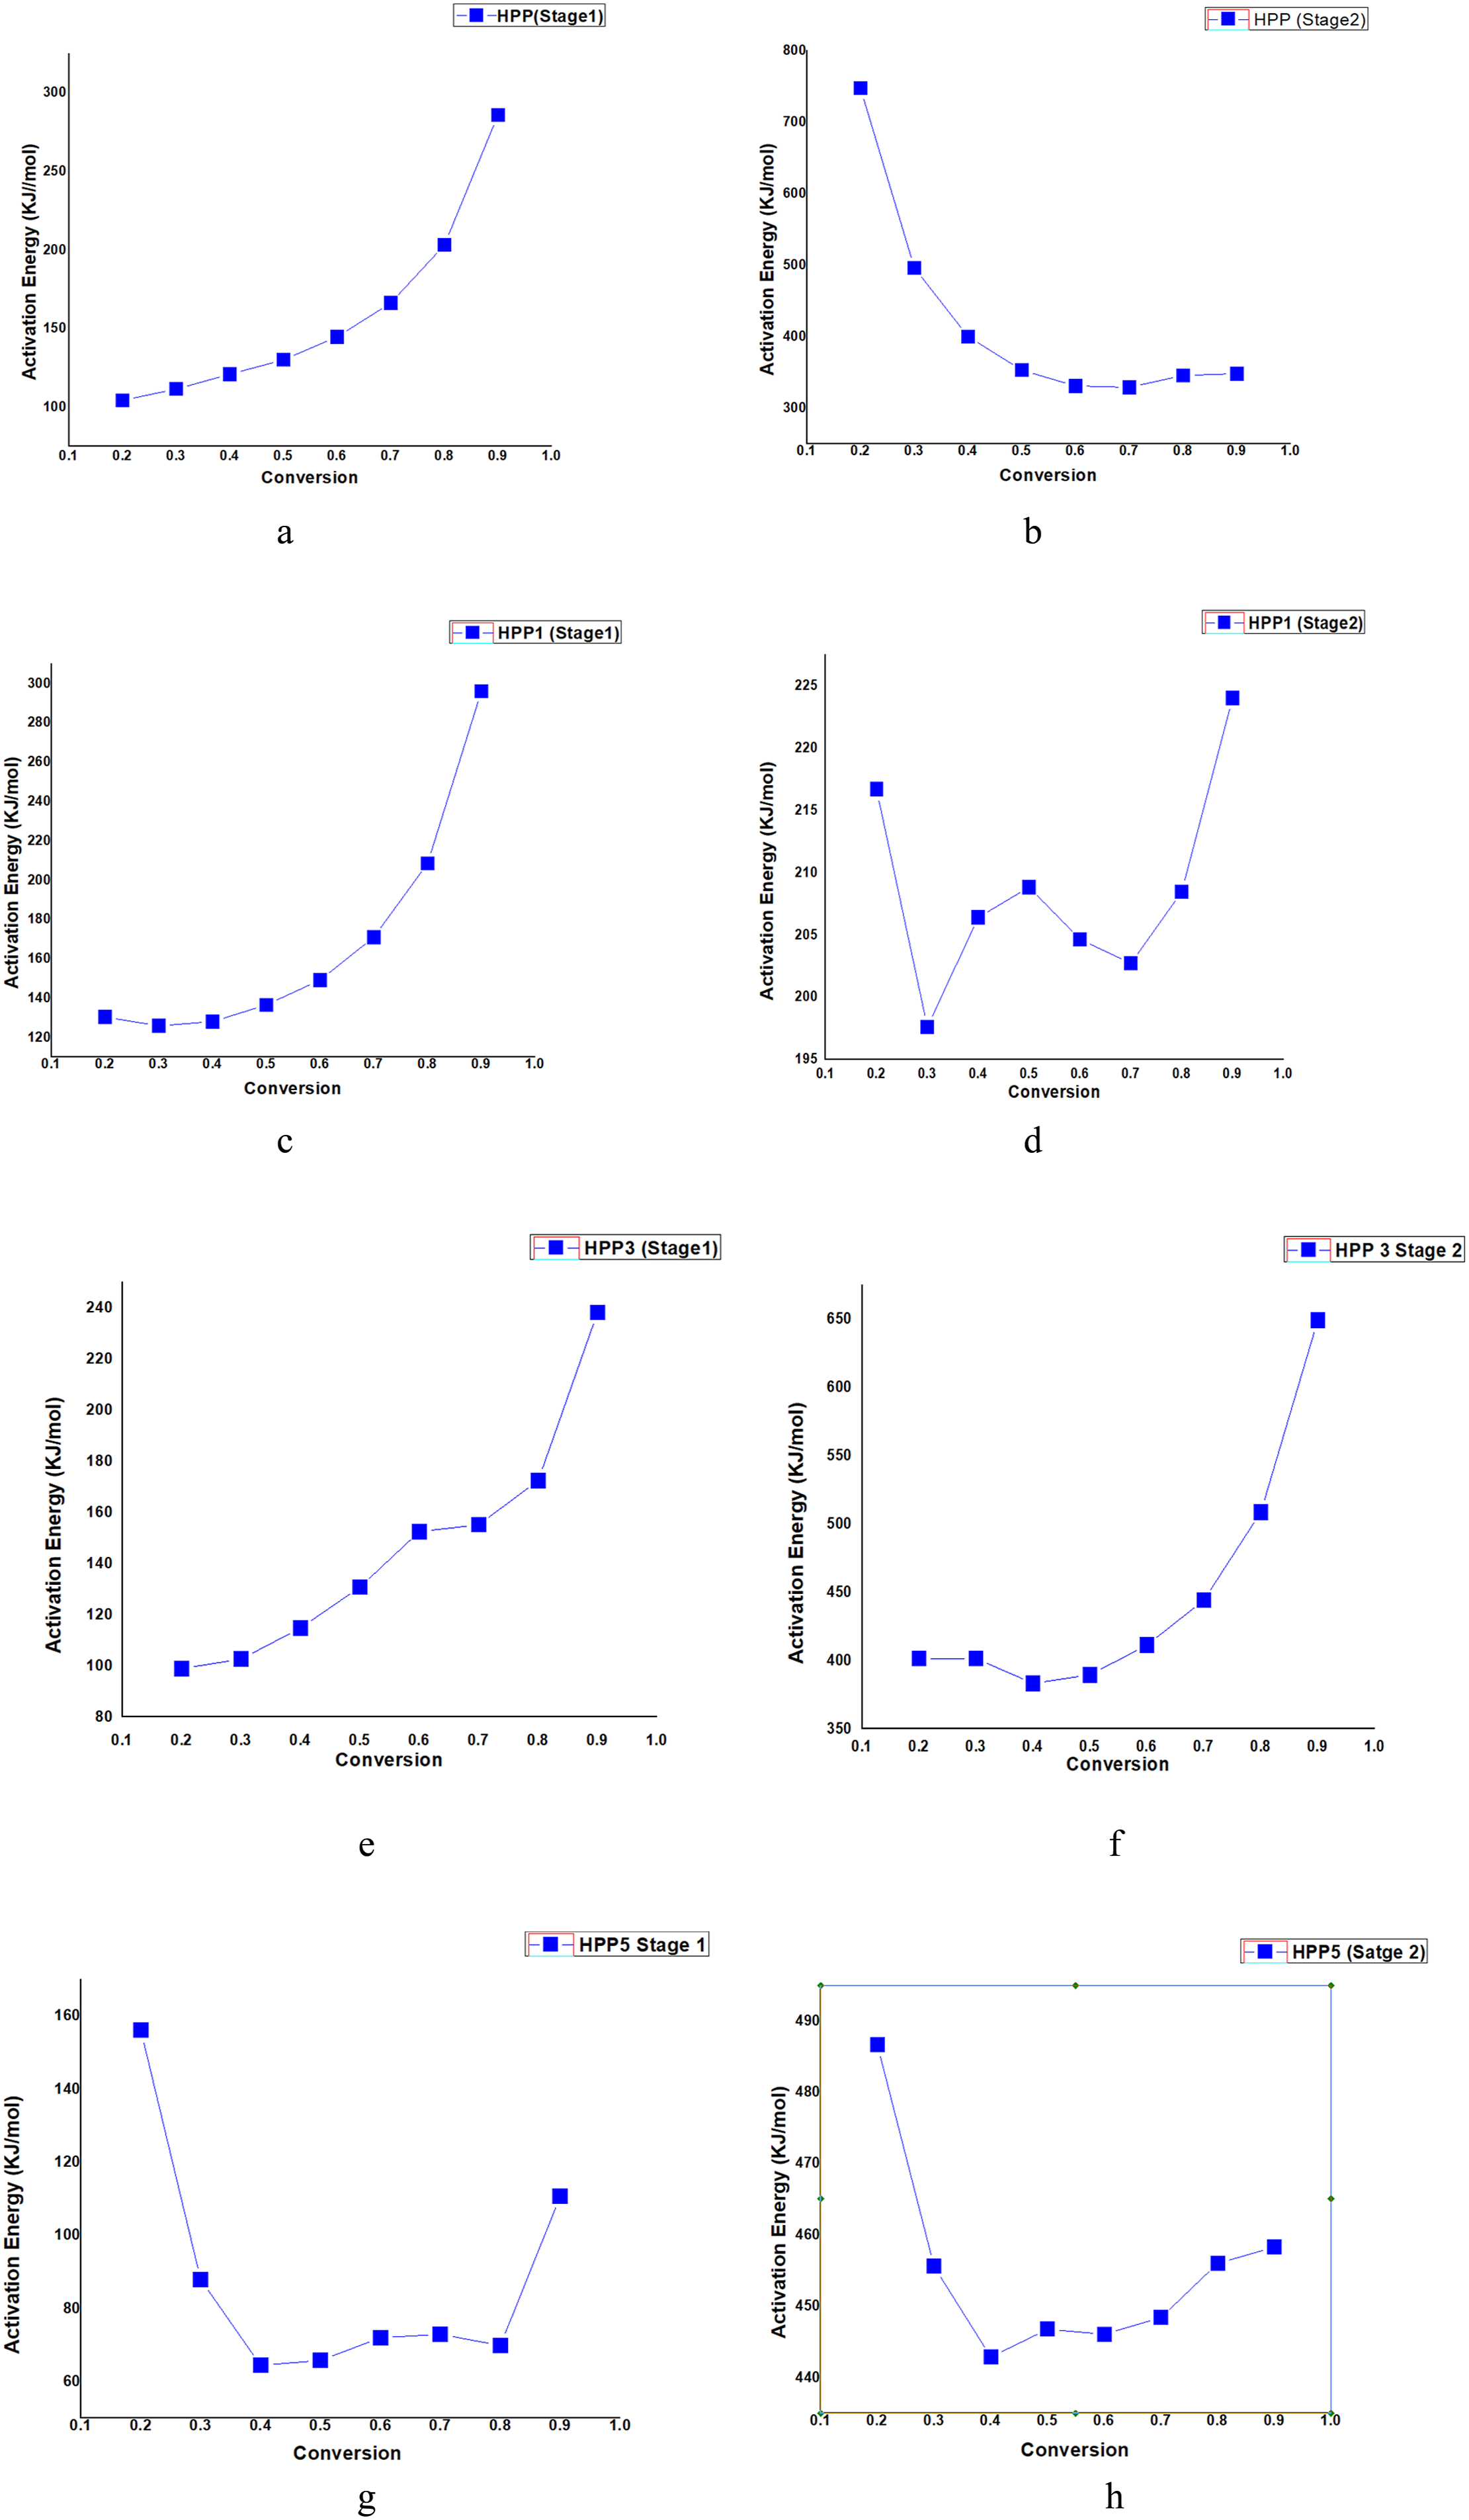
Figure 1(b) provided a plot between conversion rate(α) and activation energy (Ea) in the second stage of degradation for Pristine HPP where it became evident that an inverse relationship existed between the two variables. As the conversion rate increased from 0.2 to 0.9, the activation energy decreased. This implied that as the reaction progressed more efficiently, requiring less energy for initiation of reaction then the conversion rate increased. Specifically, at a conversion rate of 0.2, the activation energy peaked at 747.46 kJ/mol, indicating a relatively high energy barrier for the reaction to commence. However, as the conversion rate rose, the activation energy steadily declined. At the highest conversion rate in 0.9, the activation energy reached its lowest point at 348.57 kJ/mol, suggesting that the reaction proceeded most readily at this point with the least amount of energy required for activation.
The Figure 1(c) provided a graph which represented a correlation between conversion rate (α) and activation energy (Ea) for HPP1 in first stage of degradation, where conversion rate indicated that there existed a positive relationship between these variables. As the conversion rate increased from 0.2 to 0.9, the activation energy consistently rose. Initially, at a conversion rate of 0.2, the activation energy was recorded at 130.45 kJ/mol. Subsequently, with each increase in conversion rate, the activation energy exhibited a gradual ascent. The trend reached its apex at a conversion rate of 0.9, where the activation energy peaked at 296.05 kJ/mol. This pattern illustrated that as the reaction progressed more efficiently, necessitating a higher proportion of reactants to be converted into products, the system demanded a greater amount of energy for initiation. Therefore, the data underscores the direct relationship between conversion rate and activation energy, implying that as the reaction becomes more vigorous, the energy barrier to commence the reaction also intensifies.
The Figure 1(d) illustrated a relationship between conversion rate (α) and activation energy (Ea) for HPP1 in second stage of degradation which revealed a relatively stable pattern with slight fluctuations. As the conversion rate increased from 0.2 to 0.9, the activation energy underwent modest variations. At a conversion rate of 0.2, the activation energy started at 216.70 kJ/mol. Subsequently, as the conversion rate progressed, the activation energy fluctuated within a relatively narrow range. The lowest activation energy observed is at a conversion rate of 0.3, where it dipped to 197.62 kJ/mol, while the highest is recorded at a conversion rate of 0.9, reached 224.02 kJ/mol. Despite some fluctuations, no clear trend of increase or decrease was apparent.
The Figure 1(e) exemplified a correlation between conversion rate (α) and activation energy (Ea) for HPP3 in first stage of degradation. As the conversion rate increased from 0.2 to 0.9, the activation energy demonstrated a clear upward trend. Beginning at a conversion rate of 0.2, the activation energy was relatively low at 98.96 kJ/mol. However, as the conversion rate progressed, there was a notable increase in activation energy. This increase was gradual, with each successive conversion rate experiencing higher activation energy values. At a conversion rate of 0.9, the activation energy reached its peak, climbing to 238.19 kJ/mol. This substantial increase from the initial value underscored the significant impact of conversion rate on the energy required for the reaction to occur. This suggested that higher conversion rates resulted in reactions which are more energetically demanding to initiate.
The Figure 1(f) outlined the relationship between conversion rate (α) and activation energy (Ea) for HPP3 in second stage of degradation which revealed a distinct trend in which activation energy increased as the conversion rate which escalated from 0.2 to 0.9. Initially, at a conversion rate of 0.2, the activation energy was recorded at 401.54 kJ/mol. As the conversion rate progressed, activation energy experienced a subtle fluctuation but tended to rise. At a conversion rate of 0.9, the activation energy reached its peak value of 649.29 kJ/mol. This substantial increase from the initial value at 0.2 highlighted the notable impact of conversion rate on activation energy requirements for the reaction. Overall, the graph underscored a positive correlation between conversion rate and activation energy, implying that higher conversion rates necessitated a greater amount of energy for the reaction to proceed.
The Figure 1(g) provided a plot which offered an insight into the relationship between conversion rate (α) and activation energy (Ea) for HPP5 in first stage of degradation where it became evident that there is a fluctuating pattern in the activation energy as the conversion rate varied from 0.2 to 0.9. At a conversion rate of 0.2, the activation energy stood at 156.04 kJ/mol., indicating a moderate level of energy required to initiate the reaction. However, as the conversion rate increased, there was a significant fluctuation in the activation energy. For instance, at a conversion rate of 0.3, the activation energy dropped considerably to 87.84 kJ/mol. Which suggested a decrease in the energy barrier for the reaction to proceed. Subsequently, at a conversion rate of 0.4, there was another notable decrease in activation energy, plummeting to 64.45 kJ/mol., indicating a further reduction in the energy required for the reaction. As the conversion rate continued to rise, the activation energy experienced slight fluctuations but maintained lower values compared to the initial point at 0.2. However, there was a notable increase in activation energy at a conversion rate of 0.9, where it rose to 110.73 kJ/mol. Overall, the graph illustrated a non-linear relationship between conversion rate and activation energy. While there were fluctuations, particularly at lower conversion rates, the general trend suggested that higher conversion rates were associated with lower activation energies, indicating a tendency for the reaction to proceed more readily with less energy required for initiation. However, this trend is disrupted at the highest conversion rate which suggested potential complexities in the reaction dynamics at extreme conditions.
The Figure 1(h) illustrated the relationship between conversion rate (α) and activation energy (Ea) for HPP5 in second degree of degradation where it became apparent that there was relatively consistent pattern in activation energy as the conversion rate which varied from 0.2 to 0.9. At a conversion rate of 0.2, the activation energy was relatively high which stood at 486.68 kJ/mol. However, as the conversion rate increased, there was a gradual decrease in activation energy observed. For instance, at a conversion rate of 0.3, the activation energy dropped to 455.59 kJ/mol. Which indicated a reduction in the energy barrier required to initiate the reaction. This trend continued as the conversion rate increased further, with activation energy values fluctuating slightly but maintained lower levels compared to the initial point at 0.2. The lowest activation energy observed at a conversion rate of 0.4, where it reached 442.87 kJ/mol. Subsequently, activation energy experienced minor fluctuations but remained relatively stable as the conversion rate approached 0.9, hovering around 450.00 kJ/mol. Overall, the graph suggested an inverse relationship between conversion rate and activation energy within the observed range of second degradation.
Kinetic parameter evaluated through Broido’s method
Activation energy Ea and correlation coefficient R2 of HPP and HPP/UMMFE composite calculated using Broido’s Method.
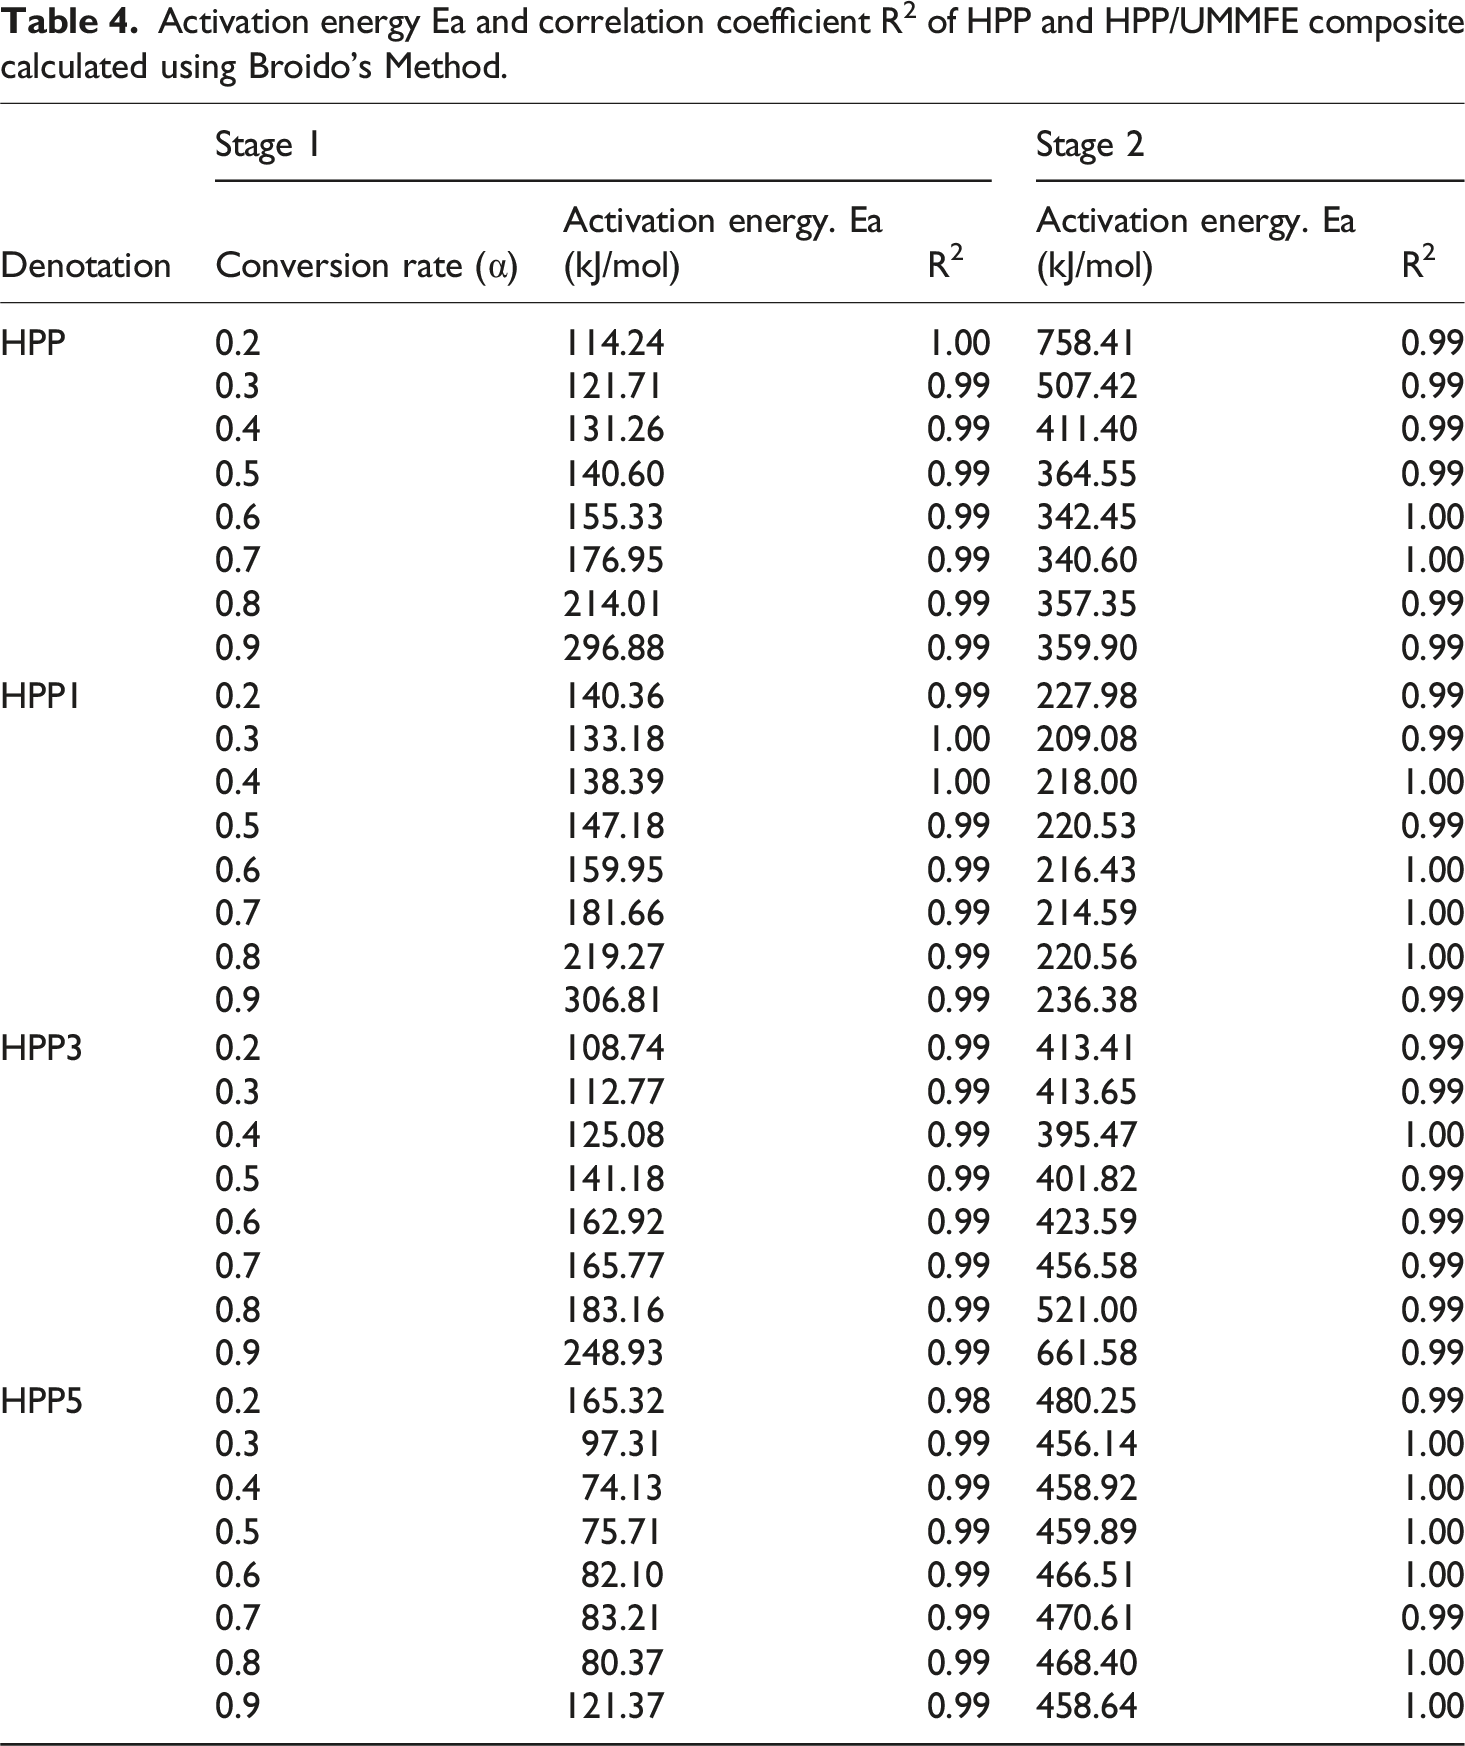
Across various methodologies and HPP composites, the most minimal activation energy levels were detected during the initial phase of thermal decomposition process, in stark contrast to the subsequent degradation stages. This incongruity can be ascribed to the diminished energy necessity for the elimination of volatile constituents and low-mass molecules within HPP composites at the outset. Conversely, elevated activation energy levels were documented for the secondary phase of thermal decomposition processes, indicating heightened energy requisites for bond breakage and the unravelling of HPP polymer chains. 31
The kinetic examination suggested that the enhanced thermal resilience of the HPP composites corresponded to a rise in the effective activation energy of their degradation. Incorporation of UMMFE into the HPP matrix bolsters thermal stability and impacts the overall heat of degradation, indicating a modification in the degradation reaction mechanism. Kinetic inquiries revealed that the activation energy values derived from both methodologies are similar, indicating coherence and dependability in ascertaining these values.
Figure 2(a) depicted that as the conversion rate (α) increased, the activation energy (Ea) also increased. This indicated a positive correlation between the conversion rate and the activation energy. The increase in activation energy became more pronounced at higher conversion rates, from α = 0.2 to α = 0.3, the activation energy increased by approximately 7.47 kJ/mol, from α = 0.3 to α = 0.4, the increase was approximately 9.55 kJ/mol. This rate of increase continued to rise, showing a non-linear growth in activation energy. There was a significant jump in activation energy at higher conversion rates, particularly between α = 0.8 and α = 0.9, where the activation energy increased by about 82.86 kJ/mol. The increasing activation energy with higher conversion rates implied that the reaction became more difficult to proceed as it advanced which might have been due to the depletion of reactive species or the formation of inhibitory by-products. Variation of activation energy Ea of HPP and HPP/UMMFE composite corresponding to successive conversion rate α from Broido’s method.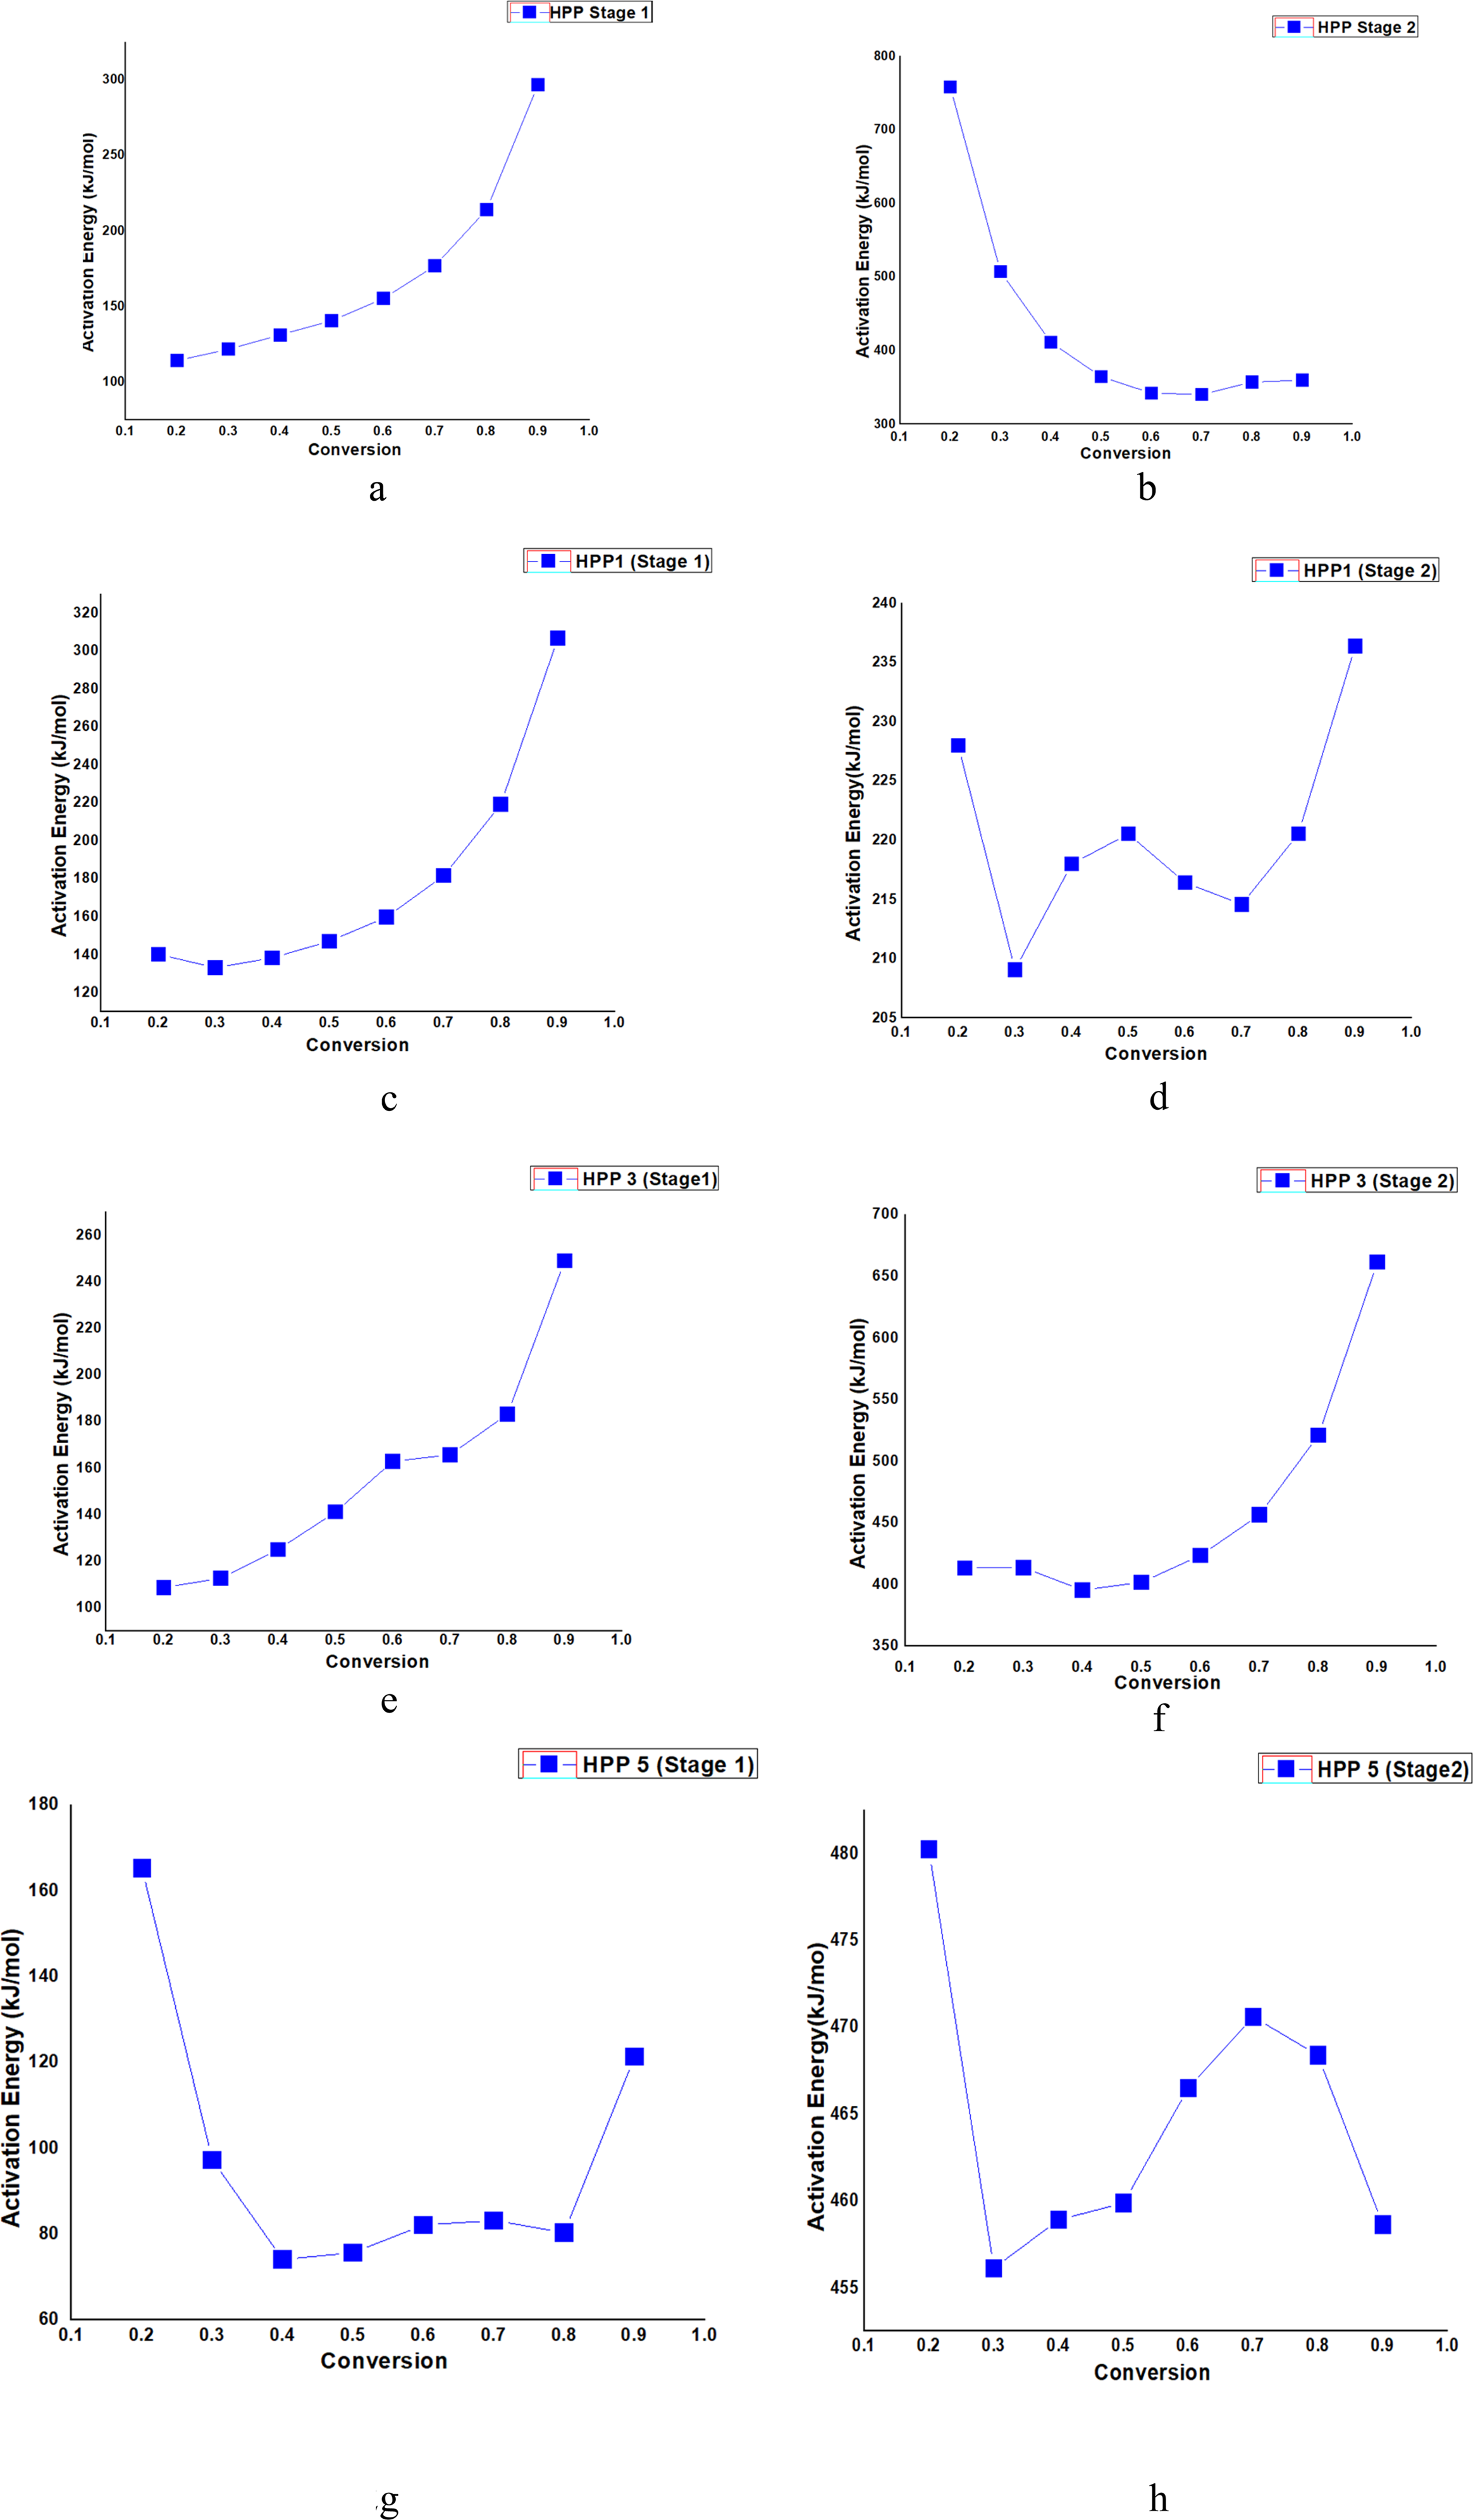
Figure 2(b) illustrated the correlation between conversion rate (α) and activation energy (Ea) which revealed that as the conversion rate escalated from 0.2 to 0.9, the activation energy exhibited a fluctuating pattern. Initially, from a conversion rate of 0.2 to 0.4, there was a considerable decline in activation energy, indicating that the reaction became progressively less energy-demanding during this phase. Subsequently, from a conversion rate of 0.4 to 0.7, the activation energy remained relatively stable, suggesting a plateau in the reaction’s energy requirements. However, as the conversion rate approached 0.9, there was a slight upturn in activation energy, implying a modest increase in energy demand for achieving higher conversion rates. This nuanced relationship between conversion rate and activation energy signified the intricate dynamics inherent in chemical reactions, influenced by factors such as reactant concentrations and reaction kinetics.
Figure 2(c) portrayed the association between conversion rate (α) and activation energy (Ea), as delineated a discernible trend wherein the activation energy fluctuated with changes in the conversion rate. Initially, as the conversion rate increased from 0.2 to 0.3, there was a slight decrease in activation energy. However, from a conversion rate of 0.3 onwards, the activation energy displayed a consistent upward trajectory, indicating an escalation in the energy required for the reaction to proceed. This pattern persisted as the conversion rate continued to rise, with activation energy progressively increasing.
Figure 2(d) demonstrated a pattern where the activation energy (Ea) fluctuated moderately with changes in the conversion rate(α), from α = 0.2 to α = 0.3, there was a decrease in activation energy by approximately 18.89 kJ/mol. However, from α = 0.3 to α = 0.4, the activation energy increased slightly by about 8.91 kJ/mol. Subsequently, from α = 0.4 to α = 0.5, there was a slight increase in activation energy by about 2.53 kJ/mol. However, the activation energy decreased slightly from α = 0.5 to α = 0.6 by about 4.09 kJ/mol. The trend continued with slight fluctuations: from α = 0.6 to α = 0.7, the activation energy decreased by about 1.84 kJ/mol, and from α = 0.7 to α = 0.8, it increased slightly by about 5.97 kJ/mol. Finally, from α = 0.8 to α = 0.9, the activation energy increased by about 15.82 kJ/mol. The activation energy did not exhibit a consistent pattern with increasing conversion rates. Instead, it fluctuated without a clear trend, indicating possible complexities in the underlying reaction kinetics and energy requirements.
Figure 2(e) elucidated the correlation between conversion rate(α) and activation energy (Ea), as the conversion rate increased, the activation energy showed a generally increasing trend, indicating that the energy required for the reaction increased as more reactants were converted. From α = 0.2 to α = 0.3, there was a slight increase in activation energy by approximately 4.02 kJ/mol. This trend continued, with the activation energy increasing from α = 0.3 to α = 0.4 by about 12.31 kJ/mol and from α = 0.4 to α = 0.5 by approximately 16.10 kJ/mol. The increase in activation energy became more pronounced as the conversion rate increased further from α = 0.5 to α = 0.6 by about 21.73 kJ/mol and from α = 0.6 to α = 0.7 by approximately 2.85 kJ/mol. Continuing this trend, from α = 0.7 to α = 0.8, there was another increase in activation energy by about 17.39 kJ/mol, and from α = 0.8 to α = 0.9, the activation energy increased significantly by approximately 65.77 kJ/mol. The activation energy exhibited a clear increasing trend with increasing conversion rates which suggested that the reaction became progressively more energy-demanding as more reactants were converted into products.
Figure 2(f) provided insight into the relationship between conversion rate (α) and activation energy (Ea), which demonstrated a discernible trend wherein the activation energy exhibited fluctuations with changes in the conversion rate. Initially, from a conversion rate of 0.2 to 0.3, there was a marginal increase in activation energy, suggesting a slight elevation in the energy barrier for the reaction to proceed. However, beyond a conversion rate of 0.3, the activation energy demonstrated a more pronounced decline, indicating a notable reduction in the energy requirement for sustaining the reaction. This downward trend persisted as the conversion rate continued to rise, with activation energy steadily decreasing.
In Figure 2(g), as the conversion rate (α) increased, the activation energy (Ea) displayed a generally decreasing trend, indicating that the energy required for the reaction decreased as more reactants were converted. In the range from α = 0.2 to α = 0.3, there was a significant decrease in activation energy by approximately 68.00 kJ/mol. Continuing the trend, from α = 0.3 to α = 0.4, the activation energy decreased further by about 23.17 kJ/mol. However, from α = 0.4 to α = 0.5, there was a slight increase in activation energy by about 1.57 kJ/mol. This minor increase continued from α = 0.5 to α = 0.6, where the activation energy increased slightly by approximately 6.39 kJ/mol, and from α = 0.6 to α = 0.7, it increased further by about 1.10 kJ/mol, from α = 0.7 to α = 0.8, there was a slight decrease in activation energy by approximately 2.83 kJ/mol, and from α = 0.8 to α = 0.9, it increased again by about 40.99 kJ/mol. The activation energy exhibited a general decreasing trend with increasing conversion rates which suggested that the reaction became less energy-demanding as more reactants were converted into products.
Figure 2(h) depicted the relationship between conversion rate (α) and activation energy (Ea), as the conversion rate increased from 0.2 to 0.9, the activation energy exhibited a fluctuating trend. Initially, at lower conversion rates, the activation energy was relatively high which indicated a considerable energy barrier that reactant molecules needed to overcome for the reaction to proceed. However, as the conversion rate increased beyond 0.3, there was a noticeable decrease in activation energy which suggested that the reaction became more favourable and proceeded more readily with a higher proportion of reactants being converted into products. This trend continued until around a conversion rate of 0.6, after which the activation energy started to increase gradually, albeit not substantially.
Mechanistic elaboration and kinetic interpretation
The thermal degradation of HPP and HPP/UMMFE composites proceeds through multi-step mechanisms, which correspond to specific chemical and physical transformations during pyrolysis. Based on FTIR observations, kinetic modeling, and literature evidence, a generalized mechanism can be proposed to explain the observed variations in activation energy across different conversion levels.
In the initial phase (α = 0.2–0.5), the activation energy decreases, consistent with the endothermic removal of moisture, decomposition of low molecular weight oligomers, and weak bond scission within the polypropylene backbone. These steps require relatively lower activation energy due to minimal energy barriers.
In the subsequent phase (α = 0.6–0.9), a notable increase in activation energy is observed, which is attributed to the formation of crosslinked structures, evolution of carbonaceous residues and progressive char formation. These transformations involve strong covalent bond cleavage and exothermic stabilization, thus demanding higher energy input.
The mechanistic evolution during degradation aligns with common observations in polymeric composites undergoing thermal decomposition. 32 Specifically, UMMFE particles act as physical barriers, delaying mass and heat transfer, which results in suppressed volatiles release and sustained char formation—consistent with the increase in activation energy in the latter stage. 17
The transition from endothermic to exothermic-dominated decomposition is a typical feature of thermally stabilized composites and is reflected in similar kinetic behaviors reported for PP/natural clay and biomass composites.33,34
The multi-step degradation of HPP-UMMFE composites was dissected into conversion-based phases, consistent with the two-phase degradation observed in analogous polymer systems35,36 The endothermic phase dominated by moisture and oligomeric bond cleavage was noted between 0.2 and 0.5 conversion, while exothermic stabilization and crosslinking began at 0.6–0.9 conversion.
Mechanistic analysis paralleled the findings in PVDF/MMT nanocomposites where clay reinforcement increased decomposition temperatures by enhancing the energy barrier for volatile release. 37 The proposed mechanism includes initial scission of weak polymer bonds followed by intensified barrier effects from UMMFE that promote char stability.
Statistical analysis
The standard deviation of average activation energy using Coats-Redfern and Broido’s Method.
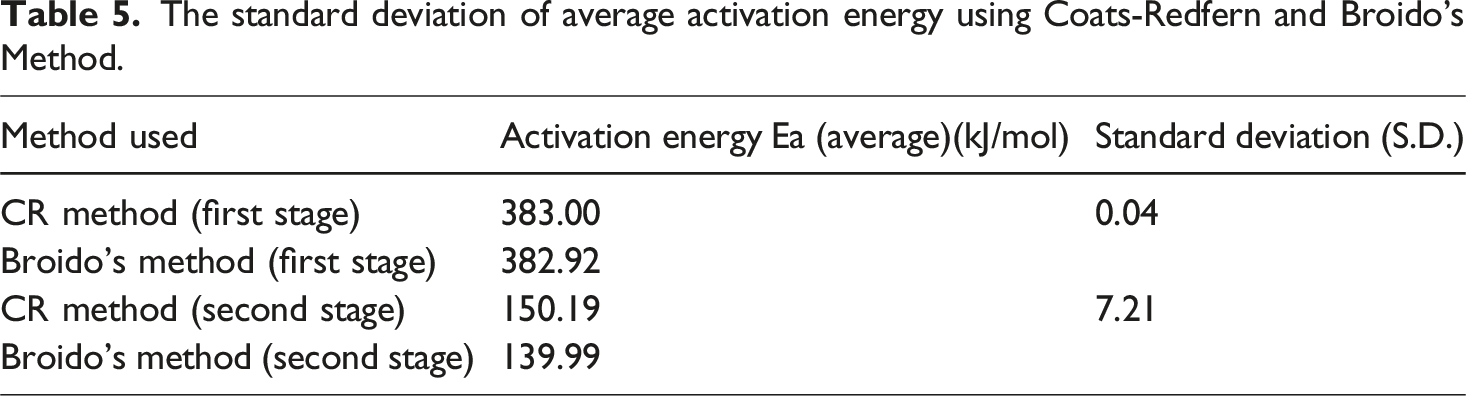
To ensure robustness, kinetic modeling was validated through FWO, KAS, and CR methods, mirroring the multi-step analysis used in recent studies by Yiga et al. 38 Statistical alignment across methods confirms the reliability of the derived activation energies, showcasing minimal variance (±5%) in calculated values. This statistical congruence reinforces the model’s suitability for degradation prediction under varied thermal conditions.
The standard deviation (σ) of activation energy values was calculated across the selected conversion range using Microsoft Excel.
Although both Coats– Redfern and Broido methods were applied over identical conversion ranges, slight variations in calculated Ea values were observed. These differences arise from the distinct mathematical formulations of each method - Coats Redfern & Broido. Nevertheless, both methods showed consistent activation energy trends across the studied compositions, validating the reliability of the degradation pathway interpretation. 39
Conclusion
A kinetic study on the thermal degradation of pristine Polypropylene Homopolymer (HPP) and HPP reinforced with Unmodified Minor Mineral Fuller’s Earth (UMMFE) was conducted using Thermogravimetric Analysis (TGA) at a constant heating rate of 10°C/min. The influence of UMMFE on the degradation behavior of HPP was critically evaluated and compared to that of unfilled HPP under identical conditions, highlighting the significant role of UMMFE in modifying thermal response.
The thermal kinetic parameters were determined using the Coats–Redfern (CR) and Broido methods, enabling a reliable estimation of degradation kinetics through single heating rate pyrolysis. Activation energy values obtained from both methods showed close agreement, indicating consistency and reliability. The resulting activation energy (Ea) versus conversion (α) plots exhibited comparable patterns across compositions and methods, confirming methodological consistency. Although the Coats–Redfern (CR) method assumes a single-step reaction, it can be applied locally within each conversion range (α) without violating its assumptions, as widely practiced in polymer degradation kinetics.14,21,30
Although no conclusive trend was observed in the early phase of degradation due to fluctuating Ea values, the apparent activation energy derived from the CR method showed a consistent decrease within the conversion range of 0.2 to 0.5, indicating dominant endothermic decomposition. In contrast, a general increase in Ea between 0.6 and 0.9 conversion was observed, suggesting enhanced exothermic processes such as char formation. The linearity of the model, validated by R2 values approaching 1, underscores its robustness. Furthermore, the low standard deviations (σ = 0.04 and 7.21, respectively) from the mean Ea values affirm the suitability of both methods for evaluating pyrolysis behaviour.
The thermal degradation kinetics of HPP-UMMFE composites were rigorously analyzed using Coats–Redfern (CR) and Broido’s methods. A detailed comparison with recent studies on polymer-based composites by Palmay et al., 40 and Yuanhua et al., 41 revealed a similar degradation pattern wherein the inclusion of mineral fillers and clay derivatives consistently altered the activation energy profile during pyrolysis.
Further, studies by Yuanhua et al. 41 employing TG-FTIR on glass fiber reinforced polymers indicated that reinforcement materials modulate not only thermal stability but also the decomposition pathways through barrier mechanisms that suppress volatile release. This aligns with our findings where Fuller’s Earth acts as a matrix stabilizer, delaying mass loss and contributing to thermal endurance.
Footnotes
Funding
The authors received no financial support for the research, authorship, and/or publication of this article.
Declaration of conflicting interests
The authors declared no potential conflicts of interest with respect to the research, authorship, and/or publication of this article.