
Abstract
As a reaction to the Veterans Affairs (VA) hospital scandal in 2014, the Veterans Choice Act of 2014 was enacted to enhance veterans’ access to health care. This study evaluated the productivity change of a panel of 102 VA hospitals from 2011 through 2019 to examine how the Act influenced the overall VA hospital productivity. The results revealed that the overall productivity of VA hospitals declined over the period and VA hospitals were not operating at an optimal scale to produce maximum outputs due to a decrease in the number of veteran patients after the Act was implemented. In addition, the technical change value less than 1 implies that VA hospitals produced fewer outputs with the given input resources over the period due to lagged adoption of innovative health care technology.
The Veterans Health Administration (VHA), under the Department of Veterans Affairs (VA), is responsible for providing quality health care to veterans in a timely manner. The VHA should be able to provide a wide range of medical services to take care of an aging veteran population 1 with distinctive health issues such as physical wounds, posttraumatic stress disorder (PTSD), traumatic brain injury (TBI), substance use disorder (SUD), and a high suicide rate (Oh & Berry, 2021). The VHA has the largest integrated health care system in the United States to serve about 9.2 million enrolled veterans. This system consists of 18 Veterans Integrated Services Networks (VISNs), including 171 medical centers and 1,112 outpatient centers (U.S. Department of Veterans Affairs, 2021b). Per the 2022 budget, the VA requested US$97.4 billion for VHA medical services, which is US$7.6 billion (8.5%) more than the budget requested in 2021 (U.S. Department of Veterans Affairs, 2021a). Also, the VA plans to hire over 352,000 full-time equivalent (FTE) medical care employees in 2022, which is an increase of 4.9% from 2021 (U.S. Department of Veterans Affairs, 2021a). With such a vast budget and huge number of FTE employees, the VHA will deliver medical treatments to 7.1 million patients (an increase of 1.3% compared with 2021) and administer 119 million outpatient visits (an increase of 3.7% compared with 2021; U.S. Department of Veterans Affairs, 2021a).
In 2014, a whistleblower at a VA hospital in Phoenix, AZ revealed that the employees did not meet the goal of a 14-day patient wait-time and even manipulated the wait-time records to hide the actual wait-time of veteran patients (VA Office of Inspector General, 2014). An internal VA audit found that more than 100,000 veteran patients were left waiting and at least 23 veteran patients died without getting care (Cohen, 2014). As a reaction to the scandal, Congress passed the Veterans Access, Choice, and Accountability Act of 2014—often referred to as the Veterans Choice Act. The Veterans Choice Act required the Department of Veterans Affairs (VA) to implement the Veterans Choice Program (VCP) that allows a veteran to use non-VA hospitals if he or she lives 40 miles or more from a VA health care facility or has to wait more than 30 days to receive needed health care (Panangala, 2018). Since the implementation of the VCP, about 1.9 million veterans received health care from non-VA hospitals (Daley, 2018). Also, the total number of authorizations of care for the VCP between November 2014 and August 2018 was 5,909,713 (Panangala, 2018). 2
While the VHA has made considerable progress in providing quality health care to veterans in a timely manner, they are still struggling to contain the expenditures for VA health care. The number of veterans living in the United States declined from 26 million in 2000 to 17 million in 2019 but spending on VA medical care significantly increased from US$33 billion in 2000 to US$78 billion in 2019 (USA FACTS, 2021). 3 Given the VHA’s significant role in delivering quality care to veterans who are aging and having various health issues, it is imperative to efficiently manage their enormous resources and to improve the productivity of VA hospitals. Whereas numerous studies have investigated hospitals’ productivity change in either the public or private sectors, there has been little research focused on VA hospitals’ productivity change. Moreover, previous research was not attentive to the effects of the Veterans Choice Act of 2014 on the overall VA hospital productivity. To fill the academic gap, this study aims to examine VA hospitals’ productivity change from 2011 through 2019 and to identify the main drivers of the productivity change. We analyzed a panel of 102 VA hospitals by employing the Data Envelopment Analysis (DEA). Also, we measured the DEA-based Malmquist productivity change index (MPI) and its components, such as technical efficiency change and technical change.
MPI 4
The Data Envelopment Analysis (DEA) is a widely used linear method to measure the relative technical efficiency of decision-making units (DMUs) and to identify inefficient areas to be improved. Technical efficiency refers to achieving maximum production by utilizing the given input resources (Ray, 2004), which is calculated as a ratio of multiple outputs to inputs. In the DEA, the technical efficiency values fall between 0 and 1. The most efficient DMUs are called an efficiency frontier having a maximum technical efficiency value of 1, and the other DMUs have a technical efficiency value less than 1. Technically inefficient DMUs achieve technical efficiency by increasing outputs (i.e., output-oriented model) and/or decreasing wasted input resources (i.e., input-oriented model). In the DEA, there are two types of returns-to-scale (RTS), which are constant-returns-to-scale (CRS) and variable-returns-to-scale (VRS). The CRS model assumes that an increase in input resources results in a proportionate increase in outputs, whereas the VRS model assumes that an increase in input resources leads to a disproportionate increase in outputs (Banker et al., 2011). In the VRS model, DMUs can be either increasing-returns-to-scale (IRS), decreasing-returns-to-scale (DRS), or CRS (Banker et al., 2011). Numerous previous studies have adopted the DEA to measure technical efficiency and identify hospitals’ inefficient areas in either the private or public sectors (e.g., Lee et al., 2009, 2015; Bannick & Ozcan, 1995; Chowdhury & Zelenyuk, 2016; Grosskopf et al., 2001; Guerrini et al., 2018; Harrison & Meyer, 2014; Harrison & Ogniewski, 2005; Wang et al., 2018).
While the DEA is a useful linear method to measure relative technical efficiency among given samples in the same year, it cannot estimate total factor productivity (TFP) changes over a period of years. Färe et al. (1994) proposed the DEA-based MPI as a geometric mean of two productivity indices from two periods of time. With the constant-returns-to-scale (CRS) efficiency frontier, changes in the productivity of the DMUs between two periods are defined as a distance function from the DMUs to the efficiency frontier (Färe et al., 1994). An MPI bigger than 1 indicates that the productivity of a DMU in period t + 1 increased compared with the DMU in period t. On the contrary, an MPI less than 1 means that the productivity of a DMU in period t + 1 decreased compared with the DMU in period t. An MPI equal to 1 means no change in the productivity between the two periods. The MPI can be decomposed into technical change and technical efficiency change. Technical change measures the productivity change by the progress of production technology and innovative management. Technical efficiency change measures the productivity catch-up effect of an inefficient decision-making unit (DMUs) by adopting best practices over the periods. The technical efficiency change can be further decomposed into pure efficiency change and scale efficiency change. Pure efficiency change is the ratio of variable-returns-to-scale (VRS) technical efficiency in period t + 1 to VRS technical efficiency in period t + 1. Scale efficiency change is the ratio of scale efficiency in period t + 1 to scale efficiency in period t + 1. 5
Numerous previous studies have widely adopted the MPI to evaluate hospitals’ productivity changes in the public or private sector (e.g., Chowdhury et al., 2011; Ferrier & Valdmanis, 2008; Liao et al., 2016; Roh, Moon, & Park, 2011, Roh, Park, & Moon, 2011; Sommersguter-Reichmann, 2000). However, despite fact that the VHA has the largest integrated health care system that serves the enrolled 9.2 million veterans with an enormous budget and personnel, little research has investigated the VA health care system’s productivity change, particularly at the VA hospital level. To fill the academic gap, this study investigates the productivity changes of a panel of 102 VA hospitals from 2011 through 2019 by using the DEA-based MPI.
Method
In this study, the unit of analysis is a VA hospital in the United State from 2011 through 2019. We collected data from three sources: (1) the American Hospital Association (AHA) annual survey, (2) the VHA through an information request under the Freedom of Information Act (FOIA), and (3) the National Center for Health Statistics under the Centers for Disease Control and Prevention (CDC). We organized the data from the three sources into a panel of 9 years from 2011 through 2019. The final working samples were 102 VA hospitals in each year after deleting observations with missing data.
We chose three types of input and four types of output variables to estimate VA hospitals’ MPI from 2011 through 2019. The three types of input variables include (1) operating expenditures excluding employee payroll and benefits, (2) number of hospital beds, and (3) number of FTE employees excluding FTE medial trainees. The four types of output variables are (1) inpatient days, (2) outpatient visits, (3) number of surgical procedures, and (4) number of FTE medial trainees. 6 We present the means and standard deviations of the input and output variables in Table 1.
Descriptive Statistics of Input and Output Variables.
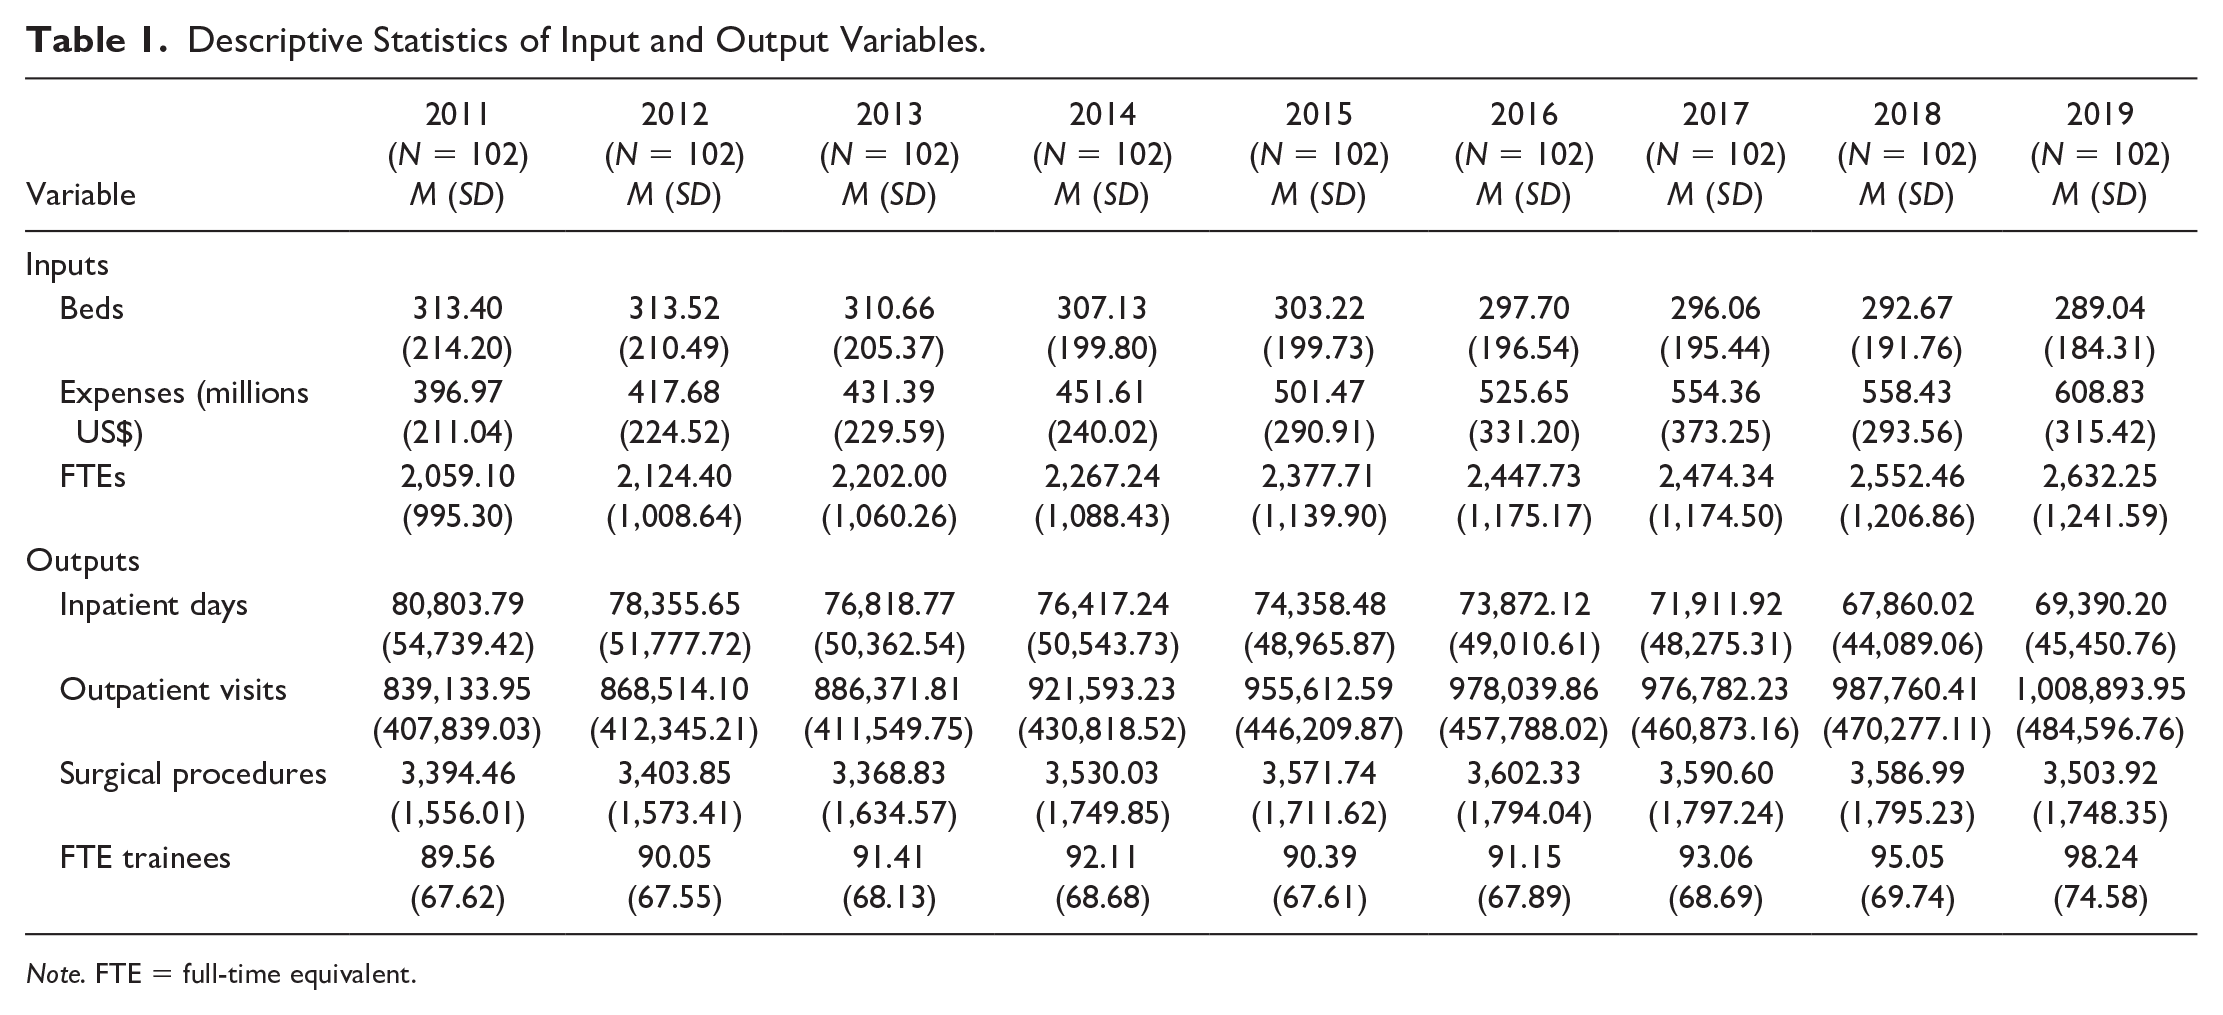
Note. FTE = full-time equivalent.
We ran the DEAP program (Version 2.1) to estimate the MPI of a panel of 102 VA hospitals from 2011 to 2019 and to decompose the index into technical efficiency change (further decomposed into pure efficiency change and scale efficiency change) and technical change. We chose the input-oriented DEA-based MPI rather than the output-oriented one because VA hospitals have more control over input resources than outputs. To investigate the effects of organizational characteristics on productivity changes, we also examined the MPI by certain subgroups depending on hospital size, teaching status, complexity level, and urban/rural area.
Findings
Prior to investigating the productivity change of VA hospitals, we ran an input-oriented DEA to calculate the technical efficiency scores, number of VA hospitals on efficiency frontiers, and average input slacks. Table 2 presents that the average CRS-based efficiency was 0.924 and the VRS-based efficiency was 0.953. While the VRS-based efficiency scores across the years were stable over the period, the CRS-based efficiency scores substantially decreased after 2014, which led to a decline in the scale efficiency scores. Likewise, the number of VA hospitals that achieved scale efficiency also decreased after 2014. These results indicate that a substantial number of VA hospitals were not operating at an optimal scale to produce maximum outputs with the given input resources during those years. In addition, the average expense slack also significantly increased after 2014; the US$22.3 million expense slack in 2014 rose steeply to US$39.6 million in 2019. This demonstrated that the large expense was not used effectively to produce enough outputs in the VA hospitals. Since the VHA initiated the Veterans Choice Program (VCP) to improve veterans’ access to non-VA hospitals in 2014, this result implies that implementation of the VCP likely had a negative effect on the scale efficiency of VA hospitals.
Average Technical Efficiency Sores, Number of Efficiency Frontiers, and VRS Input Slacks of VA Hospitals.
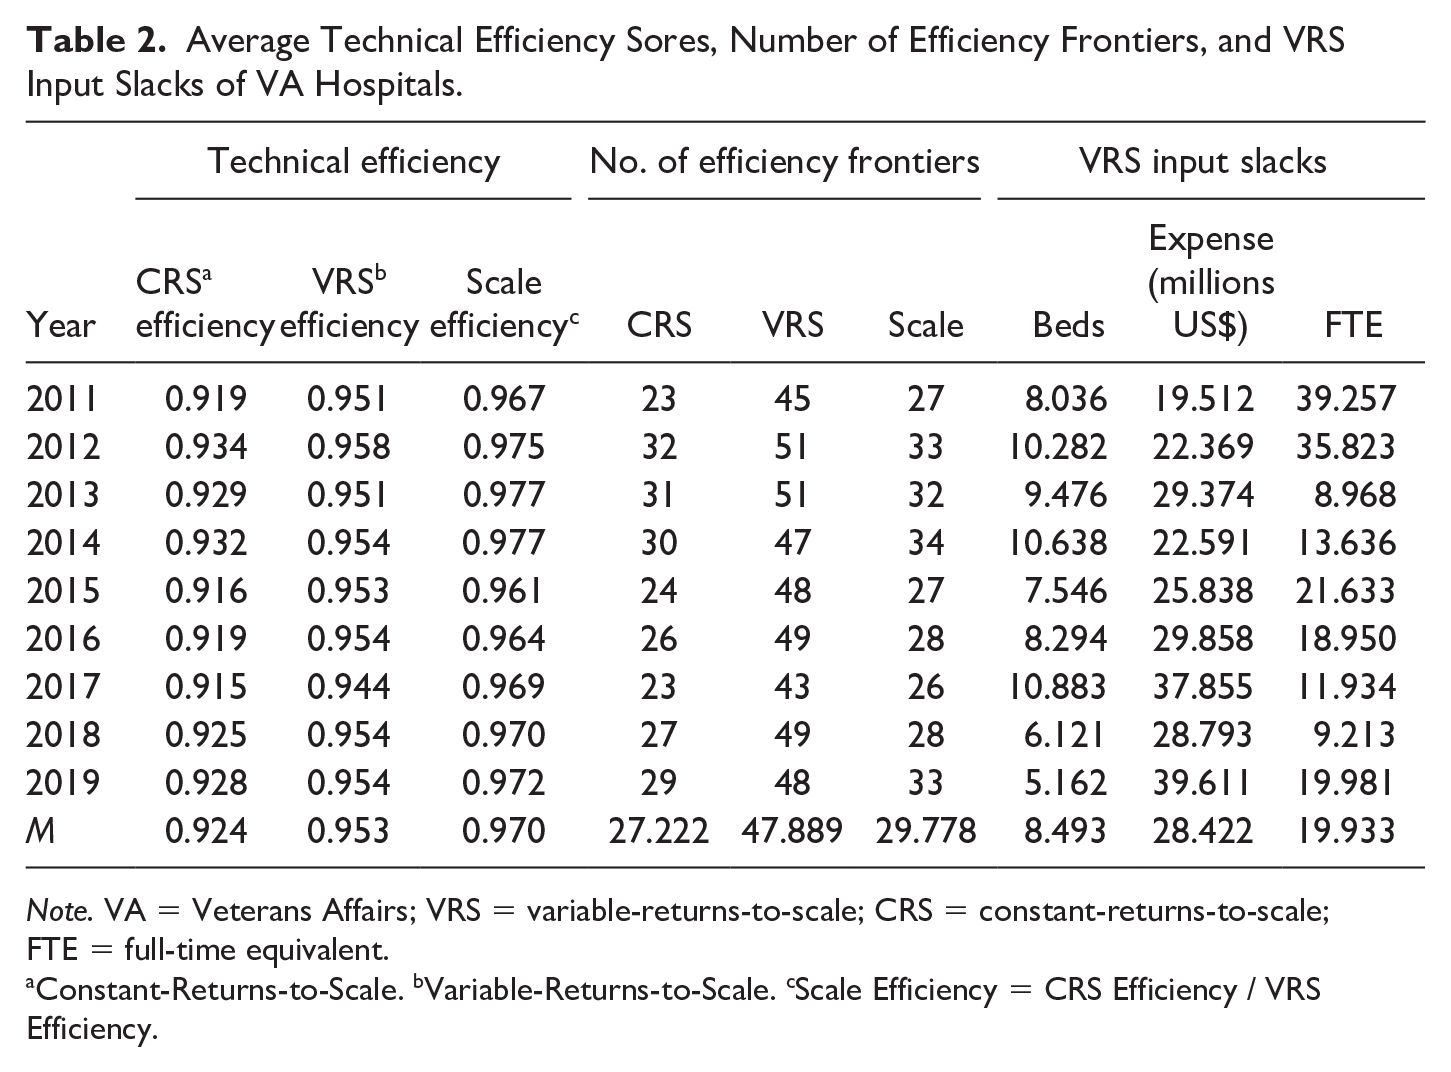
Note. VA = Veterans Affairs; VRS = variable-returns-to-scale; CRS = constant-returns-to-scale; FTE = full-time equivalent.
Constant-Returns-to-Scale.
Variable-Returns-to-Scale.
Scale Efficiency = CRS Efficiency / VRS Efficiency.
We estimated the productivity change of a panel of 102 VA hospitals from 2011 through 2019 by using the DEA-based MPI. Table 3 presents the average MPI by its components: technical efficiency change (Effch), technical change (Techch), pure efficiency change (Pech), and scale efficiency change (Sech). The results shows that the average MPI over the period of years was 0.979, meaning that the overall average productivity of VA hospitals decreased by 2.1% annually. A negative growth in technical change 7 substantially contributed to the productivity decrease. While both technical efficiency change and its components (pure and scale efficiency changes) were larger than 1, technical change was less than 1. The growth in technical efficiency suggests that inefficient VA hospitals caught up with the productivity level of the most efficient VA hospitals by adopting the best practices from VA hospitals at the efficiency frontier. On the contrary, a technical change of less than 1 represents that the slope of constant-returns-to-scale (CRS) efficiency frontier decreased. The result indicates that VA hospitals produced fewer outputs with the given inputs.
MPI and Its Components of VA Hospitals.
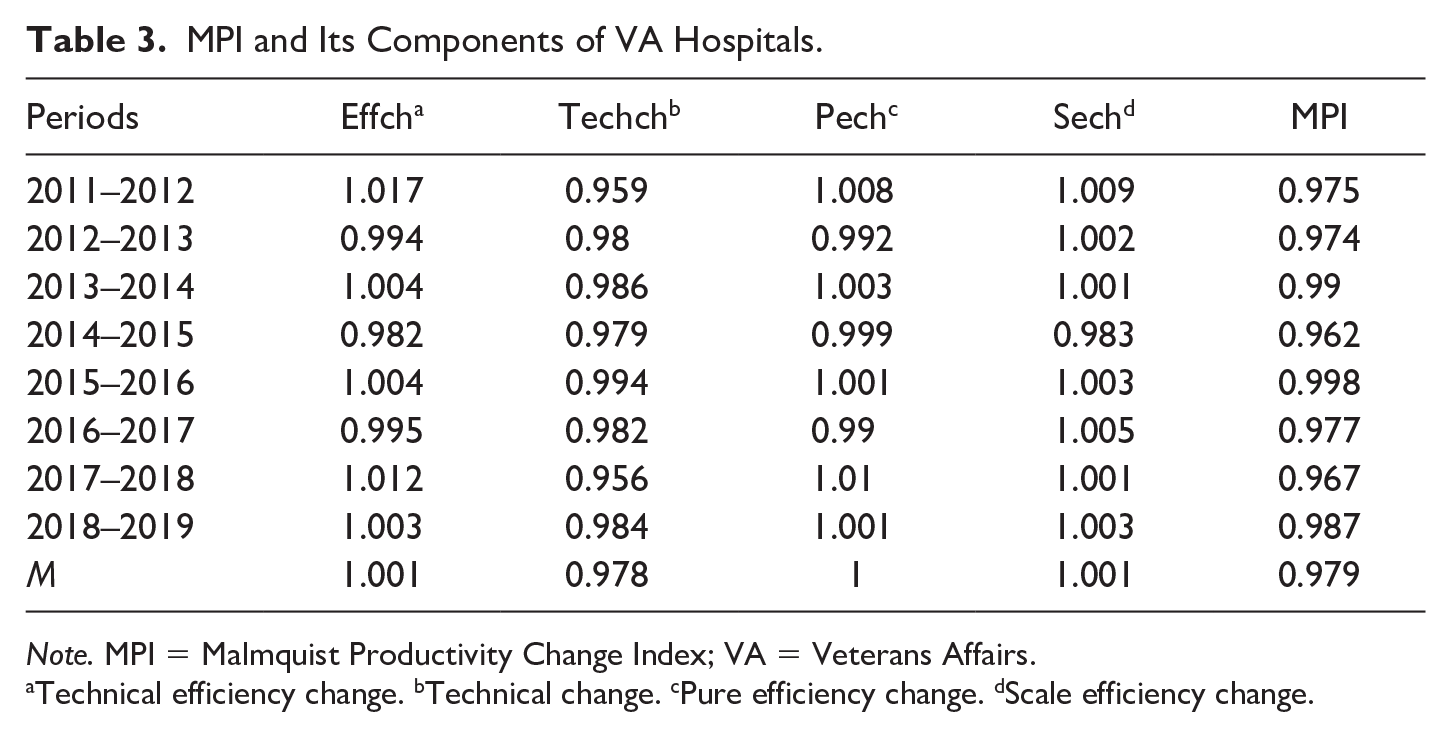
Note. MPI = Malmquist Productivity Change Index; VA = Veterans Affairs.
Technical efficiency change.
Technical change.
Pure efficiency change.
Scale efficiency change.
We additionally investigated the change in VA hospital productivity by subgroups depending on teaching status, complexity level, hospital size, and urban/rural area. The regress of production technology and the resultant negative growth in VA hospital productivity were observed consistently across all the subgroup analyses. It is revealed that there is considerable room for improvement for VA hospitals to provide quality care to veterans in a more efficient manner. The detailed results of the subgroup productivity change are presented in Online Appendix B.
Conclusion and Implications
Given the fact that the VHA has the largest integrated health care delivery system in the United States that serves 9.2 million enrolled veterans, VA hospitals should be more accountable not only for taking care of the health of the veteran population but also for efficiently managing resources distributed. Evaluating the technical efficiency of 102 VA hospitals from 2011 through 2019, this research note found that the average scale efficiency (represented by the ratio of CRS efficiency to VRS efficiency) significantly declined after 2014. The analyses of productivity change by its components, such as technical change and technical efficiency change, indicate that the overall productivity of the VA hospitals declined by 2.1% annually on average over the period of years. With respect to its components, the higher than 1 efficiency change value on average suggests the existence of a catch-up effect of technically inefficient VA hospitals. Inefficient VA hospitals benchmarked and adopted the best practices of the efficiency frontier to reduce wasted input resources.
On the contrary, the average technical change value was less than 1. This suggests a regress in the technology used for delivering health care services to veterans, which caused a decrease in the overall productivity of VA hospitals over the period. This downward tendency of technical change and the resultant negative growth in the overall productivity was also found in the analysis of the subgroups by teaching status, complexity level, hospital size, and urban/rural region.
There are two plausible factors that may have significantly affected the efficiency of VA hospitals: the Veterans Choice Program (VCP) of 2014 and lagged adoption of health care technology. As a repercussion of the VA hospital scandal in 2014, Congress passed the Veterans Choice Act that allowed eligible veterans to timely receive medical treatment from nearby non-VA hospitals. Since the implementation of the VCP, about 1.9 million veterans have received health care from non-VA hospitals (Daley, 2018). While the VCP likely decreased the number of veterans using VA hospitals and the outputs of the VA hospitals, the VA hospitals might not have been able to reduce their input resources correspondingly because of political constraints and other social values to consider (Wilson, 1989). The smallest value of MPI at 0.962 in 2014 to 2015 showed that the productivity in 2015 was substantially decreased by 3.8% from the productivity in 2014. This result suggests that the implementation of the Veterans Choice Act likely contributed to the decrease in VA hospitals’ overall productivity. Given that the VA Maintaining Internal Systems and Strengthening Integrated Outside Networks (MISSION) Act of 2018 8 has broadened veterans’ eligibility to use non-VA hospitals, this trend will likely exacerbate. It is imperative for the VHA to identify an optimal scale of VA hospitals according to fluctuating veterans’ demands to improve productivity and minimize wasted input resources.
Generally, technical change is associated with the progress of technology and innovation (Färe et al., 1994). It is also presumable that the decreased efficiency of VA hospitals was due to lagged technology adoption. The fact that the value of technical change was consistently less than 1 over the years suggests that VA hospitals should adopt innovative technology to enhance their productivity level. VA hospitals can enhance their productivity by adopting an innovative patient Electronic Health Record (EHR) system. Evidence has demonstrated that efficiency can be improved through health information technology (HIT; Cho et al., 2014; Clipper, 2020; Zhivan & Diana, 2012). Hospitals with greater inefficiency were found to be more likely to introduce more EHR, which implies that the benefits of utilizing EHR outweigh the costs of adoption (Zhivan & Diana, 2012).
Given the lagging technical change of VA hospitals in general during 2011 to 2019, it is encouraging to witness that the Department of Veterans Affairs seeks to modernize its organization as a whole and to drive hospitals to adopt EHR as one of their top modernization priorities (see www.va.gov/modernization). Furthermore, the Secretary of Defense and Secretary of Veterans Affairs jointly declared in 2018 that they were implementing a “single, seamlessly integrated electronic health record (EHR) that will accurately and efficiently share health data between our two agencies and ensure health record interoperability with our supporting community health care providers” (Tinston, 2019, p. 3).
Despite promising advancements, it is still necessary to make extensive progress in the Health Information Exchange (HIE) between VA providers and non-VA community providers (Dixon et al., 2021; Donahue et al., 2018). Given the fact that the MISSION Act of 2018 expanded veterans’ eligibility to receive health care services from community providers, the need for patient information sharing and coordinated care between VA hospitals and non-VA hospitals will significantly increase. Thus, policymakers in the VA and VHA should find ways to achieve better interoperability between VA and non-VA providers, which will eventually contribute to better VA hospital productivity and quality of care (Valdmanis et al., 2008).
In a broader sense, technology in health care refers to “the practical application of scientific knowledge to improve people’s health and to create efficiencies in the delivery of medical care” (Shi & Singh, 2017, p. 109). In other words, using technology encompasses the utilization of cutting-edge medical equipment and technology, as well as restructuring the organization and adopting innovative surgical procedures and effective patient protocols to improve efficiency in delivering health care to patients (Shi & Singh, 2017). Ozcan and Luke (2011) explained that restructuring health care providers within the 21 Veterans Integrated Service Networks (VISNs) led to a positive shift in the technical frontier and improved the overall productivity of the 21 VISNs. Also, it was empirically evidenced that introducing a new activity-based financing system to Austrian hospitals resulted in a positive shift in the technical frontier, which contributed to a productivity increase in the hospitals (Sommersguter-Reichmann, 2000).
The MISSION Act of 2018 allowed the VA to be more innovative and transformative. Section 152 of the MISSION Act required the creation of the Center for Care and Payment Innovation (CCPI) within the VA. CCPI’s primary goals are to improve Veterans’ access to care and services; to improve quality, timeliness, and patient satisfaction; and to save costs for the Department (Center for Care and Payment Innovation [CCPI], 2021). This innovation center explores various ways of providing more efficient and effective care for veterans.
With the MISSION Act, the VA is expected to utilize up to US$50 million per year for pilot programs to implement innovation in delivering health services to veterans (Vincent, 2020). This initiative will allow VA stakeholders to explore innovative ways to improve operations of VA hospitals and to ensure that veterans’ health needs are met. At the same time, however, if it fails to meet the goal, it may invite unintended consequences, such as a further decrease in the number of veterans who use VA hospitals. To successfully implement the policy, it is important to acknowledge that the modernization initiative warrants nurturing of an organizational culture leaning toward better innovation and productivity. One of the notable features of the VA that may hinder innovation and productivity is its rigid hierarchy because it commonly introduces top-down initiatives and challenges application of innovative approaches (Gayed et al., 2013; Singer et al., 2013). Given that higher levels of entrepreneurial cultures are significantly linked to better hospital safety and quality of care (Singer et al., 2013), it is imperative for VHA stakeholders to establish and sustain a culture that is more open to innovation in pursuit of meeting the health care needs of veterans and efficiently managing the allocated resources.
Supplemental Material
sj-docx-1-afs-10.1177_0095327X221094647 – Supplemental material for Veterans Affairs Hospital Productivity Change and the Policy Implications: A Research Note
Supplemental material, sj-docx-1-afs-10.1177_0095327X221094647 for Veterans Affairs Hospital Productivity Change and the Policy Implications: A Research Note by Dongjin Oh, Ahreum Han and Keon-Hyung Lee in Armed Forces & Society
Footnotes
Declaration of Conflicting Interests
The authors declared no potential conflicts of interest with respect to the research, authorship, and/or publication of this article.
Funding
The authors received no financial support for the research, authorship, and/or publication of this article.
Supplemental Material
Supplemental material for this article is available online.
Notes
Author Biographies
References
Supplementary Material
Please find the following supplemental material available below.
For Open Access articles published under a Creative Commons License, all supplemental material carries the same license as the article it is associated with.
For non-Open Access articles published, all supplemental material carries a non-exclusive license, and permission requests for re-use of supplemental material or any part of supplemental material shall be sent directly to the copyright owner as specified in the copyright notice associated with the article.