
Abstract
It has long been recognized that at-risk groups tend to experience a greater proportion of burden during times of turbulence. Motivated by the COVID-19 pandemic as a source of unprecedented crisis and change, this article uses data on employment, wages, and subjective well-being (SWB) to examine how U.S. veterans—an at-risk group for a variety of social ailments, including homelessness, disability, depression, anxiety, substance use, and suicide—fared over the pandemic between 2020 and 2021. While veterans were less likely to be employed, those who were employed have higher wages, conditional on being employed, and higher levels of SWB. Our results are qualitatively robust to controlling for a wide array of demographic factors, such as age and education, as well as industry and occupational differences. To better understand why veterans fared better than anticipated, we explore the moderating role of local Department of Veterans Affairs medical centers (VAMCs). We find that veterans who live closer to VAMCs exhibit higher levels of SWB with some evidence that the benefits of VAMC proximity are concentrated among more rural veterans, suggesting that VAMCs may have played an important role of supporting veteran communities during the pandemic.
Introduction
There has long been interest in understanding the heterogeneous effects of crisis on society, ranging from economics (Lucas, 1987) to sociology (Redbird & Grusky, 2016) to psychology (Brooks et al., 2020). Historically, veterans of the U.S. Armed Forces have disproportionately experienced a variety of economic and health maladies relative to the nonveteran population. Furthermore, studies have found that veterans earn significantly less than their nonveteran counterparts, even when comparing wages within industry and occupation (Angrist, 1990; Makridis & Hirsch, 2021) and despite the screening involved with military service (Berger & Hirsch, 1985; Mehay & Hirsch, 1996). On top of these economic disparities, veterans have also experienced worsening health outcomes (Betancourt et al., 2021; Li et al., 2011), despite greater health care utilization and spending (Chan et al., 2021). A substantial body of empirical evidence also points to relatively poor mental health among veterans, with higher rates of depression, post-traumatic stress disorder, and suicide (Blow et al., 2012; Magruder et al., 2012; Palframan et al., 2021; Trivedi et al., 2015). 1
Notwithstanding these results on the deteriorating outcomes among veterans, we know little about how they fared during the recent COVID-19 pandemic crisis, which represents the largest shock over at least the past century. History suggests that veterans would be especially vulnerable to COVID-19 given that they are, on average, older than the general population and experience higher rates of co-morbidities. Because the first 3 months of the COVID-19 pandemic saw greater job losses than during the entire Great Recession (Montenovo et al., 2021), sensitive groups such as veterans may have suffered disproportionately. Indeed, Montenovo et al. (2021) show that several marginalized groups, including Hispanics and those with lower education, experienced larger job loss during the initial COVID-19 wave; as labor demand rebounded in the summer of 2020, Black Americans saw a significantly lower increase in employment. Similarly, Black and Hispanic populations experienced much higher unconditional rates of COVID-19 infection, hospitalization, and mortality (Mackey et al., 2021). Here, we ask whether such disparities are also present among veterans over the duration of the pandemic.
We also seek to understand these differences between veterans and nonveterans. There is a large sociological literature on the importance of social capital for both subjective well-being (SWB) (Putnam, 1993) and human capital (Coleman, 1988), including across countries (Arachchi & Managi, 2023; Calvo et al., 2012). Motivated by these studies, we hypothesize that one channel for the production of social capital among the veteran community is increased interaction through the Department of Veterans Affairs medical centers (VAMCs). VAMCs exist in many cities in the United States and, in addition to providing health care services, also function as hubs for socioeconomic investments in veterans (Tsai et al., 2017). Prior work has also linked the quality of VAMCs with funding from the Paycheck Protection Program among veteran entrepreneurs (Makridis et al., 2022). We find that veterans are less likely to be employed, but those who are employed have higher wages and higher levels of SWB. We also find that those who live closer to VAMCs exhibit higher levels of SWB, suggesting that VAMCs may have played an especially important role of supporting veteran communities during the pandemic, which may come as a surprising result given prior literature about deteriorating veteran outcomes.
This article contributes to several literatures in economics and policy analysis. Its first contribution relates to access to public health and sociodemographic differences that affect equity. For example, one explanation for our SWB findings is that veteran status confers access to the Veteran’s Affairs health system, and in a time of significant anxiety and stress, access is an important predictor of well-being, particularly in older, lower socioeconomic status Americans. Furthermore, additional evidence suggests that VAMCs serve as a source of information dissemination (Makridis et al., 2022), meaning that access to a VAMC provides not only access to health care but also access to a social network. VAMCs can offer a vehicle for socioeconomic partnerships that advance veteran outcomes (Tsai et al., 2017). In the absence of data on well-being prior to the pandemic, we test this idea by looking at distance from the nearest VA facility. Geographic access is a major determinant of care utilization (Rose et al., 2021), and, cross-sectionally, it is well established that rural veterans are a particularly vulnerable group (Weeks et al., 2004; Wray et al., 1999). Our results show that excess SWB outcomes quickly attenuate in veteran distance from the nearest VAMC. Descriptive evidence on the role of distance to health care is informative for understanding a broader range of health care disparities, especially in the Veterans Health Administration (Peterson et al., 2018).
Second, we contribute to the growing literature on economic and health inequality in the context of COVID-19 (Montenovo et al., 2021). In contrast to other at-risk groups, we find that COVID-19 has not widened economic or health disparities between veterans and nonveterans. While the composition of veterans has shifted significantly over the last 20 years, our analysis focuses on a relatively short time window, in which composition effects are unlikely to drive our results. For example, we study the evolution of veteran employment and wages using nationally representative data that allow us to estimate small effects precisely. Using proprietary Gallup data, we offer important insights into veteran mental health during an extremely anxious and uncertain time (Nichter et al., 2021), making the results informative for times of crisis. Our findings about veteran outcomes are also relevant to broader sociological research on the link between social affiliation and social capital where we focus on veteran status as a group identity (Hommerich & Tiefenbach, 2018), and we encourage more research along these lines.
Third, we contribute to work on the differences between veterans and nonveterans in the labor market. Many studies have explored earnings differences. While early work by Angrist (1990) found an earnings penalty associated with veteran status, Angrist et al. (2011) found that earnings converged and there was no longer a penalty. However, more recent empirical work suggests veterans do not earn more and increasingly veterans reside within metropolitan areas with lower employment and wage growth (Chakrabarti et al., 2023; Makridis & Hirsch, 2021; Renna & Weinstein, 2019; Vick & Fontanella, 2017). In particular, Makridis and Hirsch (2021) use the most comprehensive data available from the Current Population Survey (CPS) with robustness from the American Community Survey (ACS) over 2005–2018, whereas Renna and Weinstein (2019) use ACS data from 2005 to 2015, Vick and Fontanella (2017) use data from 2009 to 2013, and Chakrabarti et al. (2023) use the 5-year ACS. Nevertheless, all these studies largely agree that veterans are earning less than their counterparts, on average, although there are some differences by race, gender, disability, and point in the wage distribution. Our article provides new, optimistic results showing that veterans fared much better over the COVID-19 era than they conventionally have, and that distance to a VMAC is predictive of their well-being. Our article is also related to topical questions related to VA policy. For example, Coile et al. (2021) find that eligibility in the VA Disability Compensation program affected selection into self-employment away from wage employment. Similarly, Baird et al. (2022) explore how changes in the post-9/11 GI Bill affected reimbursement rates from state maximums to a nationwide limit, thereby influencing the number of veterans that attended for-profit colleges.
Data, Measurement, and Hypotheses
The primary data come from the CPS between January 2019 and December 2021 (Montenovo et al., 2021; Ruggles et al., 2020). The monthly CPS is the most comprehensive and nationally representative data for wages, labor supply, and veterans status, and it has been used to study earnings differences across and within the veteran community (Berger & Hirsch, 1985; Mehay & Hirsch, 1996). Furthermore, the large CPS sample allows us to study a relatively small subgroup (i.e., veterans) precisely. We restrict our sample to those between ages 25 and 65 to ensure comparisons among individuals who have completed their education. The CPS provides information on individual demographics (e.g., age, education, race, gender, family size), weekly earnings, and weekly hours worked, as well as industry and occupational classifications.
Our measure of SWB comes from Gallup’s COVID Tracking Survey, which began on March 13, 2020, and collected roughly 1,000 responses per day until April 26, when the sample declined to roughly 500 responses per day. The sample is a subset of the Gallup Panel, which is representative of the U.S. population, with members contacted via random-digit dialing. It contains 172,368 responses from 55,111 individuals who completed the survey online or on a smartphone after receiving an emailed invitation. Seven percent responded only once, 11.5% responded twice, 21% responded three times, 23.5% responded four times, and 16.5% responded five times. The incidence tapers off to 9.4% among those who responded six times and 5.2% for those who responded seven times. We restrict our analysis to end in December 2021 to match the CPS data as closely as possible.
Besides standard demographic factors (age, education, race, gender, marital status), we also observe a wide array of measures of SWB and both occupational classification and income. We focus on three SWB outcomes: current life satisfaction on a scale from 0 to 10 (converted to a z-score), an indicator for whether thriving (at least a 7/10 for current life satisfaction and at least an 8/10 for expected future life satisfaction over the next 5 years), and a z-score over personal finances (“you are saving a lot,” “you are saving a little,” “you are just managing to make ends meet,” “you are having to draw on savings,” and “you are running into debt”).
Although there are some concerns with using SWB data, a voluminous literature links it with gross domestic product (di Tella et al., 2001; Stevenson & Wolfers, 2013), marginal rates of substitution between goods (Benjamin et al., 2014), health (Danzer & Danzer, 2016; Hafner et al., 2015), productivity in the workplace (Oswald et al., 2015), and foreclosures (Makridis & Ohlrogge, 2022). Frey and Stutzer (2002) discuss the importance of happiness data in economics; see Krueger and Schkade (2008) for an analysis of the reliability of well-being measures. Furthermore, Gallup is the premier polling institution in the United States. Interviewers receive 8 hr of classroom instruction conducted by a learning and development specialist over a 2-day period. Although there is a psychology literature on the effects of foreclosure on mental and emotional well-being, all these studies are based on small sample focus groups. With these data, we present and test two main hypotheses:
In the next section, we present the empirical specifications and strategy for testing these hypotheses.
Empirical Strategy
Veterans are an extremely heterogeneous group along demographic and socioeconomic dimensions. In this section, we explain our empirical strategy, which presents models of our outcomes of interest—weekly earnings, employment status, and SWB—controlling for not only individual-level demographic factors but also fixed characteristics across industry and time. To mitigate composition changes in the veteran population over long periods of time, we focus our analysis to a relatively short period of time before and after the outbreak of COVID-19. The form of our regression analysis follows the format of a difference-in-differences model, and our results should be interpreted as descriptive comparisons of similarly situated veterans and nonveterans before and after the start of COVID-19.
Using CPS data, we consider regressions of the following form:

where
Turning to the Gallup data, our SWB measures include an indicator for whether an individual is thriving (when current life satisfaction is at least 7/10 and expected future life satisfaction over the next 5 years is at least 8/10), a z-score over current life satisfaction, and a z-score over personal finances. Because we do not have Gallup survey data prior to the start of COVID-19, our SWB estimator imposes that
Estimates of
Motivated by the results linking veteran status with earnings and well-being, we hypothesize that a potential mechanism may be access to health care, and specifically veterans’ access to the VA. To investigate, we estimate a modification of Equation 1:

where
Main Results
Labor Market Differences
We begin by documenting differences in earnings conditional on working between veterans and nonveterans in Columns 1 through 3 in Table 2. Table 1 documents several descriptive statistics for the full sample, as well as separately for veterans and nonveterans. Veterans are 5% of the sample. The raw data shows higher levels of weekly earnings for veterans ($1,142) relative to nonveterans ($1,000), but similar employment rates. Veterans are more likely to be older, male, Black, and educated. Columns are differentiated by the controls included in the model. Column 1 presents the unadjusted estimates. Prior to COVID-19, veterans earned 18.3% more than nonveterans; during COVID-19, this difference declined by 1.6% but the fall is not statistically significant, even as our sample includes 336,821 individuals. Precisely, the marginal effect would be (exp(0.183) − 1) × 100 in Column 1, or 20.1%, but log approximations are easier to interpret and make little difference when the coefficient is small, as in Column 3.
Descriptive Statistics Among Veterans and Nonveterans.
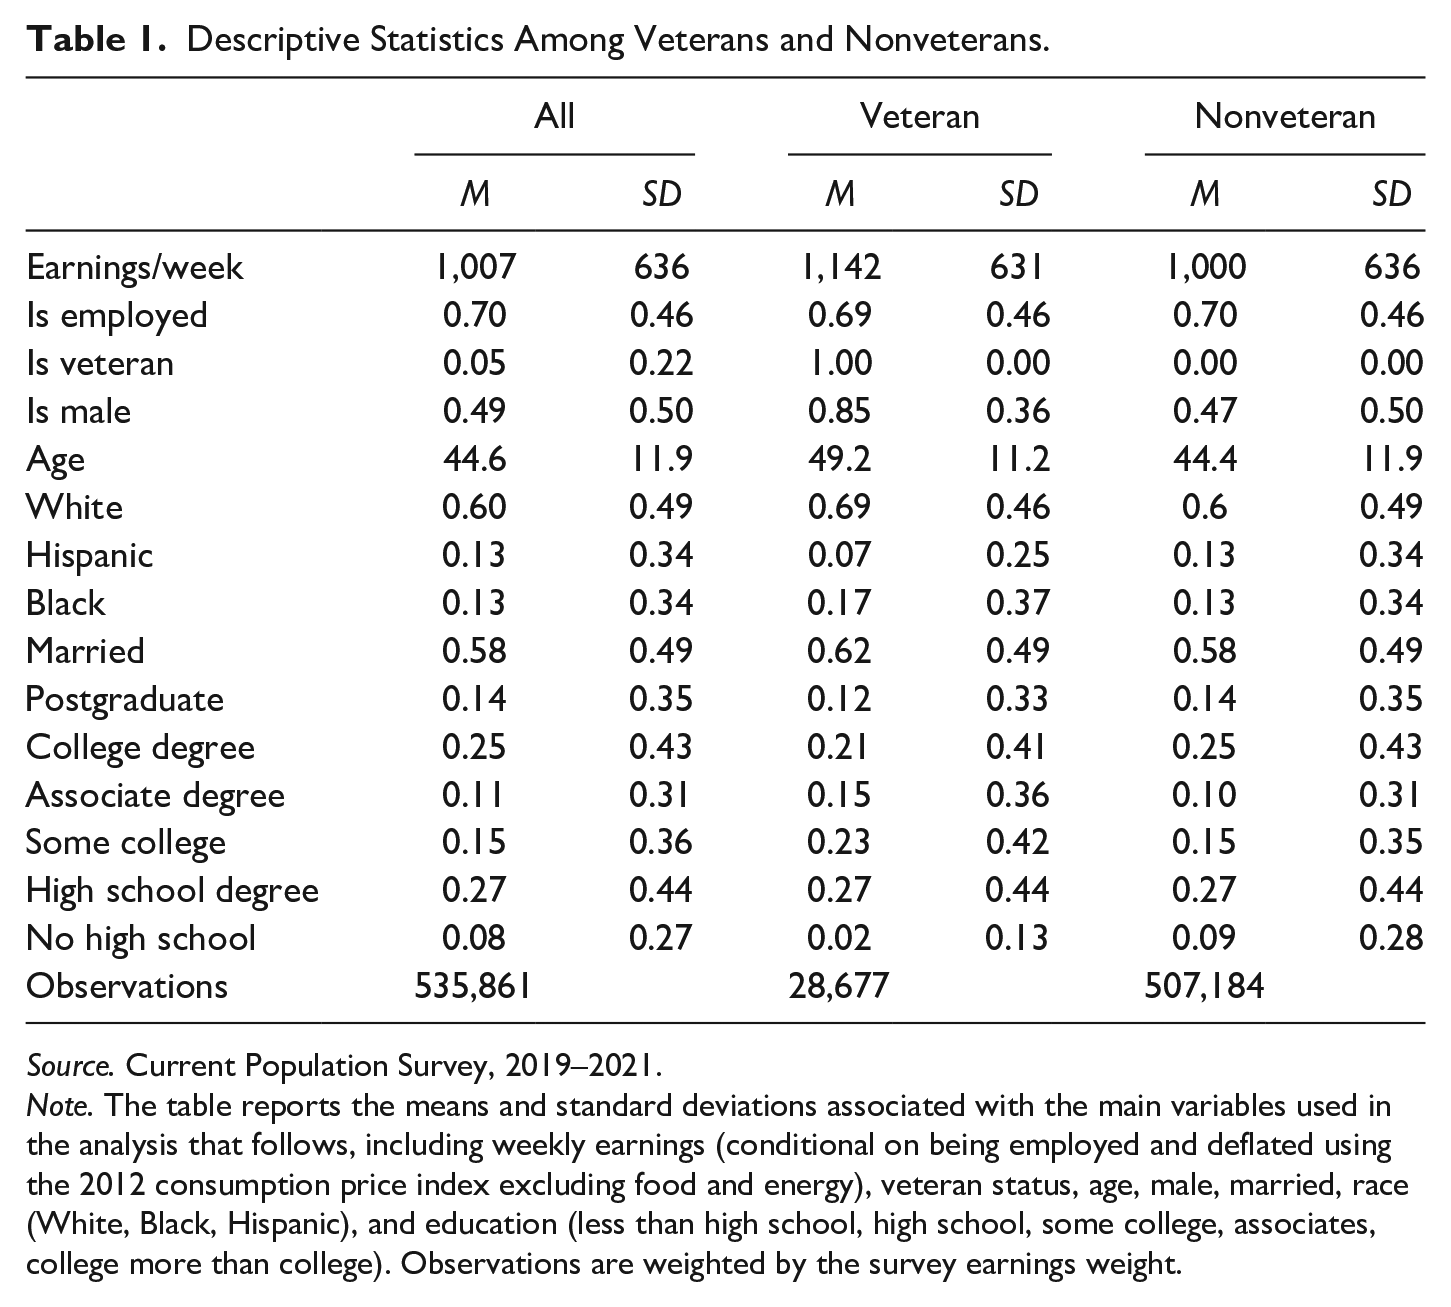
Source. Current Population Survey, 2019–2021.
Note. The table reports the means and standard deviations associated with the main variables used in the analysis that follows, including weekly earnings (conditional on being employed and deflated using the 2012 consumption price index excluding food and energy), veteran status, age, male, married, race (White, Black, Hispanic), and education (less than high school, high school, some college, associates, college more than college). Observations are weighted by the survey earnings weight.
Of course, raw comparisons of veterans and nonveterans are not valid due to a wide array of unobserved differences (evident with a nearly zero R2). Therefore, we control for demographic and socioeconomic characteristics in Column 2, which significantly attenuates the difference in log weekly wages. Here, veterans earned only 4.5% more conditional on working, and this difference did not change during COVID-19. Finally, in Column 3, we control for industry, occupation, and time effects. Prior to COVID-19, wages were 1.8% higher for veterans conditional on working, and again this difference did not change. We conclude that there is no evidence, conditional on remaining employed, that COVID-19 changed the relative wages of veterans. Results in Columns 1 to 3 suggest that significant selection effects explain the dispersion in earnings: adjusting for relevant demographic differences explains 70% of the raw cross-sectional veterans premium (comparing Column 2 to Column 1), and adjusting additionally for industry and occupational heterogeneity explains 90% of the premium. This is consistent with a substantial body of research in labor economics on veteran earnings premia (Angrist, 1990; Berger & Hirsch, 1985; Mehay & Hirsch, 1996). However, it is interesting that positive and statistically significant differences remain.
One concern about these results is that higher earnings among veterans could reflect income from reserves, among other sources. While we cannot test directly for reserve status, we can proxy by looking at age. Veterans over the age of 45 still earn 1.88% more per week than their nonveteran counterparts over the age of 45. Differences above and below age 45 are statistically insignificant when focusing on life satisfaction as an outcome. In this sense, reserve status could contribute to income differences, but they cannot account for all of it.
Turning toward employment, veterans were 2.3 pp less likely to be employed (Column 4), which did not change during COVID-19. Interestingly, Columns 5 and 6, which control for heterogeneity, show that the employment gap prior to COVID-19 becomes larger than the unconditional difference. In Column 6, veterans were 5.4 pp less likely to be employed prior to COVID-19, and again this difference does not change during COVID-19. We conclude that while veterans earn more conditional on being employed (Column 3), they are also less likely to be employed overall before and after the COVID-19 pandemic period. The key result in Table 2 is that unlike other at-risk groups, veterans did not fare worse than the general population with respect to weekly earnings, but disparities do exist with respect to employment status. Of note, the interaction effect is a “precise zero,” allowing us to reject the null that there is a large positive or negative effect. Results are also robust to estimating Equation 1 with a logit model.
Weekly Earnings Differences Among Veterans and Nonveterans.
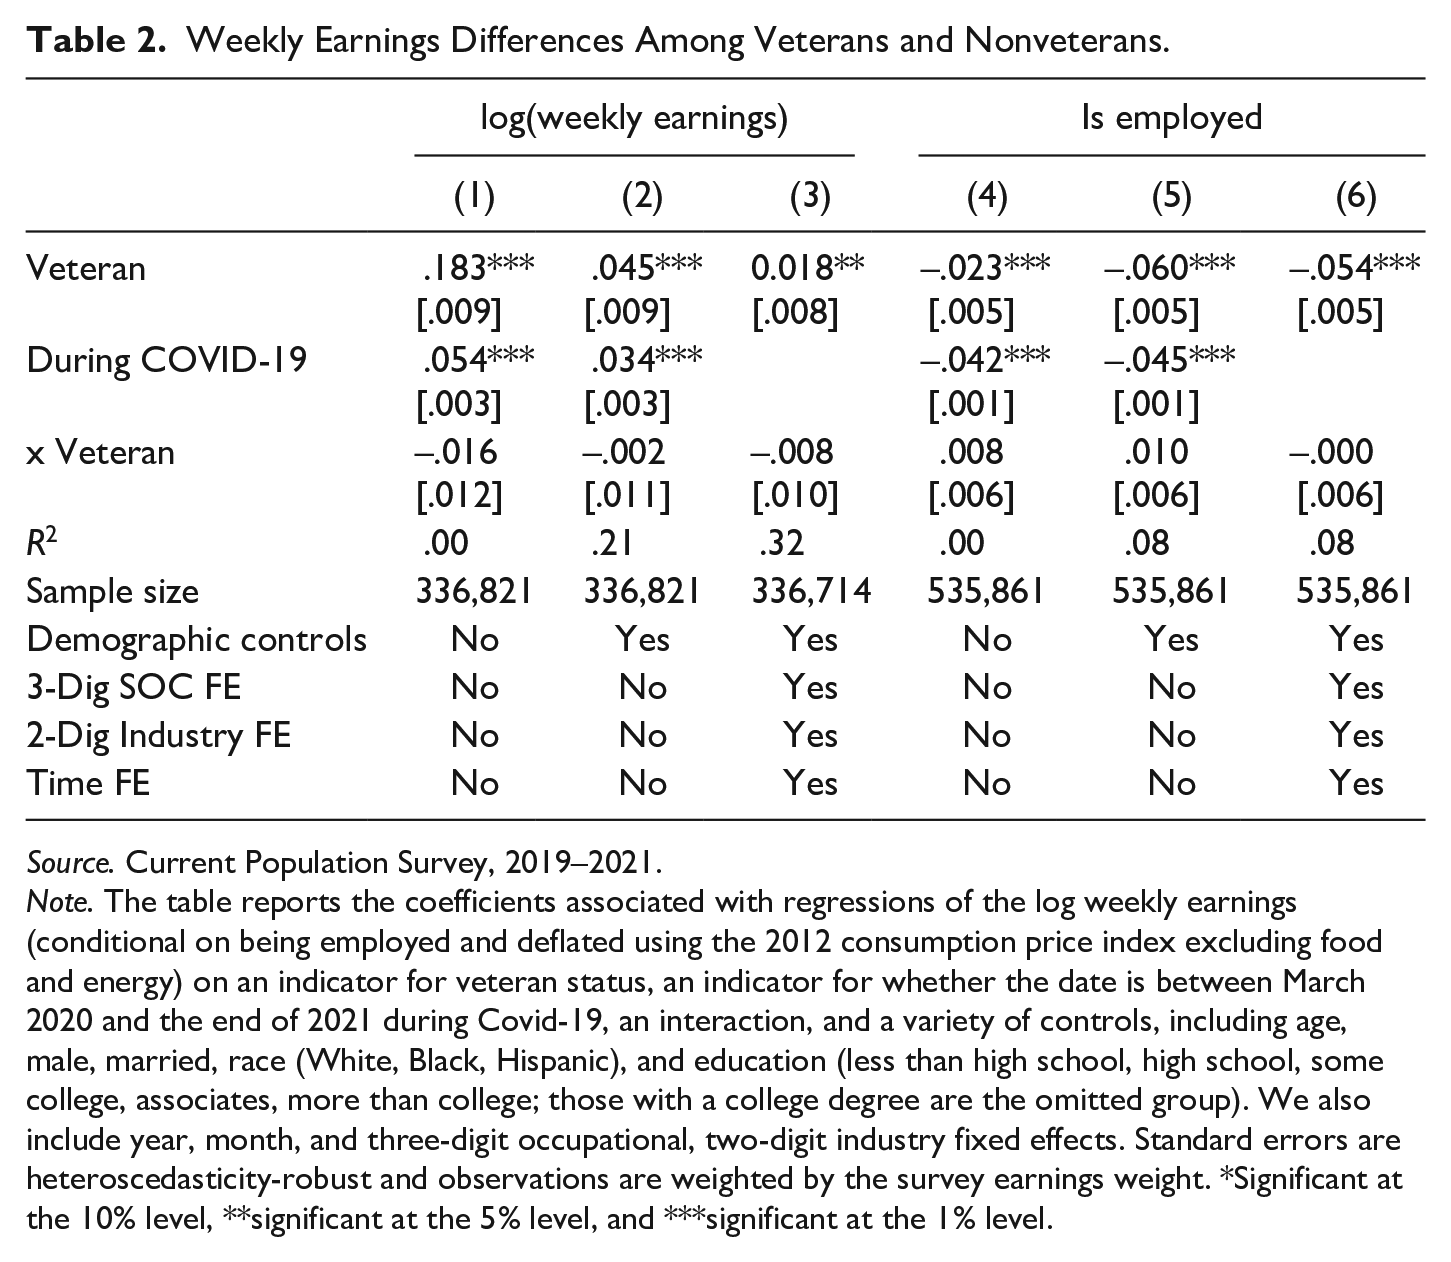
Source. Current Population Survey, 2019–2021.
Note. The table reports the coefficients associated with regressions of the log weekly earnings (conditional on being employed and deflated using the 2012 consumption price index excluding food and energy) on an indicator for veteran status, an indicator for whether the date is between March 2020 and the end of 2021 during Covid-19, an interaction, and a variety of controls, including age, male, married, race (White, Black, Hispanic), and education (less than high school, high school, some college, associates, more than college; those with a college degree are the omitted group). We also include year, month, and three-digit occupational, two-digit industry fixed effects. Standard errors are heteroscedasticity-robust and observations are weighted by the survey earnings weight. *Significant at the 10% level, **significant at the 5% level, and ***significant at the 1% level.
We also present results associated with some additional tests for heterogeneity, focusing on Columns 2 and 5 (without detailed fixed effects) as our baseline specifications. We find that White and non-Hispanic veterans earn 2.5% more than their nonveteran counterparts, White and Hispanic veterans earn 10% more, and Black veterans earn 3.8% more. While college (or more) educated veterans earn 1.9% less, this coefficient is not statistically significant. Veterans with less than a college education earn 7.6% more. Each of these coefficients are statistically significant at the 1% level (except the college or more educated group), and each of their interactions effects with the “during-COVID-19 era” indicator are statistically insignificant. That suggests that veterans generally did not earn less than their nonveteran counterparts.
However, when focusing on employment probabilities, we find that White and non-Hispanic veterans are 4.6 pp, White and Hispanic veterans 8.7 pp, Black veterans 6 pp, college (or more) educated veterans 5.4 pp, and less than college educated veterans 6.7 pp less likely to be employed. Again, the interaction effects with during-COVID-19 are statistically insignificant. These results highlight heterogeneity across veteran demographic sub-groups, but suggest that no group fared systematically worse over the COVID-19 era. How do these premia vary over the 2 years of COVID-19? In particular, we might expect that veterans may have fared worse at particular points of crisis over these years than others (e.g., when resources were more constrained and infections were at their peak). Figure 1 estimates Equation 1 separately by month between 2019 and 2021. While there are months when the earnings premium in Panel A is close to zero (and often statistically different from zero), the point estimates are almost always positive. Similarly, the employment gap in Panel B is always negative and, generally, more statistically significant than the earnings results.
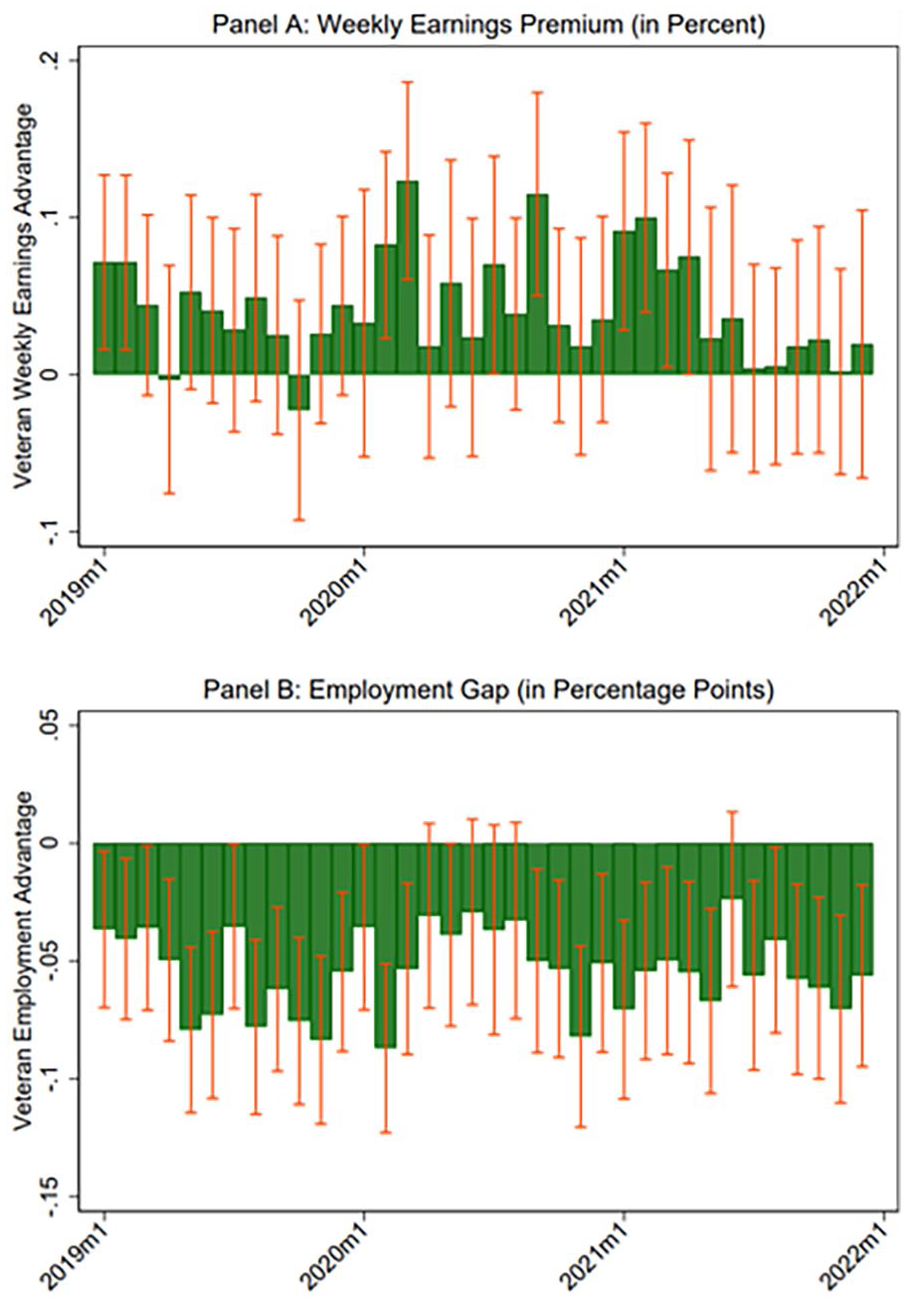
Weekly Earnings and Employment Probabilities, Veterans and Nonveterans.
Subjective Well-Being Differences
Our labor market results leave some ambiguity regarding relative welfare of veterans during COVID-19. On one hand, conditional on being employed, they earn more. On the other hand, they are less like to be employed. To better understand how veterans overall have been doing, we focus on attitudinal data from Gallup containing information on reported SWB. Such data have a long history in economics (di Tella et al., 2001; Easterlin, 1996; Layard et al., 2008; Oswald et al., 2015; Oswald & Wu, 2011). Moreover, self-reported measures of well-being contain important information and validation studies have found them to be sufficiently reliable (Krueger & Schkade, 2008). We nonetheless recognize the possibility that sampling variability may have changed during the pandemic, but Gallup has sought to make their data nationally representative over this span of time too.
Table 3 presents estimates of
Well-Being Differences Among Veterans and Nonveterans.
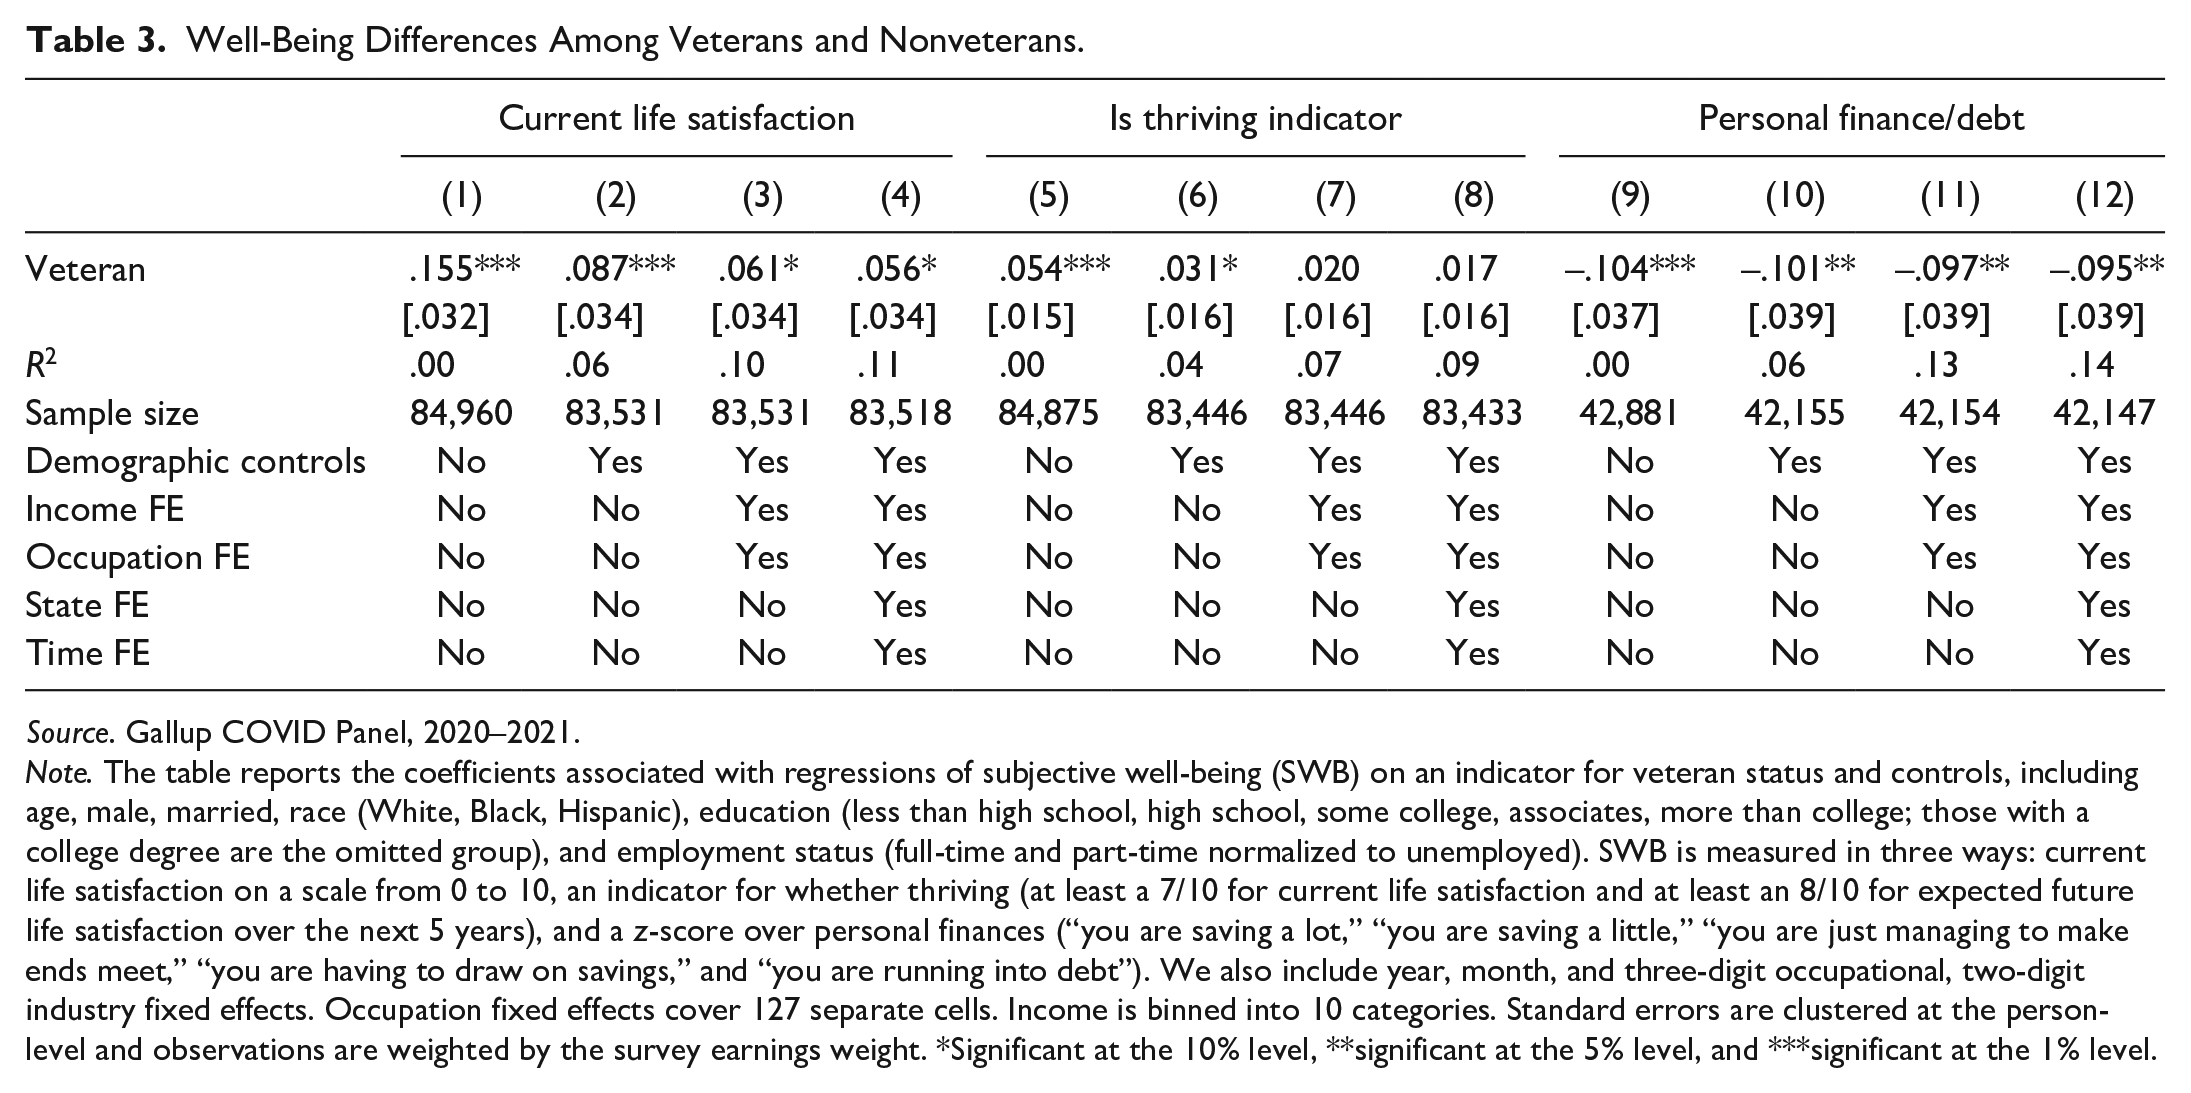
Source. Gallup COVID Panel, 2020–2021.
Note. The table reports the coefficients associated with regressions of subjective well-being (SWB) on an indicator for veteran status and controls, including age, male, married, race (White, Black, Hispanic), education (less than high school, high school, some college, associates, more than college; those with a college degree are the omitted group), and employment status (full-time and part-time normalized to unemployed). SWB is measured in three ways: current life satisfaction on a scale from 0 to 10, an indicator for whether thriving (at least a 7/10 for current life satisfaction and at least an 8/10 for expected future life satisfaction over the next 5 years), and a z-score over personal finances (“you are saving a lot,” “you are saving a little,” “you are just managing to make ends meet,” “you are having to draw on savings,” and “you are running into debt”). We also include year, month, and three-digit occupational, two-digit industry fixed effects. Occupation fixed effects cover 127 separate cells. Income is binned into 10 categories. Standard errors are clustered at the person-level and observations are weighted by the survey earnings weight. *Significant at the 10% level, **significant at the 5% level, and ***significant at the 1% level.
For each outcome, we progressively control for heterogeneity to examine how the conditional difference between veterans and nonveterans changes. Including demographics, income, occupation, state, and time controls attenuates the unconditional difference in means by roughly a third for life satisfaction—from 0.155 to 0.056 with the latter only statistically significant at the 10% level. Added controls attenuate the difference in the proportion of those thriving so that it is no longer statistically significant, but it remains positive and economically meaningful. The coefficients on veteran status when the outcome is personal debt remain statistically significant across these specifications, moving from −0.104 without any controls to −0.095 in the fully saturated model, suggesting that these differences in personal finances are not simply driven by, say, veterans being in higher paying jobs, on average.
How much of the change in coefficient comes from the inclusion of income versus occupational fixed effects? If we only added occupational fixed effects to Column 2, the coefficient declines from 0.087 (p-value = .01) to 0.066 (p-value = .051). However, if we instead used income fixed effects, the coefficient declines to 0.083 (p-value = .014). This suggests that veteran status affects well-being primarily through its effects in occupational choice, rather than income.
We expand on the earlier heterogeneity analysis by running regressions separately by demographic sub-group. We find that White veterans exhibit 0.076 SD, Hispanic veterans 0.034 SD, Black veterans 0.069 SD, college or more educated veterans 0.038 SD, and less than college educated 0.108 SD higher current life satisfaction. These results are consistent with the earlier empirical evidence on how veterans have fared in the labor market and suggest that minority and less educated veteran groups have been doing better overall too. Figure 2 estimates Equation 1 separately by month between 2019 and 2021, displaying largely positive coefficient estimates. Although there are some months when the premium is small and close to zero, it is generally always positive. Given that veterans are a small share of the sample, the error bands on these coefficients are large, but we can still generally reject the null of a zero effect. The precise difference in earnings, employment, and life satisfaction correlates with seasonal forces and federal/state quarantine policies.
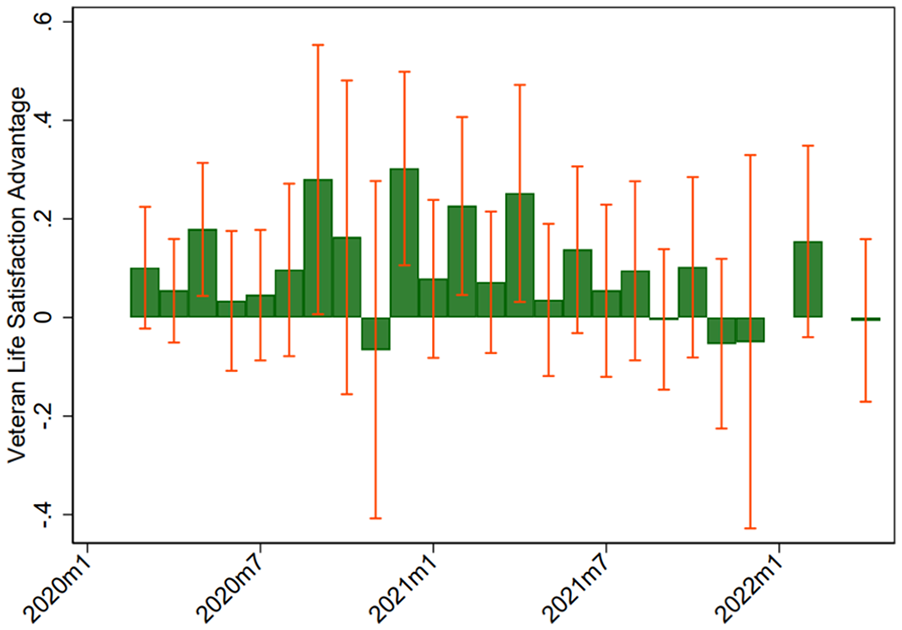
Subjective Well-Being, Veterans and Nonveterans.
To better understand the role of gender differences, we sequentially control for gender as we move from the raw correlation to the conditional correlation. When log earnings is the outcome variable, the coefficient moves from 0.18 to 0.086 with the inclusion of male. The interaction effect between male and veteran status (with all demographic controls) is 0.024 (p-value = .178). When life satisfaction is the outcome variable, the coefficient moves from 0.155 to 0.143 with the inclusion of male. The interaction between male and veteran status (with all demographic controls) is 0.031 (p-value = .737). This highlights the role of gender differences in understanding wages, much more than differences in life satisfaction.
To investigate one possible mechanism behind these results, we use the geographic heterogeneity in the Gallup data to infer distance between each respondent and their nearest VAMC. We measure this distance from the zip code centroid to the address of the VAMC, and we estimate Equation 2 by interacting this distance with veteran status. Table 4 documents these results. Like before, veterans still display systematically higher levels of life satisfaction and thriving probabilities, but results in Table 4 suggest that these differences decline in distance from VAMC facility. For example, in Column 3, which presents estimates from Equation 2 while controlling for demographic, time, zip code, income, and occupation terms, we find that a 10-mile increase in distance from a VAMC is associated with a 0.062 reduction in current life satisfaction. Put another way, the mean life satisfaction of veterans is generally worse than for nonveterans who live, say, 30 miles away from a VAMC. Similarly, the probability of thriving declines in distance for veterans—a 10-mile increase in distance from a VAMC is associated with a 0.025 pp reduction in the probability of thriving. Both of these distance results—for life satisfaction and thriving—are statistically significant, with p-values of .05 or lower.
Examining the Role of Distance as a Mediating Determining of Well-Being.
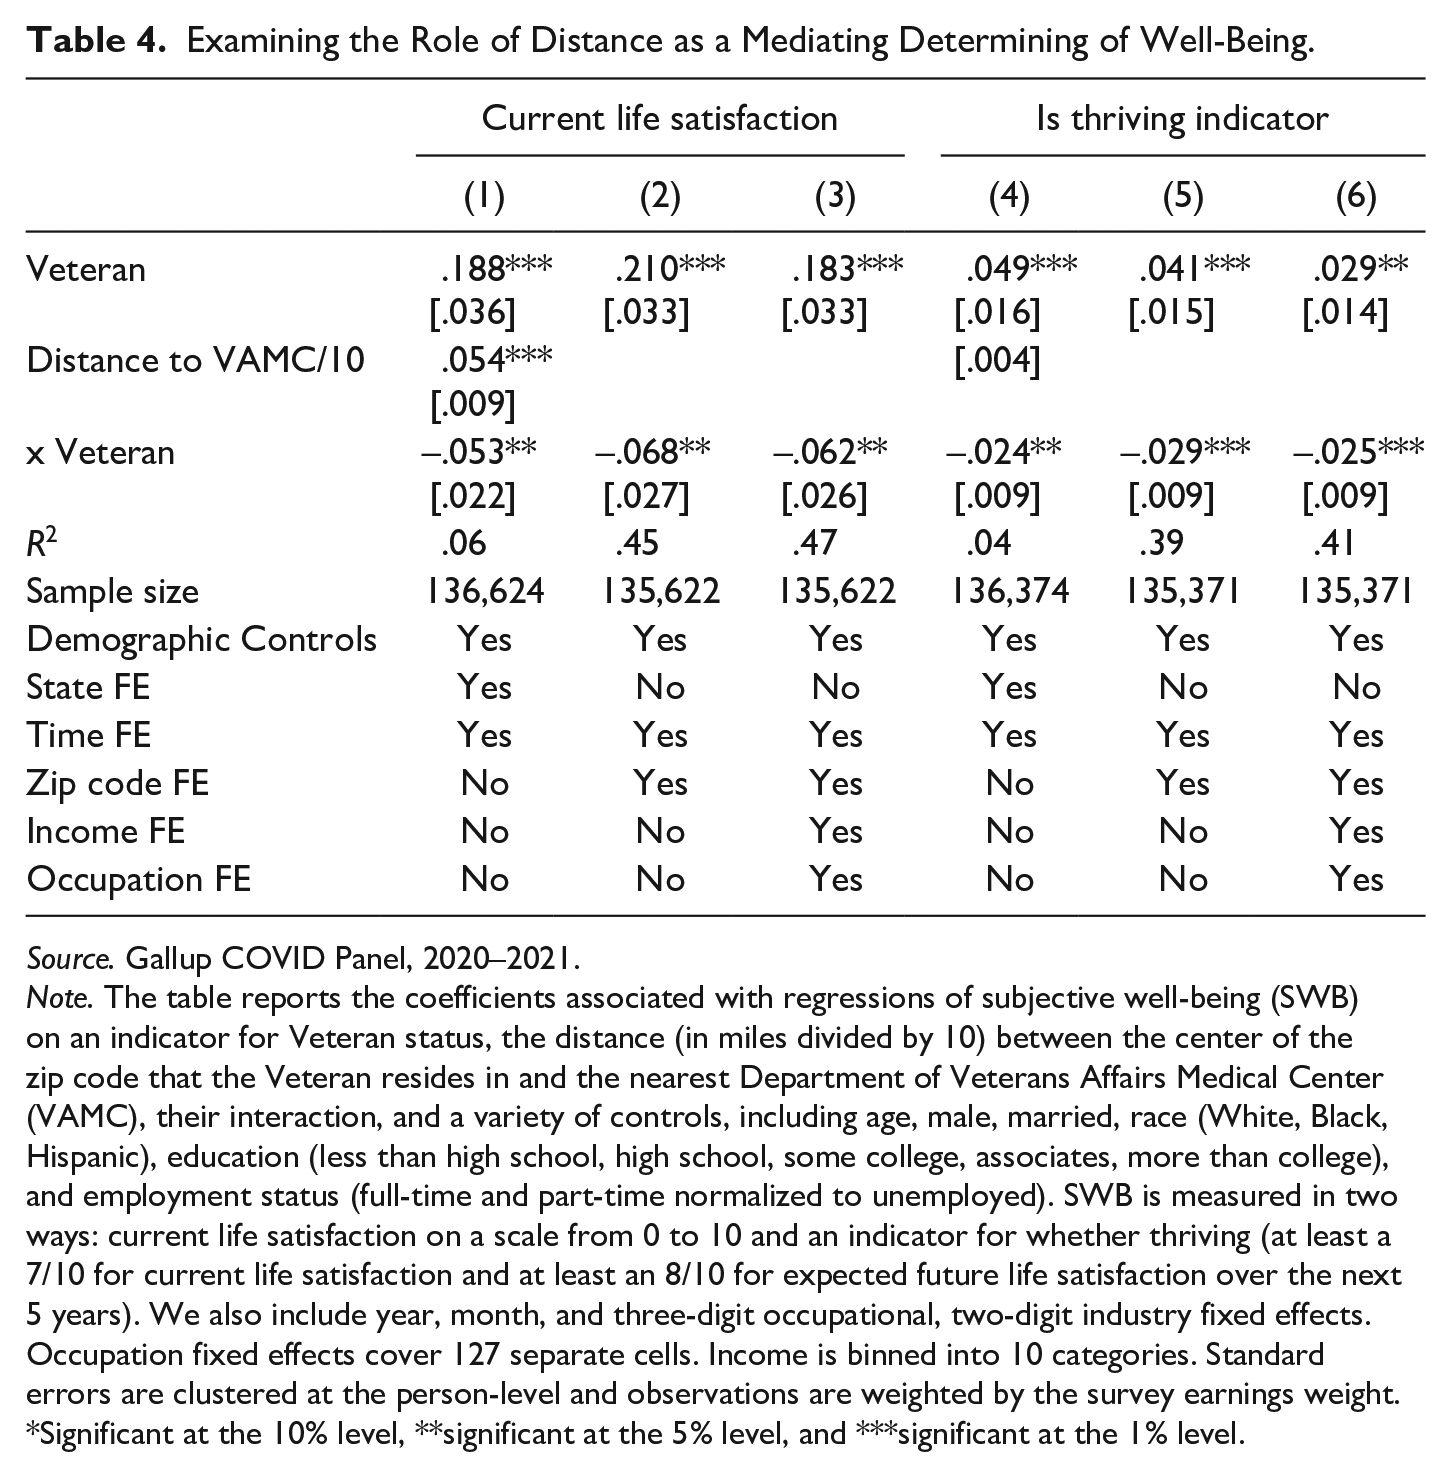
Source. Gallup COVID Panel, 2020–2021.
Note. The table reports the coefficients associated with regressions of subjective well-being (SWB) on an indicator for Veteran status, the distance (in miles divided by 10) between the center of the zip code that the Veteran resides in and the nearest Department of Veterans Affairs Medical Center (VAMC), their interaction, and a variety of controls, including age, male, married, race (White, Black, Hispanic), education (less than high school, high school, some college, associates, more than college), and employment status (full-time and part-time normalized to unemployed). SWB is measured in two ways: current life satisfaction on a scale from 0 to 10 and an indicator for whether thriving (at least a 7/10 for current life satisfaction and at least an 8/10 for expected future life satisfaction over the next 5 years). We also include year, month, and three-digit occupational, two-digit industry fixed effects. Occupation fixed effects cover 127 separate cells. Income is binned into 10 categories. Standard errors are clustered at the person-level and observations are weighted by the survey earnings weight. *Significant at the 10% level, **significant at the 5% level, and ***significant at the 1% level.
The intuition behind our specification comes from the fact that veterans should not be affected by distance to the VAMC—if they are even aware that there is one to begin with. We nonetheless recognize that an important confounding factor in this specification could be the rural-urban divide. To address this possibility, we estimate the regression separately for respondents who are in zip codes above versus below the median. We find that the coefficient estimate on the interaction effect is much larger for rural respondents (−0.29 vs. −0.06 for more urban), but the estimate is not statistically significant. However, the sample is also considerably smaller: we only observe 3,636 respondents in these zip codes below the median population. This is consistent with theory: distance to the VAMC matters more for veteran well-being in rural areas.
While an examination of what specifically explains these better outcomes among veterans closer to VAMCs is beyond the scope of our article, the results nonetheless underscore the important role that VAMCs played in moderating the turbulence of the COVID-19 era on veterans. If anything, these coefficients may understate the role of VAMCs if veterans who anticipate higher levels of health care utilization locate near VAMCs. Furthermore, our result on the importance of proximity to VAMCs may have even broader implications outside of a pandemic and for other relevant and non-health care-related veteran services. However, we cannot distinguish between two competing rationales behind this result. On one hand, veterans who live closer to a VAMC and spend more time at it may have access to better information. On the other hand, those veterans may simply cultivate stronger and more diverse social networks. We leave these competing hypotheses to future research.
Conclusion
Existing empirical studies suggest that veterans exhibit worse labor market and health outcomes than their nonveteran counterparts. By all accounts, the COVID-19 pandemic could have accelerated these trends, worsening their employment outlook and lowering their well-being, especially given evidence of exacerbated health and welfare disparities for other at-risk groups during COVID-19.
Using the latest data from the CPS and the Gallup COVID-19 Panel, we show that veterans exhibit greater weekly earnings conditional on working, and higher levels of well-being, even after controlling for many demographic and job-level characteristics. However, veterans are less likely to be employed, compared to their counterparts. To understand these results, we explore the role of VAMCs. Using differences between veterans and nonveterans in the same city, we find that veterans in closer proximity to a VAMC exhibit higher levels of well-being. While we do not observe individual utilization of health care services, the results suggest that medical centers may have helped veterans access medical and/or other services during the pandemic.
The article leaves several questions for future research. First, why and how did medical centers help moderate the effects of the pandemic on veterans? Did they behave only as hubs for health care services, or did they also provide a sense of community among veterans who were otherwise isolated from their family and peers? Second, will these improvements in veteran outcomes continue after the pandemic ends, or are they short lived? Future research should leverage additional individual-level data containing information on health care utilization with specific medical centers and link them to quality measures.
Footnotes
Disclosures
These views are our own and do not reflect those of any affiliated institutions.
Declaration of Conflicting Interests
The authors declared no potential conflicts of interest with respect to the research, authorship, and/or publication of this article.
Funding
The authors received no financial support for the research, authorship, and/or publication of this article.