
Abstract
Despite normative claims that elite foundation boards select elite nonprofits, foundations increasingly use community volunteers to allocate grants. There is an assumption that community involvement in grant making leads to better grant decisions. However, no one has tested this assumption and explored whether community members are even making different grant decisions than traditional boards. Drawing on a sample of six funders who use a community and traditional board, their 616 grantees, and 955 nongrantees, this paper empirically tests anecdotes replete in literature, identifying the organizational and financial determinants that influence community boards grant decisions versus those that influence traditional board decisions.
Introduction
In 2009, foundations contributed over $45 billion to nonprofit organizations in the United States. Yet, nearly 10% of these grants were given to just 50 of the largest, most established nonprofits (The Foundation Center, 2011). Critics argue that foundation grants are unevenly distributed across organizations, with a paucity of grants awarded to minority-led or minority-supporting organizations and those in early organizational life stages (Bernholz, Skloot, & Varela, 2010; Eisenberg, 2007; Gonzalez-Riveria, 2009; Kasper, Ramos, & Walker, 2004; Lenkowsky, 2002, 2012; Wolpert, 1993). This is consequently thought to affect the communities nonprofits serve, creating resource disparities across socioeconomic neighborhoods and rural–urban inequalities (S. R. Ashley, 2012; Odendahl, 1990; Wolpert, 1993). Historically, foundations have played a major role in social change and innovation. Examples include The Carnegie and Rockefeller Foundation grants to establish public libraries and support for medical advancement. Yet, scholars debate whether or not current forms of institutional giving (organized giving from groups) are able to achieve the ideals of their predecessors because grant decisions are influenced by individual preferences of board members rather than societal needs (Eisenberg, 2007; Lenkowsky, 2002, 2012). This paper investigates the effects of adding heterogeneity to the group of decision makers in the grants process and empirically tests what type of nonprofits are selected as grantees when community members, rather than traditional board members, make decisions.
Despite a few large foundations that have program staff and executives, a recent survey found that 76% of foundations have four or fewer staff members (The Foundation Center, 2009). In the average foundation, board members are making the majority of grant decisions. Anecdotal literature suggests that to effect change in which nonprofits receive grants, philanthropy must fundamentally change, by becoming more inclusive and allowing nontraditional decision makers to serve on foundation boards (Enright & Bourns, 2010; Lenkowsky, 2012; Ostrander, 1999). Research supports this assertion as “scholars have long theorized that public participation can help administrators better identify and understand public values and, consequently, improve policy decision making processes and outcomes” (Nabatchi, 2012, p. 2).
The primary reason citizen input is thought to improve grant making decisions is because community members are believed to have more knowledge of community needs and information on which nonprofits are better suited to address these needs (Bourns, 2010; Enright & Bourns, 2010; Lenkowsky, 2012; Ostrander, 1999). The efficacy of the grant making process is consequently enhanced as decision makers “will see problems from new perspectives, get new information, read into more networks, have greater legitimacy in the broad range of people in society, and be stronger and more effective” (as cited in Enright & Bourns, 2010, p. 45). However, these assumptions have never been empirically tested, and there is limited empirical evidence of a relationship between who serves on a foundation board and resultant grant decisions (Guo & Brown, 2006; McGinnis & Ashley, 2011). In addition, there are few indications in the broader public participation literature that community involvement changes or alters organizational decisions (Abelson & Gauvin, 2006; Ebdon & Franklin, 2006; Franklin & Ebdon, 2005).
Notwithstanding the lack of research on this phenomenon, the practice of public participation in grant decisions is growing. A recent survey found that nearly one half of grantmakers seek input on grant proposals from grantee or community representatives, 36% seek advice from grantee advisory committees, and 14% delegate funding decisions to grantee or community representatives (Bourns, 2010). To uncover whether or not foundations that use community involvement on their boards alter grant decisions, this paper builds on empirical findings from the economic model of giving (Weisbrod & Dominguez, 1986). At the time a donor makes a decision on donation, the donor cannot discern the true quality or performance of a nonprofit applicant. Therefore, donors reduce their search costs by relying on easily observable proxies of a nonprofit’s quality or reputation, rather than objectively evaluating a nonprofits performance. Research finds that donors contribute more to nonprofits that are older and larger and spend more of their expenses on programs as compared with management and fundraising expenses (Jacobs & Marudas, 2009; Parsons, 2007; Weisbrod & Dominguez, 1986).
However, this empirical literature has not explored the determinants of grants but instead examines the relationship between a nonprofits characteristics and contributions (an aggregated measure of gifts, grants, and donations from each nonprofit’s 990). Although foundations have access to more information at the time of their donations than individuals (grant applications often ask for board lists, performance metrics, funding history), survey reports indicate that foundations do not use a nonprofit’s self-reported performance information to make their grant decisions. Less than one half of the foundations use evaluation to select grantees and only 14.6% said they were interested in having their staff learn how to evaluate nonprofits (Alie & Seita, 1997).
Instead, a growing body of literature finds that foundations, like other donors, respond to easily observable proxies of performance, like a nonprofits age and size (S. Ashley & Faulk, 2010; McGinnis & Ashley, 2011). To generate and test hypotheses regarding the different nonprofit characteristics that community and traditional boards would reward, by funding certain nonprofits over others, I integrate empirical findings from donation-determinant literature with theoretical perspectives from Granovetter (1983), which describes the outcomes that result from increased access to heterogeneous information sources.
The analysis is conducted within a unique set of six grantmakers that have both a community and traditional board, which distribute grants to nonprofits through separate grant programs. Using multinomial logistic regression, I compare the organizational and financial characteristics of grant recipients using Internal Revenue Service (IRS) 990 data on 204 community board grantees, 412 traditional board grantees, and a comparable sample of 955 nongrantees. Regression analysis reveals that community boards award grants to a larger proportion of new applicants (nonprofits that were not funded in previous years) and grassroots nonprofits, than traditional boards. However, when community and traditional boards make grant decisions between a similar group of professional nonprofit applicants, community boards are significantly more likely than traditional boards to award grants to older nonprofits. These findings call into question the assumption that community input can vary the types of nonprofits that acquire foundation grant dollars. Furthermore, this analysis informs policymakers that additional research is needed to understand the complex relationship between board composition and administrative decisions, before legislation (e.g. California and Florida) concerning foundation diversity is advanced
The Emergence of Community Boards
Arnstein’s (1969) ladder of participation is the first description of the variations in power that different models of public participation give to citizens. Each rung of Arnstein’s (1969) ladder depicts a specific model of public participation and the amount of power that citizens are awarded in this model. Models on the lower rung of Arnstein’s (1969) ladder are indicative of public participation programs that give citizens very little power to influence decisions, primarily because citizens are only able to engage in one-way communication with organizations.
However, institutionalized citizen roles (Thomas, 1995) would be an example of a public participation program that is on the highest rung of Arnstein’s (1969) ladder, as citizens have been given complete control and power to make administrative decisions. In institutionalized public participation programs citizen input is not filtered through another entity (Abelson & Gauvin, 2006; Campbell, 2005; Thomas, 1995). Examples include the allocation of Community Development Block Grants during the 1970s, certain instances of participatory budgeting (Cabannes, 2004), and the Department of Housing and Urban Development’s use of citizens within a metropolitan area to allocate grants to local nonprofits addressing homelessness.
Within the philanthropic sector community boards are an example of institutionalized public participation programs. This newly emerging phenomenon has been called participatory philanthropy, stakeholder engagement in philanthropy, resident-led grant making, and crowd sourcing philanthropy. Similar to traditional boards, community boards review grant applications, conduct site visits, and negotiate final grant awards. However, for the purposes of this paper community boards are differentiated from traditional boards by the variety of ways they recruit board members and the intentions they set for the composition of their boards based on their varied recruitment strategies.
Traditional foundation board members are typically recruited in one way—Existing board members ask individuals they know to serve on foundation boards (Gersick, 2004). Alternatively, community board members are intentionally recruited and selected in several ways (McGinnis, 2013). For example, some foundations ask community members to submit volunteer applications. Others ask community leaders or past grantees to nominate potential board members. Some grantmakers put ads in neighborhood or newspapers, whereas others use references from foundation staff, past grantees, or existing community board members. Essentially, the defining characteristic of a community board is an open recruitment process, where participants are recruited in a variety of ways. Furthermore, community boards are distinguished from traditional boards in that the variety of recruitment mechanisms are intentionally used to generate a heterogeneous group of community members to introduce a broader array of interests, perspectives, and networks into the grant selection process (Bourns, 2010; Enright & Bourns, 2010; Lenkowsky, 2012; McGinnis, 2013; Ostrander, 1999).
Alternatively, traditional boards closed recruitment process reinforces their demographically homogeneous membership. This closed recruitment process influences the demographic composition of traditional boards as studies consistently indicate that members of traditional boards lack both racial, ethnic, and gender diversity (Burbridge, Diaz, Odendahl, & Shaw, 2002; Lindeman, 1988; Ostrander, 1999; Ostrower & Stone, 2006). The lack of diversity on foundation boards influences the likelihood that grant recipients are larger, older, and more established nonprofits as nonprofits outside of traditional boards existing networks or personal knowledge are not selected as grantees (Grønbjerg, Martell, & Paarlberg, 2000). Consequently, the existing grants process is described as inefficient because grant decisions are not reflective of the needs of nonprofits and/or the communities they serve (Gonzales-Riveria, 2009; Kasper, Ramos & Walker, 2004; Ostrander, 1999). Grant makers are described as
out of touch with the people they should be trying to help . . . do not actually know as much as they claim . . . cling to outmoded, often technocratic ideas; or pursue agendas that fail to address social problems effectively. (Lenkowsky, 2012, p. 464)
However, the virtues of community boards are extolled in literature because they are assumed to increase bridging or inclusive social capital (Putnam, 2001), where a heterogeneous group of individuals who have weak ties (Granovetter, 1983) comprise the boards’ membership. The weak ties generated by members of community boards lead to a variety of nonprofits being awarded grants, as community boards access the collective wisdom of varied sources of information during the grant decision process (Gibelman, Gelman, & Pollack, 1997). Practitioner reports suggest that community boards will “increase transparency and trust, and to ensure that their grantmaking reflects real-world priorities and needs” (Bourns, 2010, p. 4). Granovetter (1983) finds support for this assertion as increases in occupation status occur from information gathered and accessed by individuals with weak as opposed to strong ties.
Yet, many public participation programs that bring together heterogeneous individuals in a group do not yield the outcomes suggested by scholars. This may be true for a number of reasons, including: boards being controlled by local elites (Jenkins, 1998), individuals who participate to pursue their own self-interests (Campbell, 2005; Fung, 2003), or individuals not participating because they are not aware of participatory opportunities (Verba, Schlozman, & Brady, 1995). However, community boards mitigate these concerns because recruitment efforts are aggressive (Thomas, 2012). The aggressive recruitment increases the propensity that community boards will be composed of heterogeneous individuals with weak ties to each other, as these boards are intentionally designed to prevent homogeneity and strong ties that occur on traditional foundation boards.
Understanding whether or not community boards live up to their ideals has still gone unanswered in scholarly literature despite the increased practice of using community boards by foundations.
Information Asymmetry and Determinants of Donations
Ideally, donors would like to discern the quality and/or performance of the nonprofits to which they are awarding a donation. However, determining this information is very difficult, if not impossible, particularly at the time a donation is made (often before the nonprofit provides its services to beneficiaries). Instead of incurring high transaction costs to search for this information, donors rely on easily observable organizational and financial characteristics, often found on an organization’s annual report, 990 form, or on an organization’s website (Saxton & Guo, 2011). There is extensive empirical work on the determinants of donations, which originated with Weisbrod and Dominguez’s (1986) study on the economic model of giving. Recent reviews of this work by Parsons (2007), Jacobs and Marudas (2009), and Marudas, Hahn, and Jacobs (2012) indicate some consensus across studies. Older, larger nonprofits that spend more on programs and fundraising, as opposed to management and administrative expenses, receive more contributions than their smaller, younger counterparts.
Scholars also acknowledge that in addition to objective nonprofit characteristics influencing donation decisions, funders also use subjective sources of information. For institutional funders, board members’ own experiences and preferences often influence grantmaking decisions (Alie & Seita, 1997; Galaskiewicz, 1985, 1997; Wang & Coffey, 1992; Werbel & Carter, 2002). Nielsen (1972) writes about this subjectivity, comparing foundation boards with bankers who are “waiting for loan applications to be presented; and like any careful banker, they tend to give preference to the applicants who are familiar, who can present good credentials, and who are generally sound” (p. 275).
Using elite and network theories a small body of literature investigates the relationship between the subjective determinants of donations for foundations, which primarily concerns how a foundations board composition and structure influences the types of nonprofits awarded grants (Delfin & Tang, 2007; Galaskiewicz, 1985, 1997; Grønbjerg et al., 2000; Silver, 2007; Wang & Coffey, 1992; Werbel & Carter, 2002). Scholars find that those who lead and govern foundations are members of the elite, a similar concept to Mills’s (1956) power elite. These individuals not only have a lot of money and prestige, but are also in positions of power to make decisions that have significant impacts in society (Karl & Katz, 1987). The concept of compositional elitism guides this research, as traditional board members award grants to nonprofits that reflect their own interests (Delfin & Tang, 2007; Galaskiewicz, 1985, 1997; Silver, 2007). Odendahl (1990) writes, “Private contributions by the elite support institutions that sustain their culture, their education, their policy formulation, their status - in short, their interests” (p. 232). Arnove (1980) states that when philanthropic boards decide to fund certain nonprofit organizations over others they “have channeled their energies and research activities in directions they deemed important” (quoted in Karl & Katz, 1987, p. 2). Literature using this theory indicates that in choosing which nonprofits receive funding, board members grant decisions are mediated by their own interests.
Scholars that use network theories also support these propositions and find that the personal and professional networks of traditional foundation board members dictate which nonprofits are “in” or “out” of their grants network. Middleton (1987) explains, “The socioeconomic power of a grantee agency’s board and its clientele, rather than the substantive content of its program, becomes the standard for allocation” (p. 147). Grønbjerg et al. (2000) describe a two-stage grant selection process. They write,
First, agencies compete to become known to the funder. Once they are known, they compete with other known and trusted agencies. For those who enter the latter stage, reliance on informal procedures and low turnover rates reduce the time and efforts that both parties need to invest, and allow funders to use familiarity and trust as a stand in for more objective determinations of an agency’s capacity to carry out specified objectives. (Gronbjerg et al., 2010, p. 37)
However, the ability of community boards to access more and varied sources of information—because they intentionally recruit a heterogeneous group of individuals—is thought to generate an information advantage in the grant selection process. Although members of a community board are also relying on their individual experiences, networks, and preferences in the grant decision process, the variation in perspectives and multiplicity of experiences, networks, and preferences will allow a wider number of community needs and solutions to be represented during the grant decision process.
Practitioner reports of foundations that use community members in grant programs describe citizens as critical assets who help funders access localized knowledge. This information not only contributes to the delivery of relevant services but also “extends our reach and knowledge of who’s doing what in the community” (Bourns, 2010, p. 28). A recent blog post summarizing practitioner experiences with community boards reports on the Chinook Fund, which described grantees funded by citizens as more likely to be early stage nonprofits and “those that are consistently overlooked by other foundations” (Chang, 2013).
Despite this merely being anecdotal evidence, similar results have been found in related literature on giving circles (see Eikenberry, 2009). Giving circles are also created to purposefully involve a heterogeneous group of community members in the distribution of grants to nonprofits. Consequently, giving circles increase members’ exposure to local needs and issues with which they were not previously familiar (Eikenberry, 2006, 2009). Grants made by giving circles are mostly awarded to smaller, grassroots nonprofits, and organizations outside of the existing networks of individuals within the giving circle.
Similarly for community boards, it is the act of bringing together a heterogeneous group of people that changes not only the types of information members access when making grant decisions, but also what type of nonprofits are awarded grants. Consequently, I posit that community boards will demonstrate different patterns in their grantee selection than traditional boards, awarding grants to nonprofits that would not typically be funded. Previous findings on the donation determinants of traditional boards are juxtaposed with a summary of all hypotheses in Table 1.
Summary of Previous Findings on Characteristics of Traditional Board Grantees Juxtaposed With Hypotheses on the Characteristics of Community Board Grantees.
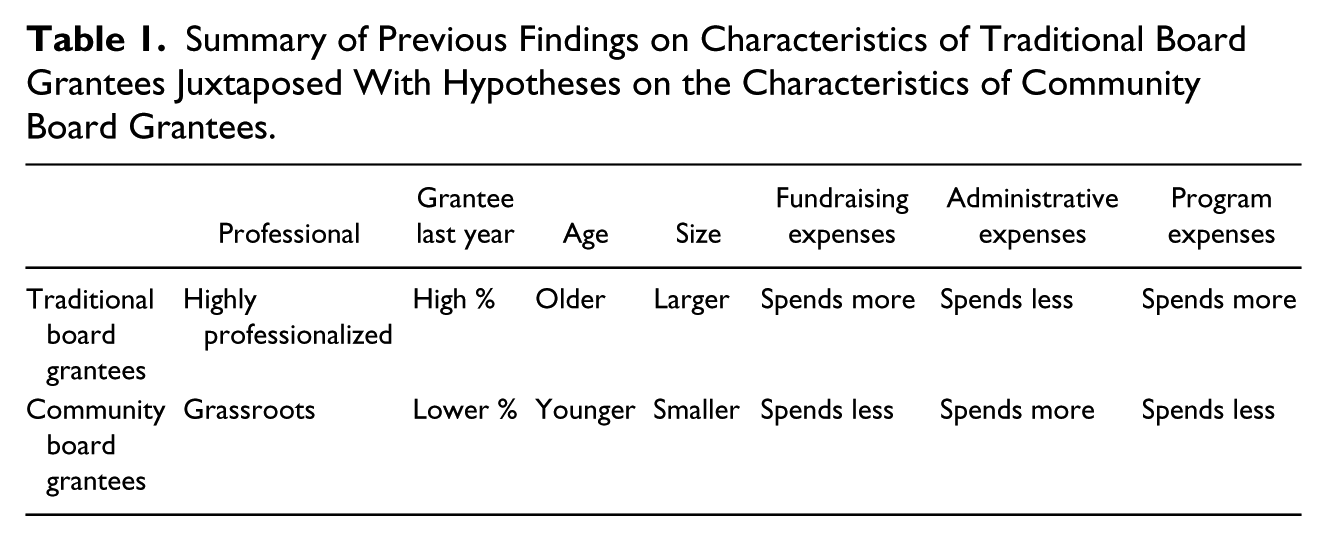
First, for traditional boards, the professionalization of a nonprofit and whether or not it has previously been awarded a grant by that funder are two organizational characteristics used as proxies of a nonprofits quality or performance (Grønbjerg et al., 2000). I hypothesize that community boards will be less likely to use these characteristics as proxies of performance, largely due to the composition of their boards and the multiplicity of perspectives that heterogeneous board members incorporate in their grant decisions Therefore, I hypothesize:
A nonprofit’s age and size are other characteristics that donors use as proxies in lieu of discerning an organizations legitimacy and/or quality (Trussel & Parsons, 2003; Weisbrod & Dominguez, 1986). Age serves as a proxy for quality and trustworthiness as younger nonprofits are believed to be more likely to fail. Weisbrod and Dominguez (1986) write, “The longevity of the firm [is] a signal of the extent to which it actually provides the level and quality of output it purports to supply” (p. 94). Older nonprofits receive more donations because “they develop a greater stock of goodwill with the public” (Marudas, 2004, p. 87). Although the findings on age are inconclusive, most scholars find that older organizations receive larger amounts of contributions than younger nonprofits (Okten & Weisbrod, 2000; Szper & Prakash, 2011; Weisbrod & Dominguez, 1986). Only one study to date has empirically tested the influence of a nonprofit’s age on grantee selection (S. Ashley & Faulk, 2010) and found insignificant results. Yet, Tinkelman’s (1998) study found that larger donors are more likely to use age as a proxy of quality than smaller donors.
Donors also use an organizations size as a proxy for a nonprofits reputation. Large organizations are viewed as legitimate, often because they have more name recognition (Baum, 1996; Szper & Prakash, 2011). Alternatively, researchers speculate that size may serve as a proxy for the amount of services or output of a nonprofit (Galaskiewicz, 1985). Overall, there is scholarly consensus that contributions are positively related to the size of a nonprofit (Buchheit & Parsons, 2006; Church & Parsons, 2008; Gordon, Knock, & Neely, 2009).
Although traditional foundation boards use a nonprofits age and size as proxies for the performance or quality of a nonprofit, the diversity of board perspectives, and information used by heterogeneous members of community boards would not generate a similar distribution of grants. Furthermore, community boards are intentionally created to aggregate “local needs and preferences that otherwise might not be well represented within formal institutional structures” (Jun & Musso, 2013, p. 75). Therefore, community boards’ decisions are not based on proxies of organizational quality. Instead community boards’ grant decisions are primarily concerned with finding solutions to local community needs. This likely results in nonprofits awarded grants that are smaller, and younger—organizations that would not be funded by traditional boards. Again, these results are confirmed in research on giving circles, as nonprofit grantees tend to be smaller and younger (Eikenberry, 2009).
Various nonprofit financial characteristics are also used by donors as proxies of performance (Jacobs & Marudas, 2009; Parsons, 2007). Existing evidence suggests that large donors and traditional boards are especially sensitive to financial measures and are more likely than smaller donors to take an organizations financial condition into account when making donation decisions (S. Ashley & Faulk, 2010; Tinkelman, 1998). There are three financial measures that are investigated in empirical studies of contributions: a nonprofit’s fundraising expenses, management expenses, and program expenses.
For nonprofits, fundraising expenses are synonymous to marketing or advertising expenses in for-profit organizations (Calabrese, 2011; Church & Parsons, 2008; Okten & Weisbrod, 2000; Szper & Prakash, 2011; Weisbrod & Dominguez, 1986). 1 Just as advertising expenses drive future sales in for profit organizations, nonprofits’ fundraising expenses have a positive impact on future donations (Calabrese, 2011; Gordon et al., 2009). Trussel and Parsons (2003) indicate that advertising expenses represent the quantity of information nonprofits provide to potential donors about their organization and its operations. Often nonprofits that spend more on fundraising expenses are well known and considered brand names (Weisbrod & Dominguez, 1986). Alternatively, some studies find a negative relationship between fundraising expense and contributions received (S. Ashley & Faulk, 2010; Weisbrod & Dominguez, 1986). For example, S. Ashley and Faulk (2010) find that traditional boards grant larger amounts to nonprofits that demonstrate lower fundraising costs. However, Jacobs and Marudas (2009) and Marudas, Hahn, and Jacobs (2012) have recently published robust specifications of Weisbrod and Dominguez’s (1986) donation determinants model and find that fundraising expenses increase the amount of contributions a nonprofit receives.
Management expenses are negatively related to contributions, as donors prefer that nonprofits spend money on programs as opposed to other expenses (Greenlee & Brown, 1999). Conversely, program expenses are expected to serve as a proxy of a nonprofits commitment to achieving its mission or the “portion of each contribution that reaches the organization’s beneficiaries” (Trussel & Parsons, 2003, p. 3) and are generally found to be associated with greater contributions (Greenlee & Trussel, 2000; Okten & Weisbrod, 2000; Parsons, 2007; Tuckman & Chang, 1991; Weisbrod & Dominguez, 1986).
With the diversity of perspectives and information used by heterogeneous members on community boards, I posit that community boards will be less inclined to use financial metrics as proxies for a nonprofits quality or performance. Therefore, grantees selected by community boards will not share the same characteristics as traditional board grantees. They will spend less on fundraising, more on management and less on programs. Again, community boards grant decisions will be focused on meeting the needs of their local communities, which is irrespective of the financial characteristics of nonprofit applicants. Therefore, I hypothesize the following:
Data and Method
Sampling Strategy
Community boards have only recently been described in practitioner reports and there have been few scholarly investigations of community boards (Enright & Bourns, 2010; McGinnis, 2013). Although it is difficult to describe the population of foundations that use community boards, a recent survey found that nearly one half of the grantmakers seek input on grant proposals from grantee or community representatives (Bourns, 2010). These statistics were confirmed in another study where 64% of grantmakers surveyed involved community boards in their grants decisions (McGinnis, 2013).
Through convenience sampling (internet searches and personally contacting philanthropic practitioners) a total of six funders are included in this paper that have a community and traditional board making grant decisions for separate programs. There are no lists of foundations that use community and traditional boards, and although the sample in this paper is nonrandom, I purposefully include four public foundations and two private foundations to be consistent with the proportional representation of private and public foundations that other studies 2 identify as using community boards. 3
Foundations had to satisfy two criteria to be included in this research. First, each funder had to indicate (either on their 990 form or on their website) which board each grant came from. 4 In addition, community board members must make final grant decisions. Many funders involve community members in grant making and then have those decisions filtered through another board (McGinnis, 2013). Because this paper specifically focuses on the role of community input in grant decisions, only organizations that have observable community input on final grant decisions were included.
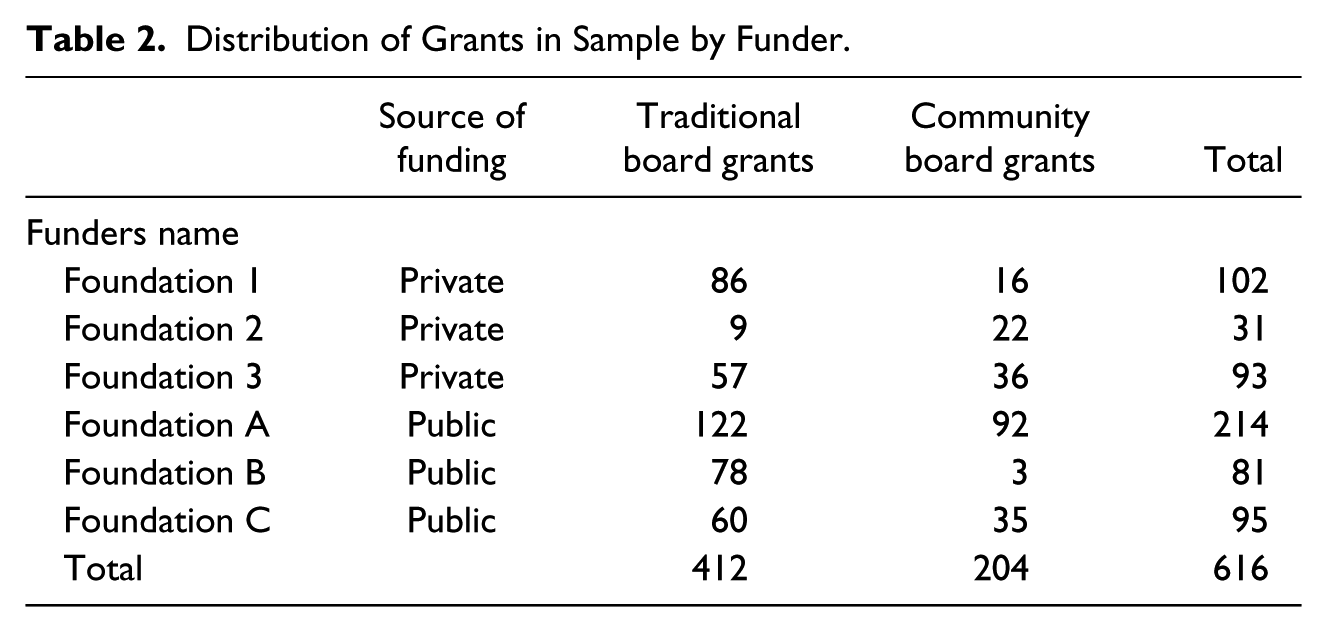
To create the dataset, organizational and financial information of grantees and nongrantees was collected. To compile this information on grantees, the names of each nonprofit awarded a grant in 2008 were manually collected from each funders 990 form. After conducting an extensive search (using the National Center for Charitable Statistics, Guidestar, and Google) for the tax identification number (EIN) of each nonprofit recipient, this list was then merged with the 2007 5 Core 990 Public Charity files to secure grantees financial information. 6 As detailed revenue and expense information was not available in the Core files, this information was manually collected from each grantees 2007 990 form. 7 This yielded 616 unique grantees. Table 2 includes a description of the distribution of grants from each funder.
Distribution of Grants in Sample by Funder.
In addition to examining the differences in organizational and financial characteristics of the 616 grant recipients, this research also asks whether or not the preferences of community and traditional boards are observed in the broader nonprofit marketplace. When community and traditional boards are reviewing grant applications, which organizational and financial characteristics do they reward? Although I was unable to collect information on which nonprofits applied for grants, and/or which of those were rejected, each foundation’s tax form does include a grantee list of the nonprofits that received grants. Grantee characteristics were then used to create a hypothetical nonprofit applicant marketplace, which included 955 8 comparable nonprofit organizations that did not receive grants, to build a probability model for multinomial logistic regression.
Nonrecipient organizations were IRS Form 990 reporting 501(c)3 organizations that did not receive a grant from any of the foundations in the sample during 2008. Nongrant recipient organizations were selected using multiple selection criteria. First, the data were restricted to nonprofit organizations that were likely to seek foundation grant support. The nongrantees sample only includes organizations that rely on donation income for some portion of their annual revenue by excluding nonprofit organizations that reported less than $1,000 in contributions on their 990 form. Second, because most of the funders in the sample gave only in the counties in which they were located, data were restricted to a sample of nongrantees in counties where grant recipients were located using the Federal Information Processing Standard (FIPS) codes. The fact that giving is highly localized for the six funders precludes there being other grants made by similar foundations, as my research revealed that there were not similar funders (with both community and traditional boards) in the area. Finally, the sample of nongrantees was further reduced to only include nonprofit organizations that fit the expressed giving priorities of sampled foundations. 9 This yielded a sample of 955 nongrantees. Detailed revenue and expense information of nongrantees was also manually collected from each organization’s 2007 990 form since this information is not available in the Core files.
Finally, following Tinkelman and Mankaney (2007), the empirical models were restricted to nonprofits that report fundraising and administrative expenses over $1,000 and positive amounts of contributions, as their financial data are more reliable.
Methodology and Variable Descriptions
A multinomial logistic regression model was used, as the dependent variable was categorical with a nonprofit that was (a) awarded a community board grant (but not a traditional board grant), (b) awarded a traditional board grant (but not a community board grant), or (c) a nongrantee, not awarded a grant by either a traditional or community board. 10 As I am interested in comparisons between traditional and community board grantees, the reference category is a traditional board grantee.
The hypotheses are tested through two groups of independent variables, organizational and financial characteristics of nonprofits. The organizational characteristics include the professionalization of the nonprofit, whether the nonprofit received a grant in the previous year from a funder, age, and size (natural log of total assets).
The professionalism of a nonprofit is an ordinal level variable operationalized as whether the nonprofit completed a 990, and if it did which 990 form it completed. An organization that did not complete a 990 was represented by 1, an organization that completed a 990 EZ was represented by 2, and 3 represented an organization that completed a 990. Nonprofits that do not file a 990 form are considered grassroots organizations because their efforts are not organizationally formalized and they typically rely on volunteer labor (Grønbjerg & Paarlberg, 2002; Smith, 2000). Legally, organizations with revenues under $25,000 do not have to file a 990, and those with revenues between $25,000 and $500,000 must file a 990 EZ. However, many of the nonprofits in these revenue categories still file a 990. This may be an indication that IRS filings not only provide material benefits to the organization and its donors, but symbolic benefits as well. This suggests a level of professionalism an organization is trying to communicate with stakeholders (Grønbjerg & Paarlberg, 2002).
To determine if a nonprofit was a previous grantee, a list of each funder’s grantees was manually gathered from 2007 990 forms. This variable is dichotomous, with 1 representing receipt of a grant in a previous year and 0 representing not receiving a grant in the previous year. Receiving a grant in the previous year is a powerful predictor of whether or not an organization receives a grant in the subsequent year (Grønbjerg et al., 2000).
The age variable was created by subtracting the organizations rule date (or when the organization obtained their official recognition by the IRS) from the grant award year (2008). For size, the log of total assets is used in the regression models. Logging variables has been demonstrated in existing research to help reduce heteroskedasticity (Tinkelman & Neely, 2011).
The second group of independent variables include three financial measures used in existing research on donation decisions, which is, the amount an organization spends on fundraising, management expenses, and program expenses (Greenlee & Trussel, 2000; Okten & Weisbrod, 2000; Parsons, 2007; Tuckman & Chang, 1991; Weisbrod & Dominguez, 1986). I never include all three expense variables in one regression because they typically represent the totality of expenses for an organization, creating significant problems with multicollinearity. Instead, in one regression model program and fundraising expenses are included, whereas in the second model program and administrative expenses are included. Because detailed expense amounts are included in the final regression models the results only include those community and traditional board grantees that file a 990, removing grassroots organizations from the final models.
To control for the different types of nonprofits in the sample, a variable for a nonprofit’s subsector is included. The National Taxonomy of Exempt Entities (NTEE) major subsector five-category listing (human services, arts, culture and humanities, health, education, and other) is used to operationalize this variable and the reference group is “other,” which includes environment, international, mutual benefit, religious, public and societal benefit, and unknown nonprofits.
Results
Looking at the organizational characteristics (Table 3) of community and traditional board grantees, community board grantees tend to be younger, with an average age of 14 years, than traditional board grantees, which are on average 21 years old. In addition, the first hypothesis is supported—a much higher percentage of community board grantees are grassroots (58% either do not file a 990 or file a 990 EZ) compared with just 5% of traditional board grantees. The second hypothesis is also supported, as t tests demonstrate that a larger percentage of traditional board grantees (43% as compared with 34%) received funding in a previous year, significant at the .05 level.
Organizational Descriptives of Community and Traditional Board Grantees.
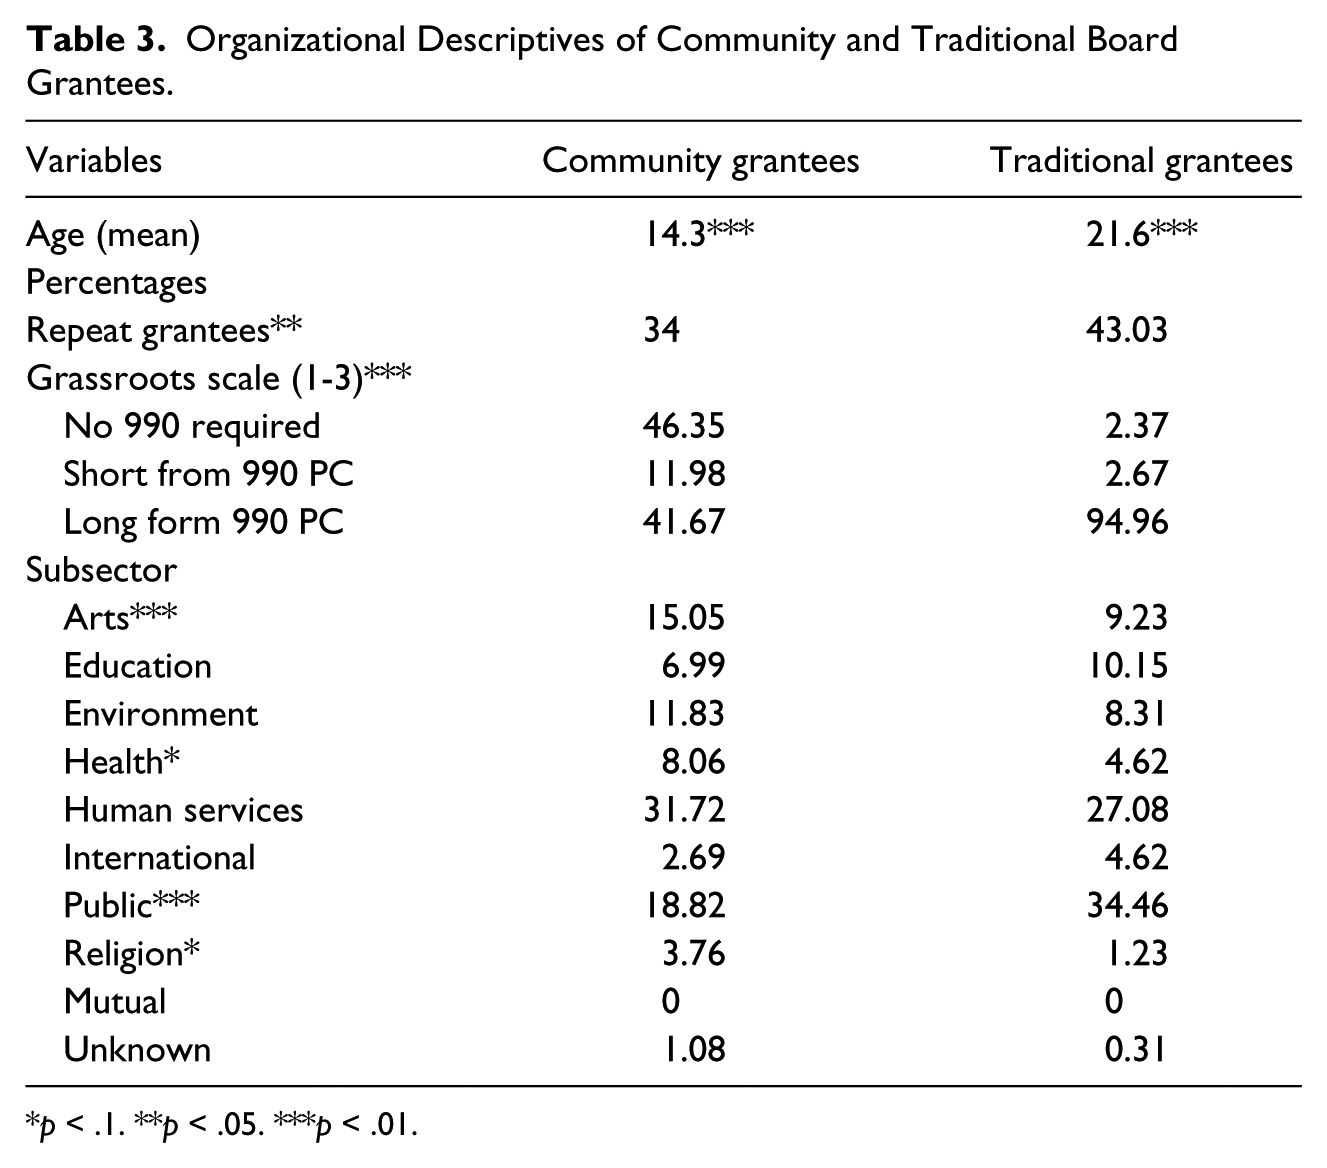
p < .1. **p < .05. ***p < .01.
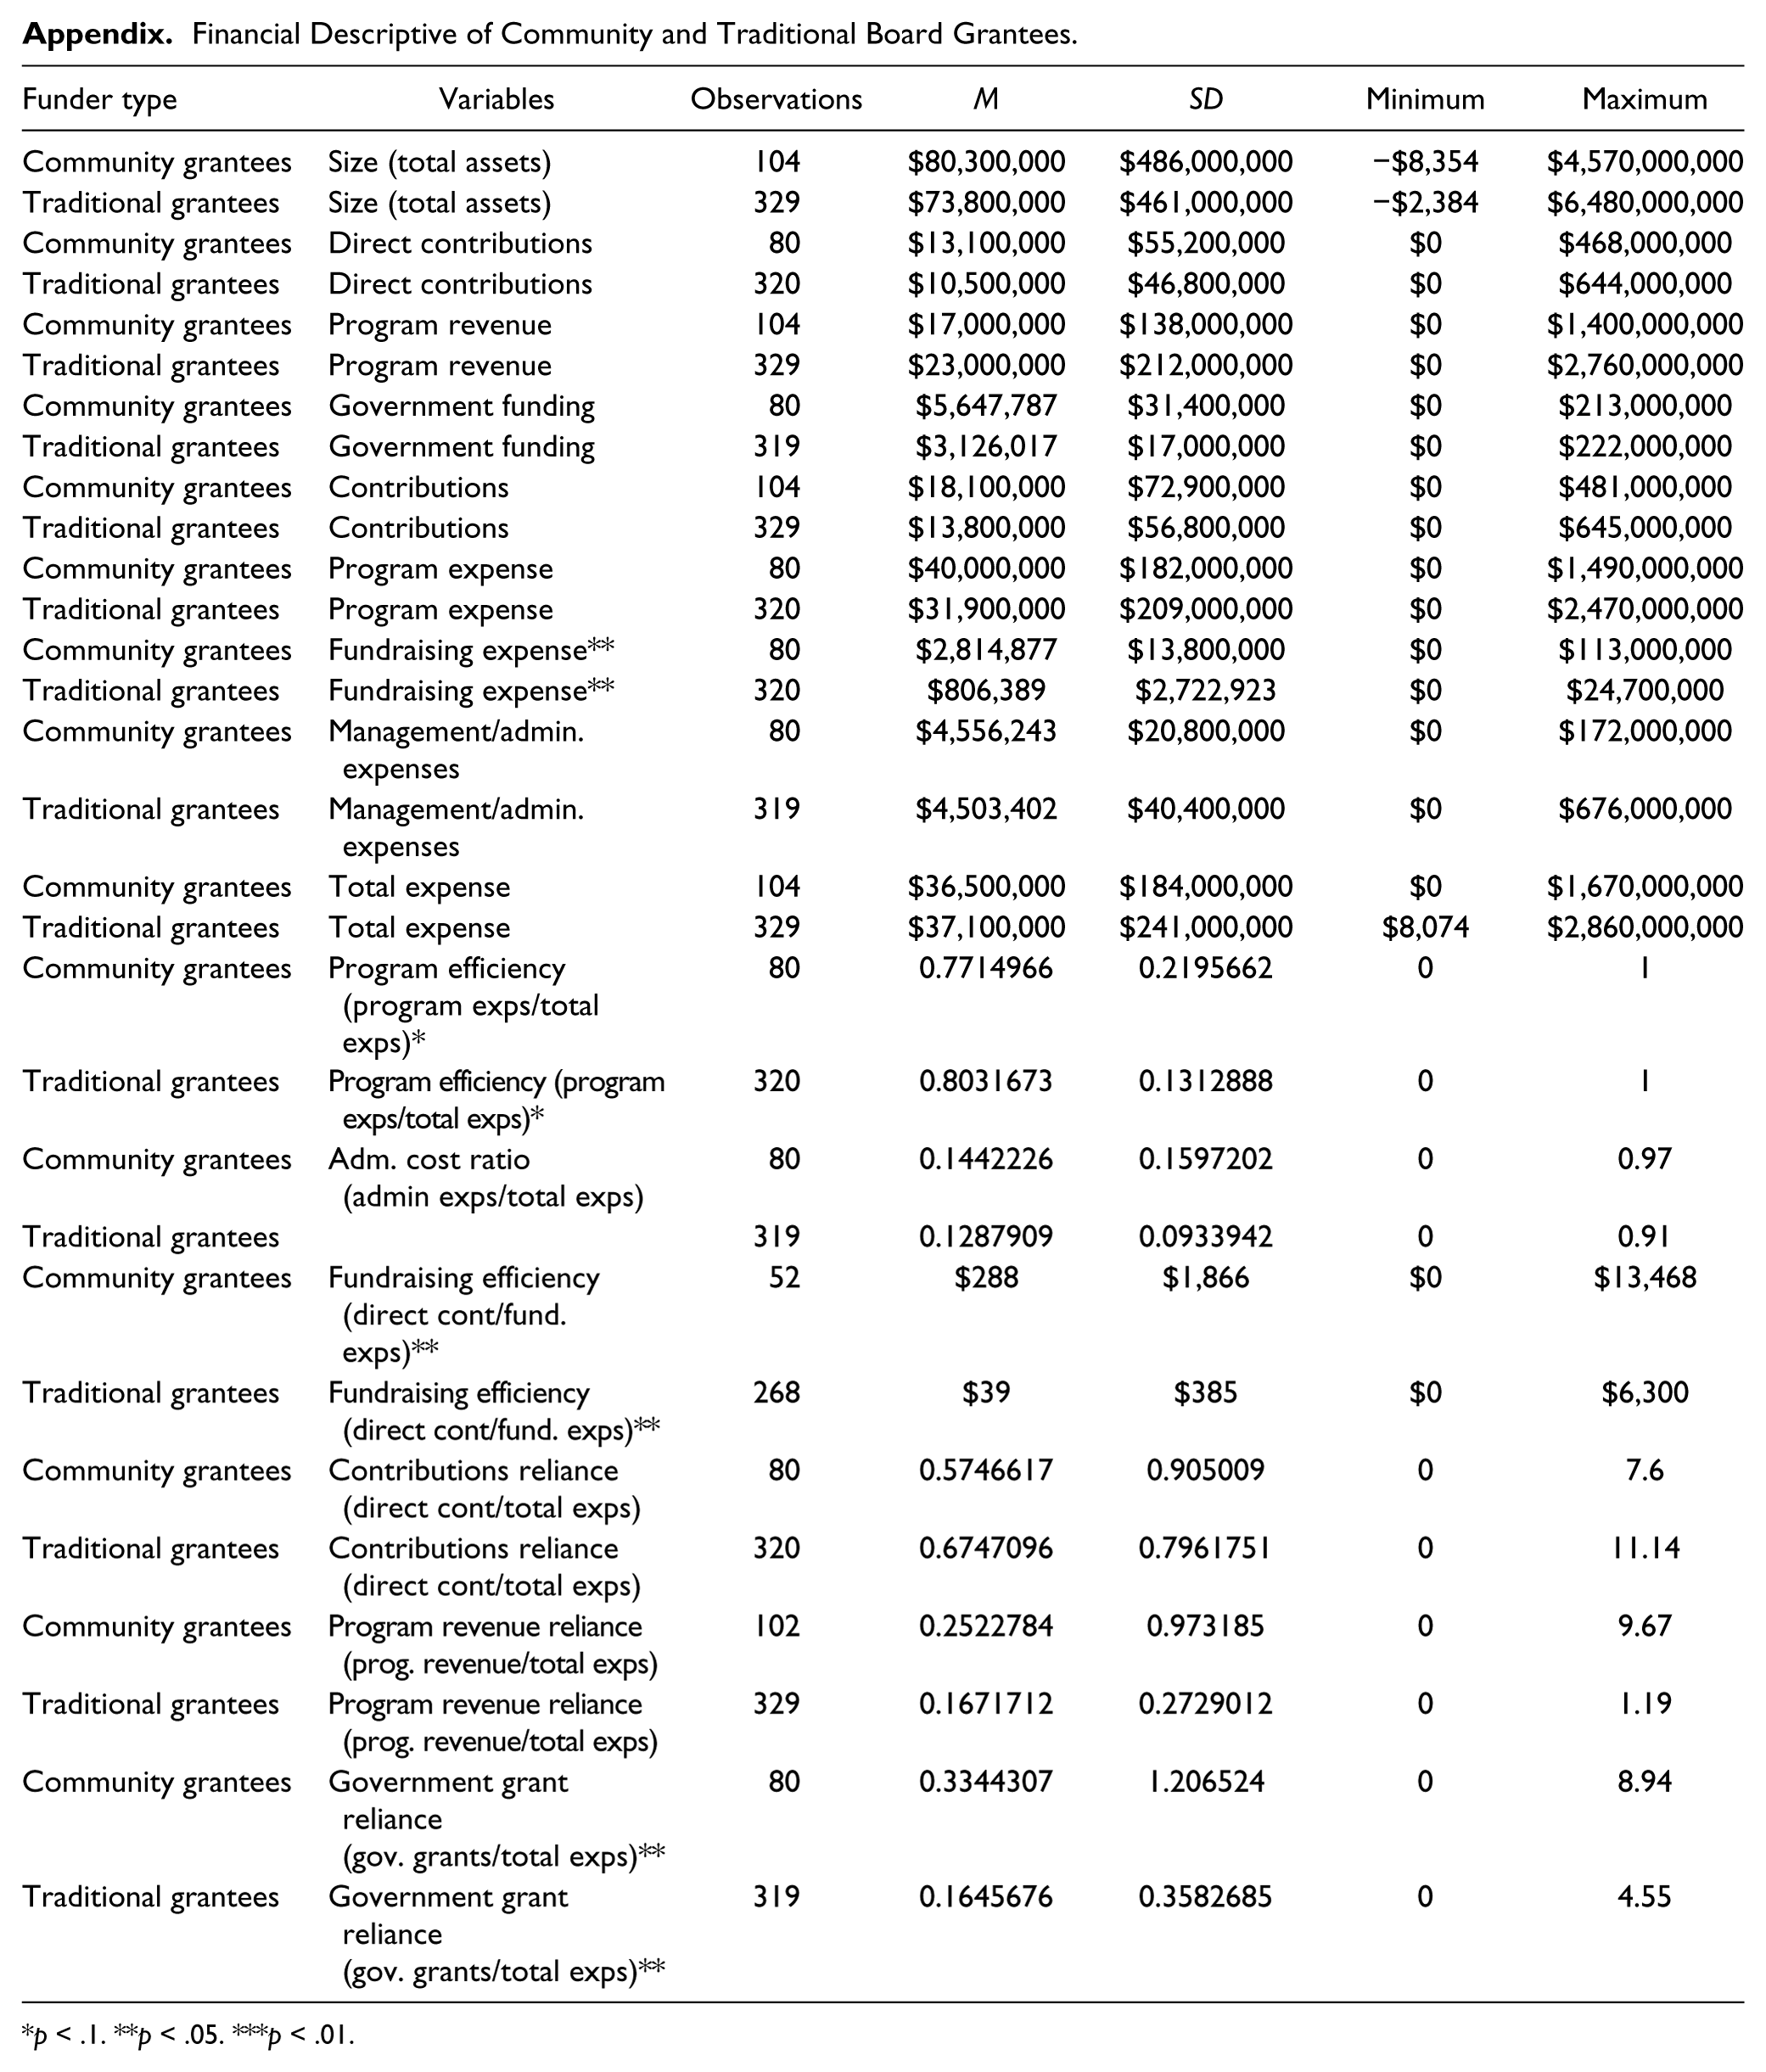
Community board grantees spend more on fundraising (on average $2.8 million) than traditional board grantees (on average $800,000). Community board grantees are also more efficient with their fundraising, raising $288 in direct contributions for every dollar they spend on fundraising. However, traditional board grantees only raise $39 for every dollar they spend on fundraising. Although traditional board grantees spend 80% of their total expenses on programs and community board grantees spend 77% of their total expenses on programs, this difference is not statistically significant. Finally, community board grantees are much more reliant on government grants as a percentage of their total expenses than traditional board grantees. Government grants, on average, comprise 33% of community board grantees expenses and only 16% of traditional board grantees expenses. Complete descriptive statistics are available in the appendix and these results are further explored in regression analysis.
Tables 4 and 5 include the results from multinomial logistic regression analyses. Results from regression analyses are only comparing those organizations that are professional (nonprofits that complete a 990) as they are the only organizations whose 990 forms include detailed financial information. 11
Multinomial Logistic Regression Models (With Fundraising Expenses).
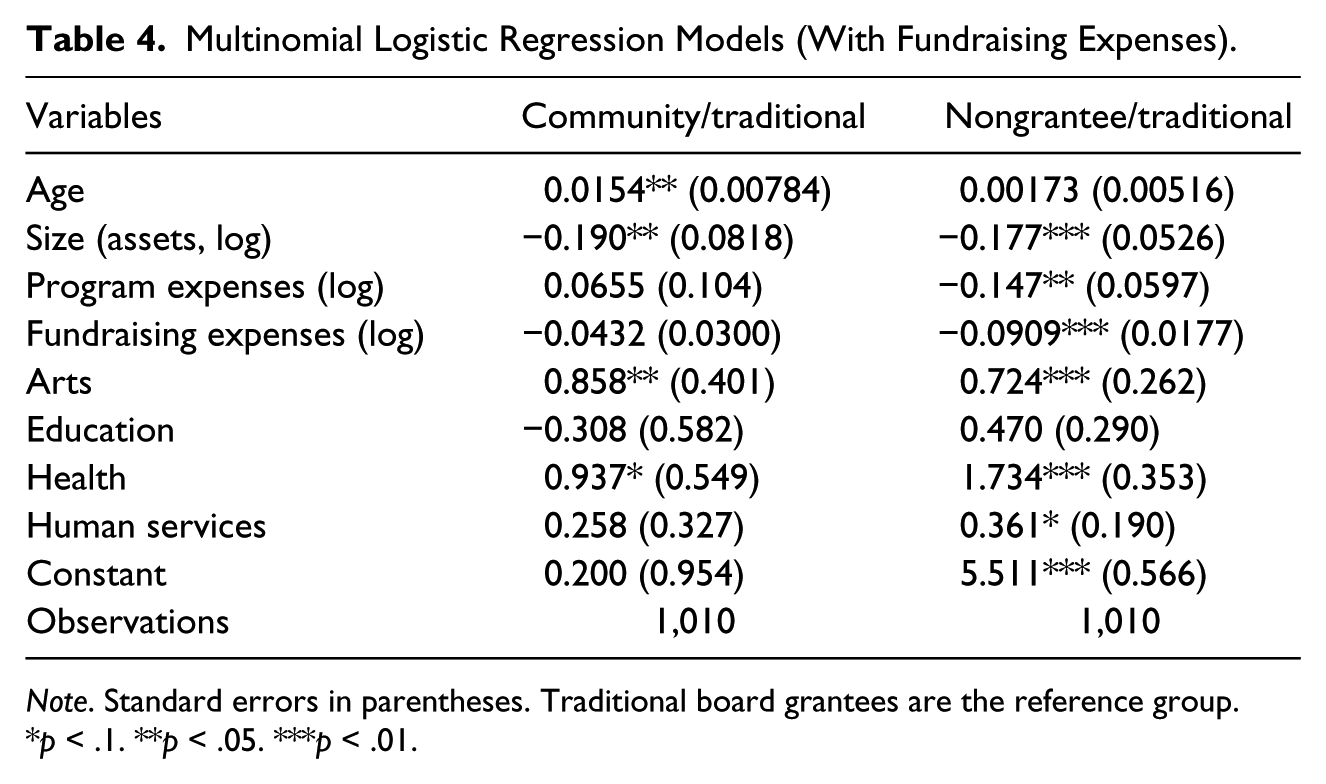
Note. Standard errors in parentheses. Traditional board grantees are the reference group.
p < .1. **p < .05. ***p < .01.
Multinomial Logistic Regression Models (With Management Expenses).
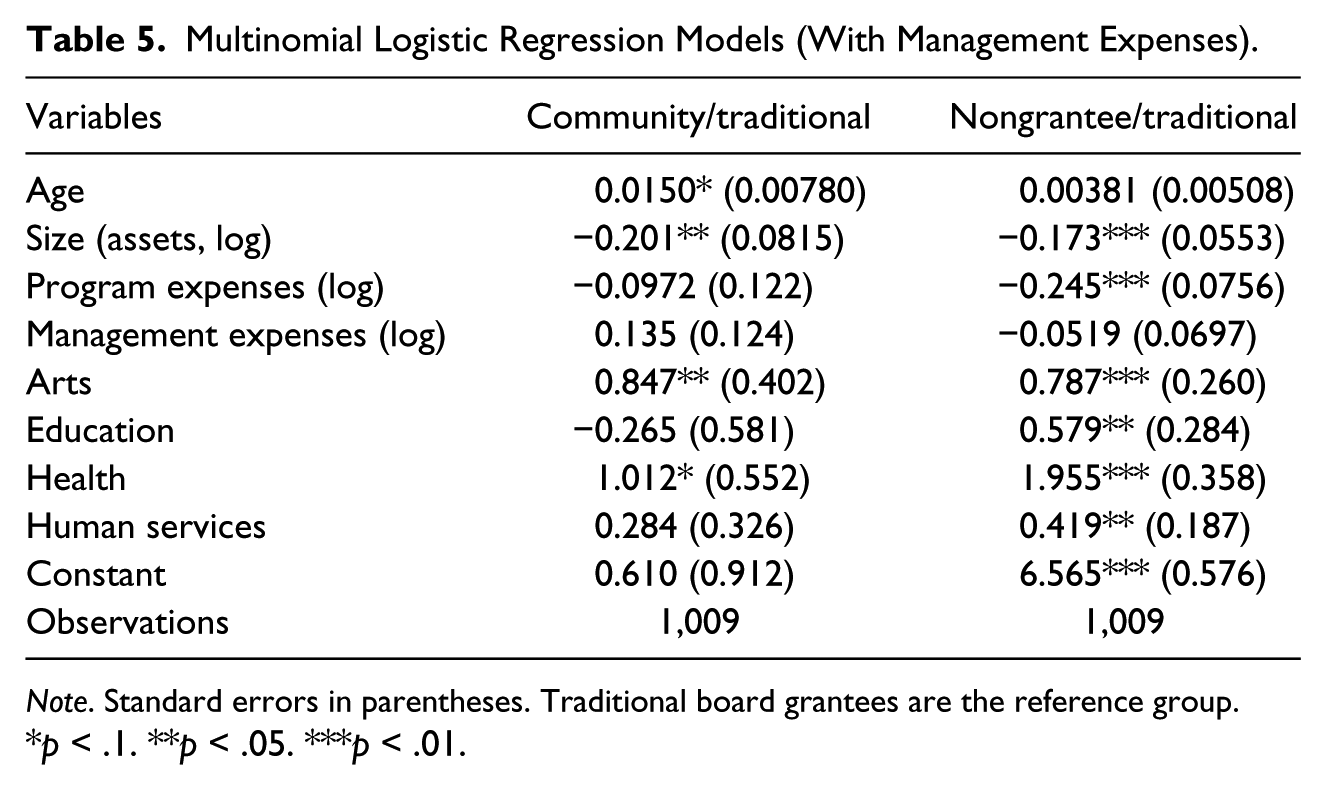
Note. Standard errors in parentheses. Traditional board grantees are the reference group.
p < .1. **p < .05. ***p < .01.
Hypothesis 3 is not supported. Although descriptive statistics indicate that community board grantees are younger than traditional board grantees, regression results indicate that community board members demonstrate different preferences when they are evaluating professional nonprofits. Across both models community board grantees are older than traditional board grantees (although results in Table 5 are weakly significant at the .10 level and should be interpreted with caution). However, Hypothesis 4 is supported. Consistent across both models community board grantees are selecting nonprofits that are smaller than traditional board grantees, even when they are evaluating professional nonprofits.
Based on current anecdotes, Hypotheses 5 to 7 predicted nonprofits with more varied financial conditions would be selected by community boards. Yet, none of these hypotheses are supported. I find instead that there are no statistically significant differences between the fundraising, management or program expenses of community and traditional board grantees. As descriptive statistics indicate that community board grantees spend much more on fundraising than traditional board grantees and are also more efficient fundraisers than traditional board grantees, this finding needs additional exploration.
Finally, it is interesting to note the differences in nongrantees and traditional board grantees. Across both models nongrantees are smaller and spend less on program expenses. Nongrantees also spend less on fundraising expenses (proxies for the amount a nonprofit spends on marketing and advertising). These results confirm concerns in existing literature that certain nonprofits are inherently disadvantaged in the grants process.
Discussion
This study tests the assumption in literature that community and traditional boards make different grant decisions. Do community and traditional boards reward different nonprofit characteristics as theories of decision making among group members with weak ties would indicate? There is some support for the differences in grantee selection that occur when community members are involved in the grants process. Descriptive statistics reveal that community boards are more likely to choose less professionalized nonprofits and nonprofits that were not funded in a previous year.
Using regression analysis, I compare the organizational and financial determinants of professional nonprofits that are awarded grants by community and traditional boards. These findings reveal that when boards evaluate a professional nonprofit, community and traditional boards demonstrate similar grant making behaviors. In fact, some of the findings are completely contrary to the normative predictions of what occurs when community input is used in the grant selection process. For example, older organizations are more likely to receive a grant from a community board than a traditional board. It seems that community boards are more likely to rely on age as an indicator of quality.
Although this finding is contrary to expectations based on anecdotes in literature and previous research on contributions, recent research findings about the relationship between age and institutional funding inform scholars that we have more to learn about nonprofit age and donation decisions. In Suarez (2011) and Garrow’s (2011) studies of the determinants of government funders, both find no statistically significant relationship between age and receipt of government funds. Tinkelman’s (1998) study found a negative relationship between age and contributions. He hypothesizes that age may not proxy quality and instead represents the trendiness of an organization’s cause. Following this reasoning, the findings in this paper reveal that community boards are more likely to award grants to a nonprofit that is embedded in the community, regardless of the issue’s trendiness or current relevance. Surprisingly, this is a contrasting perspective to the hypothesized ideals of community boards’ influence on grantee selection, which are thought to yield grants that match community needs more than traditional boards. Perhaps, the finding on age indicates that there are some negative implications of involving community members who incorporate their own localized preferences and experiences about nonprofits into the grants process.
However, across both models, smaller nonprofits were more likely to receive a grant from a community board. In existing literature, donors are thought to view a nonprofits size as a proxy for its reputation or the amount of services an organization can provide in the community. Yet, community boards are rewarding nonprofits with fewer assets. Perhaps community members, who live and work in the communities where they are making grant decisions, prefer nonprofits that are highly specialized, serving a particular population within their communities, as opposed to larger organizations with a greater service area. Further research is needed to explore these findings in detail.
Finally, a number of watch dog organizations have focused on nonprofits presenting appropriate financial indicators and expenses to attract individual donors. Yet, it is clear that nonprofits applying for grants should also take heed of these warnings. Nonprofits with fewer program and fundraising expenses are not only unlikely to receive a grant from a traditional board but also less likely to receive a grant from a community board (because the coefficients comparing nonprofit financial characteristics and grant decisions of community and traditional boards are not statistically different). These results indicate that all grantmakers take financial indicators of efficiency seriously.
The findings in this paper also demonstrate that researchers studying grantmaking cannot rely solely on empirical results from models of the determinants of contributions to predict receipt of grants. There are differences not only between the way a nonprofits organizational and financial characteristics are used by individuals and the way they are used by grantmakers, but also how it varies according to the composition of a foundations board. This suggests that philanthropic institutions are unique in their approach to giving (Ashley & Faulk, 2010; McGinnis & Ashley, 2011). It also demonstrates that the composition of philanthropic boards has some impact on grantee selection, although less than what is purported in anecdotal literature.
Conclusion
Although foundation giving has rapidly outpaced all other forms of philanthropic gifts in the last 40 years, scholars and practitioners know very little about the grant making behaviors of private foundations (Rooney, 2007). The data collection required to empirically investigate which nonprofits are selected by funders is often too much for scholars to undertake, and foundations and their grant decisions are consequently described as a black box. In 1990, Odendahl wrote, “except for this study and a few others, we have almost no idea of what happens to the funds the elite disperse as part of their philanthropic activities. There is little critical research on the operation of foundations” (p. 241). In the 23 years since that study was written, there have been limited empirical tests of the assumptions that are debated about how grant making is done and who benefits from grant making decisions. Furthermore, with recent evaluations of unsuccessful investments of philanthropic dollars conducted by several high profile foundations, many question why philanthropy does not alleviate social issues (Bourns, 2010; Lenkowsky, 2012, 2012).
Some argue that one of the reasons grantmakers have not been successful is because decision makers are not privy to nonprofit and community needs. A 2007 evaluation of the 10-year $20 million Neighborhood Improvement Initiative of the William and Flora Hewlett Foundation found that the absence of stakeholder involvement created a lack of trust within the community, which had a direct impact on the ability of the Hewlett Foundation to achieve its goals (Bourns, 2010). It is thought that community input during the grant selection process would reduce the myriad of problems associated with grant making. Implicit in this assumption is the idea that community members would be more open to funding nonprofits that are not typical grant recipients, expanding the range of beneficiaries who receive support from philanthropists as well as the effectiveness and efficiency of those funds.
This paper makes important theoretical and empirical contributions to the normative assumptions regarding the impact of philanthropic board composition on grant making selection. I advance theory by bringing together multiple theoretical perspectives and find evidence that the composition of philanthropic boards does impact grantee selection, although not as significantly as anecdotal literature purports. This paper also develops a unique dataset to quantitatively test the hypotheses. Analysis reveals that many more nonprofits are allowed first time entry into the grants marketplace by community boards. However, when community boards evaluate professional nonprofit applicants, community and traditional boards are making fairly similar decisions.
Related to this, there has been a growing discussion on the democratization of philanthropy, or what is sometimes called new philanthropy, where donors who have not traditionally been involved in philanthropic decisions come together to give and volunteer in new ways (Chang, 2013; Cobb, 2002; Eikenberry, 2006, 2009). Although there has been some focus on the impact of bottom–up (or citizen led) approaches within new philanthropy on grantee selection (e.g. Eikenberry’s (2009) extensive work on giving circles and Lenkowsky’s 2002, 2012 chapters on the growth of donor advised funds), there have been fewer investigations of top–down approaches to new philanthropy, and the impact of philanthropic organizations structuring citizen involvement, on grantee selection. The initial findings in this paper indicate that community and traditional boards grant making decisions are more similar than they are different, which calls into question whether or not top–down approaches to public participation can ever produce the idealized goals of more effective decision making. Furthermore, these findings question whether or not participatory philanthropy is the appropriate tool to change the grant distribution patterns of foundations.
However, the results of this study have broader impacts than testing the effects of information use by differently structured boards. Implicit in all of the practitioner reports describing stakeholder engagement as a panacea are suggestions that foundations should not just engage stakeholders but should focus on creating groups of decision makers who are racially and ethnically diverse. In the policy arena, several states (e.g., California A.B. 624, Florida Senate Bill 998) have considered or implemented new regulations surrounding issues of diversity and reporting requirements for foundations.
During 2008, California’s Assembly Bill 624 was proposed. It would have required foundations to report demographic statistics of their board and staffs, as well as their grantees boards and staff. Although this bill did not pass, the idea that the demographic composition of foundation board members affects selection of grantees continues to pervade practice. Michigan, Minnesota, New York, and the D5 Coalition (a collaborative group of foundation leaders funded by The Rockefeller Philanthropy Advisors group) have invested significant resources to lead initiatives around this very concept. Yet introducing legislation on this topic is premature.
Management research suggests that the relationship between descriptive representation and administrative decisions is very complicated (Bradshaw, Murray, & Wolpin, 1996; Brown, 2002; Zald, 1967, 1969). Furthermore, several public participation studies indicate that community involvement only matters as much as the efforts of managers to effectively structure and design public participation programs (Abelson & Gauvin, 2006; Thomas, 2012). The design of a public participation program is consistently found to moderate the relationship between community input and changes to administrative decisions (Ebdon & Franklin 2006; Franklin & Ebdon, 2005). Therefore, policy prescriptions are incomplete because future research needs to identify the specific mechanisms and structures where board composition yields the differences in grantee selection that are presumed in literature.
Practitioners across all sectors can also glean from this work that the creation of public involvement programs is only the first step in addressing local needs. Future research in philanthropy can provide a more nuanced understanding of the components of a public participation programs design that either enables or constrains the voices of its citizens. Although there is little influence scholarship can have on the organizational resources dedicated to designing participation programs in the public and nonprofit sectors, continued research in this arena can provide insight into the design of participatory programs that best allow citizen voices to be heard.
Footnotes
Appendix
Financial Descriptive of Community and Traditional Board Grantees.
| Funder type | Variables | Observations | M | SD | Minimum | Maximum |
|---|---|---|---|---|---|---|
| Community grantees | Size (total assets) | 104 | $80,300,000 | $486,000,000 | −$8,354 | $4,570,000,000 |
| Traditional grantees | Size (total assets) | 329 | $73,800,000 | $461,000,000 | −$2,384 | $6,480,000,000 |
| Community grantees | Direct contributions | 80 | $13,100,000 | $55,200,000 | $0 | $468,000,000 |
| Traditional grantees | Direct contributions | 320 | $10,500,000 | $46,800,000 | $0 | $644,000,000 |
| Community grantees | Program revenue | 104 | $17,000,000 | $138,000,000 | $0 | $1,400,000,000 |
| Traditional grantees | Program revenue | 329 | $23,000,000 | $212,000,000 | $0 | $2,760,000,000 |
| Community grantees | Government funding | 80 | $5,647,787 | $31,400,000 | $0 | $213,000,000 |
| Traditional grantees | Government funding | 319 | $3,126,017 | $17,000,000 | $0 | $222,000,000 |
| Community grantees | Contributions | 104 | $18,100,000 | $72,900,000 | $0 | $481,000,000 |
| Traditional grantees | Contributions | 329 | $13,800,000 | $56,800,000 | $0 | $645,000,000 |
| Community grantees | Program expense | 80 | $40,000,000 | $182,000,000 | $0 | $1,490,000,000 |
| Traditional grantees | Program expense | 320 | $31,900,000 | $209,000,000 | $0 | $2,470,000,000 |
| Community grantees | Fundraising expense** | 80 | $2,814,877 | $13,800,000 | $0 | $113,000,000 |
| Traditional grantees | Fundraising expense** | 320 | $806,389 | $2,722,923 | $0 | $24,700,000 |
| Community grantees | Management/admin. expenses | 80 | $4,556,243 | $20,800,000 | $0 | $172,000,000 |
| Traditional grantees | Management/admin. expenses | 319 | $4,503,402 | $40,400,000 | $0 | $676,000,000 |
| Community grantees | Total expense | 104 | $36,500,000 | $184,000,000 | $0 | $1,670,000,000 |
| Traditional grantees | Total expense | 329 | $37,100,000 | $241,000,000 | $8,074 | $2,860,000,000 |
| Community grantees | Program efficiency (program exps/total exps)* | 80 | 0.7714966 | 0.2195662 | 0 | 1 |
| Traditional grantees | Program efficiency (program exps/total exps)* | 320 | 0.8031673 | 0.1312888 | 0 | 1 |
| Community grantees | Adm. cost ratio (admin exps/total exps) | 80 | 0.1442226 | 0.1597202 | 0 | 0.97 |
| Traditional grantees | 319 | 0.1287909 | 0.0933942 | 0 | 0.91 | |
| Community grantees | Fundraising efficiency (direct cont/fund. exps)** | 52 | $288 | $1,866 | $0 | $13,468 |
| Traditional grantees | Fundraising efficiency (direct cont/fund. exps)** | 268 | $39 | $385 | $0 | $6,300 |
| Community grantees | Contributions reliance (direct cont/total exps) | 80 | 0.5746617 | 0.905009 | 0 | 7.6 |
| Traditional grantees | Contributions reliance (direct cont/total exps) | 320 | 0.6747096 | 0.7961751 | 0 | 11.14 |
| Community grantees | Program revenue reliance (prog. revenue/total exps) | 102 | 0.2522784 | 0.973185 | 0 | 9.67 |
| Traditional grantees | Program revenue reliance (prog. revenue/total exps) | 329 | 0.1671712 | 0.2729012 | 0 | 1.19 |
| Community grantees | Government grant reliance (gov. grants/total exps)** | 80 | 0.3344307 | 1.206524 | 0 | 8.94 |
| Traditional grantees | Government grant reliance (gov. grants/total exps)** | 319 | 0.1645676 | 0.3582685 | 0 | 4.55 |
p < .1. **p < .05. ***p < .01.
Declaration of Conflicting Interests
The author(s) declared no potential conflicts of interest with respect to the research, authorship, and/or publication of this article.
Funding
The author(s) received no financial support for the research, authorship, and/or publication of this article.